
 Open Access Article
 This Open Access Article is licensed under a Creative Commons Attribution-Non Commercial 3.0 Unported Licence
SynCat: molecule-level attention graph neural network for precise reaction classification
Phuoc-Chung
Van Nguyen
 a,
Van-Thinh
To
a,
Ngoc-Vi
Nguyen Tran
b,
Tieu-Long
Phan
*cd,
Tuyen Ngoc
Truong
a,
Thomas
Gärtner
e,
Daniel
Merkle
fd and
Peter F.
Stadler
bcghij
a,
Van-Thinh
To
a,
Ngoc-Vi
Nguyen Tran
b,
Tieu-Long
Phan
*cd,
Tuyen Ngoc
Truong
a,
Thomas
Gärtner
e,
Daniel
Merkle
fd and
Peter F.
Stadler
bcghij
aSchool of Pharmacy, University of Medicine and Pharmacy at Ho Chi Minh City, Dinh Tien Hoang, Ho Chi Minh City, Vietnam
bCenter for Non-coding RNA in Technology and Health, University of Copenhagen, Ridebanevej 9, Frederiksberg, DK-1870, Denmark
cBioinformatics Group, Department of Computer Science & Interdisciplinary Center for Bioinformatics & School for Embedded and Composite Artificial Intelligence (SECAI), Leipzig University, Härtelstraße 16–18, Leipzig, Germany. E-mail: tieu@bioinf.uni-leipzig.de
dDepartment of Mathematics and Computer Science, University of Southern Denmark, Odense M DK-5230, Denmark
eMachine Learning Research Unit, TU Wien Informatics, Wien M A-1040, Austria
fAlgorithmic Cheminformatics Group, Faculty of Technology, Bielefeld University, 33615 Bielefeld, Germany
gMax Planck Institute for Mathematics in the Sciences, Inselstraße 22, Leipzig, D-04103, Germany
hDepartment of Theoretical Chemistry, University of Vienna, Währingerstraße 17, Vienna, A-1090, Austria
iFacultad de Ciencias, Universidad Nacional de Colombia, Bogotá, Colombia
jSanta Fe Institute, 1399 Hyde Park Rd., Santa Fe, NM 87501, USA
First published on 6th November 2025
Abstract
Chemical reactions typically follow mechanistic templates and hence fall into a manageable number of clearly distinguishable classes that are usually labeled by names of chemists who discovered or explored them. These “named reactions” form the core of reaction ontologies and are associated with specific synthetic procedures. Classification of chemical reactions, therefore, is an essential step for the construction and maintenance of reaction-template databases, in particular for the purpose of synthetic route planning. Large-scale reaction databases, however, typically do not annotate named reactions systematically. Although many methods have been proposed, most are sensitive to reagent variations and do not guarantee permutation invariance. Here, we propose SynCat, a graph-based framework that leverages molecule-level cross-attention to perform precise reagent detection and role assignment, eliminating unwanted species. SynCat ensures permutation invariance by employing a pairwise summation of participant embeddings. This method balances mechanistic specificity derived from individual-molecule embeddings with the order-independent nature of the pairwise representation. Across multiple benchmark datasets, SynCat outperformed established reaction fingerprints, DRFP and RXNFP, achieving a mean classification accuracy of 0.988, together with enhanced scalability.
1 Introduction
Efficient computational design of synthesis routes promises accelerated development of novel chemical entities in comparison to conventional trial-and-error approaches that are often time-consuming and costly.1 Computer-Aided Synthesis Planning (CASP) addresses these challenges by automating retrosynthetic analysis, forward reaction prediction, and condition recommendations.2,3 In parallel, reaction modeling elucidates the underlying mechanisms through simulations of thermodynamic and kinetic properties of reaction pathways. All of these tasks require accurate and robust patterns that describe the different types of reactions. Chemical reactions are distinguished by reaction patterns,4,5 which comprise specific bond changes at the reaction core, the nature of the substrates as defined by their functional groups, and the ambient reaction conditions (e.g., solvent, pH, temperature). These explicit bond-making and bond-breaking events can be abstracted into the so-called Imaginary Transition State (ITS) graphs,6,7 a formalism that provides the cornerstone for Hendrickson's comprehensive reaction classification.8 Named reactions, thus, are largely determined in graph-theoretical terms.The key information in the ITS graphs is the correspondence between the atoms of the reactant and product molecules. Consequently, a close connection exists between reaction classification and the problem of inferring atom-to-atom maps (AAMs).9 For a given named reaction, the known structure of its reaction center greatly simplifies the inference of the corresponding AAM. Conversely, a known AAM defines the reaction center and, therefore, imposes strong constraints on the possible reaction classes. The inherent coupling between AAM and reaction pattern (classification) creates a significant bottleneck for computational chemistry, since most large-scale datasets are not annotated with either reliable AAMs or a systematic mechanistic taxonomy. This bottleneck derives from two interconnected issues. First, the algorithmic assignment of AAMs faces an NP-hard combinatorial explosion, particularly for reactions with incomplete stoichiometries, which can lead to erroneous bond transformation.10,11 In addition, the chemically correct AAM is not always the solution of well-defined combinatorial optimization problem such as the minimization of chemical distance.12 Second, the underlying data upon which these algorithms operate is itself unreliable; expert curation is frequently incomplete or noisy,10 and the limited coverage of gold-standard mappings makes the manual annotation of large-scale chemical datasets practically infeasible.9,13 From a learning perspective, the classification problem appears more tractable since the reaction mapping problem asks for a detailed, atom-wise prediction with partially correct solutions being deceptive for downstream tasks. Classification, moreover, allows for a relatively straightforward post hoc identification of likely erroneous predictions based on reaction centers and substance classes. Reaction classification is, therefore, key for the collection of high quality datasets from which reaction patterns for specific named reactions can then be extracted in a second step. Moreover, automatic reaction classification also can be employed to “sanity-check” new entries in reaction databases.
Commercial repositories such as Reaxys®14 provide extensive, large-scale compilations of reaction data. However, they do not offer an equally robust classification framework; in contrast, public reaction datasets typically rely on custom annotation schemes. Schwaller et al.15 utilized the RXNMapper tool to generate AAMs, thereby extracting reaction templates and delineating one thousand distinct reaction classes across approximately 445![[thin space (1/6-em)]](https://www.rsc.org/images/entities/char_2009.gif) 000 reactions. Conversely, Schneider et al.16 randomly sampled a subset of 50000 reactions from the USPTO database and employed the Royal Society of Chemistry's Reaction Name Ontology (RXNO)† to classify them into fifty distinct categories. Although open corpora such as USPTO and Schneider-50k have enabled reaction-class benchmarks, they remain hampered by noisy or inconsistent labels. Recent audits report that 10–25% of USPTO-derived entries are chemically unbalanced or misclassified owing to multi-step patent examples, omitted reagents, and inconsistent stoichiometry.17–19 Furthermore, rule-based schemes (e.g. NameRXN or RXNO) hinge on an unambiguous reactant–reagent split, which is ill-defined for a significant share of patent reactions, leading to systematic class ambiguity and conflation of distinct mechanisms.15 These shortcomings highlight the need for scalable, data-driven tools that can assign reliable reaction labels without manual curation.
000 reactions. Conversely, Schneider et al.16 randomly sampled a subset of 50000 reactions from the USPTO database and employed the Royal Society of Chemistry's Reaction Name Ontology (RXNO)† to classify them into fifty distinct categories. Although open corpora such as USPTO and Schneider-50k have enabled reaction-class benchmarks, they remain hampered by noisy or inconsistent labels. Recent audits report that 10–25% of USPTO-derived entries are chemically unbalanced or misclassified owing to multi-step patent examples, omitted reagents, and inconsistent stoichiometry.17–19 Furthermore, rule-based schemes (e.g. NameRXN or RXNO) hinge on an unambiguous reactant–reagent split, which is ill-defined for a significant share of patent reactions, leading to systematic class ambiguity and conflation of distinct mechanisms.15 These shortcomings highlight the need for scalable, data-driven tools that can assign reliable reaction labels without manual curation.
Automated reaction classification addresses this challenge directly by assigning a mechanistic archetype to a given chemical transformation.20–22 Methodologically, this field has diverged into two principal strategies. The first involves structured chemical taxonomies, such as the hierarchical Royal Society of Chemistry (RSC) Reaction Ontology, which organizes reactions top-down from broad parent classes (e.g., substitution) to specific subclasses describing nuanced stereoelectronic features.23 The second, contrasting strategy is graph-based, focusing on elucidating the explicit bond rearrangements at the reaction core. This approach, pioneered in foundational work by Hendrickson and in frameworks such as minimum reaction concept,7,8,24 is critically dependent on an accurate AAM. Modern incarnations such as SynTemp25 build on this foundation, using hierarchical clustering to organize extracted reaction templates for downstream applications, such as generating Double Pushout rewriting rules for the MØD framework.26,27 Despite their precision, the reliance of these graph-based methods on AAMs creates a substantial computational bottleneck, constraining both prediction throughput and large-scale applicability.
Machine learning-based strategies have significantly accelerated reaction classification by projecting chemical transformations into rich, high-dimensional feature vectors representing the reaction centers. Contemporary embeddings are typically derived from engineered reaction fingerprints16,28 or from attention weights grounded in atom-to-atom mappings.15,29 Schneider et al.,16 for example, showed that simple reactant-to-product difference vectors could already recover 48 of 50 reaction classes. Despite these successes, two principal obstacles remain for accurate and efficient reaction classification. First, differentiating reagents from reactants is vital to prevent feature redundancy. Schwaller et al. addressed this by introducing the transformer-based reaction fingerprint RXNFP, derived from RXNMapper,15 which utilizes self-attention to weigh compound contributions and demonstrates high accuracy on the Pistachio database.15,30 Alternatively, Probst et al.28 developed the Differential Reaction Fingerprint (DRFP), which identifies molecular substructures changed from reaction SMILES to inherently distinguish reagents and eliminate the need for atom-mapping. Second, defining a canonical representation for reaction components presents a critical trade-off: while necessary for a consistent input vector, it sacrifices the flexibility to model transformations with variable stoichiometries or intricate reagent patterns.28
To overcome both limitations, we introduce SynCat, a graph-based architecture that combines a Graph Isomorphism Network with edge features31 with a molecule-level cross-attention module and a permutation-invariant pairwise-sum pooling scheme. By assigning attention weights to entire molecular graphs, rather than to individual atoms, SynCat preserves global chemical context while reducing training complexity in comparison to atom-centric models such as RXNMapper. Crucially, its hybrid embedding strategy dynamically accommodates any number and arrangement of reaction participants. This inherent flexibility allows for the seamless classification of transformations with arbitrary stoichiometries.
2 Methods
2.1 Preliminaries
Data-driven reaction classification is commonly organized in two stages: (i) an encoding step, in which each raw reaction record is transformed into a fixed length vector (the reaction embedding); and (ii) a learning step, in which a discriminative model maps the embedding to a discrete reaction class. Let be a collection of n curated reactions and
  the finite set of K reaction classes. Each reaction
  is annotated with its ground-truth label
  , where i ∈ {1, 2, …, n}.
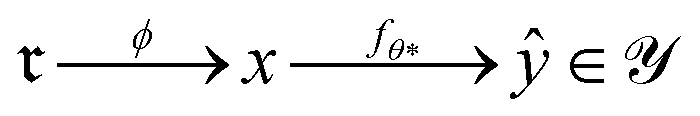
Because raw reactions (e.g., based on SMILES strings or atom-mapped graphs) are not directly amenable to standard learning algorithms, we introduce an encoder
 into a d-dimensional feature space. A parametric classifier
with
 denoting the (K − 1)-simplex, assigns to every embedding xi a probability vector pθ(·∣xi) = fθ(xi). Given the training set
  the parameters θ are learned by minimizing the empirical cross-entropy.
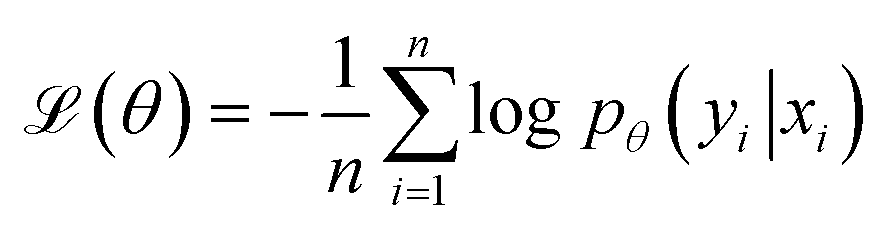 | (1) |
The optimizer yields θ*, and the composite map
2.2 Computational resources and data
All training and evaluation procedures were conducted using Python 3.11 on a system equipped with an Intel®Core™ i7-14700K CPU operating at 3.40 GHz with 24 cores, 128 GB of RAM, and two NVIDIA RTX 4090 GPUs, each with 24 GB of VRAM. The system ran on Ubuntu 22.04 LTS.We performed reaction classification on three primary datasets using their established class definitions: USPTO_TPL 1000 classes,15 annotated using RXNMapper29 to produce atom-mapped reactions and extract SMARTS templates for exact matching, Schneider (50 classes,16 annotated using the RSC RXN Ontology), and USPTO_50K (10 classes,32 annotated by manual curation). In addition, a separate set of labels was generated for the USPTO_50K dataset via the SynTemp25 procedure. This procedure involves an isomorphism check on the reaction center, followed by an expansion of the reaction core up to a radius of two bonds. In addition to the nine datasets described above, we incorporate five supplementary corpora to assess cross-domain robustness of SynCat. Three of these derive from the ECREACT dataset,33 an enzymatic reaction collection that Zeng et al.34 augmented to train the CLAIRE model. These data are structured into a three-level hierarchy based on the IUBMB Enzyme Nomenclature,35 with each successive level representing a finer degree of mechanistic specificity.34 The remaining two are subsets of USPTO_50K32 annotated with mechanistic subdivisions inferred by MechFinder.36 For these datasets the first level preserves the original USPTO_50K classes and the second provides finer mechanistic categories. Table 1 summarizes each corpus and its annotation procedure. All datasets were partitioned via stratified random sampling to preserve class priors. Detailed splitting configurations are provided in Table S1, and label distributions are shown in Fig. S1.
| No. reactions | No. classes | Annotator type | |
|---|---|---|---|
| a Only Schneider has a balanced class distribution (Fig. S1). | |||
| Schneider16a | 50000 |
50 | RSC-ontology |
| USPTO_50k32 | 50016 |
10 | Hand-crafted |
| USPTO_TPL15 | 445115 |
1000 | SMARTS-match |
| R0 | 43441 |
143 | SynTemp25 |
| R1 | 43441 |
356 | SynTemp |
| R2 | 43441 |
680 | SynTemp |
| ECREACT_1st | 185734 |
7 | IUBMB35 |
| ECREACT_2nd | 185734 |
63 | IUBMB |
| ECREACT_3rd | 185734 |
175 | IUBMB |
| Mech_31k_1st | 31673 |
9 | Hand-crafted |
| Mech_31k_2nd | 31673 |
63 | MechFinder36 |
2.3 SynCat architecture
where τ is the atom type, q the formal charge, d the degree, hyb the hybridization, nH the implicit hydrogen count, val the valence, DA the donor/acceptor flag, χ the chirality, rs the ring size, and aro the aromaticity (see Table S2). Accordingly, the integer-valued entries of vi — formal charge q, degree d, implicit hydrogen count nH, and valence val—are one-hot encoded into compact bins, with the zero (reference) level omitted to avoid redundancy. Infrequent/extreme values are merged into upper/lower bins: q ∈ {≤−2, −1, +1, ≥ +2} (4 bins), d ∈ {1, 2, 3, 4, 5, ≥ 6} (6 bins), nH ∈ {1, 2, 3, ≥ 4} (4 bins), val ∈ {1, 2, 3, 4, 5, ≥ 6} (6 bins). This binning reduces sparsity and parameter count while preserving chemically meaningful distinctions for classification.

Each bond  is associated with a bond-feature vector38
We then aggregated the individual molecular embeddings into a single reaction level vector, explicitly weighting features at the reaction center to ensure the model focuses on the bonds and atoms undergoing transformation. Formally, one may construct an Imaginary Transition State (ITS), denoted as ϒ, which provides a graph-theoretical model of the reaction transformation.6,7 The reaction center is then defined as the minimal vertex-induced subgraph Γ ⊆ ϒ that contains all bond-formation and bond-cleavage events. Although extracting the reaction center Γ and encoding it directly can yield an optimal representation, this approach critically depends on an accurate AAM, which may not always be available. As a more generally applicable alternative, we computed a reaction center embedding via the vector difference of aggregated molecular embeddings. Let a chemical reaction be denoted by  , where R and P are the reactant and product molecular graphs, respectively. We define their graph-level embeddings:
  , and hence the reaction-center embedding,
  , is given by the difference between the reactant and product embeddings. This embedding strategy achieves permutation invariance by using an “order-agnostic” aggregator, summing node and edge features, and remains efficient, requiring only O(|V| + |E|) time to compute each graph embedding and O(d) to compare them. However, it suffers from spectral degeneracy: co-spectral reactant-product graph pairs share identical adjacency matrix spectra, causing their reaction center embeddings to collapse to the zero vector and thereby degrading classification performance.39 To address this limitation, we adopt GINE,31 an edge-aware variant of GIN40 with expressive power equivalent to the Weisfeiler–Lehman test,40,41 thereby yielding highly discriminative reaction-center embeddings (see Fig. 1).
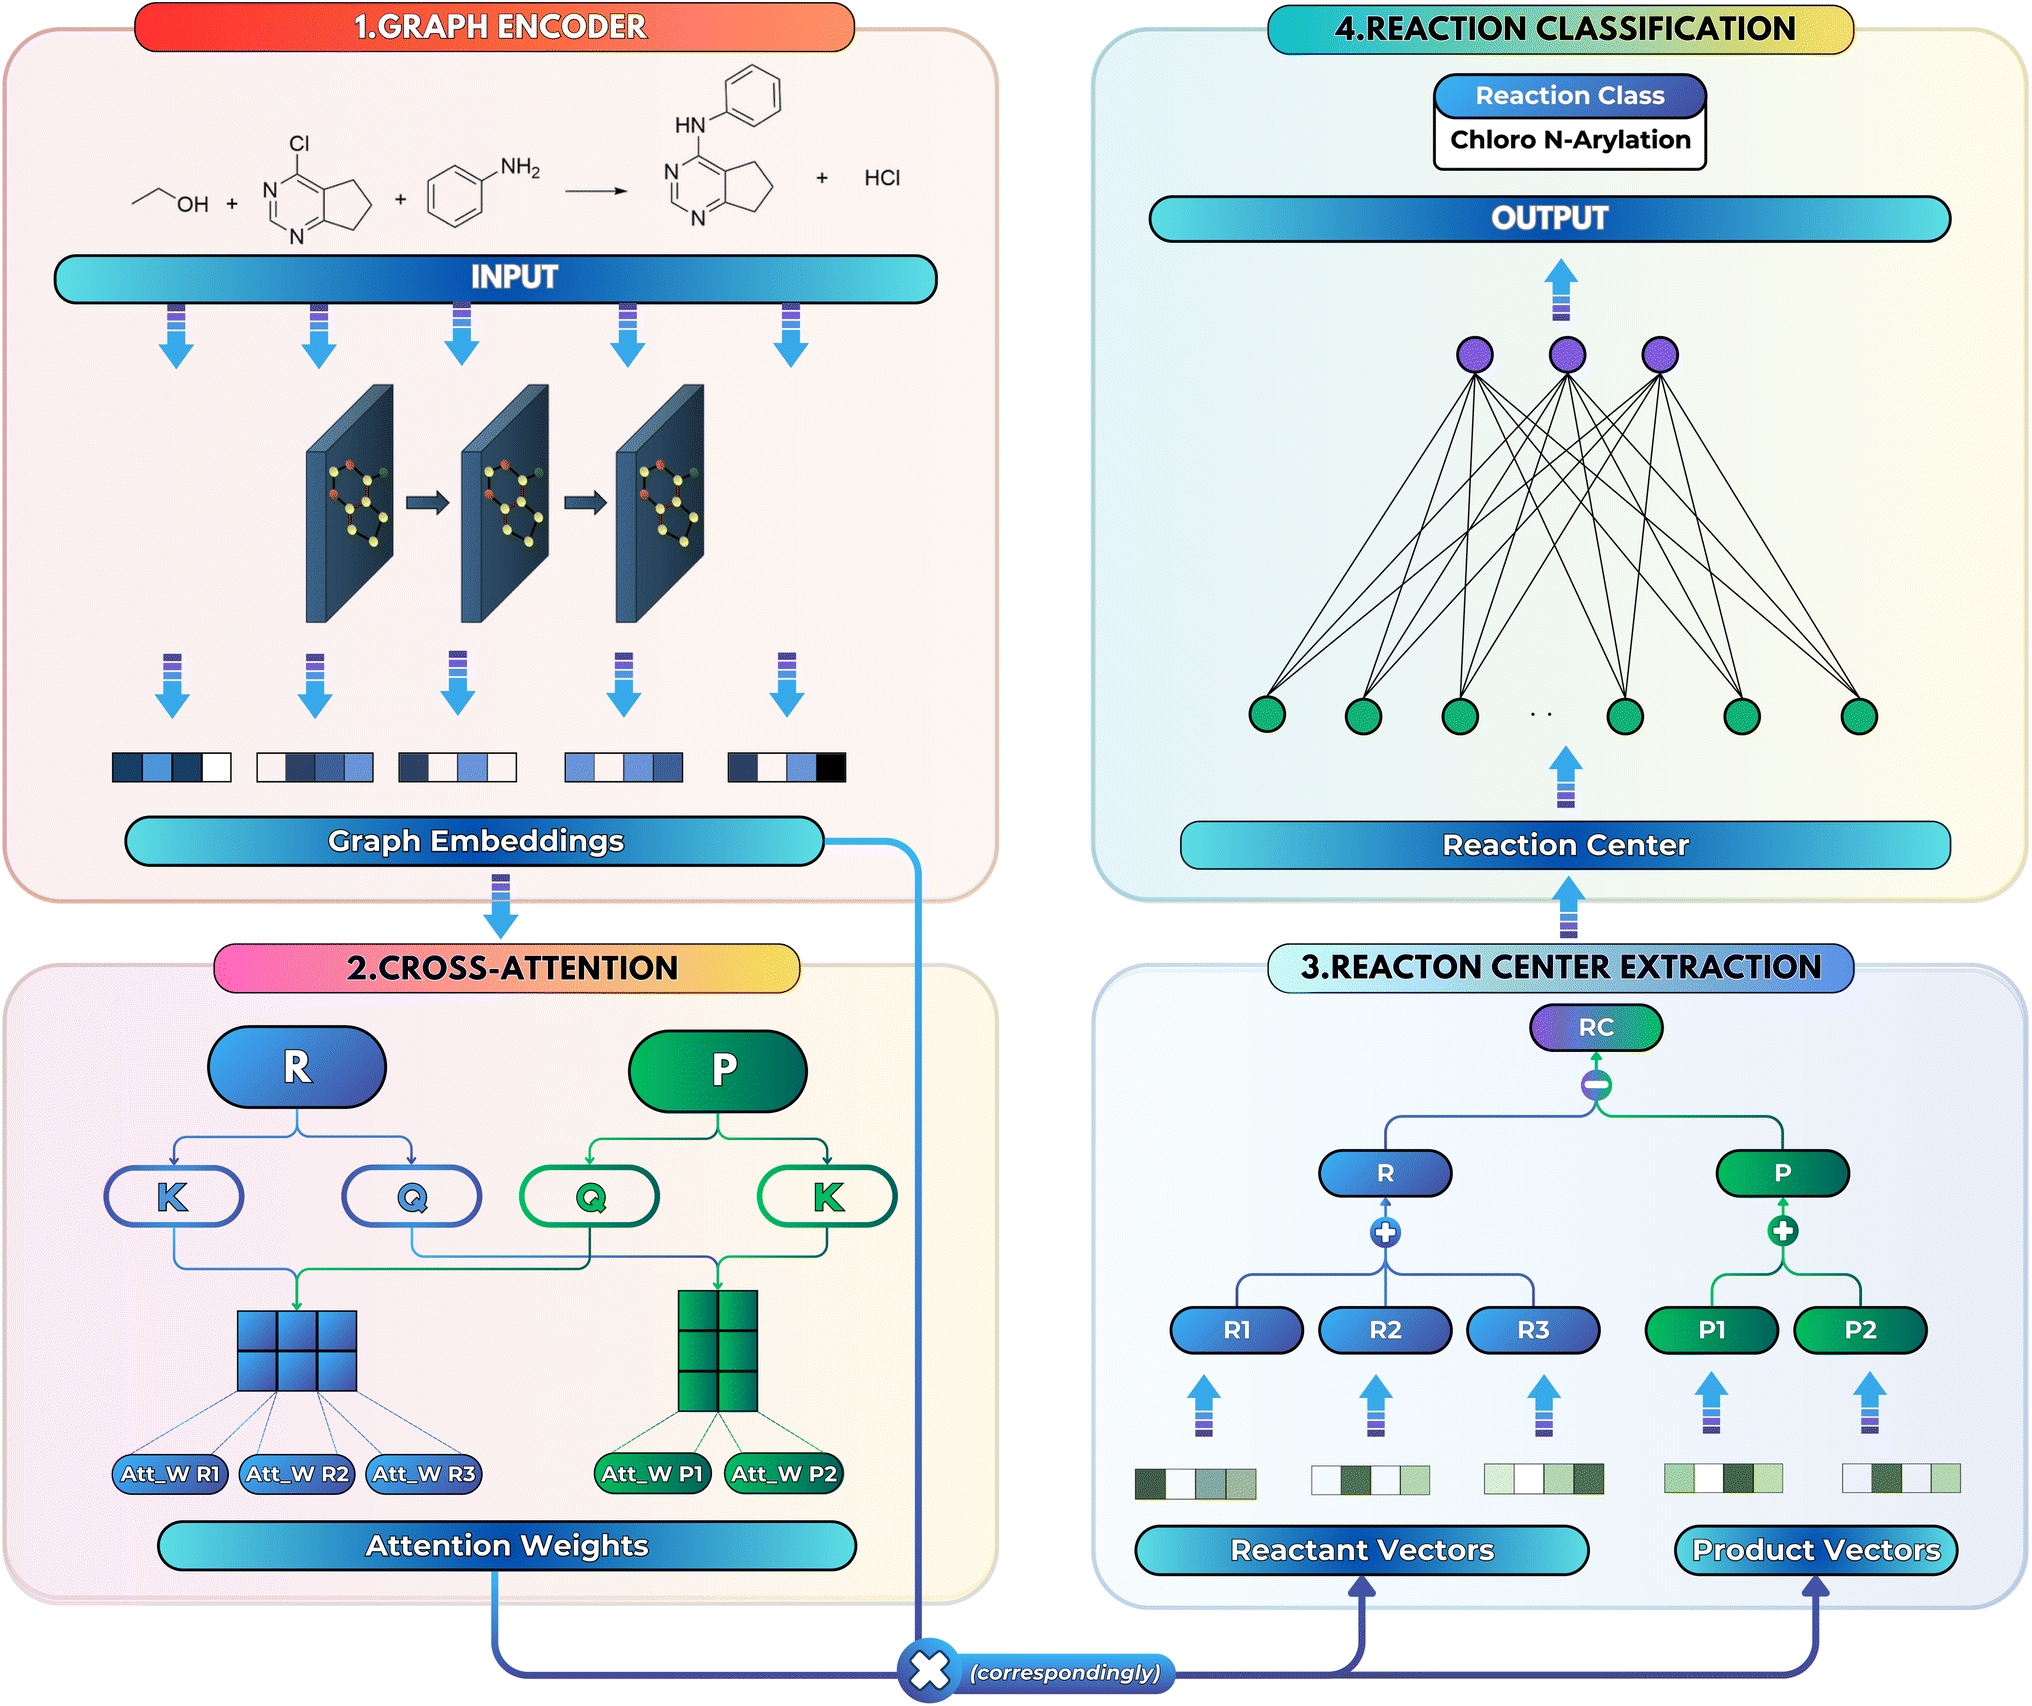 | ||
| Fig. 1 Overview of the SynCat architecture. Each molecule is processed by a GINE layer, followed by a cross-attention layer to assess the contribution of each embedding. The embeddings from each side are then aggregated, and the difference between the product and reactant embeddings forms the reaction center embedding. | ||
Let vi ∈V and  . We denote their raw feature vectors by vi and eij, respectively, and initialize the corresponding embeddings as
 | (2) |
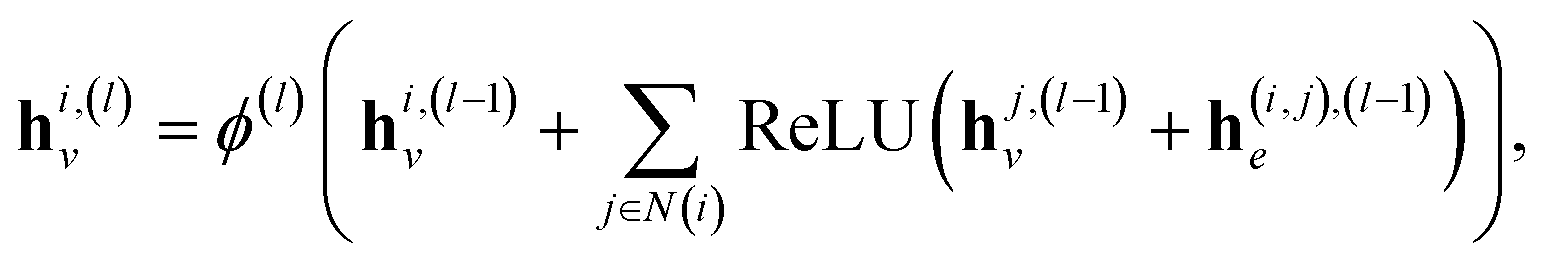 | (3) |
Finally, after L layers the global graph embedding is
 | (4) |
 (and analogously for products), yields the reaction-center embedding by taking the difference between the reactant and product embeddings, but treats all species equally, so spectator reagents degrade the signal-to-noise ratio and impair GNN performance.17 While AAM can filter out unmapped reagents,42 it depends on mapping accuracy. To address this, we introduce non-negative importance weights
  with
with | (5) |
Upon applying GINE, we obtain two embedding matrices,  and
and  , for the reactants and products, respectively, where nr and np are their counts and d is the embedding dimension. By default, we use these individual embeddings,
  and
and  . When nr > 1 or np > 1, a standard attention mechanism can overweight large molecules and under-represent small ones, distorting the reaction center embedding. To mitigate this, we introduce a second-order transformation:
  and
and  , where Φ enriches pairwise interactions (see Section 2.3.3).
The updated embeddings  and
and  are processed through learned linear projections to produce query and key matrices:
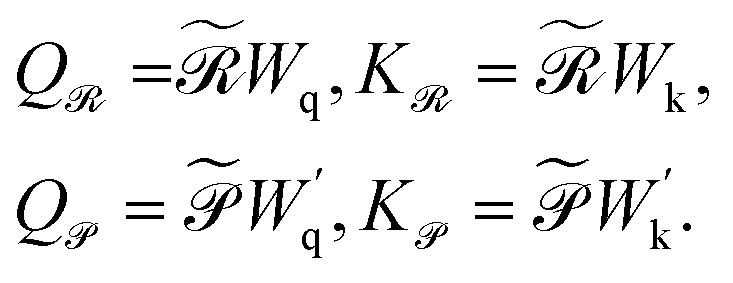 | (6) |
 are the learnable projection matrices, so
  and
and  . In the above nr, np are the numbers of reactant/product, d is the input embedding dimensionality, and d′ is the projection dimensionality.
Given the query and key matrices for both reactants and products, the cross-attention weights are computed as follows:43
 | (7) |
Subsequently,  and
and  are averaged to obtain
 | (8) |
 and
and 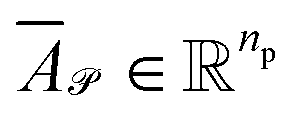 denote the averaged attention weights for reactants and products, respectively.
 | (9) |
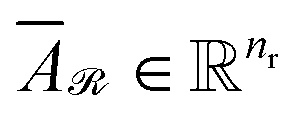
Attention can get skewed toward embeddings with large norms, drowning out smaller yet chemically important species. To fix this, we explicitly build all pairwise combinations of embeddings so that interactions between every two reactants or products are represented. Concretely, if ri are your reactant vectors (for i = 0, …, nr − 1) and pj your product vectors (for j = 0, …, np − 1), we define
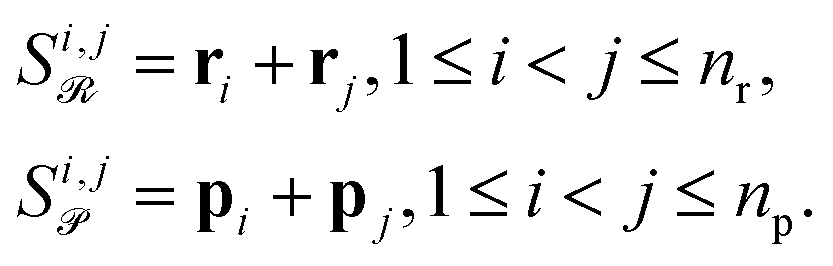 | (10) |
Stacking these vectors yields the matrices 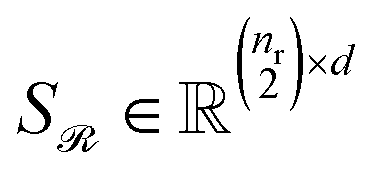 and
and 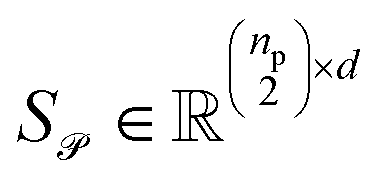 , where
 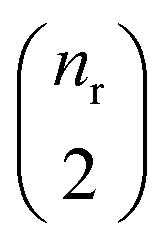 and
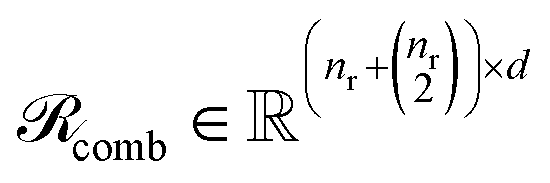
and  are the numbers of unique reactant and product pairs, respectively. This construction ensures that all pairwise interactions are made available to the attention module.
While this pairwise construction effectively models second-order effects, relying solely on these sums (e.g., 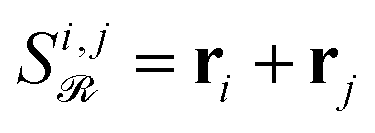 ) discards the original first-order features and can induce a new magnitude bias. If one embedding dominates in norm, say ‖r3‖ ≫ ‖r1‖, ‖r2‖ in a reaction with reactants r1, r2 and reagent r3, then
  . Attention will thus overemphasize spectator pairs (1, 3), (2, 3) and underemphasize the true reactant interaction (1,2), polluting the inferred reaction-center Γ.
To preserve both first- and second-order information, we concatenate the original embeddings with their pairwise sums. Denoting vertical concatenation by  , we form
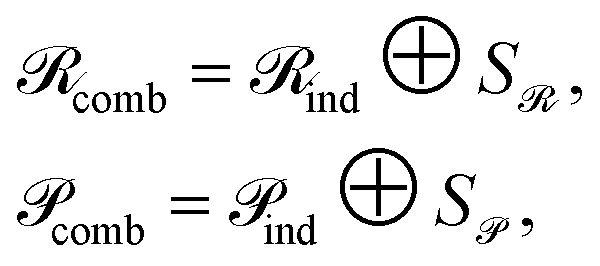 | (11) |
 and similarly
 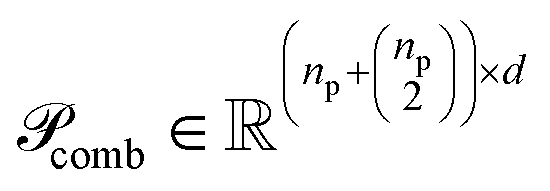 . In this way, our “combined” variant preserves each individual embedding alongside every pairwise interaction, mitigating norm-driven biases while retaining full expressive power.
Finally, for each variant m ∈ {ind, pair, comb}, applying Φ gives transformed embeddings
 | (12) |
and Np(m) is defined the same way for products.

 and
and  . Aggregate reactant and product embeddings:
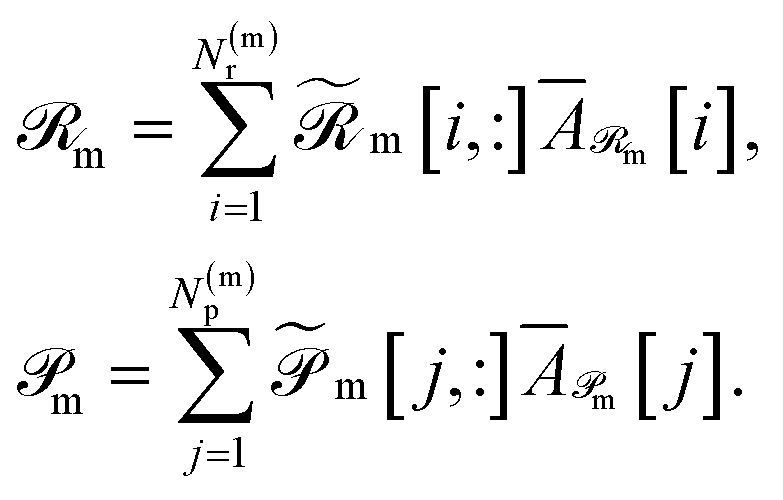 | (13) |
Reaction-center embedding (eqn (9)) is input to the classifier
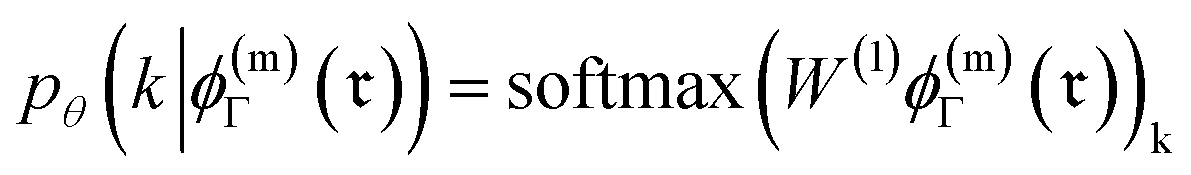 | (14) |
 (with biases), K is the number of reaction classes. Parameters θ = {W(1)} are fit by minimizing the cross-entropy loss in eqn (1).
2.4 Computational experiments
We conducted a comprehensive comparison of our classification model, SynCat, with its detailed configuration provided in Table S4, against two established baselines: the DRFP28 and the transformer-based RXNFP.15 DRFP builds a fixed, non-learned reaction descriptor by contrasting hashed circular substructures of products and reactants (symmetric difference) and hashing the result into a binary vector; we use radius r = 3 and length 2048. It is order-invariant, requires no training, and is paired with standard classifiers in our experiments (reaction SMILES are canonicalized and atom maps removed before featurization). RXNFP produces a learned, dense embedding of reaction SMILES via a BERT-style transformer pretrained with masked-language objectives.44 Reactions are encoded as tokenized sequences with reactants and products separated by “>>”; the pooled sequence representation serves as the fingerprint. We use the released pretrained weights and tokenizer, freeze the encoder, as fixed features.Experiments were performed on the three datasets described in Section 2.2 under two reaction-constitution regimes: (i) unbalanced reactions and (ii) balanced reactions. Balanced variants were produced using the SynRBL rebalancing procedure.45 Here, B denotes balanced (stoichiometrically complete) reactions and UB denotes unbalanced (stoichiometrically incomplete) reactions; these labels refer to equation completeness and not to a balanced class distribution (equal numbers of examples per class). For each fingerprint method and each of the nine dataset splits, we trained both a k-nearest-neighbour classifier (kNN) and a multilayer perceptron (MLP). Performance was quantified by two standard metrics: Accuracy (Acc) (see eqn (S1)) and the Matthews correlation coefficient (MCC)46 (see eqn (S2)).
3 Results and discussions
3.1 Permutation-invariant assessment
Chemical transformations are fundamentally described as an unordered collection of reactants yielding an unordered collection of products. Consequently, any learned representation (embedding) of a reaction must be invariant to permutations in the canonical ordering of these species. We took advantage of GINE, which theoretically ensures this invariance through a sum aggregator (see Section 2.3.1). We then evaluated the practical implications of this property by comparing embedding similarities across three types of controlled chemical perturbations (Fig. 2). To quantify the pairwise similarity between two reactions, and
and  , we defined the function
  . For fingerprints represented as continuous vectors, such as SynCat and RXNFP, the cosine similarity metric was employed. In contrast, for the binary DRFP fingerprint, the Tanimoto coefficient was utilized.
 | ||
| Fig. 2 Experiments on permutative invariance. (A and B) Reaction representations Ra and Rb, which differ solely by the ordering of two reactant species, used to assess the model's invariance to reactant permutation. | ||
The permutation invariance of these fingerprints is illustrated in Fig. 2A and B. Interchanging the order of the reactant in a transformation from  to
to  revealed that both SynCat and DRFP were perfectly invariant, yielding a similarity score
  . In contrast, the RXNFP representation demonstrated a quantifiable dependence on reactant sequence, with the similarity decreasing to
  . This sequence dependence was further highlighted in Fig. S2, where a simple inversion of the reactant order precipitated a substantial drop in the RXNFP similarity to 0.6310. It is crucial to note that while SMILES canonicalization enforces a consistent ordering at the string representation level, it fails to address the fundamental permutation sensitivity inherent to the learned RXNFP embedding itself.
3.2 Reagent-aware evaluation
To correctly identify which input species contribute atoms to the isolated products, a model must accurately differentiate core reactants and products from reagents and solvents. SynCat accomplished this through a molecule-level cross-attention mechanism, which learned the contextual role of each species by jointly embedding all reaction participants (Section 2.3.2). This approach assigned substantially higher attention weights to reactants and products over other species (e.g. solvents, spectator ions), providing a data-driven basis for role assignment. As illustrated in Fig. 3, the learned attention weights highlight the most prominent embeddings of the reactant and the product, allowing straightforward inference of the species driving the reaction. | ||
| Fig. 3 Attention weight distributions across various substances within representative reactions. Reactants and products receive notably higher attention weights, enabling clear differentiation from reagents, solvents, and other ancillary species. | ||
In contrast, RXNMapper and related AAM-centric pipelines infer roles heuristically: any compound lacking a complete atom map was labeled a reagent or solvent. Although computationally expedient, this rule systematically overlooks hydrogens since most public reaction corpora, USPTO in particular, omitted explicit hydrogen atoms during template extraction. The resulting misclassifications are particularly damaging for hydrogenation, reduction, and proton transfer steps, where hydrogen is an essential reactant.
Fig. 4 shows this limitation using a hydrogenation as an example. While atom-mapping tools such as RXNMapper erroneously classified molecular hydrogen (H2) as a reagent, SynCat correctly identified its pivotal role. The cross-attention architecture provided a quantitative basis for this distinction, attributing a high attention weight to H2 that reflected its role as an atom-contributing (stoichiometric) species (Fig. 4A). Fig. S3 echoes this result as SynCat assigns comparable attention to both enantiomers in a racemic mixture, highlighting its potential to capture stereochemical outcomes as richer stereochemical encodings are introduced. By jointly learning role-specific weights and the overall reaction representation, SynCat generated interpretable, role-aware embeddings that lead to superior performance in downstream tasks such as classification, retrieval and retrosynthesis.
 | ||
| Fig. 4 Visualization of attention weights in a representative hydrogenation reaction. (A) SynCat assigns a significantly higher weight to hydrogen, reflecting its role as an atom-contributing (stoichiometric) species. (B) By contrast, RXNMapper classifies all unmapped species as reagents, thereby overlooking key reactive participants. | ||
Together, these results emphasize that SynCat successfully captures two essential properties of chemical transformations. First, it respects permutation invariance by treating reactants and products as unordered molecular sets. Second, it is sensitive to which participants supply atoms to the products, including small, traditionally overlooked species like H2. This principled approach overcomes the limitations of conventional strategies that rely on brittle atom-mapping heuristics, which often fail when confronted with the full spectrum of chemical reactivity.
3.3 Reaction classification
Our classification model, SynCat, was developed utilizing the GINE architecture, subsequently augmented with cross-attention. The performance of SynCat, as detailed in Table 2, was benchmarked against RXNFP and DRFP across nine distinct datasets. SynCat yielded an overall accuracy of 0.988 ± 0.008, demonstrating superior performance relative to both DRFP and RXNFP across a suite of nine benchmark datasets, as illustrated in Fig. S4. A statistical assessment conducted via the Wilcoxon signed-rank test indicated that SynCat significantly outperformed nearly all competing methods (p < 0.05), with the sole exception of RXNFP (5-NN), where the resulting p-value was 0.058. In contrast, the Mann–Whitney U test revealed no statistically significant differences among these models (see Fig. S5), suggesting that further investigation is warranted to fully understand the contexts in which performance advantages become apparent.| Model | Schneider | USPTO_TPL | USPTO_50k | SynTemp clusters | Avg ± SD | |||||
|---|---|---|---|---|---|---|---|---|---|---|
| UB | B | UB | B | UB | B | R0 | R1 | R2 | ||
| Accuracy | ||||||||||
| SynCat | 0.981 | 0.973 | 0.991 | 0.988 | 0.995 | 0.996 | 0.996 | 0.992 | 0.982 | 0.988 ± 0.008 |
| RXNFP + 5-NN | 0.985 | 0.947 | 0.989 | 0.974 | 0.997 | 0.996 | 0.991 | 0.929 | 0.732 | 0.949 ± 0.085 |
| RXNFP + MLP | 0.985 | 0.957 | 0.988 | 0.971 | 0.994 | 0.991 | 0.995 | 0.955 | 0.802 | 0.960 ± 0.061 |
| DRFP + 5-NN | 0.819 | 0.662 | 0.917 | 0.912 | 0.866 | 0.859 | 0.875 | 0.826 | 0.834 | 0.841 ± 0.076 |
| DRFP + MLP | 0.957 | 0.926 | 0.977 | 0.963 | 0.918 | 0.928 | 0.973 | 0.959 | 0.965 | 0.952 ± 0.022 |
|
||||||||||
| MCC | ||||||||||
| SynCat | 0.980 | 0.973 | 0.991 | 0.988 | 0.995 | 0.995 | 0.996 | 0.992 | 0.978 | 0.988 ± 0.008 |
| RXNFP + 5-NN | 0.985 | 0.946 | 0.989 | 0.974 | 0.995 | 0.995 | 0.990 | 0.928 | 0.672 | 0.942 ± 0.104 |
| RXNFP + MLP | 0.985 | 0.956 | 0.988 | 0.971 | 0.993 | 0.989 | 0.994 | 0.954 | 0.758 | 0.954 ± 0.075 |
| DRFP + 5-NN | 0.817 | 0.683 | 0.917 | 0.912 | 0.838 | 0.828 | 0.868 | 0.826 | 0.810 | 0.833 ± 0.069 |
| DRFP + MLP | 0.956 | 0.925 | 0.977 | 0.962 | 0.898 | 0.910 | 0.971 | 0.958 | 0.957 | 0.946 ± 0.028 |
A more extensive comparison (see Fig. S6) further substantiated the robustness of SynCat, which outperformed DRFP across all evaluated datasets. In comparison to RXNFP (5-NN or MLP), SynCat exhibited only a slight performance deficit on the Unbalanced Schneider dataset (accuracy of 0.981 vs. 0.985) and achieved near-identical results on the Unbalanced USPTO_50k dataset (0.995 vs. 0.997). In particular, the advantage of SynCat became more pronounced in cluster-based datasets, as the classification accuracy gap between SynCat and RXNFP expanded in tandem with the complexity of the reaction center, increasing from 0.01 for R0 to 0.18 for R2. This trend was most striking in the R2 dataset, where RXNFP attained accuracies of 0.732 (kNN) and 0.802 (MLP), versus 0.982 for SynCat. These differences highlight the susceptibility of models that fail to explicitly account for the context surrounding reaction centers. Such neighboring atoms are indispensable, as their local steric and electronic effects strongly influence the reaction course and the resulting product distribution. This principle underscores the necessity of refined graph-based strategies like SynCat, which explicitly encode this localized chemical environment to achieve robust predictive accuracy and broad generalizability.
As illustrated in Fig. S7, SynCat achieved superior performance to RXNFP on seven out of nine datasets, trailing only slightly in the two remaining benchmarks. Notably, in the Balanced Schneider dataset, SynCat reached an accuracy of 0.973, compared to 0.947 for RXNFP. Fig. 5 compares the behavior of the RXNFP encoder on the same transformation before and after reaction rebalancing. Prior to rebalancing, RXNFP correctly assigns the sequence as a ethyl ester deprotection. After rebalancing, however, it is misclassified as a Sonogashira coupling reaction.47 Syncat does not exhibit this kind of instability: its predictions remain invariant to the rebalancing procedure. In particular, neither metadata nor commentary indicates any coupling step: the sole structural feature triggering the misclassification is the presence of the substructure R–C![[triple bond, length as m-dash]](https://www.rsc.org/images/entities/char_e002.gif) C–R′ in the product.
C–R′ in the product.
 | ||
| Fig. 5 Reaction classification before and after rebalancing using SynRBL. | ||
This reversal in relative performance, observed before and after rebalancing, can be attributed to artifacts introduced by the rebalancing procedure: reagent molecules may appear on both sides of the reaction arrow, producing reagent-like tokens in reactant and product positions. This mirrored reagent context disperses attention away from the true transformation center, degrading localization and reducing accuracy (see Fig. 6A and B). The effect is consistently small for SynCat (0.008 on Schneider, 0.004 on USPTO_TPL) but larger for RXNFP (0.038 on Schneider, 0.015 on USPTO_TPL). Moreover, rebalancing reduced the dataset contamination (term coined by Jiang et al.48) in Schneider from 72.58% to 6.23% (Table S5), with RXNFP accuracy falling from 0.985 to 0.947. A similar pattern holds for USPTO_TPL, where contamination decreased from 99.97% to 14.70% and RXNFP accuracy fell from 0.989 to 0.974. By contrast, USPTO_50k exhibits contamination below 15% in both conditions and negligible performance change. These findings echo To et al.49 and illustrate that test set leakage into pretraining corpora can inflate measured accuracy without improving generalization. SynCat is inherently immune to contamination, because it does not employ any pre-training.
 | ||
| Fig. 6 Impact of redundancy and rebalancing on reaction classification. (A) In the original unbalanced reaction, SynCat correctly identifies the N–Bn substitution. (B) After rebalancing with SynRBL, SynCat misclassifies the reaction as methylation due to redundancy-induced noise. | ||
Moreover, Fig. 7A depicts a reaction mislabeled as Mitsunobu aryl ether synthesis, which does not correspond to its actual transformation. Although SynCat misclassified it as Ester Schotten–Baumann, it nonetheless recognized the underlying esterification and suggested a more relevant reaction label. Fig. 7B shows a reaction that could validly be categorized as either carboxylic acid + amine reaction or N-acetylation, highlighting the label noise and inconsistency present in the dataset.
 | ||
| Fig. 7 Examples of classification under noisy labels. (A) A reaction annotated as Mitsunobu aryl ether synthesis, which is chemically incorrect; SynCat mispredicts it as Ester Schotten–Baumann but still captures the esterification transformation. (B) A reaction ambiguously labeled as either carboxylic acid + amine reaction or N-acetylation, illustrating label inconsistency that leads to classification errors. | ||
3.4 Enzymatic reaction classification
We further assessed SynCat's robustness on the biochemical ECREACT corpus,33 which offers a three-level enzymatic ontology. At the first level the labels are the broad EC classes (oxidoreductases, transferases, hydrolases, lyases, isomerases, ligases, translocases).35 SynCat attained MCC = 0.916 on this level, compared with 0.937 for CLAIRE. This gap is consistent with the coarse and chemically heterogeneous nature of level-1 classes, which weakens signals that SynCat extracts from structurally specific features around reaction centers. In contrast, SynCat performs near optimally when labels directly encode reaction center information, as evidenced by its R0 task (SynTemp cluster) where labels denote reaction-center classes and the model reaches and MCC of 0.996 despite 143 classes and pronounced imbalance (see Table 2).At the second and third EC levels the taxonomy refines by the group or bond acted upon (for example, EC 2.3 denotes acyltransferases within transferases), and SynCat surpasses CLAIRE on both tiers (see Table 3). Together, these results indicate robust cross-domain generalization when labels align with reaction-center structure, and a relative weakness for broad, heterogeneous biochemical classes.
| Level | CLAIRE | SynCat | ||
|---|---|---|---|---|
| Accuracy | MCC | Accuracy | MCC | |
| 1st | 0.958 | 0.937 | 0.944 | 0.916 |
| 2nd | 0.900 | 0.890 | 0.903 | 0.892 |
| 3rd | 0.859 | 0.851 | 0.864 | 0.855 |
3.5 Attention and class granularity
We extended our analysis to probe how attention behaves across hierarchical label levels using the Schneider dataset (three label depths), inspecting a Wohl–Ziegler bromination (see Fig. 8A), a selective allylic/benzylic reaction where N-bromosuccinimide (NBS) is the key radical brominating agent. At the coarse level 1 (9 classes, MCC = 0.978) the model predicts the broad category (Functional-group addition) but assigns weak attention to N-bromosuccinimide (NBS; 0.27), leaving reagent attribution ambiguous. At level 2 (28 classes, MCC = 0.984) the prediction refines to a halogenation class and attention on NBS rises (0.62). At the finest depth (level 3, 50 classes, MCC = 0.980) attention concentrates further (0.81) and NBS is unambiguously identified as the brominating reagent. The slight MCC drop at level 3 reflects increased inter-class similarity and label ambiguity, exemplified by closely related acylation subclasses (e.g., “N-acetylation” vs. “carboxylic acid + amine reaction”, see Fig. 7) and near-duplicate entries (“Bromo Suzuki coupling” vs. “Bromo Suzuki-type coupling”), which together increase class confusion despite more focused attention. A pragmatic remedy is to merge very similar subclasses, or to use multi-task supervision so that the benefits of fine-grained localization do not come at the expense of global separability. | ||
| Fig. 8 Attention maps. (A) Wohl–Ziegler bromination (Schneider): focus on NBS increases with depth (0.27 → 0.62 → 0.81). (B) Oxidation (Mech_31k): coarse labels produce diffuse maps, whereas fine-grained labels concentrate attention on likely reagents such as DMSO (0.42), TEA (0.33), and oxalyl chloride (0.14). | ||
Second, we used MechFinder to derive Mech_31k from USPTO_50k (9 superclasses, 63 subclasses) and examined a Swern oxidation example (see Fig. 8B), where dimethyl sulfoxide (DMSO) is the oxidant, activated by oxalyl chloride, and triethylamine (TEA) is the base. At the coarse, superclass level, attention is diffuse: DMSO and TEA receive attention scores of 0.33 and 0.27, respectively, while oxalyl chloride registers zero. At level 2, however, the model localizes reaction center and reagent signals to correctly predict the Swern oxidation, where attention scores for DMSO, TEA, and oxalyl chloride increase to 0.42, 0.33, and 0.14, indicating improved reagent attribution. This shows that finer-grained supervision enhances both interpretability and alignment with chemical reactivity.
To complement these attention diagnostics and quantify robustness to chemically insignificant changes, we generated two held-out augmentation sets, including Suzuki (Bpin–Me → Bpin–Et, N1 = 165) and base-exchange (TEA → TNPA, N2 = 4), totaling 169 reactions and excluding any substitution present in the training set. SynCat preserved the original predicted class for all augmented examples (169/169), supporting the model's consistency under minor structural and reagent substitutions (see Fig. S8).
3.6 Ablation study
We performed an extensive ablation analysis to systematically evaluated the impact of three key characteristic modalities, elemental identities (atom type), covalent connectivity (bond type), and intermolecular context (cross-attention). We further investigated three distinct attention-embedding schemes: individual embedding (ϕind), pairwise embedding (ϕpair), and a hybrid combination (ϕcomb). The comprehensive results, aggregated over nine benchmark datasets, are detailed in Table 4.| Model | Schneider | USPTO_TPL | USPTO_50k | SynTemp clusters | Avg ± SD | |||||
|---|---|---|---|---|---|---|---|---|---|---|
| UB | B | UB | B | UB | B | R0 | R1 | R2 | ||
| Accuracy | ||||||||||
| SynCat ϕcomb | 0.981 | 0.973 | 0.991 | 0.988 | 0.995 | 0.996 | 0.996 | 0.992 | 0.982 | 0.988 ± 0.008 |
| SynCat ϕind | 0.968 | 0.968 | 0.979 | 0.976 | 0.990 | 0.991 | 0.995 | 0.992 | 0.976 | 0.982 ± 0.011 |
| SynCat ϕpair | 0.976 | 0.978 | 0.976 | 0.975 | 0.995 | 0.995 | 0.997 | 0.994 | 0.987 | 0.986 ± 0.009 |
| SynCat ϕcomb (Σ) | 0.852 | 0.900 | 0.941 | 0.957 | 0.824 | 0.972 | 0.967 | 0.945 | 0.917 | 0.919 ± 0.049 |
| SynCat ϕcomb (Cat) | 0.973 | 0.971 | 0.980 | 0.981 | 0.994 | 0.995 | 0.994 | 0.985 | 0.942 | 0.979 ± 0.016 |
| SynCat w/o cross-attention | 0.967 | 0.954 | 0.989 | 0.984 | 0.996 | 0.997 | 0.998 | 0.996 | 0.990 | 0.986 ± 0.015 |
| GIN w/o atom type | 0.932 | 0.925 | 0.951 | 0.952 | 0.994 | 0.994 | 0.920 | 0.921 | 0.936 | 0.947 ± 0.029 |
| GIN w/o bond feature | 0.973 | 0.972 | 0.976 | 0.975 | 0.995 | 0.994 | 0.993 | 0.990 | 0.978 | 0.983 ± 0.010 |
|
||||||||||
| MCC | ||||||||||
| SynCat ϕcomb | 0.980 | 0.973 | 0.991 | 0.988 | 0.995 | 0.995 | 0.996 | 0.992 | 0.978 | 0.988 ± 0.008 |
| SynCat ϕind | 0.967 | 0.967 | 0.979 | 0.975 | 0.987 | 0.989 | 0.995 | 0.992 | 0.977 | 0.980 ± 0.011 |
| SynCat ϕpair | 0.976 | 0.978 | 0.976 | 0.975 | 0.994 | 0.994 | 0.997 | 0.994 | 0.984 | 0.985 ± 0.009 |
| SynCat ϕcomb (Σ) | 0.849 | 0.898 | 0.941 | 0.957 | 0.779 | 0.965 | 0.965 | 0.944 | 0.899 | 0.911 ± 0.059 |
| SynCat ϕcomb (Cat) | 0.972 | 0.971 | 0.980 | 0.981 | 0.993 | 0.994 | 0.994 | 0.985 | 0.928 | 0.978 ± 0.019 |
| SynCat w/o cross-attention | 0.966 | 0.953 | 0.989 | 0.984 | 0.997 | 0.995 | 0.998 | 0.996 | 0.987 | 0.985 ± 0.016 |
| GIN w/o atom type | 0.930 | 0.923 | 0.951 | 0.952 | 0.992 | 0.993 | 0.914 | 0.919 | 0.922 | 0.944 ± 0.031 |
| GIN w/o bond feature | 0.972 | 0.971 | 0.976 | 0.975 | 0.994 | 0.993 | 0.993 | 0.990 | 0.973 | 0.982 ± 0.010 |
The fully parameterized model, which integrates the three feature modalities, achieved the highest mean accuracy of 0.988 ± 0.008 and MCC of 0.988 ± 0.008, confirming their synergistic contribution. Ablating elemental identity features induced the most significant performance degradation, with absolute decreases of 4.1% in accuracy and 4.4% in MCC, underscoring the primacy of atomic information for discriminating distinct transformations. Excluding bond-type information resulted in a moderate but consistent drop of approximately 0.5% in both metrics, suggesting that covalent connectivity refines rather than defines the molecular graph representation. The cross-attention mechanism yielded only a modest absolute improvement of 0.2% overall. It becomes critical, however, for datasets with complex reaction media—such as Schneider and USPTO_TPL, where it effectively filtered contributions from spectator species and preserved class separability. Conversely, on corpora with well-defined reactants and products such as USPTO_50k, the benefits of cross-attention mechanism are very moderate at best, since the additional parameterization offering little advantage in the absence of significant spectator noise.
The choice of attention-embedding scheme reveals subtle chemical distinctions: embedding-induced cross-attention analysis (Table 4) showed that the hybrid scheme ϕcomb consistently outperformed both the individual (ϕind) and pairwise (ϕpair) variants. Fig. 9 presents a side-by-side comparison of the molecule-level attention weight distributions obtained by each strategy (see Section 2.3.3), highlighting how the combined embeddings focus attention more precisely on reaction centers and relevant molecular substructures.
 | ||
| Fig. 9 Attention weight distributions for three embedding schemes (ϕind, ϕpair, ϕcomb) on exemplar reactions. Panels A and B contrast single-reactant vs. multi-reactant scenarios. | ||
In Fig. 9A, under conditions where a single true reactant coexists with four inert reagents, the individual-embedding scheme ϕind correctly concentrated attention on the reactant (αind ≈ 1), whereas the pairwise-embedding scheme ϕpair erroneously assigned substantial weight to non-reactive species (with αpair reaching approximately 0.5) owing to their disproportionately larger embedding norms. This empirical bias is fully explained by the analysis in Section 2.3.3, which shows that pairwise sums of the two embeddings inherited the dominant magnitude of their larger-norm constituent, thus leading the attention mechanism to over-emphasize embeddings containing high-norm vectors.
Fig. 9B, moreover, depicts a reaction containing two true reactants and two inert species. Here, the individual-embedding scheme ϕind disproportionately focused attention on the reactant with the largest embedding norm, effectively ignoring the second, equally vital reactant. This observation is consistent with the theoretical analysis in Section 2.3.3, which predicts that ϕind can underweight relevant species. In contrast, the pairwise-embedding scheme ϕpair correctly distributed attention across both reactive centers. The hybrid embedding ϕcomb optimally merged these behaviors, achieving the sharp reactant discrimination seen in Fig. 9A while maintaining sensitivity to multiple reactive species as shown in Fig. 9B.
These empirical and theoretical observations have direct practical consequences for model selection. For real-world reaction classification on reagent-heavy, stoichiometrically noisy corpora (e.g., Schneider, USPTO_TPL), the hybrid ϕcomb is preferred because it combines the single-driver localization of ϕind with the multi-instance sensitivity of ϕpair. This mitigating the norm-bias and over-focus failure modes. By contrast, on well-curated, stoichiometrically balanced benchmarks (e.g., SynTemp, USPTO_50k) cross-attention adds modeling complexity without clear gain: the no-cross-attention variant with GINE typically matches or outperforms cross-attention while using substantially less compute. Consequently, we adopt ϕcomb as the default for noisy, heterogeneous corpora and use no-cross-attention/GINE for curated, balanced splits where simplicity and efficiency prevail.
We expanded the ablation study to compare three reactant-product fusion operators applied to attention-pooled embeddings of reactants and products. Our default fusion is the directed difference (Δ) (see eqn (9)), compared to concatenation (Cat) and elementwise sum (Σ). For the MCC, Δ attains 0.988 ± 0.008, ahead of Cat (0.978 ± 0.019) and Σ (0.911 ± 0.059). Versus Cat, Δ raises mean MCC by 0.010 (1.0 percentage point) and lowers the standard deviation from 0.019 to 0.008, a relative drop of 57.9%. Versus Σ, Δ improves MCC by 0.077 (7.7 points) and shows 7.4× lower variability. Δ encodes an explicit antisymmetric change signal aligned with reaction direction. Cat leaves this structure for the classifier to infer and doubles dimensionality. Σ discards direction and can cancel opposing signals. To probe data dependence, we subsampled the Schneider training set (fractions: 1%–100%, stratified sampling) while keeping validation and test fixed. Across these fractions Δ generally outperforms Σ and is superior to Cat for most intermediate sizes (see Table S6 and Fig. S12). Cat is only sometimes competitive, and only at the extreme low-data (1%) and full-data (100%) settings. We therefore retain Δ as the default fusion operator.
In summary, the encoding of atom types proves most critical; bond-type descriptors confer secondary benefits. The directed difference Δ is the default fusion operator. The incorporation of cross-attention via the hybrid embedding scheme, which combines individual embeddings αind and pairwise embeddings αpair, is essential in contexts featuring redundant reagents. Cross-attention yields substantially larger gains on stoichiometrically incomplete (unbalanced) reactions, the common real-world case, whereas a GINE encoder suffices for curated, stoichiometrically complete datasets (e.g., SynTemp R0 for reaction center labels).
4 Conclusions
With SynCat, we have introduced a graph-based classifier that couples a Graph Isomorphism Network backbone incorporating edge features with molecule-level cross-attention and a permutation-invariant pairwise sum readout. Cross-attention confers reagent awareness upon the model by learning molecule-specific importance weights. To counteract the tendency of this mechanism to overemphasize large molecules, we combined individual embeddings with a pairwise pooling strategy, which effectively normalizes the attention distribution. Evaluated on nine public benchmarks, SynCat surpassed both the handcrafted DRFP fingerprint and the large language-model-derived RXNFP, delivering a mean accuracy of 0.988 ± 0.008 and an MCC matching. SynCat also shows promising performance on biochemical datasets such as ECREACT, outperforming the state-of-the-art model CLAIRE at finer EC depths. We observed that increasing label granularity sharpens attention-based attribution of contributing species, but excessive subdivision of labels can reduce overall accuracy when classes become highly similar or contain near-duplicate transformations. This trade-off between label resolution and classifier robustness should be considered when selecting the optimal annotation depth.Ablation analysis confirmed that (i) atom-type labels are indispensable for fine-grained discrimination, (ii) bond features provide a secondary but robust benefit, and (iii) cross-attention is crucial on reagent-rich, multiclass corpora as well as for stoichiometrically incomplete reactions. Analysis of embedding-induced attention distributions clarified the respective strengths and weaknesses of our design choices. Individual embedding ϕinv is highly selective, but can collapse in multi-reactant scenarios, the pairwise variant ϕpair balances attention yet inflates spurious reagents when additives dominate, and their convex combination ϕcomb calibrates these extremes by maintaining focus in single-reactant transformations while equitably distributing weight when multiple substrates are present. This underscores that attention calibration, rather than graph topology alone, governs the fidelity of the role. Moreover, the ablation analysis shows that the fusion operator matters: the directed difference Δ is the most stable and discriminative (our default), concatenation Cat provides greater capacity at higher parameter cost, and the sum Σ is a conservative baseline. Future work should adapt SynCat for reaction-yield prediction and systematically evaluate Δ, Cat, and Σ to quantify their effects on accuracy, calibration, and uncertainty.
While SynCat exhibits strong closed-set performance, its scalability is constrained by the representativeness and cardinality of the ground-truth taxonomy: as the number of classes grows or new classes appear, the classifier typically requires adaptation or retraining. Future work will quantify label-dependence and principal sources of uncertainty, develop continual, few-shot, and open-set approaches to add classes with minimal retraining, and incorporate stoichiometry-aware models and hierarchical taxonomies to reduce combinatorial label growth and improve robustness. We will also address unseen classes via calibrated uncertainty estimation and lightweight open-set detection (e.g., temperature scaling, deep ensembles, and simple novelty detectors) as initial remediation strategies. Finally, molecule-level attention provides a useful relevance signal but is not mechanistic proof, we therefore plan to develop atom-level attributions, validate them against quantum-chemical calculations, and assemble curated mechanistic benchmarks.
Disclaimer
Views and opinions expressed are however those of the author(s) only and do not necessarily reflect those of the European Union. Neither the European Union nor the granting authority can be held responsible for them.Author contributions
Contributions are reported according to the CRediT taxonomy. P. C. V. N. conceptualized the study, curated and analyzed data, developed methods and software, validated results, and wrote and reviewed the manuscript; V. T. T. curated data, created visualizations, and reviewed the manuscript; N. V. N. T. produced visualizations and drafted and reviewed the manuscript; T. N. T. managed the project, secured resources, and drafted and reviewed the manuscript; T. L. P. co-conceptualized the study, performed formal analysis, supervised the project, produced visualizations, and wrote and reviewed the manuscript; T. G. supervised the work, drafted and reviewed the manuscript; D. M. secured funding, supervised the project, and drafted and reviewed the manuscript; P. F. S. secured funding and resources, supervised the project, and drafted and reviewed the manuscript. All authors participated in revising the manuscript during the review process.Conflicts of interest
There are no conflicts to declare.Data availability
The datasets supporting the conclusions of this article are available in the SynCat repository: https://github.com/phuocchung123/SynCat/tree/main/Data. The source code is available at: https://github.com/phuocchung123/SynCat and has been archived on Zenodo https://doi.org/10.5281/zenodo.17342272.Supplementary information: formal definitions of reported metrics, full numerical tables for all experiments, and all supporting figures and captions referenced in the manuscript. See DOI: https://doi.org/10.1039/d5dd00367a.
Acknowledgements
This project has received funding from the European Unions Horizon Europe Doctoral Network programme under the Marie-Skłodowska-Curie grant agreement no. 101072930 (TACsy – Training Alliance for Computational systems chemistry). P. C. V. N., V. T. T., N. V. N. T. and T. N. T. have received support from the Korea International Cooperation Agency (KOICA) under the project entitled “Education and Research Capacity Building Project at University of Medicine and Pharmacy at Ho Chi Minh City,” conducted from 2024 to 2025 (Project No. 2021-00020-3). The research of D.M. is partially supported by the Novo Nordisk Foundation (grant NNF21OC0066551 “MATOMIC”). We also acknowledge Nhu-Ngoc Song Nguyen for her support in designing the figures for this study. We thank the anonymous reviewers for their comments and suggestions to improve this contribution.References
- H.-J. Federsel, Acc. Chem. Res., 2009, 42, 1377 CrossRef.
- Y. Han, M. Deng, K. Liu, J. Chen, Y. Wang, Y.-N. Xu and L. Dian, Chem.–Eur. J., 2024, 30, e202401626 CrossRef CAS PubMed.
- T. J. Struble, J. C. Alvarez, S. P. Brown, M. Chytil, J. Cisar, R. L. DesJarlais, O. Engkvist, S. A. Frank, D. R. Greve and D. J. Griffin, et al. , J. Med. Chem., 2020, 63, 8667–8682 CrossRef CAS PubMed.
- J. S. Carey, D. Laffan, C. Thomson and M. T. Williams, Org. Biomol. Chem., 2006, 4, 2337–2347 RSC.
- S. D. Roughley and A. M. Jordan, J. Med. Chem., 2011, 54, 3451–3479 CrossRef CAS.
- S. Fujita, J. Chem. Inf. Comput. Sci., 1986, 26, 205–212 CrossRef CAS.
- C. S. Wilcox and R. A. Levinson, Artificial Intelligence Applications in Chemistry, ACS Publications, 1986, vol. 306, pp. 209–230 Search PubMed.
- J. B. Hendrickson, J. Chem. Inf. Comput. Sci., 1997, 37, 852–860 CrossRef CAS.
- W. Jaworski, S. Szymkuć, B. Mikulak-Klucznik, K. Piecuch, T. Klucznik, M. Kaźmierowski, J. Rydzewski, A. Gambin and B. A. Grzybowski, Nat. Commun., 2019, 10, 1434 CrossRef PubMed.
- H. Kraut, J. Eiblmaier, G. Grethe, P. Löw, H. Matuszczyk and H. Saller, J. Chem. Inf. Model., 2013, 53, 2884–2895 CrossRef CAS PubMed.
- W. L. Chen, D. Z. Chen and K. T. Taylor, Wiley Interdiscip. Rev.: Comput. Mol. Sci., 2013, 3, 560–593 CAS.
- C. Jochum, J. Gasteiger and I. Ugi, Angew. Chem., Int. Ed., 1980, 19, 495–505 CrossRef.
- M. Astero and J. Rousu, J. Cheminf., 2025, 17, 1–17 Search PubMed.
- J. Goodman, J. Chem. Inf. Model., 2009, 49, 2897–2898 CrossRef CAS.
- P. Schwaller, D. Probst, A. C. Vaucher, V. H. Nair, D. Kreutter, T. Laino and J.-L. Reymond, Nat. Mach. Intell., 2021, 3, 144–152 CrossRef.
- N. Schneider, D. M. Lowe, R. A. Sayle and G. A. Landrum, J. Chem. Inf. Model., 2015, 55, 39–53 CrossRef CAS.
- D. S. Wigh, J. Arrowsmith, A. Pomberger, K. C. Felton and A. A. Lapkin, J. Chem. Inf. Model., 2024, 64, 3790–3798 CrossRef CAS PubMed.
- L.-Y. Chen and Y.-P. Li, J. Cheminf., 2024, 16, 74 CAS.
- A. Toniato, P. Schwaller, A. Cardinale, J. Geluykens and T. Laino, Nat. Mach. Intell., 2021, 3, 485–494 CrossRef.
- D. D. Ridley, J. Chem. Inf. Comput. Sci., 2000, 40, 1077–1084 CrossRef CAS.
- T. E. Moock, D. L. Grier, W. D. Hounshell, G. Grethe, K. Cronin, J. G. Nourse and J. Theodosiou, Tetrahedron Comput. Methodol., 1988, 1, 117–128 CrossRef CAS.
- Q.-N. Hu, Z. Deng, H. Hu, D.-S. Cao and Y.-Z. Liang, Bioinformatics, 2011, 27, 2465–2467 CrossRef CAS PubMed.
- Royal Society of Chemistry, The RSC Reaction Ontology (RXNO) – version 2.4.0, 2020, available at https://github.com/rsc-ontologies/rxno Search PubMed.
- E. S. Blurock, J. Chem. Inf. Comput. Sci., 1990, 30, 505–510 CrossRef CAS.
- T.-L. Phan, K. Weinbauer, M. E. G. Laffitte, Y. Pan, D. Merkle, J. L. Andersen, R. Fagerberg, C. Flamm and P. F. Stadler, J. Chem. Inf. Model., 2025, 65, 2882–2896 CrossRef CAS.
- G. Benkö, C. Flamm and P. F. Stadler, J. Chem. Inf. Comput. Sci., 2003, 43, 1085–1093 CrossRef.
- J. L. Andersen, C. Flamm, D. Merkle and P. F. Stadler, Graph Transformation: 9th International Conference, ICGT 2016, in Memory of Hartmut Ehrig, Held as Part of STAF 2016, Vienna, Austria, 2016, vol. 9, pp. 73–88 Search PubMed.
- D. Probst, P. Schwaller and J.-L. Reymond, Digital Discovery, 2022, 1, 91–97 RSC.
- P. Schwaller, B. Hoover, J.-L. Reymond, H. Strobelt and T. Laino, Sci. Adv., 2021, 7, eabe4166 CrossRef PubMed.
- Pistachio, Nextmove Software, http://www.nextmovesoftware.com/pistachio.html Search PubMed.
- W. Hu, B. Liu, J. Gomes, M. Zitnik, P. Liang, V. Pande and J. Leskovec, International Conference on Learning Representations, 2020 Search PubMed.
- B. Liu, B. Ramsundar, P. Kawthekar, J. Shi, J. Gomes, Q. Luu Nguyen, S. Ho, J. Sloane, P. Wender and V. Pande, ACS Cent. Sci., 2017, 3, 1103–1113 CrossRef CAS PubMed.
- D. Probst, M. Manica, Y. G. Nana Teukam, A. Castrogiovanni, F. Paratore and T. Laino, Nat. Commun., 2022, 13, 964 CrossRef CAS PubMed.
- Z. Zeng, J. Guo, J. Jin and X. Luo, J. Cheminf., 2025, 17, 2 CAS.
- K. Tipton and S. Boyce, Bioinformatics, 2000, 16, 34–40 CrossRef CAS.
- S. Chen, R. Babazade and Y. Jung, AI for Accelerated Materials Design - NeurIPS 2023 Workshop, 2023 Search PubMed.
- F. Scarselli, M. Gori, A. C. Tsoi, M. Hagenbuchner and G. Monfardini, IEEE Trans. Neural Network., 2008, 20, 61–80 Search PubMed.
- J. Han, Y. Kwon, Y.-S. Choi and S. Kang, J. Cheminf., 2024, 16, 25 Search PubMed.
- M. Fürer, Linear algebra and its applications, 2010, vol. 432, pp. 2373–2380 Search PubMed.
- K. Xu, W. Hu, J. Leskovec and S. Jegelka, International Conference on Learning Representations, 2019 Search PubMed.
- A. Leman and B. Weisfeiler, Nauchno-Tekh. Inf., 1968, 2, 12–16 Search PubMed.
- N. Schneider, N. Stiefl and G. A. Landrum, J. Chem. Inf. Model., 2016, 56, 2336–2346 CrossRef CAS.
- A. Vaswani, N. Shazeer, N. Parmar, J. Uszkoreit, L. Jones, A. N. Gomez, L. u. Kaiser and I. Polosukhin, Advances in Neural Information Processing Systems, 2017, vol. 30 Search PubMed.
- P. Schwaller, T. Laino, T. Gaudin, P. Bolgar, C. A. Hunter, C. Bekas and A. A. Lee, ACS Cent. Sci., 2019, 5, 1572–1583 CrossRef CAS.
- T.-L. Phan, K. Weinbauer, T. Gärtner, D. Merkle, J. L. Andersen, R. Fagerberg and P. F. Stadler, J. Cheminf., 2024, 16, 82 Search PubMed.
- B. W. Matthews, Biochim. Biophys. Acta Protein Struct., 1975, 405, 442–451 CrossRef CAS.
- K. Sonogashira, Y. Tohda and N. Hagihara, Tetrahedron Lett., 1975, 16, 4467–4470 CrossRef.
- M. Jiang, K. Liu, M. Zhong, R. Schaeffer, S. Ouyang, J. Han and S. Koyejo, ICLR 2024 Workshop on Navigating and Addressing Data Problems for Foundation Models, 2024 Search PubMed.
- V.-T. To, P.-C. Van-Nguyen, G.-B. Truong, T.-M. Phan, T.-L. Phan, R. Fagerberg, P. F. Stadler and T. Truong, J. Chem. Inf. Mod., 2025, 65, 9443–9458 CrossRef CAS.
Footnote |
| † https://github.com/rsc-ontologies |
| This journal is © The Royal Society of Chemistry 2026 |