
 Open Access Article
 This Open Access Article is licensed under a
 Creative Commons Attribution 3.0 Unported Licence
Effect of specific interactions on the double layer capacitance of concentrated ionic systems
Oksana
Patsahan
 a and
Alina
Ciach
*b
a and
Alina
Ciach
*b
aYukhnovskii Institute for Condensed Matter Physics of the National Academy of Sciences of Ukraine, 1 Svientsitskii St., 79011 Lviv, Ukraine
bInstitute of Physical Chemistry, Polish Academy of Sciences, 01-224 Warszawa, Poland. E-mail: aciach@ichf.edu.pl
First published on 23rd January 2026
Abstract
The effect of non-coulombic short-range (SR) interactions on the double-layer capacitance in concentrated ionic systems is studied on a general level within mesoscopic density–functional theory. We improve the formula for the capacitance obtained in our previous work by adding a factor representing the charge of the electrode consistent with the formalism of the mesoscopic theory. Perfect agreement with the Debye capacitance for dilute electrolytes, and a fair agreement with simulations for concentrated electrolytes is obtained for the restricted primitive model (RPM). Explicit formulas for the potential of zero charge (PZC) and the capacitance at the PZC are obtained for the RPM with additional attractive SR interactions between like ions and with different SR cation–electrode and anion–electrode interactions. The capacitance at the PZC has the form of the original Helmholtz capacitance, with the distance of the virtual monolayer of counterions from the electrode that has the same dependence on the lengths characterizing the oscillatory decay of the charge density as in the RPM. These lengths, however, depend significantly on the SR interactions.
I. Introduction
The structure of a double layer in concentrated ionic systems is significantly different from that in dilute electrolytes. In dilute electrolytes, the charge–density decays with the distance z from the electrode as c(z) ∝ exp(−z/λD), where the Debye screening length, λD, is inversely proportional to with ρ denoting the density of ions.1,2 The charge of the electrode is neutralized by the charge of the double layer, and the Debye capacitance concerning a small voltage at the electrode is
  where
where  is the dielectric constant.
In concentrated ionic systems, however, the double layer consists of alternating oppositely charged layers, and the charge density decays as c(z) ∝ exp(−α0z)sin(α1z + θ).3–7 The decay length α0−1 increases with increasing ρ, i.e. it depends on ρ in a completely different way than λD does.7–9 Hence, the Debye length λD is no longer associated with the double-layer thickness. The charge of the electrode is compensated by the integral of c(z) that depends on the two inverse length scales α0 and α1. Because λD does not describe the complex distribution of ions in this case, the capacitance must differ from CD.
Rather surprisingly, it was observed in ref. 10 and 11 that the very first formula for the double-layer capacitance proposed by Helmholtz,  where L is the distance from the electrode of a fixed layer of counterions, quite well describes the capacitance of concentrated electrolytes. In ref. 11 it was shown that alternating layers of counterions and coions can be replaced by a virtual monolayer of counterions placed at the distance L from the electrode that depends on α0, α1. In ref. 11 the formula
 | (1) |
In this work, we propose a very simple definition for the factor f within our mesoscopic theory, and obtain fair quantitative agreement with simulations. Next, we use this definition in determining the effect of short-range (SR) interactions on the capacitance at the potential of zero charge (PZC), which is our main goal in this work.
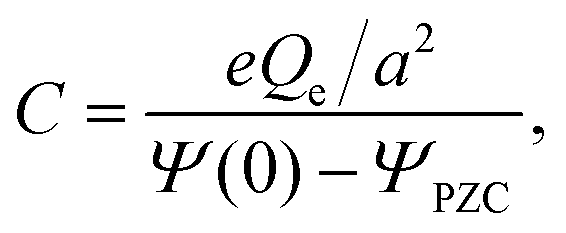
The effect of the SR interactions was studied in particular in ref. 13–22, but in the majority of theoretical studies on the capacitance, the specific SR interactions are neglected. The theoretical results obtained for the potential Ψ are compared with the experimental results obtained for Ψ − ΨPZC. ΨPZC is the potential at the uncharged electrode in contact with the ionic solution. It is induced by a selectivity of the electrode that attracts more strongly one type of ion by the SR forces. PZC is a signature that the SR anion–electrode and cation–electrode interactions are different. The van der Waals interactions between the ions in IL and metallic electrodes can be strong, as measured for the gold electrode and fluorine-free phosphonium-based ionic liquids in ref. 23. A signature of the SR ion–ion interactions in the bulk is the phase transition between ion-rich and ion-poor phases, i.e. the miscibility gap, with the critical density of ions similar to the critical density of the gas–liquid phase separation in neutral fluids.24,25 The strength of these interactions is proportional to the critical temperature of this transition. The SR interactions include direct van der Waals interactions between the ions, H-bond formation, as well as effective solvent-mediated interactions in the approach with implicit solvent.
The strength and range of the SR interactions strongly depend on the type of the system. In the case of organic ions dissolved in water, the solvent-induced effective interactions are stronger than the van der Waals interactions. These forces having rather complex origins are called hydrophobic attraction26 and are responsible for aggregation of hydrophobic particles (or ions) in water. In particular, in systems such as aqueous solutions of 1-butyl-3-pentylimidazolium bistriflimide, 1-butyl-3-isopentylimidazolium bistriflimide, and 1-butyl-3-cyclopentylimidazolium bistriflimide,25 hydrophobic attraction leads to phase separation, with the critical temperature around 400 K.
In general, the SR interactions may significantly influence the distribution of the ions, as observed for the so-called antagonistic salts,17–19 or for water in salt systems.20–22 In particular, the inverse lengths α0 and α1 may depend on the SR interactions, thus leading to the dependence of C on the SR interactions as well. A notable example is the concentrated lithium bis(trifluoromethylsulfonyl)-imide (LiTFSI) in water, where the hydrophobic attraction between organic anions is strong enough to induce their aggregation and separation from hydrated Li+, by which alternating oppositely charged regions of mesoscopic size are formed.20–22
In order to answer the question of how the SR interactions influence the capacitance on a general qualitative level, we consider in this work the RPM with additional SR interactions of a simple mathematical form but with various strengths. We do not try to model any particular system, but rather to obtain a general qualitative picture for mixtures of ions with neutral solvents that can phase separate into ion-poor and ion-rich phases. More complex systems, such as binary solvents, are not considered here. We calculate the charge profile and determine the capacitance at the PZC within our mesoscopic version of the density functional theory.7
In Section II A, we introduce the interaction potentials and estimate the physical range of the parameters in the SR interaction potential. In Section II B, we apply the formalism of the mesoscopic DFT to the RPM+SR model and describe the approximations that we use for determination of the structure in the bulk. The methods and approximations used in studies of the effect of the electrode in this model are described in Section II C. Results for the bulk are presented in Section III A. Capacitance in the pure RPM with the new definition of the charge at the electrode within our mesoscopic theory is obtained for dilute and concentrated electrolytes in Section III B. The results for the charge profile, PZC and capacitance in the RPM+SR model are shown in Section III C. The last section contains concluding remarks.
II. Model and theory
A. Model
In our simplified model, the solvent is characterized by the dielectric constant . In addition, it may induce effective interactions between the ions. We assume that in the effectively two-component system, the pair interaction potentials between two ions with hard spheres of diameter a, for r > a can be presented in the form:
| Vij(r) = VCij(r) + VAij(r)δKrij, i, j = +, − | (2) |
 | (3) |
 | (4) |
We limit ourselves to systems with anions and cations with different chemical natures, where the SR cross-interactions are significantly weaker than the SR interactions between ions of the same sign. Based on this assumption, in our approximate theory the SR interactions between the anions and the cations are neglected. For VAii(r) we assume a short-range attractive potential. The form of the sum of the direct (van der Waals type) and solvent-induced interactions is unknown, but we assume that its detailed shape is not necessary for studies of the collective phenomena such as the long-distance correlations. For simplicity of calculations, we assume the attractive Yukawa potentials,
 | (5) |
 has units of a−1, and we assume that
  to assure fast decay of these interactions.
  measures the strength of the effective non-Coulomb interactions in units of EC and we assume
  . Then, VA++ = VA−− = VA. The interaction potentials V++(r) = V−−(r) and V+−(r), and their Fourier transforms are shown in Fig. 1 for 0 ≤ ε* ≤ 1.5, where the explicit expressions for ṼC(k) and ṼA(k) are
 | (6) |
 | (7) |
 | ||
| Fig. 1 The interaction potentials Vij(r) for the model with ε* = 0, 0.5, 1, and 1.5 in real space (a) and in Fourier representation (b). Vij are in units of EC. r and k are in a and a−1 units, respectively. | ||
According to ref. 27–29, the strength of the van der Waals interactions in various systems is in the range 0–10kBT. Based on the literature data,25 we expect that the physically relevant strength of the SR interactions in our EC units is 0 ≤ ε* ≤ 1.
B. Approximate theory for the structure in the absence of boundaries
In this section, we briefly summarize the mesoscopic density functional theory,7 fix the notation, and present results for the structure in the bulk for the model presented in Section II A. The theory is based on the assumption that the density and charge of each ion are both uniformly distributed over the hard core. Local volume fractions πρi(r)/6 in regions of linear size a around r are equal to the fraction of the volume of the considered region that is occupied by the cores of the i-th type ions. ρi(r) denotes the corresponding dimensionless density. By this construction, continuous functions are obtained for each microscopic configuration. Because of the symmetry of the assumed interaction potentials, it is convenient to change the variables to the dimensionless charge and number density of ions,| c(r) = ρ+(r) − ρ−(r), ρ(r) = ρ+(r) +ρ−(r). |
The average charge in a region of the linear size ∼a vanishes in the absence of boundaries or external fields because the probability that the considered region is occupied by a positively or negatively charged ion is the same. In dilute electrolytes, the considered region is most probably occupied by the solvent and the most probable and average local charge are both equal to zero. In contrast, in concentrated ionic systems such as ionic liquids, the most probable and average charge in the region of the linear size ∼a is significantly different, because for a very small density of the solvent this region is most probably occupied by either an anion or a cation. Moreover, in the most probable configurations the nearest neighbors are oppositely charged, because in this case the electrostatic energy is minimized. Thus, the dominant fluctuations of the local charge, ϕ(r), have a form of charge waves and should be taken into account. Since 〈ϕ(r)〉 = 0, the appropriate measure of such fluctuations is the variance 〈ϕ(r)2〉 of the local charge in a region of the linear size ∼a. In the bulk this variance is independent of the position. To highlight the significance of the charge fluctuations in concentrated ionic systems, we illustrate schematically the qualitative shape of the probability of the local deviation of the charge from the average value (zero in the bulk) in Fig. 2.
 | ||
| Fig. 2 Schematic illustration of the type of the probability p(ϕ) of the deviation ϕ of the charge from the average value in regions of the linear size ∼a for dilute electrolytes (dashed blue line) and for ionic liquids (continuous red line). The average charge vanishes in the two cases, but in the case of concentrated ionic systems, fluctuations of the charge in regions of the linear size ∼a are large and should be taken into account. | ||
In the theory developed in ref. 7 and 9, the grand potential functional of c(r) and ρ(r) is split in two parts, one with frozen mesoscopic fluctuations, i.e. of the mean-field (MF) type and denoted by Ωco, and the other one containing the fluctuation contribution and denoted by Ωfl,
| βΩ[c, ρ] = βΩco[c, ρ] + βΩfl[c, ρ], | (8) |
 | (9) |
On the level of the self-consistent Gaussian approximation, we assume that in eqn (9)
 | (10) |
![[C with combining tilde]](https://www.rsc.org/images/entities/i_char_0043_0303.gif) cc(k) is the charge–charge correlation function in Fourier representation and
cc(k) is the charge–charge correlation function in Fourier representation and | (11) |
For the model discussed in Section II A, the grand thermodynamic potential functional in the presence of the mesoscopic constraints (frozen mesoscopic fluctuations) can be written in the form

and

with Ṽcc(k) and Ṽρρ(k) having the form:

 | (12) |
 | ||
| Fig. 3 The Fourier transforms Ṽcc(k) and Ṽρρ(k) for the model with ε* = 0, 0.5, 1, and 1.5. | ||
f h(c(r), ρ(r)) is the free-energy density of the hard-core reference system,
βfh = ρ+![[thin space (1/6-em)]](https://www.rsc.org/images/entities/char_2009.gif) lnρ+ + ρ−lnρ− + βfhs[ρ], lnρ+ + ρ−lnρ− + βfhs[ρ], | (13) |
![[small rho, Greek, tilde]](https://www.rsc.org/images/entities/i_char_e0e4.gif) (k) for k → 0. For the above reasons, for determination of the electrostatic properties and the phase separation between ion-poor and ion-rich phases, the local-density approximation can be applied, and we assume for fhs(ρ) the Carnahan–Starling approximation.30
(k) for k → 0. For the above reasons, for determination of the electrostatic properties and the phase separation between ion-poor and ion-rich phases, the local-density approximation can be applied, and we assume for fhs(ρ) the Carnahan–Starling approximation.30
The theory summarized above allows calculation of the correlation functions. The second functional derivative of βΩ with respect to c is7
 | (14) |
 | (15) |
For k ≈ k0eqn (14) takes the approximate form7
 | (16) |
cc(k) is an even function of k. In this approximation, the variance of the local charge density is given by ref. 7 and 9 | (17) |
cc(k) when lBρ > 1, as already discussed in ref. 7 for the pure RPM. For small lBρ, the approximation (16) is valid for too small regions of k, and the inverse Fourier transform of a(k)−1 to the real space gives the wrong results.7,11 In this work, however, we limit ourselves to a large density of ions at relatively low T*, i.e. to the ion-rich phase, where the approximation cc(k) ≈ a(k) is valid on a semiquantitative level as will be shown in Section III.
The SR interactions may induce macroscopic phase separation into ion-poor–ion-rich phases. As we are interested in the double-layer capacitance in the ion-rich phase, we should make sure that the considered thermodynamic parameters do not correspond to a two-phase region. To estimate the range of T* and ρ corresponding to the one-phase region, we determine the instability with respect to the gas–liquid type of phase separation in the MF approximation. The MF spinodal is given by MFρρ(0) = 0, where
 | (18) |
C. Approximate theory for a semi-infinite system
In this section we derive the Euler–Lagrange (EL) equation for the charge density near the electrode for the RPM+SR model introduced in Section II A, using the mesoscopic theory presented in Section II B. Following ref. 11, we assume that the charge of the electrode belongs to the system. We also assume that c and ρ depend only on the distance from the electrode. In the case of lateral inhomogeneity, one should consider c and ρ averaged over the planes parallel to the electrode, as done in ref. 38. The system as a whole is charge neutral, and contains the whole charge of the electrode and of the ionic solution, meaning that c(z) = 0 for z < 0. As in ref. 11, we assume that the charge of the electrode is accumulated on its flat surface. In our theory, πρi(z)/6 is the fraction of the volume of the layer with the mid-plane at z and a thickness a that is covered by the i-th type ions. Because of that, we chose z = 0 inside the electrode, at the distance a/2 from its surface. For this choice of z = 0, we ensure that a layer with a center at z < 0 contains contributions neither from the charge localized at the surface of the electrode nor from the charge of the ions in the liquid. As a result, the charge neutrality condition takes the simple form . The system is illustrated in Fig. 4.
 | ||
Fig. 4 Top: Cartoon with a particular distribution of ions with positive (blue) and negative (red) charges near an electrode. The yellow region is the part of the electrode included in the considered system with z ≥ 0. The surface of the electrode is indicated by the dashed line. Bottom: An example of the dimensionless charge density c(z) = ρ+(z) − ρ−(z), with z in units of the ion diameter a. In the mesoscopic theory, πρi(z0)/6 is the fraction of the volume between the surfaces indicated by the dotted lines in the cartoon above the plot that is covered by the i-th type ions. Note that ρi(z0) depends on the distribution of the i-th type ions in the vicinity of the plane at z = z0. The dimensionless charge of the electrode in this mesoscopic theory is  . . | ||
In the presence of the electrode, the equilibrium distribution of the ions is determined by the minimum of the excess grand potential
ΔβΩ[![[small rho, Greek, macron]](https://www.rsc.org/images/entities/i_char_e0d1.gif) ; c, Δρ] = βΩ[c, + Δρ] − βΩ[0, ] + βUwall, ; c, Δρ] = βΩ[c, + Δρ] − βΩ[0, ] + βUwall, |
and ![[c with combining macron]](https://www.rsc.org/images/entities/i_char_0063_0304.gif) = 0 are the dimensionless density and charge of the ions in the bulk, respectively, and Δρ(z) and c(z) are the dimensionless excess density and charge at the distance z from the system boundary. βUwall is the contribution to the grand potential associated with direct SR interactions between the ions and the electrode, and has the form
= 0 are the dimensionless density and charge of the ions in the bulk, respectively, and Δρ(z) and c(z) are the dimensionless excess density and charge at the distance z from the system boundary. βUwall is the contribution to the grand potential associated with direct SR interactions between the ions and the electrode, and has the formwhere A is the electrode surface, h+(z) and h−(z) describe interactions with the uncharged electrode of the cations and the anions, respectively, h(z) = (h+(z) − h−(z))/2, and the dots refer to the contribution depending on Δρ that is not relevant for the electrostatic properties. The form of h±(z) strongly depends on the chemical nature of the ions and the electrode,27,28,39 but in general both h+(z) and h−(z) are of a short range. In systems where preferential adsorption of either the anions or the cations at the uncharged electrode takes place, the ranges and amplitudes of h+(z) and h−(z) are not the same. Since the plane with z = 0 is located inside the electrode, in our model h±(z) → 0 for z → 0.

For small voltage and weak surface selectivity, c(z) and Δρ(z) are small, and we can Taylor expand βΩ[c, + Δρ] − βΩ[0,] in terms of c(z) and Δρ(z). For and = 0 corresponding to the equilibrium in the bulk, the first functional derivatives vanish, and the lowest-order term in the Taylor expansion is of second order in the fields c(z) and Δρ(z). In Fourier representation, the second functional derivatives are given by cc(k) and ρρ(k) (see Section II B). For concentrated ionic solutions, we chose the approximation cc(k) ≈ a(k) (see eqn (16)), as previously done for the RPM in ref. 38. Returning from the Fourier to the real-space representation and performing the standard minimization procedure, we obtain the following EL equation for the equilibrium charge distribution
 | (19) |
| A0 = a(k0) + βvk40 | (20) |
| A2 = 2βvk02 | (21) |
| A4 = βv | (22) |
cc(k) about k = k0, i.e. to a(k) (see (16)). For more details concerning derivation of (19) in the case of pure RPM see ref. 11 and 38. In our model k0, a(k0) and βv depend on both the Coulomb and the SR interactions (see (6), (7) and (12)), and on lB = 1/T*. a(k0) depends in addition on ρR.
III. Results and discussion
In this section, we first focus on the phase separation and the structure of the ion-rich phase. Next, we redefine the capacitance in the present mesoscopic formalism using an alternative definition of the charge of the electrode, and show that the new definition gives much better results for the RPM than the one used in ref. 11. We use this new definition of the charge in the present model, and obtain formulas for the PZC and the capacitance in the presence of the specific interactions.A. Bulk properties of the RPM+SR model
For the model (2)–(5), the resulting equation for the MF gas–liquid type spinodal,MFρρ(0) = 0, has the explicit form: | (23) |
 | ||
Fig. 5 Left: The spinodal line of the phase separation into ion-poor–ion-rich phases for the model with ε* = 0.5, 1, and 1.5. Charge fluctuations are taken into account in the self-consistent Gaussian approximation, and the fluctuations of ρ are neglected (see Section II B), so that the presented spinodal lines are on the MF level with respect to ρ. Right: Structure factor S(k) = cc(k)−1/ρ for the charge–charge correlations for ρ = 0.8, T* = 0.5 and ε* = 1 in the self-consistent Gaussian approximation. Solid and dashed lines denote the structure factor for cc(k) given in eqn (14), and for the approximation a(k) given in eqn (16), respectively. k is in a−1 units. T* = kBT/EC and ε* is the SR interaction between like ions in units of  . . | ||
The critical temperature (maximum of T* at the spinodal) increases linearly with the strength ε* of the SR interactions. We compared our result with the experimentally obtained critical temperature for an aqueous system of imidazolium-based ionic liquids,25 and verified that the physically relevant strength of the SR interactions in EC units is ε* ∼ 1. For the estimation of the order of magnitude of ε* for an aqueous system of imidazolium-based ionic liquids see the Appendix.
The structure factor of the charge–charge correlations, S(k) = cc(k)−1/ρ, is shown in Fig. 5 for ρ = 0.8, T* = 0.5 and ε* = 1. The agreement between cc(k) (eqn (14)) and the approximation a(k) (eqn (16)) is satisfactory on the semiquantitative level, and we shall use the approximate analytical theory based on a(k) in studies of the capacitance.
The SR interactions in Fourier representation, ṼA(k), take the minimum for k = 0, therefore with increasing amplitude ε* of these interactions, the minimum of Ṽcc(k) = ṼC(k) + ṼA(k)/2 moves to smaller k. The period, 2π/α1 ≈ 2π/k0, and the range α0−1 of the oscillatory decay of the charge–charge correlations both increase monotonically with increasing strength of the SR attraction between ions with the same charge. Ṽcc(k0) is a nonmonotonic function of ε* as a result of competition between ṼC(k) and ṼA(k) for k between the minimum of ṼC(k) and the minimum of ṼA(k). In Fig. 6, the energy gain Ṽcc(k0) associated with the dominating charge waves, the corresponding wavenumber k0, the correlation length of the charge–charge correlations, 1/α0, as well as the density ρR of ‘free’ ions, are shown for cc(k) approximated by a(k) (see (16)). α0 is given by an analytic expression (see the Appendix).
 | ||
| Fig. 6 (a) The minimum of the interaction potential Ṽcc(k) (see (12)), (b) the wavenumber of the most probable charge waves k0 ≈ α1, (c) the charge–charge correlation length α0−1 and (d) the renormalized dimensionless density of ions ρR (eqn (15)) related to 'free' ions in the self-consistent Gaussian approximation, for T* = 0.5 and ρ = 0.8. Ṽcc and the strength of the SR interactions between ions of the same sign, ε*, are in EC units, k0 and α0 are in 1/a units, and ρR is dimensionless. | ||
The variance of the local charge, 〈ϕ2〉 (related to the amplitude of the charge wave) takes a minimum for ε* ≈ 0.7 corresponding to k0 ≈ 2.1 for which the average thickness of the alternating charged layers, π/k0, is very close to 1.5 (in a units). It corresponds to a crossover from alternating charged monolayers to alternating charged bilayers, i.e. to weaker charge ordering in instantaneous states. The minimum of 〈ϕ2〉 corresponds to the maximum of the renormalized density of ions, ρR (see eqn (15)), related to the density of ‘free’ ions in the concentrated system. This means that when the ordering into charge waves (charge–neutral aggregates in real space) becomes weaker and 〈ϕ2〉 takes a minimum, then more 'free' ions are present in the system.
B. Capacitance in the pure RPM with the new definition of the charge at the electrode
The linear eqn (19) can be solved rather easily for fixed c(0) and under the charge-neutrality condition . When c(z) is known, we can obtain the electrostatic potential from the formula
 | (24) |
where e is the elementary charge and eQe/a2 is the charge of the electrode per unit area. We limit ourselves to small voltages, so that the linearized EL eqn (19) is a fair approximation in the ion-rich phase.

In ref. 11 limited to pure RPM, the solution of the more general linearized EL equation (based on cc(k) rather than on a(k)) was obtained and the charge at the electrode per unit area was identified with eσ0 = ec(0)/a2. For small and large ρ, a monotonic and an oscillatory asymptotic decay of c(z) for z → ∞ was obtained, respectively. The two cases are separated by the Kirkwood line3,40 on the (ρ, T) plane. The obtained capacitance was overestimated in both cases, and we speculated that the missing factor f ∼ 1/3 was associated with the microscopic structure near the electrode that is not accurately determined in the mesoscopic theory.
Let us return to the question of the charge at the electrode. Within our mesoscopic theory, the dimensionless charge inside a layer between z = z0 and z = z1 is given by  . Consistent with the construction of the theory, where the surface of the electrode is at z = 1/2 (in a units), the dimensionless charge of the electrode should be given by
 | (25) |
The charge density on the small-density side of the Kirkwood line in this theory has the form11

where δ = 1 − e−a2/2 + e−a1/2. For a1 > 3, a2 ≪ 1, which is the case for dilute electrolytes,3,41δ ≃ a2/2 + e−a1/2 ≪ 1. The capacitance takes the form

where the first approximate equality holds for a2/a1 ≪ 1, δ ≪ 1, and the last one follows from a2 ≈ a/λD, as shown in ref. 11 for ρ → 0. We should note that in the DH theory, a1 = ∞, and only a single exponential term remains. With the present definition of the charge at the electrode, our theory reduces precisely to the DH theory for dilute electrolytes.

On the large-density side of the Kirkwood line, c(z) decays in an oscillatory way,

 | (26) |
 | (27) |
 . For the parameters α1 ≈ 2.45, α0 ≈ 0.118 corresponding to the conditions assumed in the simulations of ref. 12, we obtain neglecting f in (26)C ≈ 0.5,11 whereas in the simulations the result was Csim ≈ 0.15. Eqn (27) gives for α1 ≈ 2.45, α0 ≈ 0.118 the result f ≈ 0.36, and from (26) we obtain C ≈ 0.18, which agrees much better with the simulations.
The above results for dilute and concentrated electrolytes confirm that if in our mesoscopic theory the charge at the electrode is given by the formula (25), then much more accurate expression for the capacitance is obtained. We shall use (25) for the capacitance and the PZC in the RPM+SR system.
C Capacitance at the PZC in the presence of short-range specific interactions – the case of the ion-rich phase
Here we first consider a selective electrode with the specific electrode–ion interactions that are of a short range, but otherwise are of an arbitrary form. Next, we illustrate our results on a particular example of the potential h(z).The solution of eqn (19) for the RPM+SR model in the presence of the selective electrode has the form
| c(z) = c0(z) + Δc(z) | (28) |
 | (29) |
and relevant for Ψ(0) and Qe, satisfy

 for i = 1, 2.
The amplitude and phase in (29) are determined by the charge-neutrality condition,  and by the value Qe of the charge at the electrode (see (25)), and depend on the form of Δc through I1(0) and I1(1/2). The corresponding equations for θ and A are given in the Appendix.
The electrostatic potential at z = 0 for the considered form of c(z) can be obtained from (24). Using (24) and (29) and the expressions for cotθ and A given in the Appendix, we obtain

with

which is identified with the PZC.

The capacitance at the PZC,
 , a, α0 and α1. The inverse lengths α0 and α1 ≈ k0 characterize the bulk structure and depend on ε*, as shown in Fig. 6. Thus, C is independent of the specific electrode–ion interactions, and as a function of ε* is shown in Fig. 7. We obtain almost linear decrease of C/CH with increasing ε*. The attractive SR interactions between the ions with the same charge compete with the repulsive Coulomb potential, and lead to a larger period and larger decay length of the oscillatory decay of c(z).
 | ||
Fig. 7 The capacitance C at the PZC in units of the Helmholtz capacitance  . T* = 1/lB = 0.5, and ρ = 0.8. The strength of the specific ion–ion interaction ε* is in EC units. . T* = 1/lB = 0.5, and ρ = 0.8. The strength of the specific ion–ion interaction ε* is in EC units. | ||
To illustrate our result for ΨPZC on a particular example, we consider an uncharged electrode adsorbing anions and assume
| h(z) = z(h+e−λ+z − h−e−λ−z). | (30) |
| Δc(z) = −h+e−λ+z(b+0 + b+1z) + h−e−λ−z(b−0 + b−1z), | (31) |
 | ||
| Fig. 8 The dimensionless charge density profile at the uncharged electrode (Qe = 0) for T* = 1/lB = 0.5, ρ = 0.8, the strength of the specific ion–ion interactions ε* = 1 and the potential h(z) given in (30) with h+ = 1, h− = 0.7, λ+ = 1.1 and λ− = 0.8. z is in units of the ion diameter. The vertical dashed line at z = 1/2 indicates the position of the surface of the electrode. The behaviour of Δc(z) is shown in the inset. For 0 < z < 1, c(z) contains contributions from the ions and the surface charge, because in our mesoscopic theory the charge is homogeneously distributed over the ionic core and c(z) is proportional to the difference between the fraction of the layer with the thickness 1 and the mid-plane at z that is occupied by the cations and the anions (see Fig. 4). | ||
For an anionophilic uncharged electrode, we obtain a layer of anions at the electrode's surface that in the case of a large density of ions is followed by a layer of cations because of the strong electrostatic attraction. The cation-rich layer attracts in turn anions, and alternating layers with decreasing charge are formed with increasing distance from the electrode. The layer of anions adsorbed due to the selectivity of the uncharged electrode leads to the same distribution of ions at large distances from the electrode as in the case of a charged nonselective electrode.
The charge distribution induced by the selectivity of the uncharged electrode leads to the PZC that is shown in Fig. 9 for the considered example of the electrode–ion interactions. We verified that for different forms of the interactions h(z), the dependence of ΨPZC on the specific ion–ion interactions is nonmonotonic too, and the largest magnitude is taken for ε* ≈ 0.7. As shown in Fig. 6, the density of ‘free’ ions, ρR, takes a maximum for the same value of ε*. From the mathematical point of view, ΨPZC depends on Δc, and Δc depends in particular on A0 that is a function of ρR. In Section III A we argued that the specific interactions counteract the charge-ordering induced by the Coulomb forces, and that for ε* ≈ 0.7 a crossover between alternating charged monolayers and bilayers occurs. Instantaneous distributions of ions differ strongly from the smooth average distribution in this case, and because of weaker ordering, more ‘free’ ions are present and contribute to the PZC.
 | ||
Fig. 9 The PZC in  units for T* = 1/lB = 0.5, ρ = 0.8 and the potential h(z) given in (30) with h+ = 1, h− = 0.7, λ+ = 1.1 and λ− = 0.8. The strength of the ion–ion interaction ε* is in EC units. units for T* = 1/lB = 0.5, ρ = 0.8 and the potential h(z) given in (30) with h+ = 1, h− = 0.7, λ+ = 1.1 and λ− = 0.8. The strength of the ion–ion interaction ε* is in EC units. | ||
D. Discussion
Predictions of our theory concern the ratio C/CH between the double-layer capacitance of concentrated electrolytes, molten salts, IL and IL mixtures, and the Helmholtz capacitance . The ratio C/CH (see (26) and (27)) depends only on the decay length 1/α0 and wavenumber α1 of the exponentially damped charge oscillations (see (29)). α0 and α1 obtained in our theory in 1/a units can be compared with the corresponding parameters determined relatively easily in atomistic simulations and experiments. The Helmholtz capacitance, however, depends on the relative dielectric constant
  and the average diameter a of the ions that are input parameters in our theory. Unfortunately, determination of
  in the double-layer region is problematic, and it is difficult to find reliable data in the literature. In addition, in the case of the strongly asymmetric shape of ions that is typical for many IL, their different orientations in the layers parallel to the electrode lead to different thicknesses of these layers. Because the double-layer capacitance depends strongly on
  and a, we must compare our results with the existing data for the double-layer capacitance,
  and a that have limited accuracy and are often different in different sources.
Nevertheless, here we try to compare our predictions with experiment and atomistic simulations. We first note that swelling of alternating charged layers in the presence of strong SR interactions predicted by our theory was indeed observed experimentally in the case of the lithium bis(trifluoromethanesulfonyl)imide (LiTFSI) salt in water.20,21 In this water-in-salt electrolyte, the SR interactions induce aggregation of the hydrophobic anions into bilayers separated by layers of hydrated Li+ ions. In ref. 22 we obtained α0 = 0.225 and α1 = 1.613 in the same type of mesoscopic theory, but with the size-asymmetry of ions explicitly taken into account. These inverse lengths are in fair agreement with previous experiment,21 and inserted into (26) give
| C/CH = 1.06. | (32) |
 we obtain
  . MD simulations give C = 5.6 µF cm−2 and C = 10 µF cm−2 for negative and positive charge electrodes because of different ionic sizes.42 Typical values of
  in IL,
  gives C ≈ 9.5 µF cm−2. In the present simplified theory the large size difference is not accounted for and quantitative agreement is not expected.
Another example of a common IL is 1-butyl-3-methylimidazolium tetrafluoroborate ([BMIM][BF4]), for which the results of atomistic simulations were fitted to (29) with α0 = 1.2 nm−1 and α1 = 10.3 nm−1. The ions are elongated and the simulations indicate that the long axis is parallel to the electrode, therefore we assume a = 0.4 nm, and obtain
| C/CH = 2.887 | (33) |
 gives
gives  . In the simulations, T ≈ 298 K, and
  was assumed. Experimental result for the capacitance at room temperature of [BMIM][BF4] is C ≈ 6.5 µF cm−2.43 In the bulk,
  in this system, but the value of
  near an electrode can be significantly reduced.10,44,45
It should be noted that in the electrode–electrolyte systems, the total capacitance is given by 1/C = 1/CDL + 1/CEL.43,46,47 Our theory concerns only the double layer capacitance CDL. The contribution 1/CEL coming from the electrode is material dependent and requires separate consideration that is beyond the scope of this work.
To summarize, we obtain a semiquantitative agreement with atomistic simulations and experiment even in the very complex systems. However, the contribution to the capacitance associated with the distribution of ions near an electrode should be supplemented with predictions from a microscopic theory for the dielectric constant in the double layer to allow for a quantitative comparison with experimental results for C. Alternatively, precise experimental data for C,  and a in the same system under the same conditions is necessary.
The PZC increases with increasing moments of Δc(z) that in turn is an increasing function of the specific interactions between the ions and the electrode. This result is in agreement with experiments, where the selectivity of the electrode is identified with the selective adsorption at the uncharged electrode that in our theory is described by Δc(z).43 We observed also the dependence of the PZC on the SR interactions between the ions, and our conclusion that the PZC increases with increasing number of ‘free’ ions is also in line with experimental observations.43
IV. Concluding remarks
In the first part of the article, we improved the definition of the double-layer capacitance derived for concentrated ionic systems in ref. 11 within the mesoscopic theory. Here, we propose a definition of the charge of the electrode, eqn (25), consistent with the construction of the mesoscopic theory. We obtain perfect agreement with the Debye capacitance for dilute electrolytes, and for concentrated ones we obtain for Ceqn (26) with (27) that is in fair quantitative agreement with simulations for the RPM.In the second part we consider the RPM model with additional SR attractions between ions of the same charge and with specific ion–electrode interactions. We show that the double-layer capacitance at the PZC, C is given by the same simple formula as in the RPM (eqn (26)). This means that C/CH at the PZC depends on the SR only through the inverse lengths α0 and α1 characterising the bulk structure, and is independent of the ion–electrode interactions. This result confirms that it is justified to compare theoretical results obtained with neglected ion–electrode interactions for the potential Ψ(0) with the experimental results obtained for Ψ(0) − ΨPZC.
Because the same expression was obtained for the pure RPM and also for the RPM+SR systems, the formula (26) for the capacitance at the PZC is generally valid and can be applied to any ionic system with oscillatory decay of the charge–charge correlations. The ion–ion interactions, however, have a rather strong effect on the inverse lengths α0 and α1 (Fig. 6) and hence on C. When like ions attract one another with short-range forces, the capacitance at the PZC decreases, as shown in Fig. 7.
We obtained the PZC in terms of the charge profile for the ion–electrode interactions h(z) of a general form, and illustrated our result on a particular example of anionophilic electrode. The absolute value of the ΨPZC takes a maximum for the strength of the specific ion–ion interactions that counteracts the charge ordering into neutral aggregates, thus leading to the largest density of ‘free’ ions.
Conflicts of interest
There are no conflicts of interest to declare.Data availability
All formulas derived in this work are included in the article and the appendix. The figures were obtained from these formulas. No other data were used.Appendices
Appendix
 | (34) |
 obtain
  . We next assume that the static dielectric constant
  at the critical concentration is
  and finally obtain ε* ≈ 1. The above estimations indicate that the ratio between the amplitude of the SR interactions in (5) and the Coulomb potential between monovalent bulky ions at contact is in the order of unity in physically relevant substances. In the case of simple salts like NaCl, we expect ε* < 1.
The phase θ and the amplitude A in c0(z) in the presence of the specific electrode–ion interactions satisfy the following equations

and

where f is given in (27), and we used (25).

The coefficients in (31) take the forms
| b±0 = 2λ±(2A4λ±2 + A2)(b±1)2, |
| b±1 = (A4λ±4 + A2λ±2 + A0)−1, |
References
- P. W. Debye and E. Hückel, Zur Theorie der Elektrolyte. I. Gefrierpunktserniedrigung und verwandte Erscheinungen, Phys. Z., 1923, 24, 185–206 CAS.
- J. L. Barrat and J. P. Hansen, Basic Concepts for Simple and Complex Liquids, Cambridge University Press, 2003 Search PubMed.
- R. J. F. L. de Carvalho and R. Evans, The decay of correlations in ionic fluids, Mol. Phys., 1994, 83, 619–654 Search PubMed.
- M. V. Fedorov and A. A. Kornyshev, Ionic liquid near a charged wall: structure and capacitance of electrical double layer, J. Phys. Chem. B, 2008, 112, 11868–11872 CrossRef CAS PubMed.
- M. V. Fedorov and A. A. Kornyshev, Ionic liquids at electrified interfaces, Chem. Rev., 2014, 114, 2978 CrossRef CAS PubMed.
- J. M. Otero-Mato, H. Montes-Campos, O. Cabeza, D. Diddens, A. Ciach and L. J. Gallego, et al., 3D Structure of the Electric Double Layer of Ionic Liquid-Alcohol Mixtures at the Electrochemical Interface, Phys. Chem. Chem. Phys., 2018, 20, 30412 RSC.
- A. Ciach and O. Patsahan, Structure of ionic liquids and concentrated electrolytes from a mesoscopic theory, J. Mol. Liq., 2023, 377, 121453 CrossRef CAS.
- R. M. Adar, S. A. Safran, H. Diamant and D. Andelman, Screening length for finite-size ions in concentrated electrolytes, Phys. Rev. E, 2019, 100(4), 042615 CrossRef CAS PubMed.
- A. Ciach and O. Patsahan, Correct scaling of the correlation length from a theory for concentrated electrolytes, J. Phys.: Condens. Matter, 2021, 33, 37LT01 CrossRef CAS PubMed.
- S. Park and J. G. McDaniel, Generalized Helmholtz model describes capacitance profiles of ionic liquids and concentrated aqueous electrolytes, J. Chem. Phys., 2024, 160(16), 164709 CrossRef CAS PubMed.
- A. Ciach and O. Patsahan, Mesoscopic theory for a double layer capacitance in concentrated ionic systems, Phys. Chem. Chem. Phys., 2025, 27, 9143–9151 Search PubMed.
- M. V. Fedorov and A. A. Kornyshev, Towards understanding the structure and capacitance of electrical double layer in ionic liquids, Electrochim. Acta, 2008, 53, 6835–6840 CrossRef CAS.
- C. Cruz, A. Ciach, E. Lomba and S. Kondrat, Electrical double layers close to ionic liquid-solvent demixing, J. Phys. Chem. C, 2019, 123, 1596–1601 CrossRef CAS.
- A. Iglič, E. Gongadze and V. Kralj-Iglič, Differential capacitance of electric double layer – influence of asymmetric size of ions, thickness of stern layer and orientational ordering of water dipoles, Acta Chim. Slov., 2019, 66(3), 534–541 Search PubMed.
- J. Yang, S. Kondrat, C. Lian, H. Liu, A. Schlaich and C. Holm, Solvent Effects on Structure and Screening in Confined Electrolytes, Phys. Rev. Lett., 2023, 131(11), 118201 CrossRef CAS PubMed.
- M. Dinpajooh, E. Biasin, E. T. Nienhuis, S. T. Mergelsberg, C. J. Benmore and G. K. Schenter, et al., Detecting underscreening and generalized Kirkwood transitions in aqueous electrolytes, J. Chem. Phys., 2024, 161, 151102 Search PubMed.
- K. Sadakane, A. Onuki, K. Nishida, S. Koizumi and H. Seto, Multilamellar structures induced by hydrophilic and hydrophobic ions added to a binary mixture of D20 and 3-methylpyridine, Phys. Rev. Lett., 2009, 103, 167803 CrossRef PubMed.
- J. Leys, D. Subramanian, E. Rodezno, B. Hammouda and M. A. Anisimov, Mesoscale phenomena in solutions of 3-methylpyridine, heavy water, and an antagonistic salt, Soft Matter, 2013, 9, 9326 Search PubMed.
- F. Pousaneh, A. Ciach and A. Maciołek, How ions in solution can change the sign of the critical Casimir potential, Soft Matter, 2014, 10, 470–483 RSC.
- O. Borodin, L. Suo, M. Gobet, X. Ren, F. Wang and A. Faraone, et al., Liquid Structure with Nano-Heterogeneity Promotes Cationic Transport in Concentrated Electrolytes, ACS Nano, 2017, 11, 10462 CrossRef CAS PubMed.
- T. Groves, C. S. Perez-Martinez, R. Lhermerout and S. Perkin, Surface forces and structure in a water-in-salt electrolyte, J. Phys. Chem. Lett., 2021, 12, 1702–1707 CrossRef CAS PubMed.
- O. Patsahan and A. Ciach, Mesoscopic inhomogeneities in concentrated electrolytes, ACS Omega, 2022, 7, 6655 CrossRef CAS PubMed.
- S. Wang, H. Tao, J. Yang, J. Cheng, H. Liu and C. Lian, Structure and Screening in Confined Electrolytes: The Role of Ion Association, J. Phys. Chem. Lett., 2024, 33, 7147 CrossRef PubMed.
- W. Schröer and V. R. Vale, Liquid–liquid phase separation in solutions of ionic liquids: phase diagrams, corresponding state analysis and comparison with simulations of the primitive model, J. Phys.: Condens. Matter, 2009, 21, 424119 CrossRef PubMed.
- J. Rotrekl, J. Storch, P. Velíšek, W. Schröer, J. Jacquemin and Z. Wagner, et al., Liquid Phase Behavior in Systems of 1-Butyl-3-alkylimidazolium bis(trifluoromethyl)sulfonyl imide Ionic Liquids with Water: Influence of the Structure of the C5 Alkyl Substituent, J. Solution Chem., 2017, 46, 1456–1474 CrossRef CAS.
- D. Chandler, Interfaces and the driving force of hydrophobic assembly, Nature, 2005, 437, 7059 CrossRef PubMed.
- C. Merlet, M. Salanne, B. Rotenberg and P. A. Madden, Imidazolium Ionic Liquid Interfaces with Vapor and Graphite: Interfacial Tension and Capacitance from Coarse-Grained Molecular Simulations, J. Phys. Chem. C, 2011, 115, 16613 Search PubMed.
- J. Yang, Y. Ding, C. Lian, S. Ying and H. Liu, Theoretical Insights into the Structures and Capacitive Performances of Confined Ionic Liquids, Polymers, 2020, 12, 722 Search PubMed.
- J. N. Itliong, A. L. Frischknecht, M. J. Stevens and I. Nakamura, Stockmayer fluid simulations for viscosity and glass transition temperature of ionic liquids, J. Chem. Phys., 2025, 163, 044503 Search PubMed.
- N. F. Carnahan and K. E. Starling, Equation of state for nonattracting rigid spheres, J. Chem. Phys., 1969, 51, 635 CrossRef CAS.
- R. Kjellander, Focus Article: Oscillatory and long-range monotonic exponential decays of electrostatic interactions in ionic liquids and other electrolytes: The significance of dielectric permittivity and renormalized charges, J. Chem. Phys., 2018, 148(19), 193701 CrossRef PubMed.
- R. Kjellander, The intimate relationship between the dielectric response and the decay of intermolecular correlations and surface forces in electrolytes, Soft Matter, 2019, 15, 5866 CAS.
- N. Bjerrum, Ionic association. I. Influence of ionic association on the activity of ions, Kgl. Dan. Vidensk. Selsk. Math. Fys. Medd., 1926, 7, 1–48 CAS.
- M. E. Fisher and Y. Levin, Criticality in ionic fluids: Debye-Hückel theory, Bjerrum, and beyond, Phys. Rev. Lett., 1993, 71, 3826–3829 CrossRef CAS PubMed.
- G. Stell and Y. Zhou, Chemical association in simple models of molecular and ionic fluids, J. Chem. Phys., 1989, 91(6), 3618–3623 Search PubMed.
- M. F. Holovko and Y. V. Kalyuzhnyi, On the effects of association in the statistical theory of ionic systems. Analytic solution of the PY-MSA version of the Wertheim theory, Mol. Phys., 1991, 73(5), 1145–1157 CrossRef.
- L. Blum and O. Bernard, The general solution of the binding mean spherical approximation for pairing ions, J. Stat. Phys., 1995, 79(3–4), 569–583 Search PubMed.
- A. Ciach, Simple theory for oscillatory charge profile in ionic liquids near a charged wall, J. Mol. Liq., 2018, 270, 138 CrossRef CAS.
- C. Bacon, A. Serva, C. Merlet, P. Simon and M. Salanne, On the key role of electrolyte–electrode van der Waals interactions in thesimulation of ionic liquids-based supercapacitors, Electrochim. Acta, 2023, 455, 142380 CrossRef CAS.
- J. G. Kirkwood, Statistical mechanics of liquid solutions, Chem. Rev., 1936, 19, 275–307 CrossRef CAS.
- A. Ciach, W. T. Góźdź and R. Evans, Effect of a nearby charge-ordered phase on correlation functions in ionic systems, J. Chem. Phys., 2003, 118, 3702 CrossRef CAS.
- Z. Li, G. Jeanmairet, T. Méndez-Morales, B. Rotenberg and M. Salanne, Capacitive Performance of Water-in-Salt Electrolytes in Supercapacitors: A Simulation Study, J. Phys. Chem. C, 2018, 122, 23917 CrossRef CAS.
- V. Lockett, M. Horne, R. Sedev, T. Rodopoulos and J. Ralston, Differential capacitance of the double layer at the electrode/ionic liquids interface, Phys. Chem. Chem. Phys., 2010, 12, 12499 RSC.
- L. Fumagalli, A. Esfandiar, R. Fabregas, S. Hu, P. Ares and A. Janardanan, et al., Anomalously low dielectric constant of confined water, Science, 2018, 360(6395), 1339–1342 CrossRef CAS PubMed.
- A. V. Dubtsov, S. V. Pasechnik, D. V. Shmeliova, A. S. Saidgaziev, E. Gongadze and A. Iglič, et al., Liquid crystalline droplets in aqueous environments: electrostatic effects, Soft Matter, 2018, 14(47), 9619–9630 RSC.
- W. Schmickler, Electronic Effects in the Electric Double Layer, Chem. Rev., 1996, 96(8), 3177–3200 CrossRef CAS PubMed.
- G. Jeanmairet, B. Rotenberg and M. Salanne, Microscopic Simulations of Electrochemical Double-Layer Capacitors, Chem. Rev., 2022, 122(12), 10860–10898 CrossRef CAS PubMed.
| This journal is © the Owner Societies 2026 |