
A first-principles study on the electronic structure of BaSbO3 and electron–phonon coupling in K-doped superconducting antimonate†
Soubhik
Bhattacharyya
 and
P. M.
Sarun
*
and
P. M.
Sarun
*
Functional Ceramics Laboratory, Department of Physics, Indian Institute of Technology (ISM), Dhanbad – 826004, India. E-mail: sarun@iitism.ac.in
First published on 12th January 2026
Abstract
The present study attempts to explore the electronic structure of pure BaSbO3 and the effect of K-doping on the electronic structure and electron–phonon interaction in a K-doped barium antimonate (BKSO) superconductor using the first-principles method. A strong orbital hybridization is found to occur between Sb-s and O-pσ states, which is enhanced in the collapsed octahedra of pure BaSbO3. Also, the degree of the hybridization increases with the increase in K concentration in the system. The O K-edge XANES study reveals that the self-doped holes do not reside on the ligand oxygen in the spσ antibonding orbital. This suppression of oxygen holes in the antimonate is consistent with the positive charge transfer energy of the systems. With increasing K doping in the superconducting antimonate, the electron–phonon coupling strength in the materials decreases. The coupling between the electrons and the phonons corresponding to the oxygen bond-stretching vibrations has a major contribution to the electron–phonon coupling and hence superconductivity in the systems. DFT-GGA calculated values of λ and Tc, using the Migdal–Eliashberg formalism, are heavily underestimated compared to the experimental values. The inclusion of long-range interaction and screening in the calculations by using the HSE06 hybrid functional significantly enhanced the superconducting parameters, resulting in a Tc value of 14.611 K for the material with x = 0.65, which is quite close to the experimental value of 15 K. This study also concludes that the suppression of the oxygen hole in the conduction band serves as a crucial factor for having a lower Tc of antimonate compared to that of superconducting bismuthates.
1 Introduction
Similar to superconducting bismuthates, the recently discovered superconducting antimonates Ba1−xKxSbO31 show some remarkable characteristics in both normal and superconducting phases. This class of materials exhibit maximum superconducting Tc at 15 K for x = 0.65. Unlike the cuprates, where the superconducting state emerges after the suppression of the antiferromagnetic (AFM) ordered state,2 the emergence of superconductivity in both bismuthates and antimonates occurred after the suppression of the charge-density-wave (CDW) state.1,3 This indicates that the appearance of superconductivity in these materials is closely associated with the suppression of the antiferromagnetic (AFM) or charge-density-wave (CDW) states.In the CDW order of BaSbO3, the SbO6 octahedra experience periodic expansion and contraction along each of the three crystallographic axes, demonstrating a phenomenon known as breathing distortion. This unique characteristic results in disproportionate lengths of Sb–O bonds inside the octahedral structure. The bond-disproportionated state is commonly associated with the charge-disproportionated state, in which the nominal valence of Sb, which is tetravalent, is divided into trivalent Sb3+ and pentavalent Sb5+. This phenomenon is known as valence skipping.4 Though this scenario lacks experimental support for BaBiO3, in the antimonate, a clear signal of the existence of Sb3+ and Sb5+ oxidation states was observed in the Mössbauer spectroscopy.5
When pure antimonate undergoes hole doping through the substitution of elements such as potassium (K) at the barium (Ba) site, the charge density wave (CDW) order is diminished, resulting in a transition of the system from an insulating state to a metallic one.1 In the antimonate, the insulating to metallic transition and hence bulk superconductivity occurred at the K-doping level of x ≥ 0.65. At this doping level, all Sb sites become equivalent with an intermediate valence of +4.65.5 Besides this, the system undergoes a structural phase transition from face-centered cubic at x = 0 to tetragonal (x ≈ 0.3) to simple cubic (x ≈ 0.65).1
The present study employs density functional theory (DFT) within the framework of the generalized gradient approximation (GGA)6 to examine the electronic structure of the undoped insulating state in face-centered cubic BaSbO3 and the metallic simple cubic systems with potassium doping.
X-ray absorption spectroscopy (XAS) is a method that probes the transition of core level electrons to higher energy states within the conduction band by absorbing incident photons. The selection of the energy for X-ray photons is not arbitrary. XAS entails analyzing the energy spectrum near the binding energy corresponding to a core level of a specific atomic species within the sample. In this scenario, the electron is elevated from a core orbital to an unoccupied bound or continuum state with an intensity determined by Fermi's golden rule. This is a photoelectric effect, where the incident X-ray excites an electron and a hole is created on the core level of the absorbing atom (known as a core hole). The excited electron is referred to as a photoelectron. The probability of an excitation significantly rises when the energy of the incident photon matches with the core electron's binding energy. In XAS, this is known as an absorption edge. The kinetic energy of photoelectrons determines their mean free path.7 The X-ray absorption near edge structure (XANES) area of the spectrum is located within a range of about 30 to 50 eV from the absorption edge energy, including right before the absorption edge. In the XANES part, the photoelectron's low kinetic energy results in a longer mean free path. This area is primarily dominated by multiple scattering effects. O K-edge XANES spectra have been calculated using DFT to investigate the role of the oxygen hole in pure and K-doped antimonates.
The subsequent section examines the electron–phonon interaction in Ba1−xKxSbO3 (x = 0.65–0.8) utilizing DFT-GGA within the Migdal–Eliashberg framework,8,9 which tends to underestimate the electron–phonon coupling (EPC) in these materials. The present work yields more detailed and converged results of the electron–phonon coupling than the previous literature studies,10,11 as this work employs the maximally localized Wannier function (MLWF) approach for the interpolation of electron–phonon interaction. This technique allows the use of extremely dense k and q-mesh to converge the calculations. The DFT-GGA calculated EPC is underestimated from the experimentally measured value as GGA, which is a semi-local functional, does not incorporate the long-range Coulomb interaction, which presents in the ionic crystals like bismuthate and antimonate. To incorporate the nonlocal electronic correlation through long-range exchange interactions in the DFT calculations, the HSE06 hybrid functional12,13 is used.
2 Computational details
The electronic structures of pure and K-doped BaSbO3 were calculated using the Quantum-espresso package,14 which uses plane-wave basis sets. The calculations utilised GGA as the electronic exchange correlation with the Perdew–Burke–Enzerhof (PBE) functional.15 The incorporation of potassium in the host lattice was simulated using the virtual-crystal approximation (VCA).16 With the help of VCA, the DFT calculations were performed using five-atom simple cubic systems. For the pure and K-doped BaSbO3, gamma-centred Monkhorst–pack17k-meshes of 6 × 6 × 6 and 12 × 12 × 12, respectively, were used for the integration in reciprocal space. The plane wave expansion of the electronic states was conducted with kinetic energy cutoffs set to 120 Ry for both pure and K-doped systems. For the electronic structure calculations of the pure system, GBRV ultrasoft pseudopotentials18 were used. Electronic structure and electron–phonon interaction in K-doped systems were computed using norm-conserving pseudopotentials.19 The geometric optimization of the crystal structures was performed using the BFGS algorithm with the tolerance of the Hellman–Feynman force being adjusted to a value of 0.01 mRy Bohr−1. The Wannier90 package20,21 was utilised to model the low-energy tight-binding model and compute various parameters based on Wannier functions. The net atomic charges of antimony and oxygen were evaluated through Bader's charge analysis, employing the Henkelman program.22,23 This analysis utilized the near-grid algorithm in conjunction with the refine edge method.The O K-edge XANES was calculated using the XSPECTRA code,24 which is a module in Quantum-espresso. In this approach, the X-ray absorption cross-section is determined by a transition operator linking the initial and final states, both of which are obtained as solutions to the Kohn–Sham (KS) equations. For the K-edge, the initial state corresponds to the O 1s orbital derived from an isolated absorbing atom, calculated without considering a core hole. The final state, on the other hand, is obtained by solving the KS equations for the entire system, including the effects of the core hole in the pseudopotential of the absorbing atom.24 To simulate the effect of the core hole, oxygen gauge-including projector augmented wave (GIPAW) pseudopotentials25,26 were used for the absorbing atoms. Supercell calculations were employed to eliminate interactions between the holes and their periodic images. Ref. 24 provides a description of the mathematical foundation of XAS in the ultrasoft pseudopotential scheme, as well as the utilization of the PAW approach for reconstructing the all-electron wave function and acquiring the XANES intensities. The spectral features obtained from the experiments are generally broader than the DFT calculated spectra. This is because the DFT calculations neglect the finite core-hole lifetime. To incorporate this, a broadening parameter γ in the continued fraction method27 was used. The value of γ was chosen as 1.2 eV to reproduce the experimental XANES spectra.
The phonon dispersion calculations in Ba1−xKxSbO3 systems were conducted using 24 × 24 × 24 k-mesh and 4 × 4 × 4 q-mesh comprising 10 independent q-points within the irreducible Brillouin zone. A Gaussian smearing was used to sample the Fermi surface, with a width of 0.01 Ry. To ensure the convergence of the computations related to electron–phonon coupling and the estimation of superconducting transition temperature (Tc), it is imperative to enlarge the size of both k and q-mesh while reducing the smearing width. Nevertheless, the rate at which this approach converges is exceedingly sluggish. To obtain accurate results, it is required to use a very fine k and q-mesh, which requires a heavy computational resource. This challenge was tackled by employing the maximally localized Wannier function (MLWF) technique to interpolate the electron–phonon coupling. These calculations were performed in the EPW package.28,29 In this program, the electron energies, phonon frequencies, and electron–phonon matrix elements were calculated to solve the Eliashberg equation. The calculations were performed on a fine k and q-mesh with 50 × 50 × 50 k and q-points. Despite the utilization of such a dense mesh, the MLWF interpolation technique managed to mitigate computational costs, ensuring the convergence of electron–phonon coupling parameters.
To determine the realistic electron–phonon coupling constant, reduced electron–phonon matrix elements (REPMEs) were computed specifically targeting optical vibration modes that exhibit strong coupling. The details of this calculation have been discussed in ref. 30.
3 Results and discussion
3.1 Electronic structure
X-ray and neutron diffraction studies of ref. 1 show that the pure BaSbO3 has face-centered cubic symmetry with the space group Fm![[3 with combining macron]](https://www.rsc.org/images/entities/char_0033_0304.gif) m, and in the K-doped superconducting state (x ≥ 0.65), it becomes simple cubic with the space group Pmm, as shown in Fig. S1. In the FCC structured BaSbO3, there is repetitive contraction and expansion of Sb–O bonds along three dimensions. Unlike BaBiO3 (BBO), the crystal structure of BaSbO3 (BSO) has no SbO6 octahedra tilting distortion. The geometrically relaxed lattice parameter of BaSbO3 obtained from the present calculation is 8.4770 Å, which is fairly close to the experimental value of 8.5046 Å.1 The calculated Sb–O bond lengths are 2.2182 Å for the expanded and 2.0203 Å for the collapsed octahedra. The Sb–O bond length difference is 0.1979 Å, which is larger than the Bi–O bond length difference of 0.1522 Å observed in BaBiO3 as calculated in ref. 30. The breathing distortion results in the bandgap in these materials. So, a larger breathing distortion in BaSbO3 results in a larger electronic bandgap of 0.5075 eV than that of BaBiO3. This larger breathing distortion and hence the larger CDW gap in BaSbO3 indicate that more holes are needed for suppression of breathing distortion in this material, and that's why the critical K doping level for insulating to metallic transition in BSO (x = 0.65) is much greater than that in BBO (x = 0.37).
m, and in the K-doped superconducting state (x ≥ 0.65), it becomes simple cubic with the space group Pmm, as shown in Fig. S1. In the FCC structured BaSbO3, there is repetitive contraction and expansion of Sb–O bonds along three dimensions. Unlike BaBiO3 (BBO), the crystal structure of BaSbO3 (BSO) has no SbO6 octahedra tilting distortion. The geometrically relaxed lattice parameter of BaSbO3 obtained from the present calculation is 8.4770 Å, which is fairly close to the experimental value of 8.5046 Å.1 The calculated Sb–O bond lengths are 2.2182 Å for the expanded and 2.0203 Å for the collapsed octahedra. The Sb–O bond length difference is 0.1979 Å, which is larger than the Bi–O bond length difference of 0.1522 Å observed in BaBiO3 as calculated in ref. 30. The breathing distortion results in the bandgap in these materials. So, a larger breathing distortion in BaSbO3 results in a larger electronic bandgap of 0.5075 eV than that of BaBiO3. This larger breathing distortion and hence the larger CDW gap in BaSbO3 indicate that more holes are needed for suppression of breathing distortion in this material, and that's why the critical K doping level for insulating to metallic transition in BSO (x = 0.65) is much greater than that in BBO (x = 0.37).
The orbital resolved band structure in Fig. 1, illustrating the expanded (top) and collapsed (bottom) octahedra, highlights the contribution of Sb-5s and O-p orbitals to the electronic states of the pure BaSbO3 system. The thickness of the bands is directly related to the weight of the Sb-5s or O-p orbital character in the eigenvalues. The electronic states near the Fermi level predominantly consist of Sb-5s and O-A1g orbitals, which exhibit strong hybridization in both bonding and antibonding bands. In the expanded octahedra, Sb-5s and O-A1g orbitals are found to be overlapped at ∼−1 and at ∼−10 eV. Whereas, in the collapsed octahedra, this overlapping of orbitals is observed at ∼2 eV and at ∼−10 eV. So, the energy difference due to hybridization splitting is greater for the collapsed octahedra than that for the expanded octahedra. This indicates that the hybridization between Sb-5s and O-A1g orbitals is stronger in the collapsed SbO6 octahedra. Like BaBiO3, BaSbO3 is also self-doped with a hole pair as there is shortage of electrons in the SbO6 octahedra. Interestingly, in BSO, the antibonding spσ orbital is dominated by the Sb-s state and the bonding orbital is dominated by the O-A1g orbital. This is in contrast to the case of BBO, where the reverse is true. This indicates a reduction in the contribution of the oxygen hole to the electronic structure of BaSbO3.
 | ||
| Fig. 1 Orbital resolved band structure of pure BaSbO3 projected onto Sb-s and O-A1g orbitals of an expanded (top panel) and collapsed (bottom panel) SbO6 octahedron. | ||
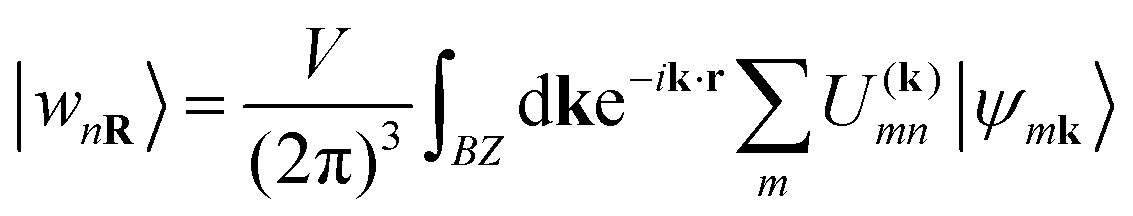
In the systems doped with potassium, hole doping introduced through the substitution of Ba2+ with K+ ions suppresses the breathing distortion of the CDW state. As a result, the systems become metallic when the K-doping level exceeds x = 0.65. In the metallic state, similar to Ba1−xKxBiO3 (BKBO), Ba1−xKxSbO3 (BKSO) becomes simple cubic with the space group Pmm. The substitution of Ba with K also leads to a decrease in the lattice parameter of the system. The optimized lattice parameter of the Ba0.35K0.65SbO3 system is calculated as 4.12612 Å, which is ∼1.5% greater than the experimental value.1 With increasing K-doping in the system, the lattice parameter decreases almost linearly, as shown in Fig. 2(f). Orbital resolved band structures of K-doped BaSbO3 in Fig. 2 reveal that the electronic states around the Fermi level mainly consist of Sb-s and O-pσ orbitals, similar to the undoped system. Also, the orbital contribution of the Sb-5s state is greater in the antibonding orbital than that in the O-pσ state. With varying K-doping, the Fermi level shifts relative to the conduction band. With increasing x, the Fermi level is shifted to a lower energy. Like BKBO, BKSO shows a low electronic density of states (DOS) of 0.29 states per eV at the Fermi level for x = 0.65, which is even lower than that of BKBO (x = 0.4).30 The total electronic DOS in the vicinity of the Fermi level decreases with increasing K-concentration in the system, as depicted in Fig. 2(e). To study the effect of K-doping on the degree of orbital hybridization occurring in the undoped and K-doped BSO quantitatively, a tight binding model is simulated based on wannierization. Wannier functions are derived through the Fourier transform of Bloch states. To obtain atomic-like localized functions (WFs) in real space, this process involves applying a unitary transformation.31
 | (1) |
 | ||
| Fig. 2 Projected band structure and DOS of Ba1−xKxSbO3 for x = 0.7 (a) and (c) and x = 0.8 (b) and (d). Total DOS at different K doping levels in BKSO (e) and variation of the lattice parameter with K concentration (f). | ||
| x | t spσ (eV) | E s (eV) | E pσ (eV) | E pπ (eV) |
|
|---|---|---|---|---|---|
| a Expanded octahedra. b Collapsed octahedra. | |||||
| 0.000a | 1.8544 | −4.7502 | −5.8663 | −3.7579 | −0.2895 |
| 0.000b | 2.0472 | −2.7080 | −5.8663 | −3.7579 | +1.7527 |
| 0.650 | 2.1056 | −2.6391 | −5.5839 | −3.0073 | +1.2271 |
| 0.675 | 2.1215 | −2.5758 | −5.5908 | −2.9956 | +1.2849 |
| 0.700 | 2.1126 | −2.2220 | −5.4401 | −2.7791 | +1.4441 |
| 0.725 | 2.1303 | −2.0458 | −5.2413 | −2.5963 | +1.4322 |
| 0.750 | 2.1367 | −2.0528 | −5.2706 | −2.6248 | +1.4539 |
| 0.800 | 2.1626 | −1.7388 | −5.0996 | −2.4207 | +1.5749 |
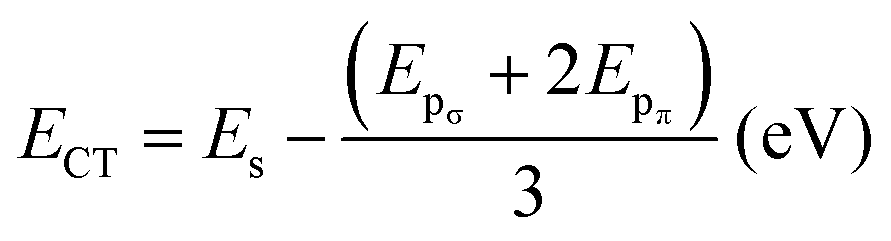
The data presented in the table reveal that the orbital hybridization between Sb-s and O-pσ is enhanced in the collapsed SbO6 octahedra of BaSbO3 as the spσ hopping integral is greater in the collapsed octahedra. Also, the position of the Sb-5s state above the Fermi energy level in the band structure of BSO for the collapsed octahedra is reflected in the positive value of the charge transfer energy of the same. The positive charge transfer energy of undoped and K-doped BSO, which is a sharp contrast to the case of undoped and K-doped BaBiO3, implies the dominance of Sb-s character in the higher energy level compared to Bi-s in BBO due to the higher on-site energy of Sb-s than that of Bi-s. In the K-doped systems, greater values of tspσ and more positive values of ECT are observed than those of the undoped system. This results in a greater orbital overlap and hence a stronger spσ hybridization in the K-doped systems. Also, the orbital hybridization increases with increasing K-doping level. The strong and weak hybridization correspond to delocalized and localized electronic structures, respectively. So, with increasing potassium doping the electronic structures of antimonate become more delocalized in nature. Now, the localized electronic structures generally give rise to significant coupling between electrons and structural distortion. This indicates that the materials with a low K-doping level just above the critical doping level for suppression of the CDW state should have a larger electron–phonon coupling, which we will observe in Table 5. The positive values of the charge transfer energies facilitate electron transfer from the Sb-s state to the O-p state. This implies that Sb-s electrons become more and more dominant in the electronic structures and the metallicity of BKSO compounds.
The net atomic charges of antimony and oxygen within the collapsed and expanded octahedra of pure BaSbO3 were determined using Bader's charge analysis. The ionic charge states of Sb and O, determined through Bader charge analysis, are presented in Table 2. A Mössbauer spectroscopy study on BaSbO35 revealed that unlike BaBiO3, in the CDW state Sb is disproportionated into +3 and +5 (5s2 + 5s0) oxidation states. From the table, it can be observed that the difference between the ionic charge state or net atomic charge of Sb in expanded and collapsed octahedra is ∼0.67e, which is almost twice the difference in the net atomic charge of Bi in collapsed and expanded octahedra of BaBiO3.30 This larger charge and bond disproportion in BSO is the result of positive charge transfer energy, which makes the electronic structure correlated in nature. Again, the positive charge transfer energy will lead to the suppression of the oxygen hole in antimonate, as discussed in the next section.
| Expanded octahedron | Collapsed octahedron | |
|---|---|---|
| Ionic charge state | Ionic charge state | |
| Sb | +1.99e | +2.66e |
| O | −1.30e | −1.30e |
3.2 Oxygen K-edge XANES study
In oxygen K-edge XANES, the pre-edge region can be understood as features resulting from the transition of an electron from the 1s state to unoccupied 2p states. So, the pre-edge feature of O 1s XAS spectra originates from the O 2p holes in the antibonding spσ states. The calculated XANES spectra of pure and K doped BaSbO3 are shown in Fig. 3. The computed O 1s XANES spectra agree well with the experimental results1 in that they have common prepeaks, which are located experimentally at 528.8 eV, and the relative positions of the pronounced high-energy peak are located above the absorption edge. The zero energy in the computed spectra is the Fermi energy. The O K-edge XANES spectra of pure and K-doped BaSbO3 look similar to those of experimental XANES spectra of undoped and K-doped BaBiO3.33–35 For the pure BSO, a small pre-edge peak can be observed, which is marked as “a”. For the doped systems, pronounced rounded shape prepeaks can be observed with greater intensities. These increased prepeaks are due to increased hole concentration in the O 2p states induced by K doping. The pre-edge peak of the material with x = 0.65 has some shift towards the lower energy. The sudden increase and the shift towards low energy of the prepeaks of the K-doped systems from that of the pure system can be attributed to the insulator-to-metal transition driven by the suppression of the CDW gap through hole doping.1,33 | ||
| Fig. 3 O K-edge XANES spectra of pure and K-doped BaSbO3. | ||
The broad spectral feature located at 2–8 eV for the pure material arises due to Ba character, which is marked as “b”. This structure has a strong dependence on K-concentration. With an increase in K-doping, the spectral feature “b” becomes narrower and shifts towards higher energy monotonically. This variation can be ascribed to alterations in the local electronic structure of the system caused by the substitution of K at Ba sites. Fig. 4 illustrates the XANES spectra of BBO and BSO (a) and that of Ba0.6K0.4BiO3 and Ba0.35K0.65SbO3 (b). The spectra are normalized to their high-energy structures in both cases. Comparison of O 1s XANES spectra of both pure and K-doped systems shows that the prepeaks of pure and K-doped BaSbO3 appear significantly suppressed compared to those observed for the pure and doped bismuthates. This implies the suppression of the oxygen hole in the antibonding spσ orbital in antimonates. This result is consistent with the positive charge transfer energies of the pure and doped BaSbO3.
 | ||
| Fig. 4 Comparison of XANES spectra of BaBiO3 and BaSbO3 (a) and Ba0.6K0.4BiO3 and Ba0.35K0.65SbO3 (b). | ||
3.3 Phonons in K-doped barium antimonate
Phonon spectra of BaSbO3 for different K-doping levels are plotted along the cubic Brillouin zone in Fig. 5. The absence of imaginary phonon modes in Ba1−xKxSbO3, where x = 0.65–0.8, indicates that these materials are dynamically stable in simple cubic structures. The interactive phonon visualizer tool available in Materials Cloud36 was used for the identification of various phonon modes in the phonon spectrum. Analysis of the phonon dispersion plots reveals several key observations: the high-frequency optical modes, located around ω ∼ 60 meV, predominantly originate from stretching vibrations of oxygen bonds. The transverse optical modes at the X point and the longitudinal phonon mode at the M point are associated with oxygen oscillating and stretching modes, respectively. The longitudinal optical mode at the point R is associated with the SbO6 octahedra breathing mode. The phonon modes in the frequency range of 25–45 meV are primarily composed of oxygen bond bending vibrations and the contributions from the vibrations of the Sb-atoms. The phonon frequencies computed in this study show good agreement with previously reported calculated values.11 The phonon modes below ∼20 meV predominantly arise from the vibration of Ba/K atoms. The projected phonon DOS of Fig. 6(a) shows a similar outcome. With the decrease in the K-doping level, the optical phonon gap between the oxygen bond stretching and bond bending vibrations becomes smaller. This gap is 10.87 meV at x = 0.8 and 5.32 meV at x = 0.65. Additionally, a significant softening of the phonon frequencies corresponding to the oxygen breathing mode at the R-point is observed, which is 82.27 meV at x = 0.8 and 69.35 meV at x = 0.65. A significant phonon softening is also observed at the M-point, corresponding to the oxygen bond stretching mode, which is 77.28 meV at x = 0.8 and 55.66 meV at x = 0.65. The softening of phonon modes occurs with decreasing K-doping. Fig. 6(c) shows the phonon spectrum of the material with x = 0.55. A strong softening of the phonon modes at the M-point is evident, accompanied by the disappearance of the optical phonon gap. This strong phonon softening signifies very strong electron–phonon coupling strength, λqν, and that can lead to instability in the cubic system,37,38 and hence a structural phase transition. Interestingly, application of hydrostatic pressure on the BKSO system also induces a structural phase transition at high pressure, but in that case, it occurs at a reduced electron–phonon coupling.39 | ||
| Fig. 5 Phonon dispersion plots of simple cubic Ba1−xKxSbO3. | ||
 | ||
| Fig. 6 Projected phonon DOS of the material for x = 0.7 (a), phonon DOS for different doping levels (b), phonon dispersion plot of Ba0.45K0.55SbO3 (c). | ||
The phonon DOS plots of K-doped BaSbO3 are shown in Fig. 6(b). As the K doping level in the systems increases, the high-frequency optical phonon modes shift towards higher frequency. Also, a decrease in the phonon DOS of this region is observed with increasing K-doping. There is no significant change in phonon DOS corresponding to mid and low frequencies observed with different doping levels. This implies that the K-doping in the BaSbO3 material has a larger effect on the phonon modes corresponding to the vibrations of the lighter oxygen atoms than those of the heavier atoms.
3.4 Electron–phonon interaction
Like superconducting Ba1−xKxBiO3 compounds, K-doped BaSbO3 materials also exhibit characteristics of a conventional Bardeen–Cooper–Schrieffer40 (BCS)-type superconductor with s-wave pairing symmetry.1,11 The electron–phonon coupling constant was calculated as ≈0.6 using first-principles calculations.11 This value is below the critical threshold where the Migdal–Eliashberg theory ceases to be valid.41 The required equations for calculating the electron–phonon coupling strength (λ), Eliashberg spectral function and the superconducting Tc have been presented in our previous article.30 For the calculations of the λ and Tc of Ba1−xKxSbO3, the value of the empirical Coulomb repulsion parameter, μ*, is taken as 0.1, which is a standard value for this material.11,42 The values of the parameters, such as λ, Tc, and ωlog, calculated using the EPW package using DFT-GGA are shown in Table 5. The GGA calculated λ and Tc values shown in the table are heavily underestimated from the experimentally measured values.1 However, it follows the trend of decreasing Tc with increasing level of K doping in the compound. This decrease in superconducting Tc can be attributed to the decline in the electronic DOS at the Fermi level as illustrated in Fig. 2.Fig. 8(a)–(c) depict the Γ-centered, isotropic, rounded cubic Fermi surface of Ba0.35K0.65SbO6. The conduction bands that intersect the Fermi level give rise to the formation of the Fermi surface, which predominantly consists of Sb-5s and O-2p states. It can be observed that the increase in the K-doping level in BKSO results in a shrinkage in the size of the Fermi surface. The Eliashberg spectral function, α2F(ω), for these systems can be determined by solving the isotropic Migdal–Eliashberg equation.8,9,43 The Eliashberg spectral function plots for K-doped BaSbO3 are shown in Fig. 7. The existence of the major peaks in the α2F(ω) at higher energies signifies that the major part of the electron–phonon coupling strength arises from the coupling between the electrons and the oxygen bond stretching vibrations. The negligible peak observed in the low frequency region indicates that the Ba/K atoms' vibrations have minimal contribution to the overall electron–phonon coupling in the systems. Analyzing the phonon dispersion and the α2F(ω) together, it can be observed that the phonons corresponding to the oxygen oscillating mode and oxygen stretching mode have the greatest impact on the overall electron–phonon coupling in these systems.
 | ||
| Fig. 7 Calculated α2F(ω) for different K doping levels in BKSO. | ||
As the K-doping level in the system increases, it is observed from Fig. 7 that the high-energy α2F(ω) peaks shift towards higher energy. Also, the area of the peaks decreases with increasing x. This signifies the decrease in the electron–phonon coupling strength with increasing K doping in BaSbO3. This observation is consistent with the monotonic reduction of the frequency-dependent cumulative electron–phonon coupling strength, λ(ω), at high energies of Fig. 8(d).
 | ||
| Fig. 8 Calculated Fermi surface of Ba1−xKxSbO3 for x = 0.65 (a), 0.7 (b), 0.8 (c) and cumulative electron–phonon coupling λ(ω) for different doping concentrations (d). | ||
3.5 Effect of nonlocal electronic correlation on the electronic structure and electron–phonon interaction
Nonlocal electronic correlation has a significant impact on the electron–phonon coupling in bismuthate and antimonate systems.11,30,42,44 The bandwidth of K-doped bismuthate measured from the ARPES study44 was found to be larger compared to that using the GGA functional in DFT due to long-range Coulomb interactions. The nonlocal electronic correlation through long-range exchange interaction can be accounted for in DFT calculations by employing the HSE06 screened hybrid functional. Employing the HSE06 hybrid functional can significantly improve the bandwidth, bringing it closer to the experimental values.Table 3 shows that there is a significant broadening of bandwidth along Γ–X and Γ–M directions after using the HSE06 hybrid functional in the DFT calculations. The broadening can be ascribed to the effect of nonlocal electronic correlation. The decrease in broadening with increasing K-doping in both systems indicates a reduction in the impact of long-range Coulomb interaction on the electronic structures of the systems. Fig. 9 illustrates a downward shift in the valence band when calculated using the HSE06 hybrid functional, in comparison to the calculation performed using the GGA functional.
| x | Γ–X | Γ–M | ||||
|---|---|---|---|---|---|---|
| Bandwidth (eV) | Bandwidth (eV) | |||||
| GGA | HSE06 | Broadening (%) | GGA | HSE06 | Broadening (%) | |
| 0.650 | 3.4464 | 4.9009 | 42.20 | 5.7050 | 7.5650 | 32.600 |
| 0.675 | 3.4850 | 4.9494 | 42.02 | 5.7696 | 7.6388 | 32.397 |
| 0.700 | 3.5370 | 5.0150 | 41.76 | 5.8236 | 7.7147 | 32.470 |
| 0.725 | 3.5802 | 5.0709 | 41.64 | 5.9000 | 7.7913 | 32.056 |
| 0.750 | 3.6350 | 5.1457 | 41.56 | 5.9650 | 7.8737 | 31.998 |
| 0.800 | 3.7402 | 5.2763 | 41.07 | 6.0800 | 8.0154 | 31.830 |
 | ||
| Fig. 9 Band structure of Ba1−xKxSbO3 computed using both GGA and HSE06. | ||
The electron–phonon coupling in Ba1−xKxSbO3 can be effectively enhanced by integrating DFT-GGA calculations with those performed using the DFT-HSE06. The calculation requires scaling the REPMEs acquired via DFT-GGA to more realistic improved values, computed through HSE06 hybrid functional calculation. REPMEs are computed for all phonon modes that exhibit strong coupling at the high symmetry points in the Brillouin zone, utilizing both GGA and HSE06 hybrid functionals. The relations between the GGA calculated λ, ωlog and Tc with the values obtained from the HSE06 hybrid functional have been discussed in the supplementary article. A representative diagram of band structures of the required supercells calculated using GGA and HSE06 for BKSO with x = 0.7 is depicted in Fig. 10. Every oxygen atom is displaced from its original position by ∼1% of the lattice parameter of the simple cubic unit cell.
 | ||
| Fig. 10 Illustration of the REPMEs of three different modes in Ba0.3K0.7SbO3. Band structures are computed by considering both the presence and absence of oxygen displacement, utilizing both the GGA (left) and HSE06 (right). | ||
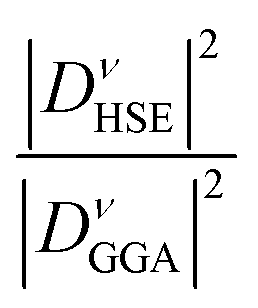
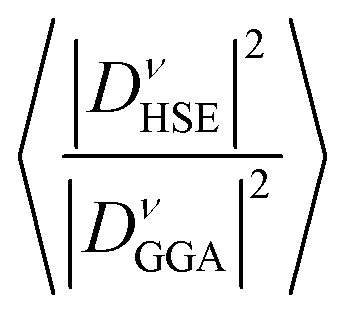
Table 4 demonstrates that incorporating long-range exchange interaction via the HSE06 functional enhances the band splitting and, as a result, increases the REPMEs in all strongly coupled phonon modes compared to the values obtained using the GGA functional. As the K concentration in the systems increases, the REPMEs exhibit an upward trend and an almost linear decrease in the enhancement factor of electron–phonon coupling, as shown in Fig. 11. Enhanced λ, ωlog, and superconducting Tc calculated using this method for various K-doping levels are presented in Table 5 and plotted in Fig. 11. Calculated values of λ and Tc of this study have a fairly close match with the experimental and calculated results.1,11
| x | Oxygen vibration mode | Band splitting (eV) | D GGA (eV Å−1) | D HSE (eV Å−1) |
|
|
|
|---|---|---|---|---|---|---|---|
| GGA | HSE06 | ||||||
| 0.650 | Oscillating at X | 0.4850 | 0.7355 | 5.9146 | 8.9690 | 2.3000 | 1.6720 |
| Stretching at M | 0.8814 | 1.0417 | 10.749 | 12.704 | 1.3967 | ||
| Breathing at R | 0.8770 | 1.0072 | 10.695 | 12.283 | 1.3190 | ||
| 0.675 | Oscillating at X | 0.4948 | 0.7389 | 6.0341 | 9.0110 | 2.2301 | 1.6230 |
| Stretching at M | 0.9050 | 1.0537 | 11.0366 | 12.850 | 1.3556 | ||
| Breathing at R | 0.8993 | 1.0187 | 10.9671 | 12.423 | 1.2832 | ||
| 0.700 | Oscillating at X | 0.5054 | 0.7418 | 6.1634 | 9.0463 | 2.1543 | 1.5836 |
| Stretching at M | 0.9250 | 1.0651 | 11.2805 | 12.9890 | 1.3259 | ||
| Breathing at R | 0.9161 | 1.0327 | 11.172 | 12.5939 | 1.2707 | ||
| 0.725 | Oscillating at X | 0.5151 | 0.7401 | 6.2817 | 9.0256 | 2.0644 | 1.5410 |
| Stretching at M | 0.9399 | 1.0769 | 11.4622 | 13.1329 | 1.3128 | ||
| Breathing at R | 0.9215 | 1.0285 | 11.2378 | 12.5427 | 1.2457 | ||
| 0.750 | Oscillating at X | 0.5261 | 0.7402 | 6.4159 | 9.0268 | 1.9795 | 1.4945 |
| Stretching at M | 0.9586 | 1.0870 | 11.6902 | 13.2561 | 1.2858 | ||
| Breathing at R | 0.9333 | 1.0301 | 11.3817 | 12.5622 | 1.2182 | ||
| 0.800 | Oscillating at X | 0.5501 | 0.7348 | 6.7085 | 8.9610 | 1.7843 | 1.4086 |
| Stretching at M | 0.9886 | 1.1056 | 12.0561 | 13.4829 | 1.2507 | ||
| Breathing at R | 0.9522 | 1.0391 | 11.6122 | 12.672 | 1.1909 | ||
 | ||
| Fig. 11 Calculated REPMEs (a), enhancement factor of EPC (b), λ (c), ωlog (d) and superconducting Tc (e) at different K-doping levels in Ba1−xKxSbO3, computed using both GGA and HSE06. | ||
| x | GGA | HSE06 | ||||
|---|---|---|---|---|---|---|
| λ | ω log (meV) | T c (K) | λ | ω log (meV) | T c (K) | |
| 0.650 | 0.3822 | 49.7617 | 1.8503 | 0.6400 | 45.6837 | 14.611 |
| 0.675 | 0.3472 | 51.0447 | 0.9933 | 0.5635 | 47.3825 | 10.310 |
| 0.700 | 0.3192 | 52.0672 | 0.5179 | 0.5055 | 48.7393 | 7.1770 |
| 0.725 | 0.2906 | 53.0946 | 0.2152 | 0.4478 | 50.1293 | 4.3878 |
| 0.750 | 0.2659 | 54.3496 | 0.0785 | 0.3974 | 51.7292 | 2.4277 |
| 0.800 | 0.2067 | 56.6979 | 0.0009 | 0.2912 | 54.8113 | 0.2270 |
The linear decrease of the enhancement factor in the case of K-doped BaSbO3 contrasts with the behavior observed in K-doped bismuthate.30 As a result, in the case of the antimonate superconductor, the electron–phonon coupling strength and superconducting Tc fall more rapidly with increasing K concentration in the material than that of the bismuthate superconductor. Both GGA and HSE06 calculated ωlog show a linearly increasing trend with increasing doping. Superconducting Tc decreases non-linearly with doping and becomes almost zero at x = 0.8. Also, unlike the bismuthate superconductor, λ and Tc values calculated using HSE06 follow the same trend as GGA calculated values.
This study demonstrates that the K-doped antimonate also shows a high superconducting transition temperature, which is almost half of the maximum Tc of ∼30 K of Ba1−xKxBiO3 for x = 0.4. These two compounds have a maximum Tc at a K-doping level just after the suppression of the CDW state in these compounds. To investigate the reason behind the high transition temperature of bismuthate and antimonate superconductors and a greater Tc value for bismuthate, some points can be considered. First, BaSbO3 has a larger CDW gap due to having a larger bond disproportionated state than that of BaBiO3. Due to this fact, more holes are needed for BaSbO3 for suppression of the CDW state and emergence of superconductivity. Second, Ba0.6K0.4BiO3 has a greater electronic DOS at the Fermi level (0.47 states per eV)30 than that of Ba0.35K0.65SbO3 (0.29 states per eV). Third, the sign of the charge transfer energy, ECT, of Ba1−xKxBiO3 is negative, whereas, for Ba1−xKxSbO3, it is positive. This indicates that the electronic states of antimonate are weakly hybridized and more localized in nature compared to those of bismuthate. Fourth, bismuthate has a predominant oxygen hole in the conduction band,33 whereas the oxygen hole is suppressed in antimonate. By analyzing these points, it can be stated that as the superconductivity in both materials emerges from suppression of the CDW state, the sign of ECT does not control the emergence of the superconducting phase in these materials. So, it can be pointed out that mainly a lower CDW gap of BaBiO3, a higher electronic DOS at the Fermi level, and a predominant oxygen hole in the antibonding spσ bands are the main reasons for having a higher Tc of bismuthate than that of antimonate at a K-doping concentration beyond the critical doping level required for suppression of the CDW state in these materials.
4 Conclusions
This study investigates the electronic structure of both pure and K-doped BaSbO3 and electron–phonon interaction in the superconducting antimonate employing density functional theory. The pure BaSbO3 has a larger bond disproportionated state than that of BaBiO3. The electronic states around the Fermi level mainly consist of Sb-s and O-pσ orbitals, with the predominant Sb-s state. A strong orbital hybridization is found to occur between these two states, which is enhanced in the collapsed octahedra of pure BaSbO3. Also, the degree of the hybridization increases with increasing K-content in the system. The K-doped systems exhibit a low electronic DOS at the Fermi level, which decreases with an increase in the K doping level. The O K-edge XANES study reveals that the self-doped holes do not reside on the ligand oxygen in the spσ antibonding orbital. This suppression of the oxygen hole in antimonate is consistent with the positive charge transfer energy of the systems. The difference in the net atomic charge, calculated using Bader's charge, between two inequivalent Sb atoms is almost twice that of the two inequivalent Bi ions in BaBiO3.The increasing optical phonon gap between the oxygen bond stretching and bond bending vibrations with increasing K doping in the superconducting antimonate signifies the reduction of electron–phonon coupling strength with increasing K doping. When the K concentration is decreased further from x = 0.65, the EPC becomes so strong that it leads to instability in the cubic phase. The Eliashberg spectral function plots reveal that the electron–phonon coupling, which predominantly drives superconductivity in the system, is primarily associated with the coupling between the electrons and the phonons corresponding to Sb–O bond-stretching vibrations. The DFT-GGA computed values of λ and Tc using Migdal–Eliashberg formalism are heavily underestimated from the experimentally measured values. This is due to the fact that the GGA functional does not contain long-range Coulomb interactions. The electron–phonon coupling and superconducting Tc of these materials are enhanced considerably and become close to the experimental values when long-range interaction and screening are considered in the calculations by using the HSE06 hybrid functional. With increasing K doping level, the enhancement factor for EPC of the systems decreases. That's why λ and Tc decrease at a greater rate with increasing K doping than that of BKBO. Analyzing the CDW gap, electronic DOS at the Fermi level, sign of the charge transfer energy, and oxygen holes of BKBO and BKSO, it can be concluded that a smaller CDW gap, greater electron DOS at the Fermi level and the predominant oxygen hole in BKBO are the main reasons for having a higher Tc of BKBO than BKSO at a K-content just after the insulating to metallic transition in these materials.
Author contributions
Soubhik Bhattacharyya: conceptualization, methodology, calculations, writing – original draft; P. M. Sarun: conceptualization, supervision, methodology, writing – review and editing.Conflicts of interest
There are no conflicts to declare.Data availability
The data supporting this article have been included as part of the supplementary information (SI). Supplementary information: crystal structures of pure and K-doped BaSbO3, Wannier interpolated band structures, superconducting gap functions of BKSO for x = 0.65 and 0.675, and the required equations for the calculation of electron–phonon coupling parameters using the hybrid functional. See DOI: https://doi.org/10.1039/d5cp04497a.Acknowledgements
Soubhik Bhattacharyya (18DR0133) acknowledges the IIT (ISM) Dhanbad, India, for providing the Senior Research Fellowship and computational facility through the Aryabhata HPC cluster. The authors would like to thank National Supercomputing Mission (NSM) for providing computational facilities of ‘PARAM Seva’ at IIT Hyderabad and ‘PARAM Porul’ at NIT Tiruchirappalli, which are implemented by C-DAC and supported by the Ministry of Electronics and Information Technology (MeitY) and Department of Science and Technology (DST), Government of India. We would like to thank Prof. R. Thangavel for providing valuable inputs to the manuscript.References
- M. Kim, G. M. McNally, H.-H. Kim, M. Oudah, A. S. Gibbs, P. Manuel, R. J. Green, R. Sutarto, T. Takayama and A. Yaresko, et al. , Nat. Mater., 2022, 21, 627–633 CrossRef CAS PubMed.
- D. Sénéchal, P.-L. Lavertu, M.-A. Marois and A.-M. Tremblay, Phys. Rev. Lett., 2005, 94, 156404 CrossRef PubMed.
- S. Pei, N. J. Zaluzec, J. D. Jorgensen, B. Dabrowski, D. G. Hinks, A. W. Mitchell and D. R. Richards, Phys. Rev. B:Condens. Matter Mater. Phys., 1989, 39, 811 CrossRef CAS PubMed.
- C. M. Varma, Phys. Rev. Lett., 1988, 61, 2713 CrossRef CAS PubMed.
- M. Kim, S. Klenner, G. M. McNally, J. Nuss, A. Yaresko, U. Wedig, R. K. Kremer, R. Pottgen and H. Takagi, Chem. Mater., 2021, 33, 6787–6793 CrossRef CAS.
- J. P. Perdew, K. Burke and M. Ernzerhof, Phys. Rev. Lett., 1996, 77, 3865 CrossRef CAS PubMed.
- M. P. Seah and W. Dench, Surf. Interface Anal., 1979, 1, 2–11 CrossRef CAS.
- A. B. Migdal, Sov. Phys. JETP, 1958, 34, 996–1001 Search PubMed.
- G. M. Eliashberg, Zh. Eksp. Teor. Fiz., 1960, 38, 966–976 CAS.
- J. Julien, D. Papaconstantopoulos, F. Cyrot-Lackmann and A. Pasturel, Phys. Rev. B:Condens. Matter Mater. Phys., 1991, 43, 2903 CrossRef CAS PubMed.
- Z. Yuan, P. Zheng, Y. Peng, R. Liu, X. Ma, G. Wang, T. Yu and Z. Yin, Phys. Rev. B, 2022, 105, 014517 CrossRef CAS.
- T. M. Henderson, J. Paier and G. E. Scuseria, Phys. Status Solidi B, 2011, 248, 767–774 Search PubMed.
- A. V. Krukau, O. A. Vydrov, A. F. Izmaylov and G. E. Scuseria, J. Chem. Phys., 2006, 125, 224106 CrossRef PubMed.
- P. Giannozzi, O. Andreussi, T. Brumme, O. Bunau, M. B. Nardelli, M. Calandra, R. Car, C. Cavazzoni, D. Ceresoli and M. Cococcioni, et al. , J. Phys.: Condens. Matter, 2017, 29, 465901 Search PubMed.
- J. P. Perdew, J. A. Chevary, S. H. Vosko, K. A. Jackson, M. R. Pederson, D. J. Singh and C. Fiolhais, Phys. Rev. B:Condens. Matter Mater. Phys., 1993, 48, 4978 CrossRef CAS PubMed.
- Y. Ge, F. Zhang, R. P. Dias, R. J. Hemley and Y. Yao, Mater. Today Phys., 2020, 15, 100330 CrossRef.
- H. J. Monkhorst and J. D. Pack, Phys. Rev. B, 1976, 13, 5188 CrossRef.
- K. F. Garrity, J. W. Bennett, K. M. Rabe and D. Vanderbilt, Comput. Mater. Sci., 2014, 81, 446–452 CrossRef CAS.
- D. R. Hamann, Phys. Rev. B:Condens. Matter Mater. Phys., 2013, 88, 085117 CrossRef.
- G. Pizzi, V. Vitale, R. Arita, S. Blügel, F. Freimuth, G. Géranton, M. Gibertini, D. Gresch, C. Johnson and T. Koretsune, et al. , J. Phys.: Condens. Matter, 2020, 32, 165902 CrossRef CAS PubMed.
- A. A. Mostofi, J. R. Yates, Y.-S. Lee, I. Souza, D. Vanderbilt and N. Marzari, Comput. Phys. Commun., 2008, 178, 685–699 CrossRef CAS.
- R. F. W. Bader, Chem. Rev., 1991, 91, 893–928 CrossRef CAS.
- G. Henkelman, A. Arnaldsson and H. Jónsson, Comput. Mater. Sci., 2006, 36, 354–360 CrossRef.
- C. Gougoussis, M. Calandra, A. P. Seitsonen and F. Mauri, Phys. Rev. B:Condens. Matter Mater. Phys., 2009, 80, 075102 Search PubMed.
- Quantum-Espresso, Original QE PP Library, https://pseudopotentials.quantum-espresso.org/legacy_tables/original-qe-pp-library/, [Online; accessed 16-June-2024].
- P. E. Blöchl, Phys. Rev. B:Condens. Matter Mater. Phys., 1994, 50, 17953 CrossRef PubMed.
- M. Taillefumier, D. Cabaret, A.-M. Flank and F. Mauri, Phys. Rev. B:Condens. Matter Mater. Phys., 2002, 66, 195107 CrossRef.
- S. Poncé, E. R. Margine, C. Verdi and F. Giustino, Comput. Phys. Commun., 2016, 209, 116–133 Search PubMed.
- J. Noffsinger, F. Giustino, B. D. Malone, C.-H. Park, S. G. Louie and M. L. Cohen, Comput. Phys. Commun., 2010, 181, 2140–2148 CrossRef CAS.
- S. Bhattacharyya, R. Thangavel and P. M. Sarun, Comput. Mater. Sci., 2024, 234, 112782 CrossRef CAS.
- N. Marzari, A. A. Mostofi, J. R. Yates, I. Souza and D. Vanderbilt, Rev. Mod. Phys., 2012, 84, 1419–1475 CrossRef CAS.
- N. Marzari and D. Vanderbilt, Phys. Rev. B:Condens. Matter Mater. Phys., 1997, 56, 12847 CrossRef CAS.
- K. Kobayashi, T. Mizokawa, A. Ino, J. Matsuno, A. Fujimori, H. Samata, A. Mishiro, Y. Nagata and F. De Groot, Phys. Rev. B:Condens. Matter Mater. Phys., 1999, 59, 15100 CrossRef CAS.
- S. Balandeh, R. J. Green, K. Foyevtsova, S. Chi, O. Foyevtsov, F. Li and G. A. Sawatzky, Phys. Rev. B, 2017, 96, 165127 CrossRef.
- A. Menushenkov, A. Ivanov, V. Neverov, A. Lukyanov, A. Krasavin, A. Yastrebtsev, I. Kovalev, Y. Zhumagulov, A. Kuznetsov and V. Popov, et al. , Phys. Rev. Res., 2024, 6, 023307 Search PubMed.
- L. Talirz, S. Kumbhar, E. Passaro, A. V. Yakutovich, V. Granata, F. Gargiulo, M. Borelli, M. Uhrin, S. P. Huber and S. Zoupanos, et al. , Sci. Data, 2020, 7, 299 CrossRef PubMed.
- I. Esterlis, S. Kivelson and D. Scalapino, npj Quantum Mater., 2018, 3, 59 CrossRef.
- J. E. Moussa and M. L. Cohen, Phys. Rev. B:Condens. Matter Mater. Phys., 2006, 74, 094520 CrossRef.
- S. Bhattacharyya, R. Thangavel and P. M. Sarun, Phys. Scr., 2025, 100, 075960 CrossRef CAS.
- J. Bardeen, L. N. Cooper and J. R. Schrieffer, Phys. Rev., 1957, 108, 1175 CrossRef CAS.
- E. A. Yuzbashyan and B. L. Altshuler, Phys. Rev. B, 2022, 106, 054518 Search PubMed.
- Z. P. Yin, A. Kutepov and G. Kotliar, Phys. Rev. X, 2013, 3, 021011 CAS.
- E. R. Margine and F. Giustino, Phys. Rev. B:Condens. Matter Mater. Phys., 2013, 87, 024505 CrossRef.
- C. H. P. Wen, H. C. Xu, Q. Yao, R. Peng, X. Niu, Q. Chen, Z. Liu, D. Shen, Q. Song and X. Lou, et al. , Phys. Rev. Lett., 2018, 121, 117002 Search PubMed.
Footnote |
| † PACS: 74.25.Jb, 74.25.Kc, 31.15.V-, 71.20.-b, 74.70.-b. |
| This journal is © the Owner Societies 2026 |