DOI:
10.1039/D5AN00611B
(Paper)
Analyst, 2026,
151, 198-205
Sensitive detection and accurate bioimaging of circRNA based on sponge amplification using a DNA tetrahedral nanoprobe
Received
5th June 2025
, Accepted 27th October 2025
First published on 6th November 2025
Abstract
Circular RNAs (circRNAs) have attracted significant attention due to their unique stable structure and specific expression in various cells and tissues, emerging as promising biomarkers for various diseases. Sensitive detection and accurate bioimaging of circRNAs are crucial for the diagnosis of related diseases. Hence, a novel fluorescent DNA tetrahedron nanoprobe (DTNP), based on the miRNA sponge amplification property of circRNAs, was developed for highly sensitive detection of circRNAs in clinical samples and accurate in situ bioimaging of endogenous circRNAs in living cells. Due to the excellent sponge amplification and programmability of DNA tetrahedra, DTNP demonstrates excellent selectivity, single-base resolution and high sensitivity for circMTO1 with a low limit of detection (LOD) of 79 pM. DTNP allows for direct and highly sensitive detection of circRNA expression levels in clinical samples. Furthermore, owing to DTNP's efficient cellular uptake capabilities, it achieved in situ imaging of endogenous circRNAs in living cells and precisely distinguished between tumor cells and normal cells. This developed strategy is crucial for exploring the potential applications of circRNA-related clinical diagnostics in the biomedical field.
Introduction
Circular RNAs (circRNAs) represent a class of single-stranded and covalently closed non-coding RNA molecules.1 The circRNAs are formed through the back-splicing of exons of precursor mRNA in diverse species (from viruses to mammals).2 CircRNAs can function as molecular sponges of microRNAs3 and RNA-binding proteins (RBPs),4 modulate transcription,5 and regulate gene expression as well as alternative splicing events.6 Currently, circRNAs have been shown to possess intrinsic properties of high structural stability and conserved tissue-specific expression patterns,7 with aberrant expression of circRNAs having been implicated in the initiation and progression of various human diseases, including tumors8, metabolic diseases9 and neurological diseases.10 Hence, circRNAs exhibit distinct advantages for the development and application of clinical diagnostic and prognostic biomarkers,11 and highly accurate assays of disease-associated circRNAs in complex biofluids and cells/tissues play a crucial role in enhancing precision medicine and facilitating early disease diagnosis.12
Intracellular circRNAs typically exhibit low abundance, and the extraction of circRNAs from bodily fluids presents numerous challenges.13 These factors complicate the analysis of circRNAs significantly. Traditional assays of circRNAs such as real-time quantitative polymerase chain reaction (RT-qPCR),14 microarray analysis,15 RNA sequencing,16 northern blotting17 and fluorescence in situ hybridization (FISH)18 are available. Nonetheless, these traditional assays require specialized equipment, skilled personnel, and complex and time-consuming sample processing. Additionally, traditional assays are limited to studying circRNAs in solution or fixed cells, conditions that do not accurately reflect the ultralow expression levels of disease-associated circRNAs in living cells.19 Currently, probe-based signal amplification techniques such as CHA and HCR have been developed for biosensing functional nucleic acids in living cells.20,21 These technologies offer advantages such as high sensitivity and good specificity. However, they also face challenges including kinetic limitations and design complexity. Therefore, there is an urgent need to develop novel strategies that incorporatie simple, precise, and multi-spatial recognition sites to enhance binding affinity and capture efficiency for circRNAs, which are particularly important for the sensitive detection of circRNAs at extremely low levels in clinical samples and the accurate bioimaging of endogenous circRNAs in living cells.22–24
At present, circRNAs possess an inherent capacity to function as miRNA sponges, and the corresponding miRNAs can serve as the probes to provide multiple spatial recognition sites.25 This property enhances both binding affinity and capture efficiency for target circRNAs. Importantly, the sponge effect of circRNAs in adsorbing miRNAs could be effectively utilized for the detection of circRNAs. This mechanism takes advantage of the biological functions of circRNAs, which do not require complex design, and simultaneously enables enzyme-free signal amplification for the detection of circRNAs. Nevertheless, conventional nucleic acid probes exhibit limited stability, biocompatibility, and cell permeation ability, making them unsuitable for complex clinical and living-cell assays. DNA framework nucleic acids,26,27 such as DNA tetrahedra,28,29 have attracted significant attention owing to their facile self-assembly, superior programmability and modifiability, high nuclease resistance and biostability, specific molecular recognition capabilities, excellent biocompatibility, and remarkable cell permeability via a caveolin-dependent pathway.30–32 Consequently, DNA framework nucleic acids are well suited for applications involving complex clinical samples and living-cell assays.
Herein, based on the miRNA sponge amplification property of circRNAs, an innovative strategy employing a DNA tetrahedron nanoprobe (DTNP) was developed for selectively recognizing target circRNAs in clinical samples and real-time monitoring of endogenous circRNAs in living cells. By leveraging the DTNP, this innovative strategy enables direct and highly sensitive detection of circRNA levels in clinical samples, thereby facilitating the study of circRNA expression under various disease states. Furthermore, due to the high cellular uptake efficiency of DTNP, the DTNP could effectively conduct bioimaging of endogenous circMTO1 in living cells. Our proposed approach offers a powerful tool for the detection and bioimaging of circMTO1 with significantly enhanced sensitivity, specificity and operational simplicity. These advancements are crucial for exploring the potential applications of circRNAs in clinical diagnostics and therapeutics, as well as for investigating the mechanisms of circRNAs in diverse biological processes.
Experimental section
Reagents and instrumentation
All chemical reagents and analytical instruments involved have been meticulously documented with specific parameters in the SI. The A549, HepG2, LO2 and HeLa cells were provided by the Cell Bank of the Chinese Academy of Sciences. The tissue samples were obtained from Ruijin Hospital in Shanghai. All experiments were performed in accordance with the ethical standards of the Helsinki Declaration, and approved by the Ethics Committee of the Medical College of Ningbo University. Informed consent was obtained from human participants of this study.
Synthesis of the DTNP
The DTNP was assembled from five custom-designed single-stranded DNA molecules. Specifically, an equimolar mixture of S1, S2, S3, S4 and S5, as detailed in Table S1, was prepared in Tris-HCl buffer solution (20 mM Tris-HCl, 50 mM MgCl2, pH 8.0) at precise equimolar concentrations. The resulting 50 μL mixture was heated at 95 °C for 10 min, followed by rapid removal from the PCR machine and subsequent cooling in a refrigerator at 4 °C for over 2 h. The sample was stored at 4 °C for future use.
Synthesis of circular RNA
Circular RNA was formed by the cyclization of linear RNA, which was facilitated by guide RNA and T4 RNA ligase 2. First, a 30 μL reaction mixture, comprising 1 μM linear RNA, 1× ligation buffer, and 1 μM guide RNA, was subjected to incubation at 95 °C for 10 min, then the mixture was gradually cooled to room temperature. Second, 20 U of T4 RNA ligase 2 was added into the mixture and then incubated at 37 °C for 1.5 h. Third, the reaction mixture was heated at 80 °C for 10 min to inactivate T4 RNA ligase 2. Lastly, the cyclized product was incubated with 10 U of ribonuclease R (RNase R) at 37 °C for 30 min to eliminate excess linear RNA, and then the reaction was conducted at 70 °C for 10 min to suppress the RNase R activity.
Fluorescence measurements
To validate the feasibility of the assay, 30 nM DTNP was mixed with 90 nM circRNA analog in Tris-HCl buffer solution and subsequently incubated at 37 °C for 75 min. For sensitivity analysis, 30 nM DTNP was reacted with various concentrations of circRNA analog (0 nM, 0.30 nM, 0.45 nM, 0.9 nM, 1.2 nM, 10 nM, 30 nM, 60 nM, 90 nM, 120 nM and 180 nM). Additionally, the circRNA analog of mismatched bases (mis-1, mis-2 and mis-3) was used to assess the selectivity of the DTNP, where these various circRNA analogs of mismatched bases were reacted with DTNP over an incubation period of 75 min at 37 °C. For cell lysate analysis, 30 nM DTNP was reacted with lysate samples containing different numbers of cells. Finally, 500 ng of total RNA tissue sample was incubated with 30 nM DTNP. The fluorescence emission spectrum for Cy3 was recorded upon excitation at a wavelength of 540 nm and measured within the range of 550 to 650 nm. All experiments were conducted in triplicate.
Cellular fluorescence bioimaging
Cells were firstly seeded into a 24-well plate and incubated in an incubator at 37 °C under 5% CO2 for 24 h. Then, the culture medium was removed, fresh culture medium was mixed with DTNP and added to each well, followed by an incubation period of 4 h. After discarding the culture medium, the cells were washed three times with PBS. Finally, fluorescence bioimaging of the cells was conducted using an FV3000 laser scanning confocal microscope.
Results and discussion
Construction and detection mechanisms of the DTNP
According to prior research reports, circMTO1 exhibits a significantly different expression pattern in normal versus pathological tissues and shows abnormal expression in various cancers. This study focuses on circular RNA mitochondrial tRNA translation optimization 1 (circMTO1) as a model target, while constructing a DNA tetrahedron-based fluorescent nanoprobe (DTNP). The DTNP was synthesized through a straightforward thermal annealing method and assembled via self-assembly of DNA strands (Scheme 1A). First, five single-stranded DNAs (S1, S2, S3, S4 and S5) were intricately assembled into a scaffold structure through complementary base interactions. Notably, the 3′ ends of S1, S2, and S3 were modified with BHQ2 quenching groups located at the vertices of the DNA tetrahedron. Second, the miRNA-760 sequence conjugated with Cy3 fluorescent dye served as the recognition sequence and was hybridized to each vertex of the DNA tetrahedron. Third, by precisely monitoring the assembly process, we enabled the DTNP to trigger a fluorescence transition from “OFF” to “ON”, thereby facilitating the detection of circMTO1 in clinical samples and living cells. As illustrated in Scheme 1B, when circMTO1 is absent, the fluorescence remains inactive; however, upon introduction of circMTO1, the miRNA-760 sequence is complementary to circMTO1 enabling specific adsorption through typical complementary base pairing principles—resulting in the activation of fluorescence signals. Therefore, this strategy of using the DTNP could achieve the goal of accurately detecting the expression level of circMTO1 in living cells.
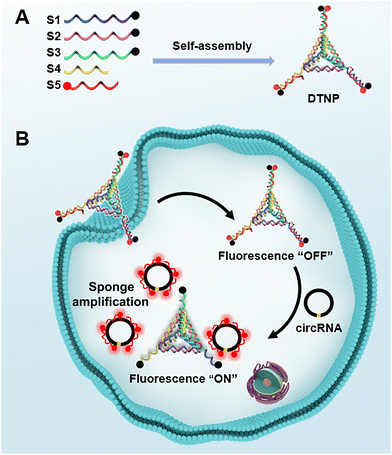 |
| | Scheme 1 (A) Assembly of the DTNP. (B) Mechanism of detection and in situ imaging of circRNA with the DTNP in living cells. | |
Characterization of the DTNP
The assembly of the DTNP was initially confirmed using agarose gel electrophoresis. The experimental results demonstrated a gradual decrease in electrophoretic mobility from lane 1 to lane 5, correlating with the sequential hybridization of strands S1, S2, S3, S4, and S5. Moreover, the presence of single bands indicated the high purity of the assembled DNA structure. These findings preliminarily suggested successful assembly of the DTNP (Fig. 1A). To further validate the assembly of the DTNP, transmission electron microscopy (TEM) and atomic force microscopy (AFM) images were employed to observe its morphology. The results showed the vertebral-shaped and triangular-shaped DTNP with dimensions of approximately 15 nm (Fig. 1B and C). Furthermore, dynamic light scattering (DLS) analysis also indicated that the particle size of the DTNP was about 15 nm (Fig. 1D). Collectively, these results confirmed the successful preparation of the DTNP.
 |
| | Fig. 1 (A) Agarose gel electrophoresis when preparing the DTNP. Lane M: DNA marker; lane 1: S1; lane 2: S1 + S2; lane 3: S1 + S2 + S3; lane 4: S1 + S2 + S3 + S4; lane 5: S1 + S2 + S3 + S4 + S5. (B) AFM image of the DTNP. (C) TEM image of the DTNP. (D) DLS of the DTNP. | |
Fluorescence quenching capabilities of the prepared DTNP
In the DTNP system, fluorophores located at the vertices are quenched by adjacent quenchers, and their fluorescence quenching efficiency is dependent on the ratio of S1, S2, S3, S4, and S5 during the fabrication process of the DTNP. As the proportion of S5 increases, the fluorescence of Cy3 is progressively quenched, achieving stability at a ratio of 1![[thin space (1/6-em)]](https://www.rsc.org/images/entities/char_2009.gif) :1:1:1:3.75 (Fig. S2). Considering quenching efficiencies for maximization purposes, we ultimately selected a ratio of 1:1:1:1:3.75 for S1, S2, S3, S4, and S5.
:1:1:1:3.75 (Fig. S2). Considering quenching efficiencies for maximization purposes, we ultimately selected a ratio of 1:1:1:1:3.75 for S1, S2, S3, S4, and S5.
Performance evaluation of the DTNP in buffer
The assessment focused on the performance of the DTNP in buffer solution by fluorescence measurements. First, the results of agarose gel electrophoresis analysis, as shown in Fig. 2A, revealed that the circularity of the circMTO1 analog was stable because of its unique closed-loop structure, while the linear RNA could be digested by RNase R. These results revealed that the circMTO1 analog was successfully synthesized. Second, we evaluated the feasibility of the DTNP for detecting the circMTO1 analog by fluorescence spectra. As shown in Fig. 2B, in the absence of the circMTO1 analog, the DTNP exhibited an exceptionally low fluorescence background signal when in buffer solution. However, in the presence of the circMTO1 analog, a significant fluorescence signal was observed. This result indicated that miRNA-760 could be adsorbed by the circMTO1 analog via 11 binding sites and released from the DTNP, resulting in the formation of significantly more stable double-stranded structures.
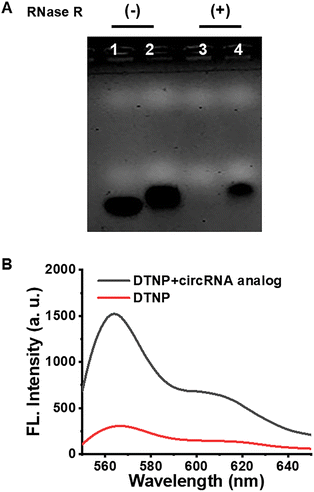 |
| | Fig. 2 (A) Characterization of the RNase R-digested circRNA analog by 4% agarose gel electrophoresis. Lane 1: linear RNA; lane 2: circRNA analog; lane 3: linear RNA + RNase R; lane 4: circRNA analog + RNase R. (B) Fluorescence spectra of 30 nM DTNP without (control, red line) and with (black line) 90 nM circRNA analog: λex = 540 nm; λem = 550–650 nm. | |
Next, we optimized the pH value, reaction duration and temperature for circMTO1 analog detection in buffer solution. These results revealed that under the optimal conditions of pH 8.0, with a reaction duration of 75 min and a reaction temperature of 37 °C (Fig. S1), the degree of Cy3 fluorescence recovery reached its peak efficiency. Under the optimized conditions, we investigated the responsiveness of the DTNP to a range of circMTO1 analog concentrations (from 0 to 180 nM). As shown in Fig. 3A, a corresponding increase in fluorescence intensity was observed with the increased concentration of circMTO1 analog. Furthermore, Fig. 3B shows that the fluorescence intensity value is linearly correlated with the concentrations of the circMTO1 analog within the range of 0.3 to 1.2 nM (inset) and R2 is 0.994. Based on the 3σ/slope rule, the low limit of detection (LOD) was estimated to be 79 pM, which compares with other LODs for circRNAs previously reported in the literature (Table S2). To assess the sequence specificity of the DTNP, circMTO1 analogs with one, two and three base mutations at the adsorption sites were designed, respectively. The target circMTO1 analogs in the DTNP solution exhibited the highest fluorescence intensity compared to the circMTO1 analogs with mutations. When the DTNP reacted with sequences containing three types of base mutations, the resulting fluorescence intensity was nearly equivalent to that of the control group, indicating that the DTNP has excellent selectivity including single-base discrimination ability (Fig. S3). The above results indicate that the DTNP has high sensitivity and specificity toward the target circMTO1.
 |
| | Fig. 3 (A) Fluorescence spectra of the DTNP with the different concentrations of circRNA analog (0 to 180 nM) in Tris-HCl buffer (20 mM Tris-HCl, 50 mM MgCl2, pH 8.0). (B) The corresponding fluorescence intensity values, where the inset shows the linear dependence of fluorescence intensity and circRNA analog concentration. Mean ± SD, n = 3. | |
Detection of circMTO1 in serum
To effectively apply the DTNP in physiological environments, ensuring robust biological stability is of paramount importance. Thus, the DTNP was further tested in Tris-HCl buffer solution and 10% FBS at various time intervals. After a 7 day evaluation in Tris-HCl buffer solution, the fluorescence intensity of the DTNP exhibited no significant changes (Fig. S4). Agarose gel electrophoresis analyses indicated that the bands of the DTNP remained unchanged even after an incubation period of 10 h (Fig. S5). However, the bands of single-stranded DNA were gradually degraded after an incubation period of 2 h. These results indicated that the DTNP has great stability in buffer solution and a biological environment. The circMTO1 analog was subsequently detected in 10% serum by the DTNP. There was a robust linear correlation between fluorescence intensity and the concentration of the circMTO1 analog with R2 = 0.991, while the LOD value was calculated to be 84.54 pM. The LOD is almost consistent with that of our previous detection test in buffer solution (Fig. 4). This result showed that the DTNP has excellent reproducibility and reliability for analyzing complex biological samples.
 |
| | Fig. 4 Linear relationship between 30 nM DTNP and varying concentrations of circRNA analog in 10% serum. Mean ± SD, n = 3. | |
Profiling of circMTO1 in cell lysates
The circMTO1 biomarker holds significant importance in the early diagnosis and treatment of cancer. We explored the feasibility of detecting circMTO1 at the cellular level using this method. The expression levels of circMTO1 were evaluated in cell lysates from normal cells (LO2) and cancer cells (HeLa, A549 and HepG2). As shown in Fig. 5A, the fluorescence intensity in HeLa cells is the highest as compared to those for the other cell types, and the fluorescence intensity in LO2 cells also higher than those in both A549 cells and HepG2 cells, suggesting that the expression levels of circMTO1 were downregulated in liver cancer cells but upregulated in cervical cancer cells. These results are consistent with those of previously reported studies.33–35 Furthermore, the results of RT-qPCR assays, as shown in Fig. 5B, further confirmed the corresponding results in fluorescence measurements. Additionally, the expression level of circMTO1 was measured in various numbers of HeLa cells by fluorescence spectra. The results showed that the fluorescence intensity was enhanced correspondingly with the increased in HeLa cell numbers and a linear relationship was obtained between 1 × 10² and 1 × 10⁵ cells, which fit well with a linear equation y = 0.295x + 556.29 with R2 = 0.991 (Fig. S4A), and the LOD was calculated to be 100 cells. We also validated the DTNP using other cell lines (LO2, HepG2 and A549). The results indicate that the lowest detection limits for these three cell lines are 300 cells (LO2), 800 cells (HepG2), and 1000 cells (A549), respectively (Fig. S6). The variability in detection limits could be attributed to differences in circMTO1 expression levels among the various cell lines.
 |
| | Fig. 5 (A) Fluorescence intensity of the DTNP with different cell lysates: 1 × 10⁵ cells per experiment. (B) CircMTO1 expression in different cells determined by RT-qPCR. Statistical significance calculated using a t-test (* p < 0.05, ** p < 0.01, *** p < 0.001). Mean ± SD, n = 3. | |
Analysis of circMTO1 in clinical tissues
To further evaluate the diagnostic potential of the DTNP for circMTO1 detection in clinical practice, we conducted a comparative analysis of matched tissue specimens from healthy controls and patients with non-small cell lung cancer (NSCLC). As shown in Fig. 6A, fluorescence measurements revealed that the levels of circMTO1 in tumor tissues from two NSCLC cases were significantly lower than those observed in normal tissues from two healthy donors. The fluorescence intensity in normal tissues was markedly higher than that in malignant tissues (Fig. 6B), indicating a strong pathological correlation between the downregulation of circMTO1 and the progression of NSCLC. These results were consistent with previous transcriptomic studies and further validated through independent verification by using RT-qPCR methods (Fig. S7). Consequently, these results indicated the potential clinical significance of circMTO1 as a diagnostic biomarker for managing non-small cell lung cancer.
 |
| | Fig. 6 (A) The fluorescence signal heatmap of tissue samples from two lung cancer patients and adjacent healthy tissues. (B) Comparative analysis of the fluorescence signals generated by lung cancer patient tissues and healthy tissues (500 ng total RNA per replicate). Mean ± SD, n = 3. | |
In situ circMTO1 imaging in living cells
Considering the high detection sensitivity and biostability of the DTNP, and taking advantage of membrane permeability with the rigid structure of the DTNP, the DTNP was then applied to circMTO1 imaging in living cells. First, we investigated the cytotoxicity of the DTNP by the CCK-8 assay in HeLa cells. After incubating with various concentrations of the DTNP in HeLa cells for 12 h and 24 h, respectively, the cell viability was consistently maintained at over 95% even at concentrations up to 100 nM, indicating that the DTNP has excellent biocompatibility and is suitable for detection and bioimaging of circMTO1 in living cells (Fig. S8). Second, due to the effective inhibition of mRNA synthesis by Actinomycin D, cells were treated with Actinomycin D to minimize the interference of linear RNA during the imaging process of circMTO1. The results showed that the expression half-life of circMTO1 was notably longer than that of linear MTO1 mRNA (Fig. S9). Subsequently, the incubation time and incubation concentration of the DTNP were optimized in living cells. The Cy3 fluorescence signals in cells gradually increased with prolonged incubation time and DTNP concentration as observed by confocal fluorescence imaging at 561 nm excitation, and these signals reached their maximum at 4 h and 50 nM (Fig. S10 and S11). These results demonstrated that the DTNP possesses excellent capability of self-delivery without transfection agents. Incubation time of 4 h and DTNP concentration of 50 nM were used as the optimal conditions for in situ imaging. Finally, the expression levels of circRNA in various cell lines (LO2, HepG2, HeLa, and A549 cells) were monitored through the use of the DTNP. As shown in Fig. 7A, after incubation with the DTNP for 4 h, confocal fluorescence imaging showed a significant decrease in fluorescence signal in both A549 and HepG2 cells as compared to that in LO2 cells, while the fluorescence signal was significantly enhanced in HeLa cells. The corresponding average fluorescence intensity shown in Fig. 7B is also consistent with the result shown in Fig. 7A, both of which are consistent with the previous RT-qPCR findings. These results indicated that our proposed strategy is capable of effectively distinguishing various cell types based on their distinctive circMTO1 expression levels, and it has provided a sensitive and reliable approach for intracellular circRNA imaging.
 |
| | Fig. 7 (A) Confocal fluorescence images of different living cells (LO2, HepG2, HeLa and A549 cells) with 50 nM DTNP: λex = 561 nm; λem = 560–590 nm. (B) The corresponding average fluorescence intensity of the DTNP in different living cells. Statistical significance calculated using a t-test (* p < 0.05, ** p < 0.01, *** p < 0.001), scale bar: 30 μm. | |
Conclusions
In summary, a novel DTNP fluorescent DNA tetrahedron nanoprobe, based on the miRNA sponge amplification property of circRNAs, was developed for the highly sensitive detection of circRNAs in clinical samples, which enabled accurate in situ bioimaging of endogenous circRNAs in living cells. The DTNP demonstrated single-base resolution and high sensitivity during detection with an LOD of 79 pM. Additionally, the DTNP exhibited excellent biocompatibility and biostability, effectively distinguishing circRNA expression levels between NSCLC patients and healthy individuals even within complex biological matrices. Notably, the DTNP facilitated in situ imaging of endogenous circRNAs in living cells and precisely distinguished between tumor cells and normal cells. Therefore, the DTNP is an innovative tool that combines molecular recognition precision with clinical practicality, offering promising potential for the early diagnosis of circRNA-related diseases.
Author contributions
Gege Xie: investigation, methodology development, data management and curation, and writing – initial manuscript. Yong-Xiang Wu and Shengrong Yu: study conceptualization, research supervision, critical review and writing – revision of the manuscript. Rong Feng and Jingwen Chen: investigation and validation. Haorong Liu and Yiming Wang: analysis of data. Shengjia Yu: resources. Keqi Tang and Yong-Xiang Wu: conceptualization, supervision and funding acquisition. All authors unanimously endorsed the final manuscript.
Conflicts of interest
No conflicts of interest are declared.
Data availability
The data supporting this article have been included as part of the supplementary information (SI). SI includes reagents and materials, agarose gel electrophoresis, atomic force microscopy (AFM), transmission electron microscopy (TEM), cell culture, cytotoxicity assay, the extraction of total RNA from cells and tissues, real-time quantitative PCR (RT-qPCR) and supplementary figures and tables. See DOI: https://doi.org/10.1039/d5an00611b.
Acknowledgements
This work was supported by the National Key Research and Development Program (2023YFC3304203), the Yangtze River Delta Science and Technology Innovation Community Joint Research Project (2023CSJGG1800), the Key Research and Development Program of Zhejiang Province (2024C03266, 2024C03101, and 2025C01200(SD2)), the Natural Science Foundation of Zhejiang Province (LY23B050002), the Open Foundation of the State Key Laboratory of Chemo/Biosensing and Chemometrics (20230770), the Major Project of Scientific and Technological Innovation 2035 of the Ningbo Science and Technology Bureau (2024Z234), the Hangzhou Science and Technology Development Project (20231203A18), and the Ningbo Science and Technology Project (2018A610315, 2019A610195, 2022Z241, 2023Z132, 2023Z168, 2023S151, 2024Z230, and 2024S047).
References
- L. L. Chen, Nat. Rev. Mol. Cell Biol., 2020, 21, 475–490 CrossRef CAS.
- I. L. Patop, S. Wüst and S. Kadener, EMBO J., 2019, 38, e100836 CrossRef.
- T. B. Hansen, T. I. Jensen, B. H. Clausen, J. B. Bramsen, B. Finsen, C. K. Damgaard and J. Kjems, Nature, 2013, 495, 384–388 CrossRef CAS.
- W. W. Du, W. Yang, E. Liu, Z. Yang, P. Dhaliwal and B. B. Yang, Nucleic Acids Res., 2016, 44, 2846–2858 CrossRef.
- I. Legnini, G. Di Timoteo, F. Rossi, M. Morlando, F. Briganti, O. Sthandier, A. Fatica, T. Santini, A. Andronache, M. Wade, P. Laneve, N. Rajewsky and I. Bozzoni, Mol. Cell, 2017, 66, 22–37 CrossRef CAS.
- C. X. Liu and L. L. Chen, Cell, 2022, 185, 2016–2034 CrossRef CAS PubMed.
- L. S. Kristensen, M. S. Andersen, L. V. W. Stagsted, K. K. Ebbesen, T. B. Hansen and J. Kjems, Nat. Rev. Genet., 2019, 20, 675–691 CrossRef CAS.
- Z. Ma, Y. Shuai, X. Gao, X. Wen and J. Ji, Mol. Cancer, 2020, 19, 137 CrossRef.
- J. Liu, Y. Zhang, C. Liu, Y. Jiang, Z. Wang, Z. Guo and X. Li, J. Controlled Release, 2024, 373, 319–335 CrossRef CAS.
- X. Dong and Y. Bai, Nat. Commun., 2023, 14, 5327 CrossRef CAS.
- C. Wang, S. Tan, W. R. Liu, Q. Lei, W. Qiao, Y. Wu, X. Liu, W. Cheng, Y. Q. Wei, Y. Peng and W. Li, Mol. Cancer, 2019, 18, 134 CrossRef.
- M. Lei, G. Zheng, Q. Ning, J. Zheng and D. Dong, Mol. Cancer, 2020, 19, 30 CrossRef CAS PubMed.
- S. Memczak, M. Jens, A. Elefsinioti, F. Torti, J. Krueger, A. Rybak, L. Maier, S. D. Mackowiak, L. H. Gregersen, M. Munschauer, A. Loewer, U. Ziebold, M. Landthaler, C. Kocks, F. le Noble and N. Rajewsky, Nature, 2013, 495, 333–338 CrossRef CAS PubMed.
- J. Zhao, E. E. Lee, J. Kim, R. Yang, B. Chamseddin, C. Ni, E. Gusho, Y. Xie, C.-M. Chiang, M. Buszczak, X. Zhan, L. Laimins and R. C. Wang, Nat. Commun., 2019, 10, 2300 CrossRef PubMed.
- W. Tang, K. Fu, H. Sun, D. Rong, H. Wang and H. Cao, Mol. Cancer, 2018, 17, 137 CrossRef.
- R. Stark, M. Grzelak and J. Hadfield, Nat. Rev. Genet., 2019, 20, 631–656 CrossRef CAS PubMed.
- M. Schwarzkopf and N. A. Pierce, Nucleic Acids Res., 2016, 44, e129 Search PubMed.
- D. K. Jaijyan, S. Yang, S. Ramasamy, A. Gu, M. Zeng, S. Subbian, S. Tyagi and H. Zhu, Nucleic Acids Res., 2024, 52, e70 CrossRef CAS PubMed.
- S. H. Wei, J. Hu, Z. Sheng, Q. Zhang, J. Zhang, B. Zhang, M. Liu and C. Y. Zhang, Anal. Chem., 2023, 96, 599–605 CrossRef PubMed.
- K. He, Z. Cheng, X. Zhang, Z. Qian, J. Chen, B. Li, F. Meng, S. Yu, K. Tang and Y. X. Wu, Anal. Chem., 2024, 96, 16338–16345 CrossRef CAS PubMed.
- C. Yang, Y. Zhang, Z. Mo, J. He, Z. Zhang, Y. Chai, R. Yuan and W. Xu, Anal. Chem., 2025, 97, 1816–1826 CrossRef CAS.
- R. Feng, S. Yu, Z. Qian, Y. Wang, G. Xie, B. Li, J. Chen, Y. X. Wu and K. Tang, Analyst, 2024, 149, 807–814 RSC.
- Z. Zhou, B. Han, Y. Wang, N. Lin, Z. Zhou, Y. Zhang, Y. Bai, L. Shen, Y. Shen, Y. Zhang and H. Yao, Nat. Commun., 2024, 15, 10900 CrossRef PubMed.
- L. Xu, Z. Lin, H. Tao, J. Ye, M. Fan, Y. Shen, G. Weng, J. Lin, X. Lin, D. Lin, Y. Xu and S. Feng, Biosens. Bioelectron., 2025, 268, 116875 CrossRef CAS PubMed.
- J. Jiao, T. Gao, H. Shi, A. Sheng, Y. Xiang, Y. Shu and G. Li, Chem. Commun., 2018, 54, 13451–13454 RSC.
- Y. Yang, Z. Ren, D. Wang, D. Tang, W. Wei, S. Song, Y. Lyu, D. Ding and W. Tan, ACS Nano, 2024, 19, 439–450 CrossRef PubMed.
- H. Wu, J. Lin, N. Ling, Y. Zhang, Y. He, L. Qiu and W. Tan, ACS Nano, 2023, 18, 119–135 CrossRef PubMed.
- Z. Qi, C. Wei, F. Zhang, Z. Wang and X. Zuo, Nano Today, 2024, 54, 102127 CrossRef CAS.
- R. Wang, Y. Liu, Y. Zhang, Q. Yi, W. Xiao, T. Wang, Q. Chen, J. Xiang, L. Song, C. Li, F. Li, L. Liu, Q. Li, C. Fan, X. Mao and X. Zuo, J. Am. Chem. Soc., 2025, 147, 7545–7554 CrossRef CAS PubMed.
- Y. Du, Y. Lyu, J. Lin, C. Ma, Q. Zhang, Y. Zhang, L. Qiu and W. Tan, Nat. Nanotechnol., 2023, 18, 818–827 CrossRef CAS PubMed.
- J. Li, X. Mao, T. Zhao, W. Fang, Y. Jin, M. Liu, C. Fan and Y. Tian, Angew. Chem., Int. Ed., 2025, 64, e202416988 CrossRef CAS PubMed.
- C. Xu, S. Chen, S. Hu, R. Li, S. Zhao and J. Zhao, Anal. Chem., 2023, 95, 11061–11069 CrossRef CAS PubMed.
- D. Han, J. Li, H. Wang, X. Su, J. Hou, Y. Gu, C. Qian, Y. Lin, X. Liu, M. Huang, N. Li, W. Zhou, Y. Yu and X. Cao, Hepatology, 2017, 66, 1151–1164 CrossRef CAS PubMed.
- B. Zhang, M. Chen, N. Jiang, K. Shi and R. Qian, Cancer Biol. Ther., 2019, 20, 1127–1135 CrossRef CAS PubMed.
- M. Chen, G. Ai, J. Zhou, W. Mao, H. Li and J. Guo, Biomed. Pharmacother., 2019, 117, 109064 CrossRef CAS PubMed.
|
| This journal is © The Royal Society of Chemistry 2026 |
Click here to see how this site uses Cookies. View our privacy policy here. 
 *ac,
Shengjia
Yu
*b and
Keqi
Tang
*ac,
Shengjia
Yu
*b and
Keqi
Tang


