
 Open Access Article
 This Open Access Article is licensed under a Creative Commons Attribution-Non Commercial 3.0 Unported Licence
Structural and thermal photobehaviour characterizations of (DPA)2MnBr4: an environmentally friendly organic–inorganic hybrid metal halide perovskite with reversible emission colour switching for anti-counterfeiting and solvent vapour photosensing†
Asmae Ben Abdelhadi‡
 ab,
Francisco Sánchez‡a,
Mario Gutiérreza,
Boiko Cohena,
Luis Lezamac and
Abderrazzak Douhal*a
ab,
Francisco Sánchez‡a,
Mario Gutiérreza,
Boiko Cohena,
Luis Lezamac and
Abderrazzak Douhal*a
aDepartamento de Química Física, Facultad de Ciencias Ambientales y Bioquímica, e INAMOL, Campus Tecnológico de Toledo, Universidad de Castilla-La Mancha (UCLM), Avenida Carlos III, S.N., 45071 Toledo, Spain. E-mail: Abderrazzak.Douhal@uclm.es
bEngineering Laboratory of Organometallic, Molecular Materials, and Environment (LIMOME), Faculty of Sciences, Sidi Mohamed Ben Abdellah University, 30000, Fez, Morocco
cDepartamento de Química Orgánica e Inorgánica, Facultad de Ciencia y Tecnología, Universidad del País Vasco, UPV/EHU, B Sarriena s/n, 48940 Leioa, Spain
First published on 26th June 2025
Abstract
Zero-dimensional (0D) lead-free hybrid manganese halides are emerging as game-changers in photonic technologies, offering a powerful combination of low cost, high emission efficiency, and exceptional optical tunability. Their outstanding luminescence makes them promising candidates for next-generation light-emitting materials and advanced sensors. Herein, we report the structural and photophysical characterization of a novel Mn-based lead-free 0D perovskite ((DPA)2MnBr4, 1, where DPA is di-n-propylammonium), at temperatures ranging from 77 to 410 K. At room temperature (RT), the Mn centres exhibit tetrahedral coordination, yielding a green luminescent material. Upon cooling to 77 K, we observed an increase in its emission intensity and a decrease in its bandwidth. At temperatures above 310 K, a phase transition occurs, which was completed at 353 K, and the tetrahedral configuration of the Mn centres converts to a red-emitting octahedral configuration. At RT, 1 exhibits a green photoluminescence quantum yield of 50% and a lifetime of 0.328 ms. Interestingly, the green-to-red emission conversion is reversible and can be switched several times by heating to 353 K and cooling to RT, highlighting its potential for encryption–decryption applications. In addition, 1 shows selective detection of vapours from several common solvents.
1. Introduction
Lead (Pb)-based halide perovskites, one of the most studied metal halide perovskites, have attracted considerable attention as promising semiconductors due to their outstanding optical properties, including high photoluminescence quantum yield (PLQY), tunable optical bandgap, and facile synthesis process.1–10 However, despite considerable progress in Pb-based perovskite research, the toxicity of the Pb element and its instability under ambient moisture, oxygen, ultraviolet (UV) light and heat are important factors hindering their commercialization.11–13 Consequently, zero-dimensional (0D) Pb-free organic–inorganic hybrid halides are being considered promising candidates to replace the Pb-halide perovskites.14–18 To date, numerous environmentally friendly metal ions have been explored as a new generation of luminescence centres, including Sn(II), Bi(III), Cu(II), Sb(III) and Mn(II).19–23Among the potential chemical elements, manganese (Mn) is considered a promising alternative to Pb in perovskites. This choice is dictated by: (1) the variety of properties observed in the organic–inorganic Mn(II)-based halide compounds, (2) its abundance and environmental friendliness, (3) flexible, inexpensive and straightforward synthesis, and (4) strong photoluminescence (PL) with colours ranging from green to red depending on the coordination environments of Mn(II) ions. All of these factors have contributed to their utilization in optoelectronic devices such as light-emitting diodes (LEDs) and photodetectors.24–28 The emission mechanism of this kind of perovskites originates from the 4T1 → 6A1 transition in tetrahedral and octahedral crystal fields for green and red emissions, respectively. The degree of Mn–Mn coupling in the crystal lattice and the crystal field strength can change the crystal structure of the material, which plays a key role in the optical properties.24,29,30 For example, due to a spin–spin interaction between the Mn2+ cations and the relatively long Mn–Mn distance (6.5–12 Å) in the tetrahedrally coordinated [MnX4]2− (X: halogen atom) centres, the related material exhibits a narrow green emission band.24,31–36 However, the octahedrally coordinated [MnX6]4− centres show a broadband orange or deep red emission as a result of a stronger coupling between the Mn2+ ions, exhibiting a shorter distance (3–5 Å).37–41 Therefore, the present knowledge shows that the Mn–Mn distance, which should be influenced by the nature of the organic cation, plays a key role in tuning their magnetic and optical properties. Dual emission (green and red) without doping with any other element has also been reported.30,42–45 Several reports have shown the possible applications of Mn-based halide perovskites; for example, lighting (LEDs), photosensing, photodetectors, X-ray scintillators, information encryption, data encryption and anti-counterfeiting.46–50
Several studies have reported on the effect of organic cations on their photophysical properties.24,27,43,51,52 In general, bulky, rigid, protonated organic cations lead to a long Mn–Mn distance to obtain strong green emission.32,35,46,53,54 However, smaller, aliphatic monovalent organic spacers lead to longer separation of the Mn(II) centres, and relatively low emission intensity.44,55,56 Thus, the size and length of the used organic cations play a role in the observed photobehavior, and it is of great interest to investigate more in this direction aiming a better understanding of the phenomenon for a better design of Mn-based perovskites for lighting and photosensing. Recently, we reported on the photophysics and photonic application of several Mn-based perovskites.36,44,45,57 We used the following spacers to observe green and red emissions, and in some cases, even a dual green-red emission behaviour: t-butylammonium (green and red), tri-propyl-ammonium (TPA, green), ethylammonium (red) and methylammonium (green and red). We also observed a large effect of the position (cis or trans) and water molecule coordination on the luminescence of the Mn2+ centres.44,45 In this series, the Mn perovskite based on the tri-propyl-ammonium cation is the only one showing a single green emission band with a relatively high photoluminescence quantum yield (PLQY, 62%).36 Aiming to explore the effect of the volume of the organic cation spacer on the emission colour and PLQY, stability of the material and other possible potential applications, without changing the chemical nature of the aliphatic part, we reduced the size of TPA by using the dipropyl ammonium (DPA) cation.
Herein, we report the synthesis and photophysical studies of a novel 0D lead-free hybrid (DPA)2MnBr4 (1). We also show and discuss the H-bonding and Mn–Mn interactions in its structure, single and powder X-ray diffraction patterns, thermal stability, EPR, and sensing ability of common solvent vapours. At room temperature (RT), 1 crystallizes in the monoclinic system with the P21/n space group, and its crystal structure reveals a 0D-structure consisting of an independent inorganic sheet of tetrahedral [MnBr4]2− centres separated by DPA organic cations. The shortest Mn–Mn distance is approximately 8.587 (10) Å. At RT, 1 emits green luminescence (537 nm), originating from the 4T1 → 6A1 transitions of Mn2+, with a PLQY of 50% and a lifetime of 0.328 ms. Upon a gradual decrease in the temperature to 77 K, we observed an increase in the emission intensity without a significant spectral shift, a narrowing of the emission bandwidth, and 3.23 kJ mol−1 as an energy barrier to non-radiative processes of the green emitters. Above 310 K, 1 starts its conversion to an octahedral configuration of the Mn centres, which is complete at around 353 K, yielding a material with a weak emission in the red region (625 nm) and with a shorter emission lifetime. The green-to-red emission (phase transition) conversion is reversible and can be switched by heating or cooling the sample. The excitation, EPR spectra and PXRD results support the phase transition from a tetrahedral to an octahedral geometry for the Mn2+ ion environment in 1 upon increasing the temperature. Last but not least, we show that the emission of 1 can be used in a reversible fashion to specifically detect vapours of several common solvents in anti-counterfeiting and in the fabrication of a greenish-down LED converter.
2. Experimental section
The details of the synthesis of the powder of 1 are described in the ESI,† and Scheme S1. Single crystals were obtained by dissolving di-n-propylammonium bromide (DPA-Br) and manganese(II) bromide tetrahydrate (MnBr2·4H2O) in distilled water and hydrobromic acid (HBr) and following a slow evaporation method. Further details on the methods and techniques used for the characterization of the hybrid organic–inorganic Mn-based compound are provided in the ESI.†3. Results and discussion
3.1. Single crystal X-ray diffraction (SCXRD)
The analysis of the SCXRD results reveals that 1 crystallizes in a monoclinic phase with the P21/n space group with the following cell lattice parameters: a = 12.3187(2) Å, b = 13.9925(2) Å, c = 14.1168(2) Å, β = 107.7259(18)°, V = 2317.77(7) Å3 and Z = 4. Detailed cell parameters and structure refinement parameters are provided in Tables S1–S3 (ESI†). Fig. 1A shows the asymmetric unit of 1, which includes two independent DPA [(C3H7)2NH2+] organic cations and one [MnBr4]2− anion unit, being total charge balanced. Each [MnBr4]2− anion is composed of one central Mn2+ surrounded by four Br−. The Mn–Br bond length varies from 2.4609(9) to 2.5189(8) Å. The Br–Mn–Br angles range from 106.15(3) to 115.42(4) °, implying a slight distortion from the ideal tetrahedral angle of 109.5° (Table S4, ESI†). The geometrical features of the [MnBr4]2− unit agree with those reported for other Mn(II) compounds containing [MnBr4]2− anions.58–61 In addition, [MnBr4]2− tetrahedra are connected to DPA organic cations through Mn⋯H/Br and C–H⋯Br hydrogen (H)-bonds, forming a zero-dimensional network (Fig. 1B and Table S5, ESI†). These weak interactions result in the formation and stability of the 3D supramolecular assembly architecture of 1. The Mn–Mn distances in 1 are 8.587(10) Å (shortest) and 16.388(10) Å (longest) (Fig. 1B), preventing a strong interaction or coupling between the [MnBr4]2− centres. In 1, the protonated DPA organic cations not only play a space-filling and charge-compensating role but also contribute to the structural propagation of the supramolecular architecture (Fig. 1C). The related optical transition is expected to be dominated by d–d transitions of 4T1(G)–6A1(6S) in independent manganese ions, yielding a green emission band (vide infra).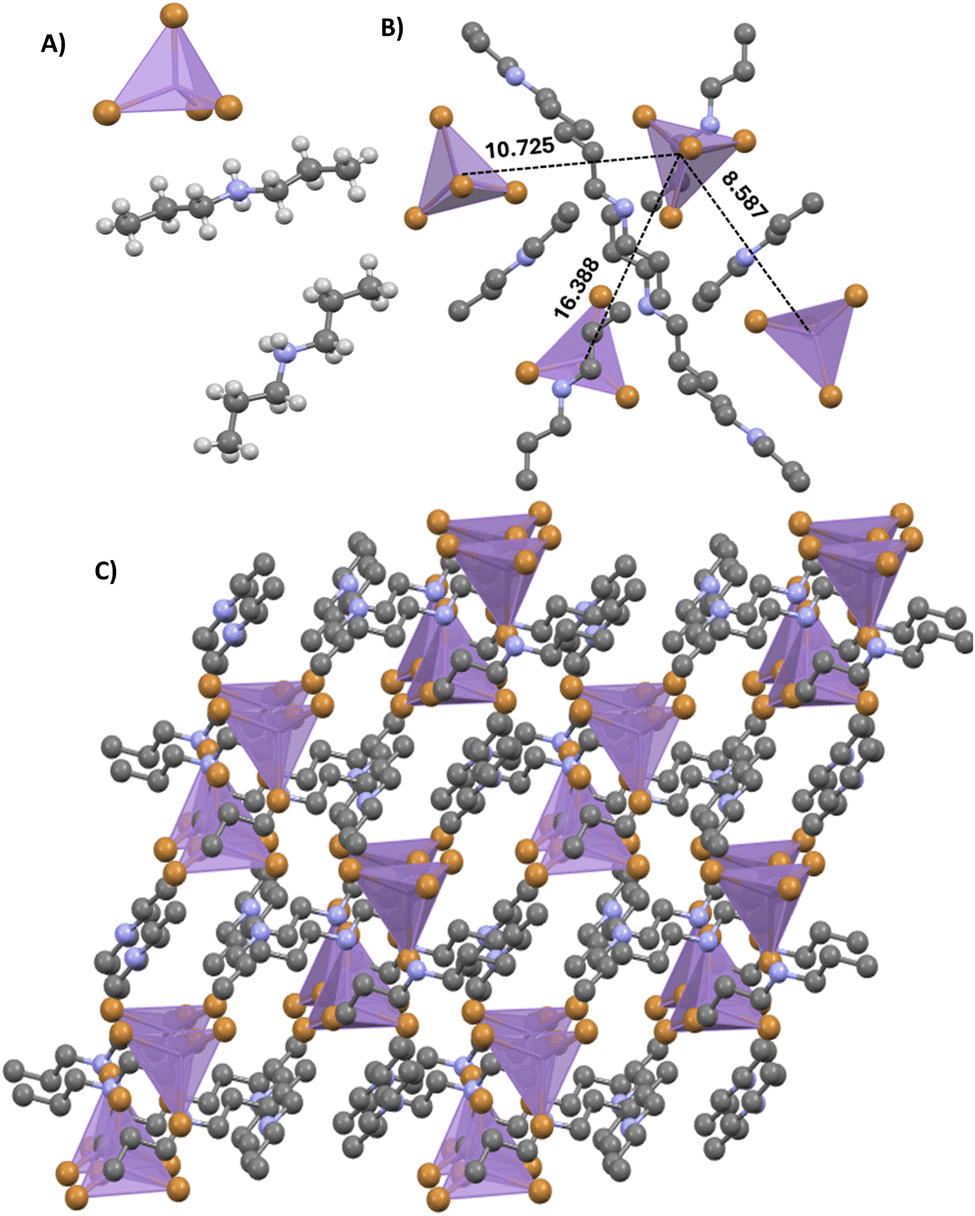 | ||
| Fig. 1 (A) Crystal structure of 1 in the asymmetric part of the unit cell. (B) Topological network of tetrahedral [MnBr4]2− in 0D hybrid manganese halides, showing the Mn–Mn spacing distances of 8.587 (10) Å (shortest) and 16.388 (10) Å (longest). The black dashed line represents the H-bonds between DPA-organic cations and [MnBr4]2− anion complex tetrahedron units. (C) Packing diagram of 1 viewed from the b-direction at room temperature. All H-atoms have been omitted for clarity. | ||
3.3. Hirshfeld surface and 2D-fingerprint analyses
To further explore the different types of intermolecular interactions involved in the crystals of 1, 3D-Hirshfeld surfaces and their associated 2D fingerprint plots were generated using the Crystal Explorer program.62 Fig. 2A–E shows the Hirshfeld surfaces mapped over the dnorm (normalized contact distance (panel A)), de (distance of atoms external (panel B)) di (internal distance (panel C)), curvedness (panel D) and shape index (panel E). 1 possesses three large red spots reflecting the molecular interactions of H-atoms with a nearby bromine atom due to close contact between them. In addition, the blue hue seen on considerable portions of the dnorm (A) and as tiny spots on the de (B) maps indicates the absence of close encounters in this area. The 2D fingerprint representations are used to plot intercontact with respect to di and de, which shows that the most significant intermolecular interactions in 1 are H⋯H and Br⋯H/H⋯Br contacts that contribute 50% and 48%, respectively (Fig. 2F). The H⋯H intermolecular interactions appear in the middle of the map due to the high number of H-atoms on its surface. On the other hand, the Br⋯H/H⋯Br contacts involving the N–H⋯Br and N–H⋯Br H-bonds appear as two narrow and symmetrical pointed-tip 2D fingerprint plots. These results are consistent with the structural information, where the stability is dominated by N–H⋯Br and C–H⋯Br interactions (Table S5, ESI†). Mn⋯H/H⋯Mn and Br⋯Br contributions are very weak (1.6% and 0.1%, respectively). Fig. 2F illustrates the crystal structure's inter- and intra-molecular interactions, highlighting the importance of H-bonds in the stability of the supramolecular structure. | ||
| Fig. 2 3D Hirshfeld surfaces mapped over (A): dnorm (close contacts are presented by red spots), (B) di, (C) de, (D) curvedness, (E) shape index representations (F) 2D fingerprints resolved into all, H⋯H, Br⋯H/H⋯Br, Mn⋯H/H⋯Mn and Br⋯Br contacts, showing the contribution to the total Hirshfeld surface area. | ||
3.4. Powder X-ray diffraction (PXRD) and thermogravimetric (TGA)-differential scanning calorimetry (DSC) analyses
The peak positions of the experimental PXRD pattern at room temperature match well with those of the SCXRD pattern (Fig. 3A). This indicates a single phase in the powder sample. | ||
| Fig. 3 (A) Room temperature PXRD pattern of 1 powder as well as the simulated pattern from SCXRD. (B) TGA-DSC thermograms of 1 in a nitrogen atmosphere. | ||
Thermal analysis of the powder was conducted using thermogravimetric analysis (TGA) and differential scanning calorimetry (DSC) under N2 flow to determine the thermal behaviour and stability in the temperature range of 303–1173 K (Fig. 3B). To begin with, it is worth noting the presence of a slight weight loss (5%) at 353 K in the TGA curve and an endothermic peak at around 497 K in the DSC curve. At 353 K, the 5% loss is assigned to the evaporation of traces of methanol (used in the synthesis) and adsorbed water molecules from the ambient atmosphere, without excluding a phase transition at this temperature, as shown in the PXRD patterns recorded at different temperatures (vide infra). Above 497 K, 1 decomposes into two main losses in the TGA curve and two endothermic anomalies in the DSC curve. The endothermic peak with a maximum at 646 K in the DSC curve, which empirically corresponds to a mass loss of 48.6% and is comparable to the theoretical one (49.1%), can be assigned to the loss of two organic moieties (DPA cations) with one bromine atom. In the DSC curve, the last endothermic peak with the maximum observed at 963 K corresponds to the partial decomposition of inorganic moieties with a total experimental weight loss of 43.1%. Finally, the final residue is stable up to a temperature of 1100 K. The thermal behaviour of 1 is similar to other previously reported for Mn-based metal hybrid halide perovskites, where the decomposition occurs in two main steps.60,63 The thermal stability of 1 up to 500 K is important for any application where the temperature may play a crucial role in the device's performance.
3.5. Electron paramagnetic resonance (EPR) observation
The room-temperature EPR spectra of 1 powder sample were recorded at both X (9.49 GHz) and Q (34.10 GHz) bands (Fig. S1, ESI†). The X-band spectrum shows a very broad signal (ΔHpp close to 3000 Gauss) centered around 2700 Gauss (geff = 2.48). For a Mn2+ system, this feature indicates a relatively large single-ion zero-field splitting in the absence of significant magnetic exchange, suggesting a distorted tetrahedral geometry for 1, in good agreement with the strong green emission (vide infra) and the SCXRD experiments. In the Q-band spectrum, the signal becomes narrower (ΔHpp = 1140 Gauss) and the geff value approaches 2.01, as expected for an S = 5/2 ion with no orbital contribution. In addition, some partially resolved shoulders can be observed on either side of the central signal. This behavior indicates that the zero-field splitting parameter D is much smaller than the microwave energy used in the Q-band experiment (1.14 cm−1). The absence of the 55Mn hyperfine structure is due to strong intermolecular dipolar interactions, which are also responsible for the observed large linewidth, consistent with the SCXRD experiment data. In addition, X-band EPR spectra were recorded at various temperatures between 295 and 403 K using a stream of N2 to heat the sample. A progressive shift and narrowing of the signal were observed up to a g-value of 2.015 and a linewidth of 315 Gauss, with more abrupt changes at temperatures around 343 and 403 K (Fig. 4 and Fig. S2, ESI†). These transitions correlate with those observed in the TGA/DSC analysis and can be attributed to the loss of solvent and coordinated water and the consequent structural rearrangements. The signal narrowing implies an increase in the magnitude of the magnetic exchange interactions and suggests a phase transition from a tetrahedral to an octahedral geometry for the Mn2+ ion environment in 1, in good agreement with the emission spectra and X-ray diffraction patterns at different temperatures (vide infra). The original signal gradually recovers upon cooling to room temperature. However, this process takes a long time if the sample remains in the quartz tube used to record the EPR spectra (Fig. S3, ESI†). | ||
| Fig. 4 (A) X-band EPR spectra of 1 recorded at different temperatures. (B) Thermal evolution of the “peak-to-peak” linewidth. | ||
3.6. Photophysical properties of 1
To characterize the photophysical properties of 1 at room temperature, we first recorded the UV-vis absorption, excitation, and emission spectra (Fig. 5A and Fig. S4, ESI†). The diffuse reflectance (converted to Kubelka–Munk (KM) function) spectrum consists of two bands with peaks at 365 and 376 nm and 436, 454 and 469 nm, corresponding to the electronic transitions of Mn2+ from the ground state 6A1 (6S) of [MnBr4]2− to the excited ones 4E(D), 4T2(D), [4A1, 4E(G)], 4T2(G), and 4T1(G), respectively. These peaks can be attributed to the electronic transitions of Mn2+ within the 3d5 orbital.30,64–66 The excitation spectrum of 1 (monitored at 540 nm emission wavelength) is not different from the diffuse reflectance spectrum, confirming the common origin of the emitting species in the ground state. Furthermore, the peak position in the spectra suggests that the absorbing structure has a tetrahedral Mn2+ configuration, which is in agreement with the SCXRD results shown above.30,65 | ||
| Fig. 5 (A) Normalized to the maximum intensity of reflectance (converted to the K–M function), excitation (observation at 540 nm), and emission (excitation at 365 nm) spectra of the as-prepared 1 powder. (B) Emission decays of 1 at 500 nm upon excitation at 371 nm (blue) and 433 nm (red). We observed the same decay gating at 500 and 580 nm (not shown). The solid red lines represent the best monoexponential fit. | ||
The emission spectrum upon excitation at 370 nm or 450 nm shows a single green band with the maximum emission intensity at 537 nm and a full-width at half-maximum (FWHM) of 2065 cm−1 (Fig. 5A), which is comparable with those of reported green-light-emitting hybrid manganese halides.36,47,67–69 In agreement with previous studies, we assign the origin of the green emission of 1 to the highly localized intra-atomic Mn2+ d–d radiative transitions of 4T1(G)–6A1(6S) in a tetrahedrally coordinated manganese cation in [MnBr4]2− units.24,37 The PLQY at room temperature is 50%, independent on the excitation wavelength, and comparable to several organic–inorganic hybrid Mn-based bromide green light materials.36,66,70 As commented in the Introduction, several studies have reported that a longer distance between the Mn2+ cations in the Mn-based materials can result in a higher PLQY.24,27,29,52 This was explained in terms of elimination of the Mn2+–Mn2+ coupling-induced emission quenching due to sufficient separation between the [MnBr4]2− tetrahedral units that impedes the energy transfer induced by coupling interactions (dipole–dipole interactions and spin-exchange interactions). A thorough comparison of Mn–Mn distances and key emission properties (λem, PLQY, lifetime and knr) of Mn-perovskite with a tetrahedral configuration was conducted. Table S6 (ESI†) presents the results from several Mn-perovskites, while Fig. S5 (ESI†) provides a graphical representation of the variation of PLQY and knr values as a function of the Mn–Mn distance. These results reveal that the PLQYs of these compounds show a general trend with the Mn–Mn distance. As shown in Fig. S5A (ESI†), most perovskites with a tetrahedral configuration and Mn–Mn distances in the range of ∼9–11 Å exhibit high PLQYs (25–99.8%). In contrast, tetrahedral perovskites with shorter Mn–Mn distances of approximately 6.5–8 Å tend to have lower PLQYs, likely due to more efficient energy transfer in these materials. We speculate that incorporating bulky, rigid, singly protonated cations such as benzyltriethylammonium (BTEA+),71 triethylammonium (TA),72 and diisopropylammonium (DIPA),73 can increase the Mn⋯Mn distance, suppress the energy transfer processes, and enable all Mn2+ centres to emit spontaneously, thereby enhancing the PLQY in these materials. This agrees with the results from the SCXRD data, which show that the DPA cations in 1, with a significant degree of steric hindrance due to their volume, generate longer distances between the adjacent [MnBr4]2− emitting centres of 8.69 Å (shortest) and 16.49 Å (longest).
To shed more light on the photophysical properties of 1, we collected the emission decays gated at different wavelengths (500 and 580 nm) and upon excitation at 371 and 433 nm (Fig. 5B). The signal is independent of the emission and excitation wavelengths and decays monoexponentially with a time constant of 0.328 ms. Previous works have reported that the emission lifetime value of Mn halides changes from nanoseconds to milliseconds regime, depending on the type of halide ions, coordination environments around Mn2+, Mn⋯Mn distance and structural stacking fashion.36,54,70,74,75 The monoexponential behaviour observed here, the long lifetime, and the relatively high PLQY suggest that the green emission is due to the d–d transition of Mn2+ ions. By comparing our previously reported data for (TPA)2MnBr4 and the present ones, we examined the effect of the organic cation volume on the photophysical properties of (DPA)2MnBr4 using the same chain but different volumes. The Mn centers in both perovskites have a tetrahedral configuration and emit in the green region. The shortest Mn–Mn distance in (TPA)2MnBr4 is 9.54 Å, while it is 8.59 Å in (DPA)2MnBr4. Using the PLQY and lifetime values of (TPA)2MnBr4 (62%, 0.39 ms) and (DPA)2MnBr4 (50%, 0.33 ms), the non-radiative rate constant (knr) values are determined to be 0.97 × 10³ s−1 and 1.52 × 10³ s−1, respectively. Therefore, the smaller volume of the cation and the shorter distance in (DPA)2MnBr4 enhance the non-radiative transitions, most likely due to a stronger interaction between the Mn2+ centres. To get more information about this, we calculated and plotted the change of knr with the Mn–Mn distance in some typical Mn-based tetrahedral hybrid perovskites (Fig. S5B and C, ESI†). The results show that, in general, for distances longer than 7.5 Å, a decrease in the knr value is observed, which can be ascribed to the reduction of Mn–Mn coupling interactions between neighbouring Mn2+ centres.
The stability of materials is an important factor affecting their commercial application. Notably, after exposing 1 powder to ambient air for 30 days, its emission spectrum maintains good consistency (80%) with that of freshly prepared powder (Fig. S6, ESI†), despite a humidity of 30–40% (winter period), indicating that 1 has good four-week stability. The main source of the decrease in the emission performance of Mn-based perovskites is moisture (humidity) at ambient conditions, and storing or using them under protective conditions improves their long-term stability.
3.7. Low-temperature-dependent emission of 1
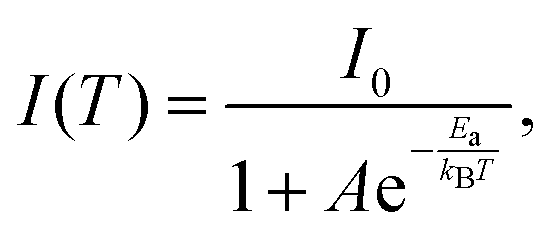
Subsequently, we investigated the luminescence properties of 1 at low temperatures. To this end, we recorded the effect of temperature (from 77 to 298 K) on the emission intensity, peak position and FWHM upon excitation at 370 nm. Fig. 6A shows a single broad emission band in the studied temperature range, in which the emission intensity increases, while the FWHM decreases upon decreasing the temperature to 77 K (FWHM = 2220 cm−1 at 298 K and 1325 cm−1 at 77 K). This behaviour is explained in terms of a decrease in the thermal filling vibration contribution in the non-radiative processes.53,76,77 In this temperature range, 1 emits from single tetrahedral Mn2+ centres, and the intensity at 298 K remains 63% of that at 77 K, while the intensity maximum blue shifts from 549 nm (77 K) to 537 nm (298 K), reflecting the lattice's thermal expansion and the increased electron–phonon coupling due to the soft lattice nature of metal halide materials. This coupling leads to a larger d–d splitting of Mn2+ and thus to a smaller energy gap of 4T1 → 6A1 transition.54,78,79 In addition, when the intensity of the crystal field splitting around Mn2+ decreases, the radiative transition between the 4T1 and 6A1 states of Mn2+ centres in the isolated tetrahedron [MnBr4]2− increases, thus the corresponding emission peak of the d–d transition blue shifts accordingly.76,80 From the temperature-dependent emission intensity, we calculated the activation energy to dark states using the Arrhenius formula (eqn (1)):
 | (1) |
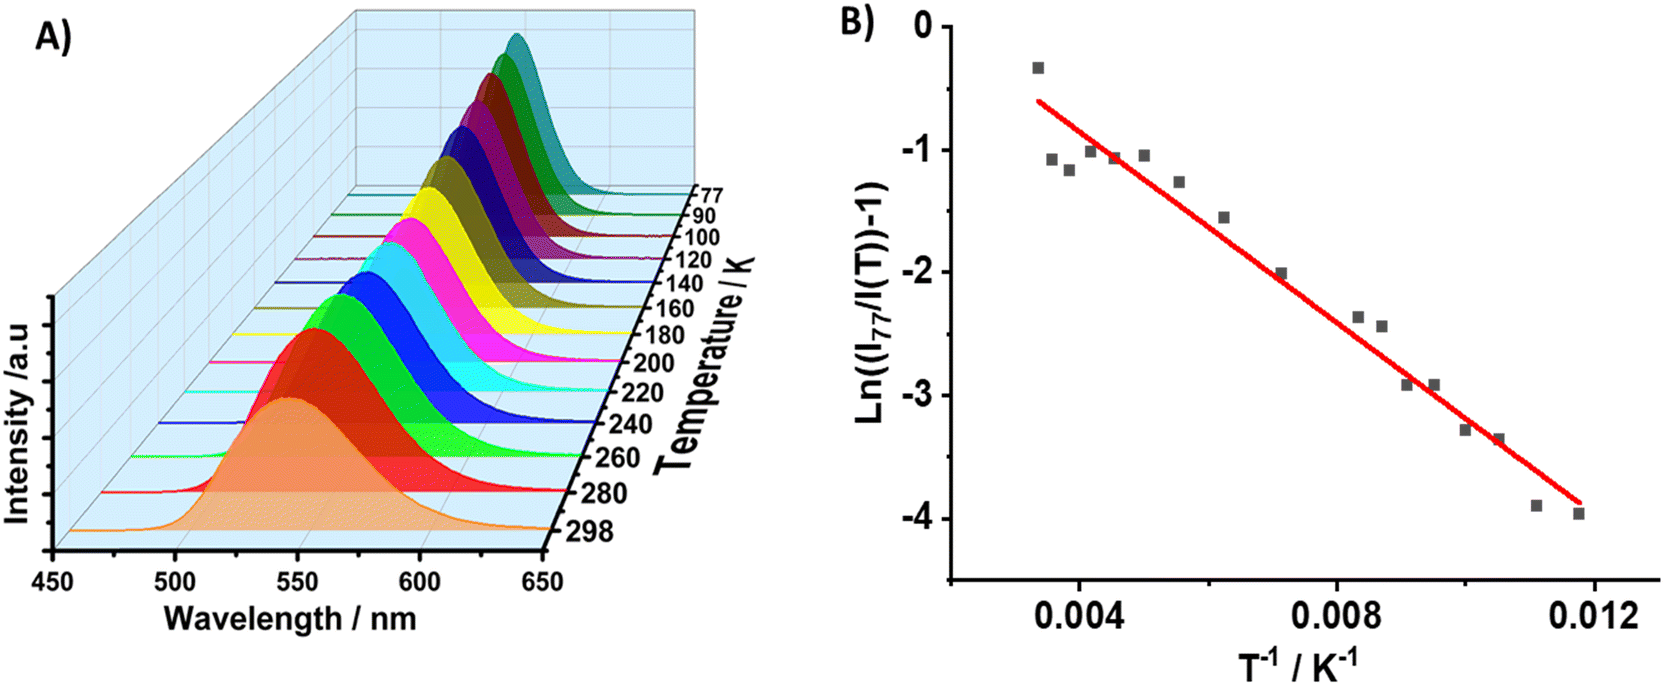 | ||
| Fig. 6 (A) Emission spectra of 1 in the 77–298 K temperature range upon excitation at 370 nm. (B) Change in the maximum emission intensity with temperature. The solid line in (B) indicates the best fit using eqn (1). | ||
3.8. High temperature-dependent emission of 1
To obtain a broader picture of the effect of temperature on the photobehaviors of 1, we recorded high-temperature-dependent emission spectra. Fig. 7A shows the spectra from 303 to 353 K upon excitation at 450 nm. The emission intensity of the main green emission band decreases significantly with increasing temperature and vanishes at 353 K. Zooming the red spectral region (Fig. 7B), we observed a very weak emission band with a maximum intensity around 690 nm at room temperature. This weak red band reflects the emission of a small population of the tetrahedral Mn2+ centres interacting with ambient water or methanol used in the synthesis, as suggested by the TGA/DSC results. The excitation spectrum at room temperature (Fig. 7C) shows a weak absorption band at 550 nm, which originates from the octahedral configuration of the Mn centres (6A1 → 4T1(G) transition). However, the same excitation spectrum does not show the band at ∼340 nm, which is characteristic of the 6A1 → 4T1(P) transition of Mn2+ in an octahedral crystal field.30 Therefore, while we cannot entirely exclude the presence of weakly emissive octahedrally-coordinated Mn centres, the most likely origin of the weak red emission arising from the interaction with the solvent molecules is self-trapped excitons (STE), as previously reported for other Mn-based perovskite systems.44 Interestingly, while the green emission band is completely quenched at 353 K, the red one shifts to shorter red wavelengths (maximum intensity at 635 nm) and increases its intensity (Fig. 7B) Examining the excitation spectra of both green and red emission bands at room and high temperatures, we suggest a conversion (crystalline phase transition) from the tetrahedral configuration of the Mn-centres to an octahedral one upon heating the sample (Fig. 7C and Fig. S7, ESI†). This crystalline phase transition was probably triggered by the loss of solvent molecules (5% mass) observed at 353 K, as described in the TGA section. The excitation spectrum gated at 650 nm and 353 K shows five peaks at 360, 370, 420, 462, and 533 nm. The broadband at 533 nm, which is typical of an octahedral configuration of Mn (MnBr6), is attributed to the spin-forbidden 4T1 → 6A1 transition of Mn2+. Thus, the new red emission band originates from the octahedral coordinated Mn emitters. To gain more insights into the photobehaviour of 1, we recorded emission decays at around 340 K and at the green and red emission bands upon excitation at 433 nm (Fig. 7D). The decay strongly depends on the observation wavelength. At the green band (530 nm), the signal shows a single decay component of ≈ 181 μs. This time constant reflects the lifetime of the emitters having a tetrahedral configuration, and its value is shorter than the one observed at RT (0.328 ms) due to the enhancement of non-radiative processes at higher temperatures because of the lattice's thermal expansion with the temperature and the increased electron–phonon coupling effects on the soft lattice nature of 0D metal halide perovskites.82–84 However, the signal collected at the red band (650 nm) decays bi-exponentially with time constants of τ1 = 8 μs and τ2 = 180 μs.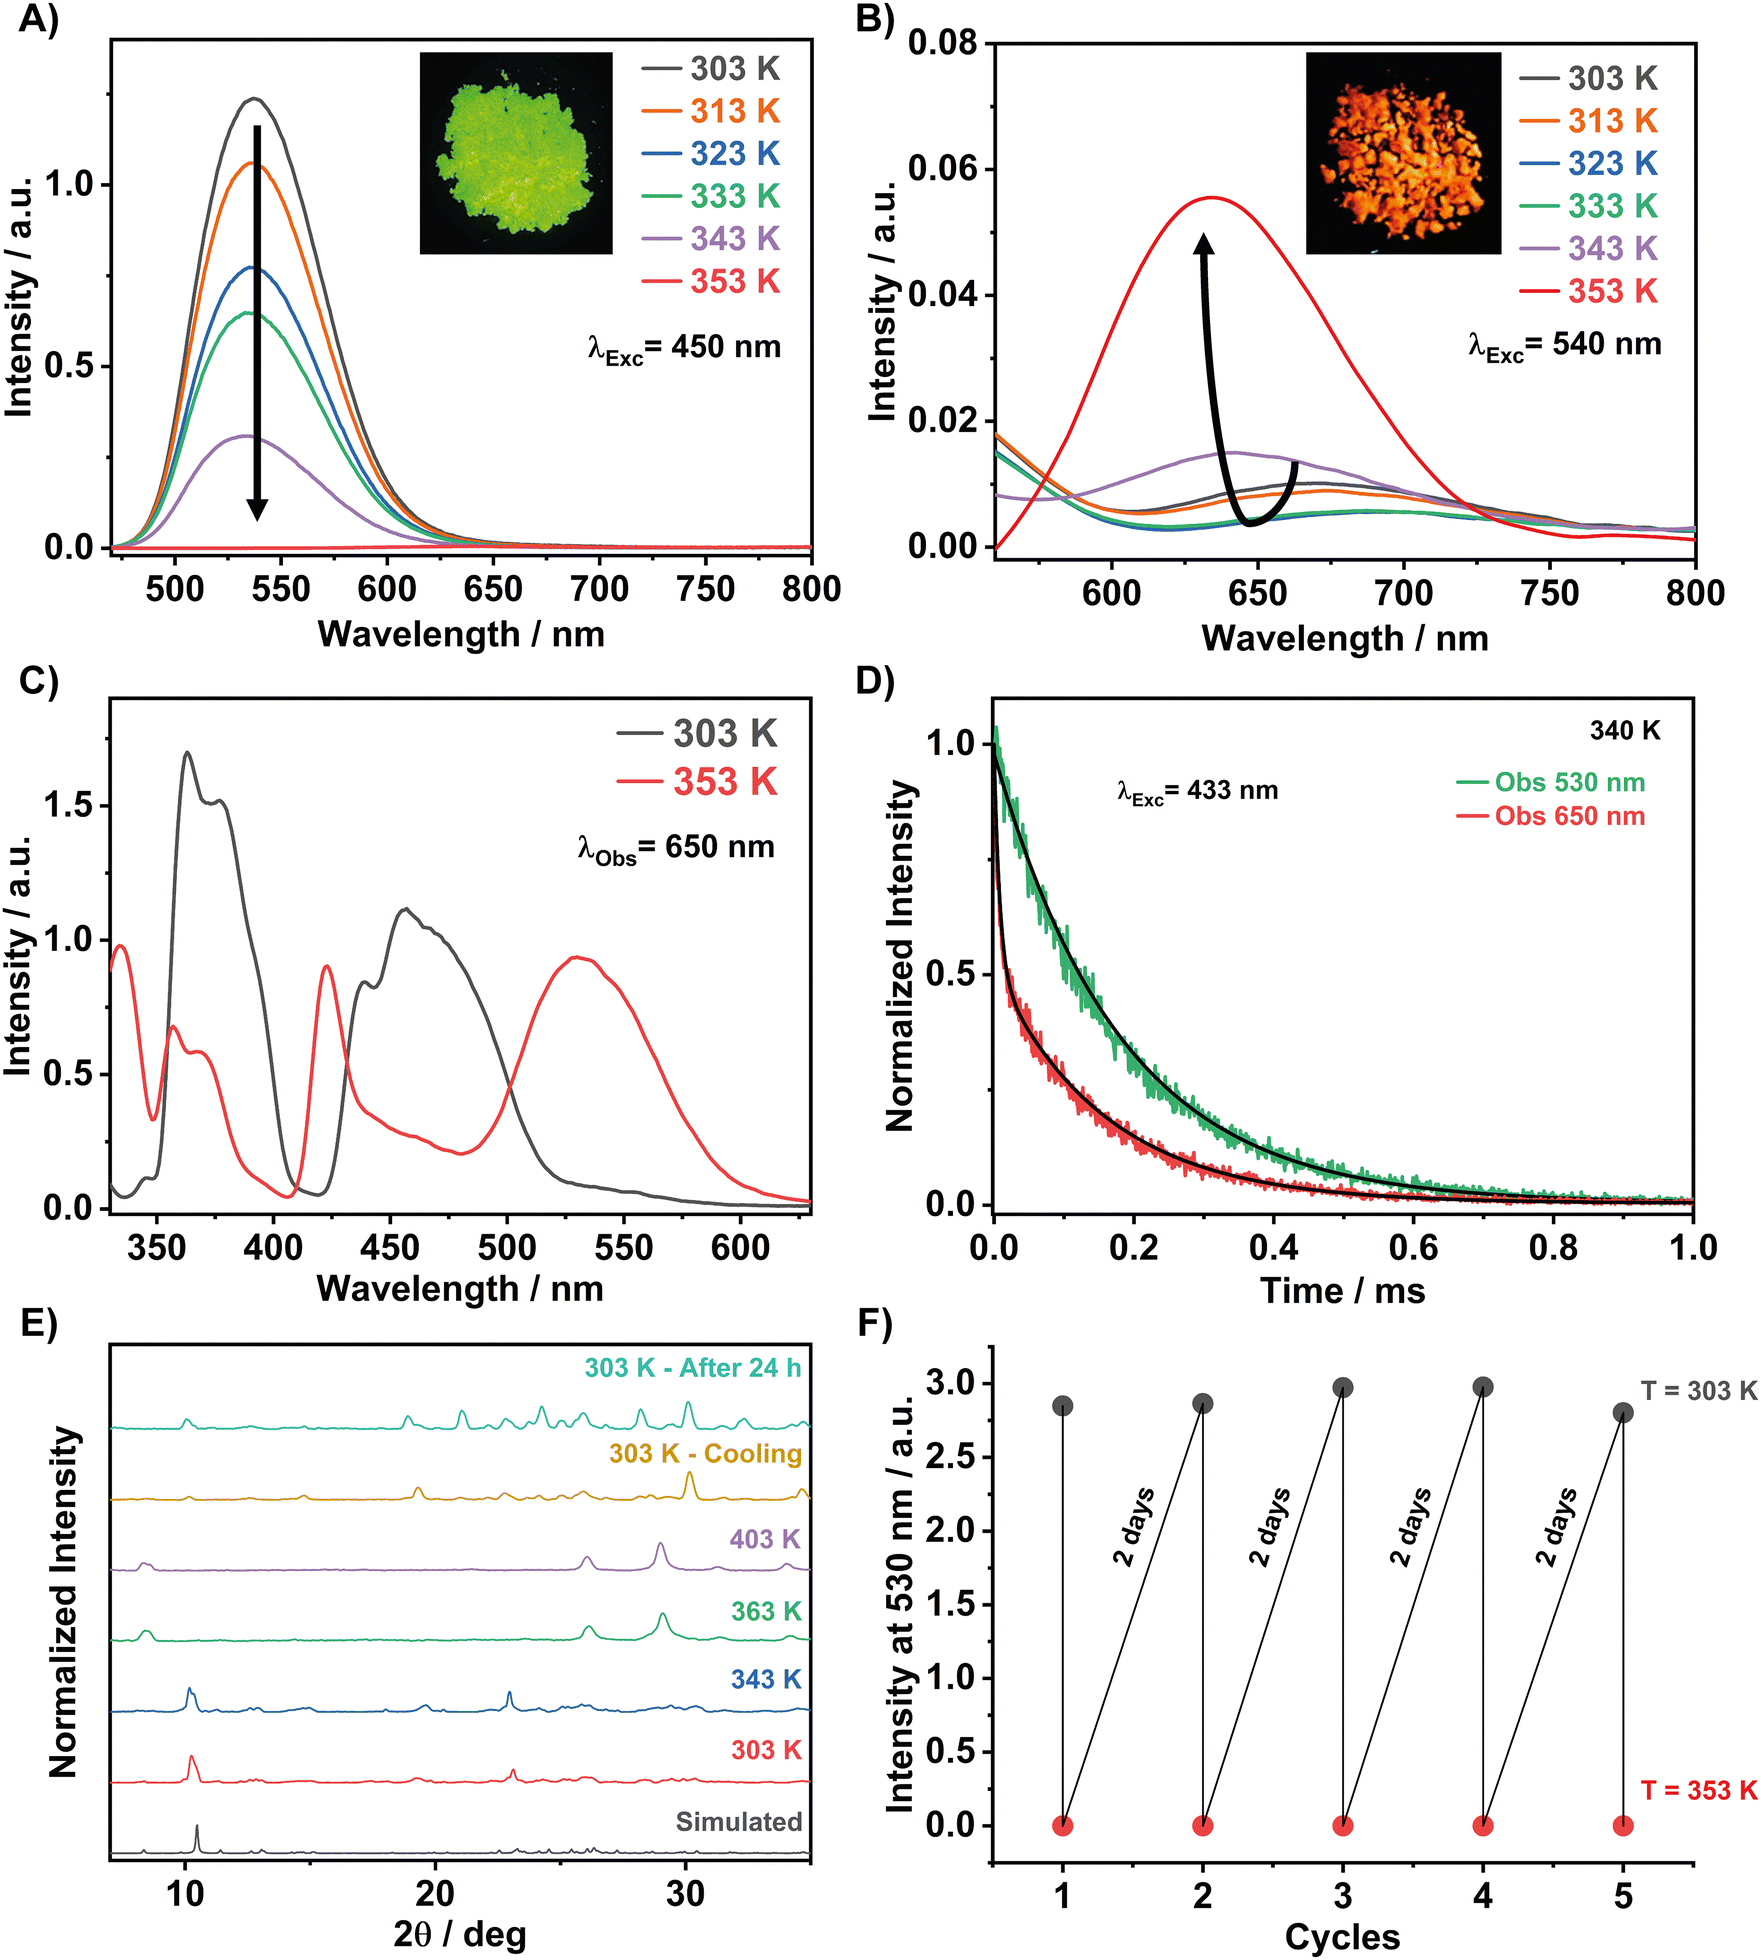 | ||
| Fig. 7 Effect of temperature on the emission and excitation spectra of 1. (A) and (B) Emission spectra in the green and red regions upon excitation at 450 nm and upon heating the sample from 303 to 353 K. (C) Excitation spectra gated at 650 nm at temperatures of 303 and 353 K. (D) emission decays of 1 at green (530 nm) and red (630 nm) emission bands upon excitation at 433 nm and at a temperature of approximately 340 K. The solid lines are from the exponential fits of the signal. (E) Simulated (from single crystal) and powder X-ray diffraction patterns of 1 at the indicated temperatures. (F) ON/OFF of the emission intensity at 530 nm upon heating to 303 K and cooling to 353 K. | ||
The longer time constant at 650 nm corresponds to the lifetime of the tetrahedral emitters that still have a significant contribution in the red region, while the short time constant is due to the octahedral Mn2+ emitters. The large difference in the lifetime values of both emitters reflects the variance in their emission intensities (Fig. 7A).
The proposed mechanism, which is based on the occurrence of a thermal phase transformation in this temperature range, is also supported by the experimental PXRD and EPR spectra at different temperatures. Fig. 7E shows that the crystalline structure of 1 remains unchanged and the material is not prone to any phase transition upon increasing the temperature from 303 to 343 K. However, most of the diffraction peaks disappeared and new ones appeared when 1 was heated to 363 K. Therefore, the significant changes in the PXRD patterns indicate the appearance of a new crystalline phase, which is different from the tetrahedral one described above at RT. Heating up to 403 K, the material maintains this new crystalline phase, and we observed a complete phase-to-phase transformation. Based on the red emission band and the excitation spectrum of the red emitters, characteristics of Mn2+ ions in an octahedral configuration, we believe that at around 363 K, we are observing a tetrahedral to an octahedral configuration change of the Mn centres. This requires an energetic cost for the motion of the bromide anions and most probably the DPA organic cations in the environment. Interestingly, upon cooling the sample to room temperature for one hour in the X-ray apparatus chamber, the initial PXRD is almost recovered, which indicates a reversible thermal phase transition process in the configurations of the Mn centres (Fig. 7E).
We took advantage of this reversibility by recording the ON/OFF of the green emission intensity upon heating to 353 K and cooling to 303 K (Fig. 7F). A complete recovery of the green emission intensity was achieved after 48 h, while a fast recovery of 70% was observed in approximately 20 min (Fig. S8, ESI†). We believe that the slow recovery kinetics at room temperature are due to the required large changes in the environment around each Mn centre. In a video, we demonstrate the reversibility of the colour change (green to red to green) upon heating and cooling the sample (Video S1 in ESI†).
3.9. Potential applications of 1 in encryption–decryption technology
Recent studies have explored the use of 0D Mn-based perovskites for anti-counterfeiting applications.47,49,67,85–87 However, most of these perovskite materials are limited to a single emission colour (red or green); thus, information can only be decrypted through one key, limiting their security and versatility. Other reports used two or three emissions but combined different centres from different compounds.49,72,87 However, dual- or multi-key decryption, which offers enhanced security, has yet to be realized in these perovskite materials. Herein, we demonstrate the potential of 1 in the fields of anti-counterfeiting applications due to its temperature-dependent dual emission characteristics. One key advantage of 1 is its ability to switch colors between green and orange/red (and vice versa) upon heating and cooling, with a rapid response and no need for additional materials (Video S1, ESI†). This thermophotochromic property might pave the way for the realization of a dual-key encryption–decryption system. To demonstrate this potential in a straightforward manner, we impregnated letters (writing “HOLA” message, which means “Hello” in Spanish) with 1 in ethanol, followed by air-drying of the letters. As anticipated from the temperature-dependent emission colour discussed above, this information can be encoded as follows: at RT and under daylight, the paper is white and does not show noticeable features; however, under UV irradiation (365-nm), the letters “HOLA” emit an intense green light. When the same sample is heated to 353 K, the message color changes to orange-red, and upon cooling back to RT, it returns to green (Scheme 1). In this sense, the message could be decoded by showing the red colour, contrary to other reported Mn-perovskites.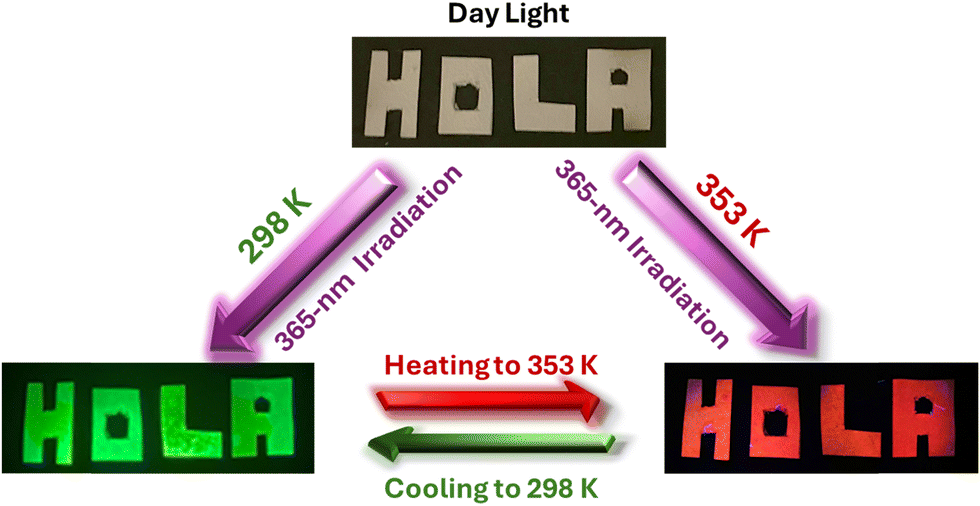 | ||
| Scheme 1 Illustration of a dual-key encryption–decryption thermophotochromic phenomenon using heat and light to read codes (two colours) in a single compound, 1, adsorbed on a white filter paper. | ||
3.10. Down-converter LED application of 1
We also explored the possibility of using this 0D hybrid manganese halide perovskite as a potential green phosphor material in the lighting field, particularly in the construction of green down-converted LEDs. To this end, a certain amount of 1 will be deposited onto a commercially available blue (465 nm) LED. However, given that the emission intensity of 1 drastically decreases with temperature (Fig. 7A) and that the surface of this LED may reach up to 353 K depending on the applied voltage, it is necessary to implement measures to mitigate the thermal quenching of the LED-induced emission. The down-converted LEDs were prepared by placing two layers of transparent polymethyl methacrylate (PMMA) polymer films (with a thickness of 0.15 mm each) onto a commercial 465-nm LED chip (3.5 × 2.8 mm2), followed by the deposition of 10 mg of compound 1 on the top of the PMMA layer. In this configuration, the transparent PMMA layers act as thermal insulators, boosting the emission intensity and stability of 1. Fig. 8A shows a photograph of the fabricated down-converted LEDs at different applied voltages (2.6 V (5 mA), 2.7 V (20 mA), and 2.8 V (55 mA)), demonstrating the green emission of these devices. We also measured the emission properties of these down-converted LEDs at the same applied voltages as represented in the photos (Fig. 8B). The collected emission spectra for the lighting devices at these three voltages exhibit two bands corresponding to the emission of the LED at 465 nm, and the green emission of 1 powder perovskite at 535 nm. When the applied voltage was increased to 2.8 V, the emission intensity of 1 (band at 535 nm) slightly decreased, suggesting possible photodegradation of this material at such high voltage. The CIE coordinates of the fabricated down-converted LEDs were (0.24, 0.50) when the applied voltage was 2.6 V; (0.23, 0.47) when the applied voltage was 2.7 V; and (0.22, 0.42) when the applied voltage was 2.8 V (Fig. 8C). Finally, we also tested the stability of 1 in the down-converter LED under continuous operation at 2.7 V. As shown in Fig. 8D, compound 1 exhibited relatively high stability, retaining up to 85% of its initial emission intensity (measured at 535 nm) after 2 hours under intermittent operating conditions. | ||
| Fig. 8 (A) Real photos of the down-converter LEDs fabricated by depositing 10 mg of 1 onto a blue 465 nm-LED chip containing two films of PMMA. (B) Emission spectra of the LEDs under different applied voltages: 2.6 V (black solid line), 2.7 V (red solid line), and 2.8 V (blue solid line). (C) CIE chromaticity coordinates of the LEDs at different applied voltages from 2.6 to 2.8 V. (D) Emission intensity of the fabricated down-converter LED recorded at 535 nm under working operation conditions (at 2.7 V) for 2 h. | ||
3.11. Photosensing of common organic solvent vapours
Numerous studies of Mn-based perovskites have reported on the sensitivity of these materials to the vapours of organic solvents.44,54,88 We explored the sensitivity of 1 to the presence of different solvent vapours. To this end, we prepared paper stripes impregnated with 1. Upon activation (heating at 298 K) and before interaction with a solvent vapor-saturated atmosphere, the paper stripes show intense green emission under 365-nm UV light at RT (Scheme S2, ESI†). Table 1 summarizes the observed vapochromic behaviour and the corresponding photos obtained under 365-nm UV light. Based on the quenching and recovery of the green emission, we classify the results of the photosensing of the solvent vapours into three groups. Group I, for the vapours of non-polar solvents, such as hexadecane and n-hexane, in which the emission is preserved. Group II: methanol, ethanol, ethyl-acetate, acetone, benzene and toluene, in which intense green emission is completely quenched in 15 min. Group III: acetonitrile, dimethylformamide, dioxane and tetrahydrofuran, where the quenching is slow, and complete after 6 hours of exposure at RT. The origin of the observed vapochromic effect is most likely due to the interactions of the solvent molecules with the DPA organic cations through their protonated –NH3+ groups, which induce structural changes in the environment around the Mn2+ emitters, and probably chemical bonding around them. Such interactions depend on the solvent molecule's nature, and they are very weak or nonexistent in non-polar solvents (group I). Under gentle heating of the stripes, the recovery can be reversible or irreversible, depending on the interaction strength and changes in the Mn environment. These results show that 1 exhibits a selective luminescent vapochromic behaviour, particularly fast (within a few minutes) compared with that of group II. Green emission is easily recovered after gentle heating to evaporate the solvents from the stripe. The emission recovery of the stripes exposed to group III is less uniform and is complete for acetonitrile and tetrahydrofuran atmospheres, whereas it is partial for dioxane and does not recover when exposed to dimethylformamide and triethyl amine vapours.| Group | Solvent | Before activation (25 °C, ambient) | Activation (dry, 25 °C) | After 15 min exposure (25 °C) | After 6 hours of exposure (25 °C) | Recovery (dry, 25 °C) |
|---|---|---|---|---|---|---|
| I | Hexadecane and hexane |  |
 |
 |
 |
 |
| II | Toluene |  |
 |
 |
 |
 |
| MeoH, EtOH, ethyl acetate and benzene |  |
 |
 |
 |
 |
|
| Acetone |  |
 |
 |
 |
 |
|
| III | Acetonitrile, tetrahydrofurane |  |
 |
 |
 |
 |
| Dimethylformamide |  |
 |
 |
 |
 |
|
| Dioxane |  |
 |
 |
 |
 |
|
| Triethylamine |  |
 |
 |
 |
 |
4. Conclusion
In conclusion, we reported the structural characterization and photophysical behaviour of a novel 0D lead-free hybrid (DPA)2MnBr4 (1) from 77 to 410 K. We showed the involvement of different H-bonding and Mn–Mn interactions in strengthening its structure. Single-crystal and powder X-ray diffraction patterns, thermal stability, EPR, steady-state and time-resolved emission studies were used to characterize 1. At RT, 1 crystallizes in the monoclinic system with the P21/n space group and its result reveals a 0D structure consisting of an independent inorganic sheet of tetrahedral units [MnBr4]2− centres separated by DPA organic cations. The shortest Mn–Mn spacing distance is about 8.59 Å. The Mn2+ ion emission at RT is green (537 nm) and originates from the 4T1 → 6A1 transitions, with a PLQY of 50% and a lifetime of 0.328 ms. The green emission intensity increases without a significant spectral shift when the temperature is gradually decreased to 77 K, while the bandwidth decreases, indicating a reduction in the lattice's thermal expansion at low temperatures and a decreased electron–phonon coupling due to the soft lattice nature of metal halide materials. Above 310 K, 1 starts the conversion of its coordination to an octahedral one, which is complete at approximately 353 K. The excitation and EPR spectra, along with the PXRD results, support the occurrence of a phase transition at high temperatures from a tetrahedral (RT) to an octahedral geometry of the Mn centres. The emission of the octahedral Mn2+ is red (625–640 nm), contrary to the green emission of the tetrahedral configurations, and is relatively weak with a shorter lifetime (microsecond regime). Interestingly, the phase transition reflected as the emission colour change from green to red is reversible and can be switched by heating or cooling the solid sample in several cycles. Last, but not least, we show that the emissions of 1 can be used in reversible encryption–decryption applications and to specifically detect vapours of several common solvents.Author contributions
Asmae Ben Abdelhadi: writing – original draft, validation, methodology, investigation, and formal analysis. Francisco Sánchez: visualization, validation, investigation, and formal analysis. Mario Gutiérrez: writing – review & editing, writing – original draft, visualization, validation, methodology, investigation, and formal analysis. Boiko Cohen: writing – review & editing, visualization, validation, investigation, and formal analysis. Luis Lezama: writing – original draft, validation, methodology, investigation, and formal analysis. Abderrazzak Douhal: writing – review & editing, writing – original draft, visualization, validation, supervision, resources, project administration, methodology, investigation, funding acquisition, formal analysis, data curation, and conceptualization. All experiments were performed at the Universidad de Castilla La Mancha (Spain) and the Universidad del País Vasco (Spain).Conflicts of interest
The authors declare that they have no conflicts of interest.Data availability
The data that support the findings of this study will be openly available in ZENODO.ORG, and the reference number will be available later. The authors confirm that the data supporting the findings of this study are available within the article and its ESI.†Acknowledgements
This work was supported by the following grants: grant PID2020-116519RB-I00 and TED2021-131650B–I00 funded by MICIU/AEI/10.13039/501100011033 and the European Union (EU); grants SBPLY/23/180225/000196 and SBPLY/21/180501/000108 funded by JCCM and the EU through “Fondo Europeo de Desarrollo Regional” (FEDER); grant 2022-GRIN-34325 funded by UCLM (FEDER). A.B.A. is grateful for the grant from the Spanish Service for the Internationalization of Education (SEPIE), through the EU Erasmus+ key action program (2020-1-ES01-KA107-079868), and F.S. would like to thank the Ministerio de Universidades for the FPU21/04332 national fellowship. The authors would like to thank Mr Miguel Gascón Madrid for his technical assistance in the synthesis of the product and steady-state absorption and emission spectra.References
- C. Zhou, H. Lin, S. Lee, M. Chaaban and B. Ma, Mater. Res. Lett., 2018, 6(10), 552–569 CrossRef CAS.
- Q. Chen, N. De Marco, Y. Yang, T.-B. Song, C.-C. Chen, H. Zhao, Z. Hong, H. Zhou and Y. Yang, Nano Today, 2015, 10, 355–396 CrossRef CAS.
- Y. Zhang, S. Li, W. Yang, M. K. Joshi and X. Fang, J. Phys. Chem. Lett., 2019, 10, 2400–2407 CrossRef CAS.
- X. Y. Chin, D. Cortecchia, J. Yin, A. Bruno and C. Soci, Nat. Commun., 2015, 6, 7383 CrossRef CAS PubMed.
- C. Y. Kang, C. H. Lin, C. H. Lin, T. Y. Li, S. W. Huang Chen, C. L. Tsai, C. W. Sher, T. Z. Wu, P. T. Lee, X. Xu, M. Zhang, C. H. Ho, J. H. He and H. C. Kuo, Adv. Sci., 2019, 6, 1902230 CrossRef CAS.
- W. Wang, Y. Zhang, W. Wu, X. Liu, X. Ma, G. Qian and J. Fan, J. Phys. Chem. C, 2019, 123, 13110–13121 CrossRef CAS.
- H. Wei, Y. Fang, P. Mulligan, W. Chuirazzi, H.-H. Fang, C. Wang, B. R. Ecker, Y. Gao, M. A. Loi, L. Cao and J. Huang, Nat. Photonics, 2016, 10, 333–339 CrossRef CAS.
- S. Adjokatse, H.-H. Fang and M. A. Loi, Mater. Today, 2017, 20, 413–424 CrossRef CAS.
- S. Rakshit, P. Piatkowski, I. Mora-Seró and A. Douhal, Adv. Opt. Mater., 2022, 10, 2102566 CrossRef CAS.
- P. Galar, P. Piatkowski, T. T. Ngo, M. Gutiérrez, I. Mora-Seró and A. Douhal, Nano Energy, 2018, 49, 471–480 CrossRef CAS.
- Y. Deng, Z. Xiao and J. Huang, Adv. Energy Mater., 2015, 5, 1500721 CrossRef.
- S. Khatoon, S. Kumar Yadav, V. Chakravorty, J. Singh, R. Bahadur Singh, M. S. Hasnain and S. M. M. Hasnain, Mater. Sci. Energy Technol., 2023, 6, 437–459 CAS.
- N. Aristidou, I. Sanchez-Molina, T. Chotchuangchutchaval, M. Brown, L. Martinez, T. Rath and S. A. Haque, Angew. Chem., Int. Ed., 2015, 54, 8208–8212 CrossRef CAS.
- W. Ke and M. G. Kanatzidis, Nat. Commun., 2019, 10, 965 CrossRef PubMed.
- P. Priyadarshini, S. Senapati and R. Naik, Renew. Sustainable Energy Rev., 2023, 186, 113649 CrossRef CAS.
- Y. Wang, J. Liu, Y. Liu, S. Li, X. Xu and Z. Lou, J. Mater. Chem. C, 2024, 12, 10267–10329 RSC.
- S. Sajid, S. Alzahmi, I. B. Salem, N. Tabet, Y. Haik and I. M. Obaidat, Mater. Renew. Sustainable Energy, 2024, 13, 133–153 CrossRef.
- M. Wang, W. Wang, B. Ma, W. Shen, L. Liu, K. Cao, S. Chen and W. Huang, Nano-Micro Lett., 2021, 13, 62 CrossRef PubMed.
- J. Hou, J. Chen, C. Luo, J. Li, C. Li, R. Zhang, J. Liu and P. Han, Inorg. Chem., 2024, 63, 24634–24646 CrossRef CAS PubMed.
- B.-B. Zhang, J.-K. Chen, J.-P. Ma, X.-F. Jia, Q. Zhao, S. Guo, Y.-M. Chen, Q. Liu, Y. Kuroiwa, C. Moriyoshi, Z. Junying and H.-T. Sun, J. Phys. Chem. Lett., 2020, 11(8), 2902–2909 CrossRef CAS PubMed.
- A. J. Lehner, D. H. Fabini, H. A. Evans, C.-A. Hébert, S. R. Smock, J. Hu, H. Wang, J. W. Zwanziger, M. L. Chabinyc and R. Seshadri, Chem. Mater., 2015, 27, 7137–7148 CrossRef CAS.
- G. Teri, H.-F. Ni, Q.-F. Luo, X.-P. Wang, J.-Q. Wang, D.-W. Fu and Q. Guo, Mater. Chem. Front., 2023, 7, 2235–2240 RSC.
- B. M. Benin, D. N. Dirin, V. Morad, M. Wörle, S. Yakunin, G. Rainò, O. Nazarenko, M. Fischer, I. Infante and M. V. Kovalenko, Angew. Chem., Int. Ed., 2018, 57, 11329–11333 CrossRef CAS.
- V. Morad, I. Cherniukh, L. Pöttschacher, Y. Shynkarenko, S. Yakunin and M. V. Kovalenko, Chem. Mater., 2019, 31, 10161–10169 CrossRef CAS.
- P. Fu, Y. Sun, X. Zhiguo and Z. Xiao, J. Phys. Chem. Lett., 2021, 12, 7394–7399 CrossRef CAS PubMed.
- B. Su, G. Zhou, J. Huang, E. Song, A. Nag and Z. Xia, Laser Photon. Rev., 2021, 15, 2000334 CrossRef CAS.
- G. Zhou, Z. Liu, J. Huang, M. S. Molokeev, Z. Xiao, C. Ma and Z. Xia, J. Phys. Chem. Lett., 2020, 11, 5956–5962 CrossRef CAS PubMed.
- S. Cao, C. Dai, S. Yao, B. Zou and J. Zhao, J. Mater. Sci., 2020, 55, 12801–12810 CrossRef CAS.
- G. Hu, B. Xu, A. Wang, Y. Guo, J. Wu, F. Muhammad, W. Meng, C. Wang, S. Sui, Y. Liu, Y. Li, Y. Zhang, Y. Zhou and Z. Deng, Adv. Funct. Mater., 2021, 31, 2011191 CrossRef CAS.
- Y. Rodríguez-Lazcano, L. Nataf and F. Rodríguez, Phys. Rev. B: Condens. Matter Mater. Phys., 2009, 80, 085115 CrossRef.
- A. Jana, S. Zhumagali, Q. Ba, A. S. Nissimagoudar and K. S. Kim, J. Mater. Chem. A, 2019, 7, 26504–26512 RSC.
- W. Ma, D. Liang, Q. Qian, Q. Mo, S. Zhao, W. Cai, J. Chen and Z. Zang, eScience, 2023, 3, 100089 CrossRef.
- H. Zhang, Y.-H. Tan, Y.-Z. Tang, X.-W. Fan, X.-L. Peng, R.-R. Han, Y.-K. Li and F.-X. Wang, Inorg. Chem., 2022, 61, 10454–10460 CrossRef CAS.
- Z.-Z. Zhang, J.-H. Wei, J.-B. Luo, X.-D. Wang, Z.-L. He and D.-B. Kuang, ACS Appl. Mater. Interfaces, 2022, 14, 47913–47921 CrossRef CAS PubMed.
- J.-Y. Li, C.-F. Wang, H. Wu, L. Liu, Q.-L. Xu, S.-Y. Ye, L. Tong, X. Chen, Q. Gao, Y.-L. Hou, F.-M. Wang, J. Tang, L.-Z. Chen and Y. Zhang, Adv. Funct. Mater., 2021, 31, 2102848 CrossRef CAS.
- A. Ben Abdelhadi, M. Gutiérrez, B. Cohen, L. Lezama, M. Lachkar and A. Douhal, J. Mater. Chem. C, 2024, 12, 286–295 RSC.
- X.-F. Sun, P.-F. Li, W.-Q. Liao, Z. Wang, J. Gao, H.-Y. Ye and Y. Zhang, Inorg. Chem., 2017, 56, 12193–12198 CrossRef CAS PubMed.
- Y. Zhang, W.-Q. Liao, D.-W. Fu, H.-Y. Ye, C.-M. Liu, Z.-N. Chen and R.-G. Xiong, Adv. Mater., 2015, 27, 3942–3946 CrossRef CAS PubMed.
- G. Dai, Z. Ma, Y. Qiu, Z. Li, X. Fu, H. Jiang and Z. Ma, Inorg. Chem., 2022, 61, 12635–12642 CrossRef CAS.
- D.-Y. Wang, S.-X. Wang, C.-Y. Tian, L. Wang, R.-Y. Wang, W.-L. Zhang, X.-Y. Li, L.-H. Wang, Z.-C. Du, X.-W. Kong, X.-W. Lei and F. Yu, J. Lumin., 2025, 277, 120960 CrossRef CAS.
- W. Li, Z. Zhou, C. Wang, Y. Li, S. Kurosawa, G. Ren, X. OuYang and Y. Wu, Adv. Sensor Res., 2023, 2, 2200083 CrossRef.
- Z.-C. Zhang, T. Zhang, C.-Y. Su, M.-M. Lun, Y. Zhang, D.-W. Fu and Q. Wu, Inorg. Chem., 2022, 61, 13322–13329 CrossRef CAS.
- H. Peng, T. Huang, B. Zou, Y. Tian, X. Wang, Y. Guo, T. Dong, Z. Yu, C. Ding, F. Yang and J. Wang, Nano Energy, 2021, 87, 106166 CrossRef CAS.
- M. Gutiérrez, M. de la Hoz Tomás, S. Rakshit, L. Lezama, B. Cohen and A. Douhal, Adv. Sci., 2024, 11, 2400879 CrossRef PubMed.
- F. Sánchez, A. Ben Abdelhadi, M. Gutiérrez, B. Cohen, L. Lezama and A. Douhal, Mater. Today Sustainable, 2025, 29, 101075 CrossRef.
- Q. Ren, J. Zhang, Y. Mao, M. S. Molokeev, G. Zhou and X. M. Zhang, Nanomaterials, 2022, 12, 3142 CrossRef CAS.
- W. Zhang, W. Zheng, L. Li, P. Huang, J. Xu, W. Zhang, Z. Shao and X. Chen, Adv. Mater., 2024, 36, 2408777 CrossRef CAS.
- X. Sheng, X. Zheng, P. Tao and W.-Y. Wong, J. Inorg. Organomet. Polym. Mater., 2025 DOI:10.1007/s10904-024-03582-7.
- M.-M. Lun, H.-F. Ni, Z.-X. Zhang, J.-Y. Li, Q.-Q. Jia, Y. Zhang, Y. Zhang and D.-W. Fu, Angew. Chem., Int. Ed., 2024, 63, e202313590 CrossRef CAS.
- S. Rakshit, A. M. Medina, L. Lezama, B. Cohen and A. Douhal, Int. J. Mol. Sci., 2023, 24, 3280 CrossRef CAS PubMed.
- P. Fu, Y. Sun, Z. Xia and Z. Xiao, J. Phys. Chem. Lett., 2021, 12, 7394–7399 CrossRef CAS PubMed.
- L. Mao, P. Guo, S. Wang, A. K. Cheetham and R. Seshadri, J. Am. Chem. Soc., 2020, 142, 13582–13589 CrossRef CAS.
- M. Zhou, H. Jiang, T. Hou, S. Hou, J. Li, X. Chen, C. Di, J. Xiao, H. Li and D. Ju, Chem. Eng. J., 2024, 490, 151823 CrossRef CAS.
- Z. Huang, Y. Wang, P. Du, W. Gao, P. Niu, D. Xu, L. Wang, Y. Deng and A. Song, Inorg. Chem., 2024, 63, 21059–21069 CrossRef CAS PubMed.
- S. Chen, J. Gao, J. Chang, Y. Zhang and L. Feng, Sens. Actuators, B, 2019, 297, 126701 CrossRef CAS.
- A. Jana, V. G. Sree, Q. Ba, S. C. Cho, S. U. Lee, S. Cho, Y. Jo, A. Meena, H. Kim and H. Im, J. Mater. Chem. C, 2021, 9, 11314–11323 RSC.
- S. Rakshit, A. M. Medina, L. Lezama, B. Cohen and A. Douhal, Int. J. Mol. Sci., 2023, 24, 3280 CrossRef CAS.
- N. O. Giltzau and M. Köckerling, IUCrdata, 2020, 5, x200261 CrossRef CAS PubMed.
- N. N. Golovnev, M. A. Gerasimova, I. A. Ostapenko, A. O. Zolotov and M. S. Molokeev, J. Mol. Struct., 2023, 1277, 134851 CrossRef CAS.
- X.-W. Cai, Y.-Y. Zhao, H. Li, C.-P. Huang and Z. Zhou, J. Mol. Struct., 2018, 1161, 262–266 CrossRef CAS.
- L.-J. Xu, X. Lin, Q. He, M. Worku and B. Ma, Nat. Commun., 2020, 11, 4329 CrossRef CAS PubMed.
- M. A. Spackman and D. Jayatilaka, CrystEngComm, 2009, 11, 19–32 RSC.
- H. Fu, C. Jiang, J. Lao, C. Luo, H. Lin, H. Peng and C.-G. Duan, CrystEngComm, 2020, 22, 1436–1441 RSC.
- X. Bai, H. Zhong, B. Chen, C. Chen, J. Han, R. Zeng and B. Zou, J. Phys. Chem. C, 2018, 122, 3130–3137 CrossRef CAS.
- T. Jiang, W. Ma, H. Zhang, Y. Tian, G. Lin, W. Xiao, X. Yu, J. Qiu, X. Xu, Y. Yang and D. Ju, Adv. Funct. Mater., 2021, 31, 2009973 CrossRef CAS.
- S. Zhang, Y. Zhao, J. Zhou, H. Ming, C.-H. Wang, X. Jing, S. Ye and Q. Zhang, Chem. Eng. J., 2021, 421, 129886 CrossRef CAS.
- Q. Yang, M.-Q. Yu, Z.-A. Su, Z. Pei, D. Peng and G. Peng, Inorg. Chem., 2023, 62, 5791–5798 CrossRef CAS.
- Y. Sun, Q. Ma, D. Zhao, P. Gao, Q. Wang, Z. Guo and X. Jiang, Inorg. Chem. Front., 2025, 12, 291–300 RSC.
- Z. Zhang, Z.-L. He, J. B. Luo, J. H. Wei, X. X. Guo, J.-H. Chen and D. B. Kuang, Adv. Opt. Mater., 2023, 12, 2302434 CrossRef.
- Y.-Y. Ma, Y.-R. Song, W.-J. Xu, Q.-Q. Zhong, H.-Q. Fu, X.-L. Liu, C.-Y. Yue and X.-W. Lei, J. Mater. Chem. C, 2021, 9, 9952–9961 RSC.
- Y. Guo, J. Wu, W. Liu and S.-P. Guo, Inorg. Chem., 2022, 61, 11514–11518 CrossRef CAS PubMed.
- L. Cong, L. Lv, Y. Liu, Y. Jia, X. Chang, Y. Lin, J. Li and B.-B. Cui, Chem. Eng. J., 2025, 505, 159672 CrossRef CAS.
- C. Jiang, N. Zhong, C. Luo, H. Lin, Y. Zhang, H. Peng and C.-G. Duan, Chem. Commun., 2017, 53, 5954–5957 RSC.
- X. Jiang, Z. Chen and X. Tao, Front. Chem., 2020, 8, 352 CrossRef CAS.
- H.-L. Liu, H.-Y. Ru, M.-E. Sun, Z.-Y. Wang and S.-Q. Zang, Adv. Opt. Mater., 2022, 10, 2101700 CrossRef CAS.
- W. Zhang, P. Sui, W. Zheng, L. Li, S. Wang, P. Huang, W. Zhang, Q. Zhang, Y. Yu and X. Chen, Angew. Chem., Int. Ed., 2023, 62, e202309230 CrossRef CAS.
- Z. Gong, W. Zheng, P. Huang, X. Cheng, W. Zhang, M. Zhang, S. Han and X. Chen, Nano Today, 2022, 44, 101460 CrossRef CAS.
- B. Su, K. Han and Z. Xia, J. Mater. Chem. C, 2023, 11, 8052–8061 RSC.
- H. Peng and B. Zou, J. Phys. Chem. Lett., 2022, 13, 1752–1764 CrossRef CAS PubMed.
- X. Yuan, S. Ji, M. C. De Siena, L. Fei, Z. Zhao, Y. Wang, H. Li, J. Zhao and D. R. Gamelin, Chem. Mater., 2017, 29, 8003–8011 CrossRef CAS.
- W. Gao, M. Leng, Z. Hu, J. Li, D. Li, H. Liu, L. Gao, G. Niu and J. Tang, Dalton Trans., 2020, 49, 5662–5668 RSC.
- X. Gong, O. Voznyy, A. Jain, W. Liu, R. Sabatini, Z. Piontkowski, G. Walters, G. Bappi, S. Nokhrin, O. Bushuyev, M. Yuan, R. Comin, D. McCamant, S. O. Kelley and E. H. Sargent, Nat. Mater., 2018, 17, 550–556 CrossRef CAS PubMed.
- S. Yakunin, B. M. Benin, Y. Shynkarenko, O. Nazarenko, M. I. Bodnarchuk, D. N. Dirin, C. Hofer, S. Cattaneo and M. V. Kovalenko, Nat. Mater., 2019, 18, 846–852 CrossRef CAS.
- A. Nonato, J. S. Rodríguez-Hernández, D. S. Abreu, C. C. S. Soares, M. A. P. Gómez, A. García-Fernández, M. A. Señarís-Rodríguez, M. S. Andújar, A. P. Ayala, R. X. D. Silva and C. W. A. Paschoal, Chem. Mater., 2025, 37, 1013–1026 CrossRef CAS.
- C. Sun, H. Lu, C.-Y. Yue, H. Fei, S. Wu, S. Wang and X.-W. Lei, ACS Appl. Mater. Interfaces, 2022, 14, 56176–56184 CrossRef CAS.
- L. Yu, F. Liu, G. Ji, X. Wang, H. Wang, G. Chen, Y. Zhang, M. Yan and W. Wang, J. Colloid Interface Sci., 2025, 686, 192–202 CrossRef CAS.
- Y. Wu, X. Zhang, D. Zhao, J.-W. Zhao, X.-M. Zhen and B. Zhang, J. Colloid Interface Sci., 2025, 678, 430–440 CrossRef CAS.
- S. Chen, M. Huang, Y. Yin and J. Shi, Microchim. Acta, 2023, 190, 329 CrossRef CAS.
Footnotes |
| † Electronic supplementary information (ESI) available. CCDC 2434792. For ESI and crystallographic data in CIF or other electronic format see DOI: https://doi.org/10.1039/d5tc01822f |
| ‡ Equal contributions. |
| This journal is © The Royal Society of Chemistry 2025 |