DOI:
10.1039/D5TC00939A
(Paper)
J. Mater. Chem. C, 2025,
13, 12801-12811
Electrochemical synthesis of nitrogen-doped carbon dot inks and evaluation of their use for anticounterfeiting applications†
Received
3rd March 2025
, Accepted 9th May 2025
First published on 12th May 2025
Abstract
This work investigates the optical properties of nitrogen-doped carbon dots (N-CDs) obtained by a bottom-up electrochemical approach and their potential for anticounterfeiting applications. The N-CDs were readily synthesized by application of voltage to an aqueous solution of urea and sodium citrate for 2 h, followed by a filtering and drying step. The N-CDs exhibited a strong and tunable blue to green wavelength excitation-dependent fluorescence emission and a quantum yield of 20%. The N-CDs also displayed solvatochromism, concentration-dependent fluorescence emission properties and high stability across a wide range of NaCl concentrations (0–5 M), temperatures (4–40 °C), and pHs (2–9). Fluorescent inks were obtained by dispersing concentrated N-CDs in various matrices, and their suitability for anticounterfeiting applications was tested by performing optical and accelerated aging analysis of fluorescent marks obtained by pen writing, brushing, and inkjet printing of the inks on paper. In all cases the written features were invisible under daylight and displayed bright fluorescence emission, which remained stable upon storage in the dark for several months and showed good resistance to accelerated aging processes. This novel in depth analysis performed on electrochemically produced CDs shows a route for the fast and low-cost production of fluorescent markers for applications in information security and flexible optics.
1. Introduction
Over the past two decades carbon dots (CDs) have emerged as one of the most significant classes of carbon-based nanoparticles, due to their exceptional properties such as excellent photoluminescence, good photostability, high chemical inertness, excellent dispersibility in both aqueous and organic solvents, low toxicity, outstanding biocompatibility, and ease of surface modification.1 These attributes make CDs highly versatile, leading to wide applications in fields such as imaging,2 sensing,3 drug delivery,4 energy harvesting,5 and anticounterfeiting.6 Among these, the development of luminescent tags for anticounterfeiting is of recent research interest. The production and distribution of counterfeit high value items, including banknotes, legal documents, pharmaceuticals, jewelry and fashion products, generate an estimated 461 billion USD in illegal sales. Counterfeit goods account for about 5% of all imports in the European Union.7 While the merits of CDs for anticounterfeiting applications have been explored, there is still a need for the development of luminescent materials that can be applied to multiple objects and are resistant to tampering and weathering.8 In parallel, as the applicability of CDs continues to expand, the need for sustainable and environmentally friendly chemical processes for their synthesis has become of paramount importance. To address this aspect, green synthetic methods have been proposed, which use various natural precursors to produce CDs, including hair,9 plant leaves,10 fruit peel11 and juice,12 and eggs,13 in combination with solvothermal or hydrothermal methods. However, most of these methods rely on the use of strong oxidative environments (HNO3/H2SO4),9 chlorinated extraction solvents,10,12 or long purification steps (1–3 days).9,11,12 Furthermore, the proposed synthetic procedures result in CDs with low quantum yield (QY), usually <20%. In comparison, electrochemical (EC) methods have been recently proposed whereby CDs can be quickly synthesized by applying potential between two electrodes immersed in an aqueous solution of chemically friendly precursors. In the last ten years various precursors have been proposed for the bottom-up EC synthesis of CDs, including alcohols,14–17 amino-acids,18–21 EtOH/amino-acid mixtures,1 and sodium citrate/urea.22 The proposed mechanism involves electro-oxidation of the precursors, cross-linking reactions and subsequent dehydration steps. This synthetic approach can also be considered “green” as reactions are conducted at ambient temperature and pressure and in aqueous solvents.1,23 Albeit promising, the use of EC synthesized CDs has been restricted to cell imaging and metal detection applications, with low QYs and limited robustness, restricting wider practical applications.24
This work presents highly fluorescent nitrogen-doped carbon dots (N-CDs) obtained by a one-step green bottom-up EC synthesis from sodium citrate and urea precursors in aqueous solution. The water-soluble N-CDs showed excitation-dependent fluorescence, were characterized by strong fluorescence, which remained stable under a wide range of temperatures, pHs, and ionic strengths. The N-CDs showed solvatochromism and concentration-dependent fluorescence, allowing tuning of their emission characteristics from blue to green. The high solubility in polar solvents allowed the formulation of inks, which were used to deposit encoded features on paper surfaces by a pen, brushing and printing. The features were invisible under day light illumination and showed strong blue fluorescence under UV illumination (365 nm), allowing decoding of information by a mobile phone. The deposited markings remained stable for over one year when stored in the dark at room temperature and showed remarkable resistance upon several cycles of hydrothermal, indoor and sunlight photoaging processes.
2. Experimental methods
2.1. Materials
All chemicals were used as received without any further purification. Sodium citrate, urea, methanol, ethanol, isopropanol (IPA), acetonitrile (ACN), dimethyl sulfoxide (DMSO), acetone, chloroform, polyvinylpyrrolidone (PVP), and polyvinyl alcohol (PVA) were purchased from Sigma-Aldrich. Deionized water obtained from the Millipore system was utilized throughout all experiments. Graphite rods (99.997% purity) were purchased from Thermo Fisher Scientific.
2.2. Synthesis of N-CDs
N-CDs were synthesized using a procedure reported in the literature, with some minor modifications.22 Sodium citrate and urea, in 1![[thin space (1/6-em)]](https://www.rsc.org/images/entities/char_2009.gif) :3 ratio, were added to 10 mL of deionized water and stirred to form a homogeneous solution. Two graphite rods (1 × 3.5 cm2) were employed as electrodes for the reaction, which proceeded for 2 hours at the optimized potential of 5 V. At the end of the electrochemical process, the transparent solution turned yellow. The solution was filtered (0.22 μm filter) to remove large particles and then dried at 200 °C for 2 hours to obtain N-CD powder. The powder was then crushed and homogenized using a pestle and mortar.
:3 ratio, were added to 10 mL of deionized water and stirred to form a homogeneous solution. Two graphite rods (1 × 3.5 cm2) were employed as electrodes for the reaction, which proceeded for 2 hours at the optimized potential of 5 V. At the end of the electrochemical process, the transparent solution turned yellow. The solution was filtered (0.22 μm filter) to remove large particles and then dried at 200 °C for 2 hours to obtain N-CD powder. The powder was then crushed and homogenized using a pestle and mortar.
2.3. Characterization
The N-CDs morphology was characterized using a JEOL 2100 high resolution transmission electron microscope (HR-TEM), equipped with a LaB6 electron source and a Gatan DualVision 600 charge-coupled device (CCD), operating at an accelerating voltage of 200 keV. TEM samples were prepared by depositing 100 μL of N-CD aqueous dispersion onto a lacey carbon film on a 300-mesh copper TEM grid (S166-3, Agar Scientific). Particle size analysis of TEM images was carried out using the ImageJ software. A PerkinElmer spectrum Two™ Fourier transform infrared (FT-IR) spectrometer was employed to obtain attenuated total reflection (ATR) FT-IR spectra of the N-CDs. X-ray photoelectron spectra (XPS) were obtained with a SPECS PHOIBOS 100 hemispherical electron analyzer with a delay line detector (DLD) and an unmonochromised dual-anode Mg/Al X-ray source for X-ray photoelectron spectroscopy (XPS). The XP spectra were obtained with MgKa (hν = 1253.6 eV), and an analyzer pass energy of 15 eV giving a full width at half maximum (FWHM) of 0.85 eV for Ag 3d5/2 line. The analyzed area was a spot of 3 mm diameter while for spectra collection and processing, including fitting, the commercial software SpecsLab Prodigy (from Specs GmbH, Berlin) was used. The samples were in powder form and pressed into pellets. To characterize the optical properties of the N-CDs, UV-vis spectra were acquired using an Agilent/HP 8453 UV-vis spectrophotometer (190–1100 nm, spectral bandwidth 1 nm). Photoluminescence (PL) and photoluminescence excitation (PLE) spectra are collected by an Agilent Cary Eclipse fluorescence spectrophotometer at room temperature.
Screening and assessment of fluorescent nanoparticles involved visual monitoring under normal light and a 365-nm UV lamp. The photographic evaluation was performed using a Canon EOS 60D camera, and the photographs under UV irradiation were taken using a Kaiser RB 5003 UV Light Set equipped with three 18-Watt UV(A) fluorescent lamps. Alternatively, a more basic, commercially available 9-Watt UV Money Detector (Model: NCH015) by Compact Pro was used as the 365 nm UV light source.
2.4. Quantum yield measurements
The quantum yield (QY) of N-CDs was determined using a relative method.25 Rhodamine 6G (QY = 95% in ethanol, excitation wavelength 410 nm) was selected as the reference as the sample emission belongs in the 480–560 nm range. The QY of the N-CDs sample was calculated according to the following equation:| |  | (1) |
where Φ is the quantum yield that is being calculated, Φ′ is the quantum yield of the reference, I and I′ are the integrated emission intensities of the sample and the reference, respectively, A and A′ are the optical absorbances of the sample and the reference, respectively, and n and n′ are the refractive indexes of the sample solvent and the reference solvent (1.33 for water and 1.36 for ethanol). Both excitation and emission slit widths of the fluorescence spectrophotometer were set to 5 nm and a 1 cm pathlength quartz cuvette was used for both the sample and the reference. The N-CDs and rhodamine 6G solutions were prepared with concentrations adjusted such that the optical absorbance values were between 0 and 0.5 at 330 nm. The PL spectra were measured at an excitation wavelength of 410 nm, and the emission intensity was integrated using the software Origin. A Gaussian function was used to fit the peak, and the integration was performed based on this fit.
2.5. Lifetime measurements
Fluorescence lifetime (FLT) measurements were performed using a 405 nm picosecond laser diode (BDL-405-SMN-F, Becker & Hickl) as an excitation source pulsed at a repetition rate of 20 MHz and a hybrid photomultiplier detector (PMA Hybrid 50, PicoQuant). The N-CDs were measured in a suspended solution inside a quartz cuvette. Fluorescence emission was collected perpendicular to the excitation beam and filtered using a bandpass filter centered at 545 nm (Semrock FF01-545/55-25). The measured time-resolved fluorescence was fitted with a bi-exponential decay model convolved with the system instrument response function in Python:26| |  | (2) |
where α and τ are the amplitude and lifetime of each decay, respectively. The average FLT (τavg) is then calculated:
This measurement was repeated three times and the average of these is given as the overall lifetime.
2.6. N-CDs ink formulation and accelerated aging procedures
Fluorescent inks were obtained by dissolving N-CDs (5 mg mL−1) in H2O, PVP and PVA. The inks were handwritten on commercial paper and filter paper using a Parker® fountain pen and a brush (“da Vinci” 303 junior synthetic round brush number 4). Aqueous N-CD inks (25 mg mL−1) were also printed on commercial paper using a SUSS MicroTec PixDRO LP50 inkjet printer. Hydrothermal photoaging was conducted under the following conditions: 60 °C, relative humidity (RH) 80.25% for 20 days. To achieve these parameters, the samples were placed in sealed jars containing a saturated potassium chloride (KCl) solution and stored in a dark oven throughout the aging test.27,28 Accelerated sunlight aging tests were performed by subjecting the N-CD inks deposited on filter paper to three cycles of 8-hour exposure to intensive conditions in the Atlas Sun-test XLS chamber which consists of three 300–400 nm Xenon lamps at 50 W m−2 UV light irradiance, 25 °C temperature, and RH 55%. Indoor photoaging was carried out in a hand-built aging chamber equipped with three Neon lamps emitting in the 380–700 nm range and at an illumination of 160 mW lm−1. The total duration of the aging was 20 days.
3. Results and discussion
3.1. Characterization of N-CDs
N-CDs were synthesized using a one pot electrochemical bottom-up approach whereby a potential of 5 V was applied to an aqueous solution of sodium citrate and urea for 2 h. N-CDs were obtained by filtration of the solution, followed by desiccation and crushing of the obtained powder. Fig. 1a reveals that the obtained N-CDs were approximately spherical and had a size distribution ranging between 1.5 and 7.0 nm, with an average size of 3.9 nm ± 1.0 nm (based on 150 measured particles) (Fig. 1b). FT-IR was employed to identify the N-CDs surface functional groups. As shown in Fig. 1c, the N-CDs FT-IR spectrum was characterized by a broad absorption band between 3180 and 3455 cm−1, indicative of the stretching vibrations of amino (–NH) and hydroxyl (–OH) groups. The peak at 2981 cm−1 was assigned to the stretching vibration of C–H. A peak corresponding to the nitrile group (–CN) was observed at 2238 cm−1. The presence of nitrile groups may account for the low concentration of carboxylic groups, as indicated by the weakness of the C![[double bond, length as m-dash]](https://www.rsc.org/images/entities/char_e001.gif) O peak at 1710 cm−1.29 The high-intensity peaks at 1590 and 1394 cm−1 corresponded to the asymmetric and symmetric stretching vibrations of COO−, respectively.11,30 The absorption bands at 1556, 1265, 1141, and 1068 cm−1 corresponded to the stretching vibrations of CC, C–OH, C–N, and C–O, respectively. Fig. S1 (ESI†) shows the full XPS spectrum in which carbon, oxygen and nitrogen atoms were detected. The deconvoluted C 1s XPS spectrum (Fig. 1d) was analyzed in five components attributed to C–C sp2 (284.3 eV), C–C sp3 (285.2 eV), C–O (286.5 eV), CO (288.0 eV), and COOH (289.9 eV).31Fig. 1e shows the deconvoluted N 1s peak, comprising two components corresponding to nitrogen bonded with carbon in pyridine-like nitrogen (398.5 eV) and to either conjugated amine CN–H species or –C
O peak at 1710 cm−1.29 The high-intensity peaks at 1590 and 1394 cm−1 corresponded to the asymmetric and symmetric stretching vibrations of COO−, respectively.11,30 The absorption bands at 1556, 1265, 1141, and 1068 cm−1 corresponded to the stretching vibrations of CC, C–OH, C–N, and C–O, respectively. Fig. S1 (ESI†) shows the full XPS spectrum in which carbon, oxygen and nitrogen atoms were detected. The deconvoluted C 1s XPS spectrum (Fig. 1d) was analyzed in five components attributed to C–C sp2 (284.3 eV), C–C sp3 (285.2 eV), C–O (286.5 eV), CO (288.0 eV), and COOH (289.9 eV).31Fig. 1e shows the deconvoluted N 1s peak, comprising two components corresponding to nitrogen bonded with carbon in pyridine-like nitrogen (398.5 eV) and to either conjugated amine CN–H species or –C![[triple bond, length as m-dash]](https://www.rsc.org/images/entities/char_e002.gif) N (carbon–nitrogen triple bonds) (399.9 eV).31,32Fig. 1f illustrates the deconvoluted O 1s peak consisting of two components with binding energies at 531.2 eV and 532.5 eV assigned to CO and C–O, respectively. The atomic percentages of carbon, nitrogen, and oxygen are presented in Table S1 (ESI†). The atomic concentrations (%) of the different C, N and O species are reported in Table S2 (ESI†).
N (carbon–nitrogen triple bonds) (399.9 eV).31,32Fig. 1f illustrates the deconvoluted O 1s peak consisting of two components with binding energies at 531.2 eV and 532.5 eV assigned to CO and C–O, respectively. The atomic percentages of carbon, nitrogen, and oxygen are presented in Table S1 (ESI†). The atomic concentrations (%) of the different C, N and O species are reported in Table S2 (ESI†).
 |
| | Fig. 1 (a) TEM image of the N-CDs. (b) Particles size distribution measured by TEM. (c) FT-IR spectrum of N-CDs. (d) High-resolution XPS spectra of C 1s, N 1s (e), and O 1s (f). | |
3.2. Optical properties of N-CDs
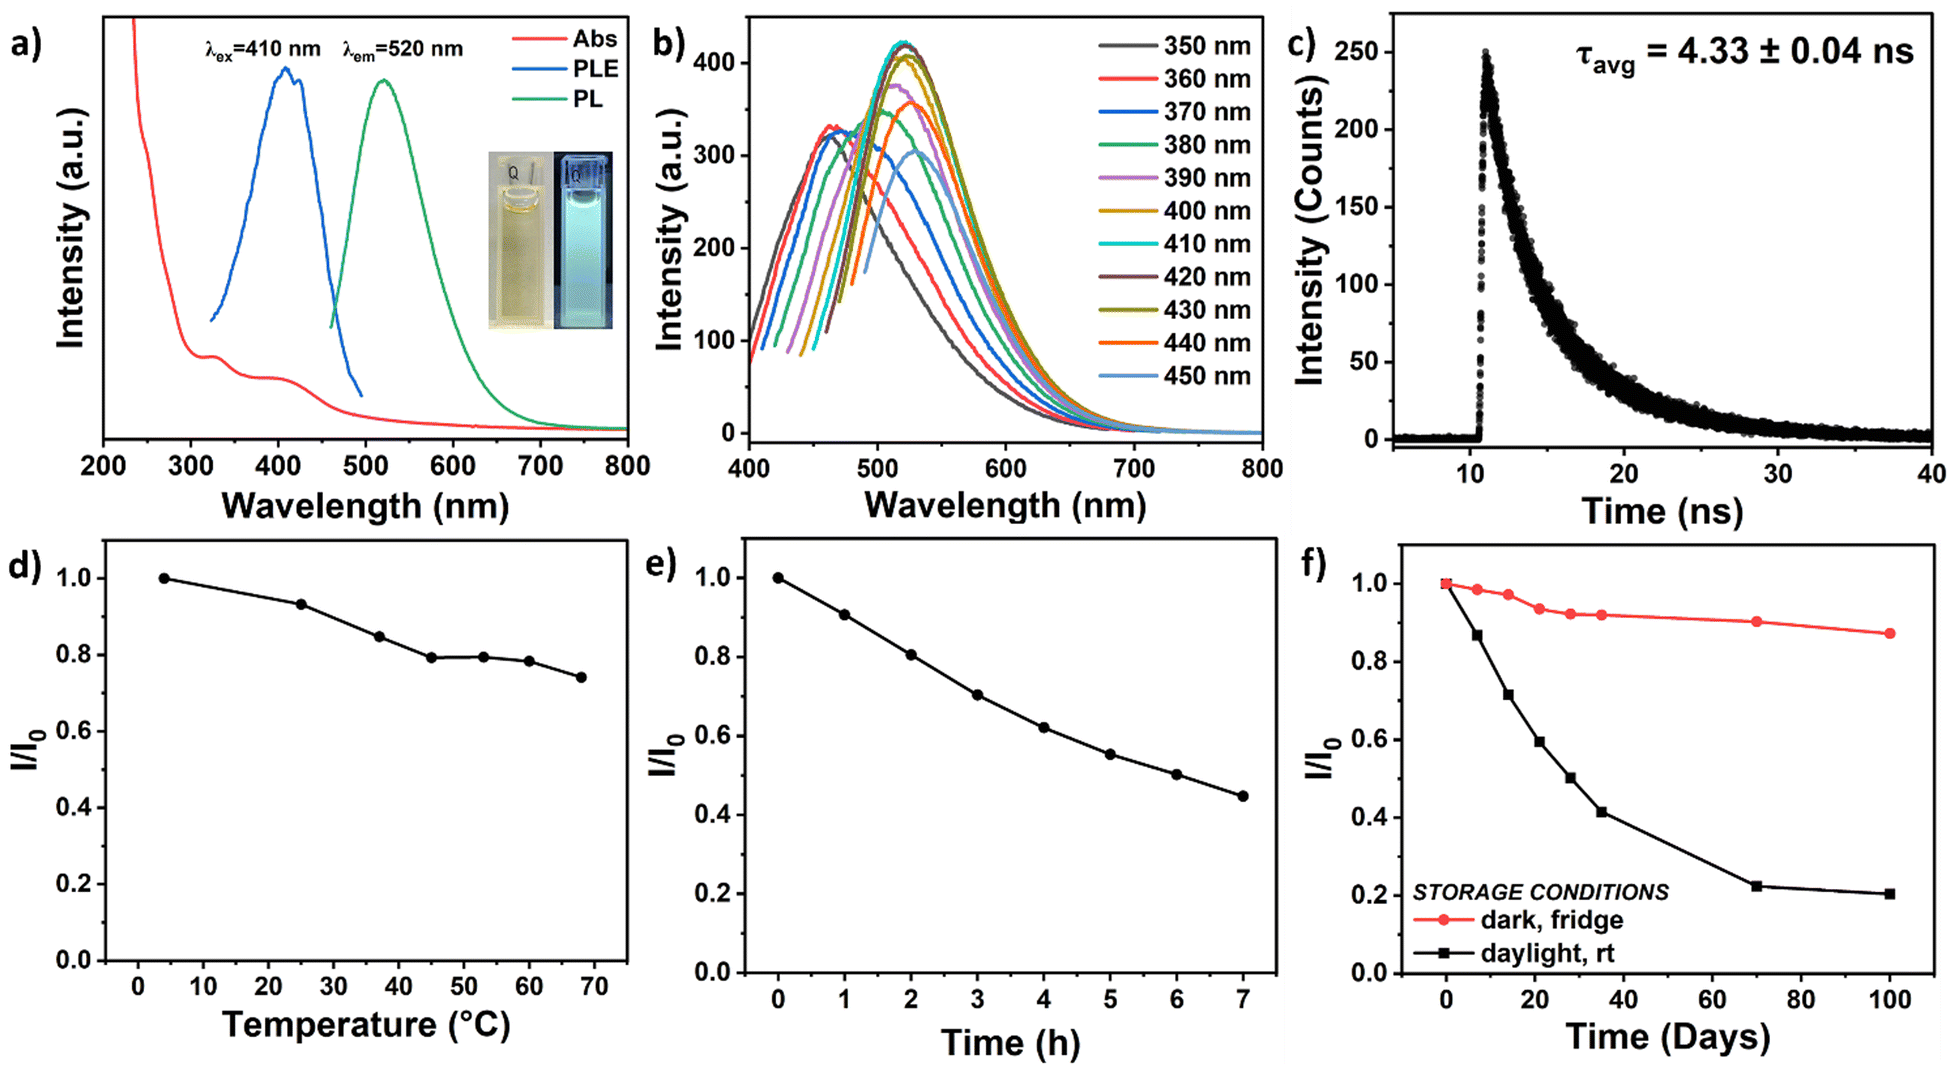
The UV-vis absorption, PL excitation and PL emission of the N-CDs aqueous solution (1 mg mL−1) were measured at room temperature to evaluate their optical properties. As shown in Fig. 2a, the N-CDs UV-vis absorption spectrum showed three peaks located at 250, 330 and 410 nm. Specifically, the 250 nm absorption peak was assigned to the carbonized core of the N-CDs; the 330 nm peak could be assigned to n → π* transitions between the n-orbitals of heteroatoms (nitrogen and oxygen) and the π* orbitals of the polyaromatic domains;33 the peak above 400 nm can be related to the surface states of N-CDs, originating from an ensemble of low-energy transitions generated by functional groups attached to the edge of the carbon core.34 The PLE and PL spectra of Fig. 2a showed that the N-CDs displayed the strongest emission at 520 nm when excited at 410 nm. The inset of Fig. 2a shows that the N-CDs were characterized by bright green fluorescence under UV illumination (365 nm) and good transparency under ambient light. Further investigation of the PL properties (Fig. 2b) showed that N-CDs exhibited excitation-dependent fluorescence properties, with emission peaks ranging from 460 to 530 nm for excitations between 350 and 450 nm. The origin of the excitation photoluminescence dependence in CDs is still under debate,35 as different contributions come into play depending on the precursors and the synthetic method used, including post synthetic steps. However, three main mechanisms have been identified: the quantum confinement effect or the core emission, which is due to the conjugated π-domains of carbon core; the surface states, which are related to the presence of functional groups connected with the carbon backbone; and the molecular state, where the emission originates from free or bonded fluorescent molecules. The observed excitation-dependent fluorescence behavior is indicative of the presence of particles of different sizes in the sample and of a distribution of different surface states.36
 |
| | Fig. 2 (a) UV-vis absorption, PL excitation and emission spectra of N-CDs 1 mg mL−1. The insets show the optical images of N-CDs aqueous solution under daylight (left) and under UV light (365 nm). (b) Fluorescence spectra of N-CDs at different excitation wavelengths. (c) The lifetime of N-CDs considering the emission band at 520 nm at the excitation wavelength of 410 nm. (d) The fluorescence intensity of N-CDs under increasing temperature. The fluorescence intensity of N-CDs under (e) ultraviolet irradiation at different times (hours), and (f) over a period of multiple days in different storage conditions: in the dark, in the fridge and under natural light at room temperature. | |
The N-CDs QY was calculated to be 20%, which is among the highest values reported in the literature for CDs synthesized by electrochemical (EC) bottom-up methods.24 The mean fluorescence lifetime of N-CDs (Fig. 2c) was measured to be 4.33 ns ± 0.04 ns, which is longer than the 1.95 and 3.60 ns reported by An et al.37 and Lee's group for their N-CDs produced using a similar synthetic approach.38 The relatively long lifetime was in line with reports whereby the mean photoluminescence lifetime of CDs is calculated to be several nanoseconds,39 suggesting that the fluorescence mechanism possibly involves radiative recombination of excitons.40
The fluorescence stability of N-CDs in different conditions was investigated to assess their potential for practical applications. First, photostability was investigated by continuously irradiating an N-CDs aqueous solution with a 9 W UV light source (365 nm) for 7 hours at room temperature. Fluorescence measurements taken hourly at the excitation wavelength of 410 nm (Fig. 2e) showed that, under these conditions, a 55% decay in fluorescence intensity occurred at the end of the exposure time. This result is in line with the literature data for CDs synthesized by bottom-up approaches.41 Photobleaching, the permanent loss of the luminescence properties of a fluorescent material due to its continuous exposition to electromagnetic radiation for a duration of time, also occurs under natural light conditions.41 To investigate this process, an aqueous solution of N-CDs was exposed to ambient light for 100 consecutive days at room temperature. After 35 days, a 58% reduction in fluorescence intensity was observed (Fig. 2f), which increased to an 80% reduction after 100 days. The fluorescence dependence on temperature was investigated by measuring the emission response (at 410 nm excitation) of N-CDs at different temperatures. Fig. 2d shows that the fluorescence intensity dropped by 26% as the temperature increased from 4 °C to 68 °C. This trend is consistent with literature data for other CDs and was attributed to the thermal activation of surface trap/defect states as well as to a thermally induced increase in the nonradiative excitation recombination probability observed in semiconductor quantum dots.42 Considering the observed degradation due to UV illumination and temperature exposure, it was also decided to investigate the photostability of an N-CDs aqueous solution stored in the dark at 4 °C, over a period of 100 days. As illustrated in Fig. 2f, the N-CDs retained 87% of their initial fluorescence intensity, displaying much-increased photostability compared to the N-CDs stored under natural conditions, which retained only 20% of their original fluorescence.
3.3. pH–Sensitive fluorescence of N-CDs
To test the stability of N-CDs under different chemical conditions, the luminescence properties of the synthesized sample were investigated by dispersing the N-CDs in Britton–Robinson buffer (BRB) solutions with pH values ranging from 2 to 12. Fig. 3a shows photographs of N-CD solutions dispersed in aqueous buffers of different pHs under UV irradiation (365 nm). All solutions showed luminescence, with a progressive emission color shift from green to blue at higher pH values. This blue shift is also shown in the normalized PL spectra of Fig. 3c, depicting a shift in the maximum emission wavelength from 520 nm to 480 nm as the pH increased from 2 to 12. The PL emission color change was irreversible as shown in Fig. S3b (ESI†). Fig. 3b shows that the fluorescence intensity at the maximum emission wavelength (λem = 520 nm at λex = 410 nm) remained stable in the 2–10 pH range, retaining up to 70% of the maximum fluorescence intensity, which was registered at pH 9. The decrease in PL intensity observed above pH 9 is due to the monitoring of fluorescence at the maximum emission wavelength of λem = 520 nm. However, due to the blue shift in emission for pH > 9, the maximum emission should be considered λem = 480 nm (at λex = 410 nm). Under these conditions, the fluorescence remained stable in the 2–11 pH range (Fig. S3a, ESI†). UV-vis absorption spectra of N-CD aqueous solutions were recorded at pH 2 and 12, as shown in Fig. S3c (ESI†). The observed changes above 300 nm at high pH suggest that pH variations may influence the surface states of the N-CDs and, therefore, the changes in the fluorescence emission spectra. The dependence of fluorescence on pH is often attributed to nitrogen- and oxygen-containing functional groups on the surface of CDs.43 In particular, the protonation and deprotonation of the surface functional groups, such as carboxylic and amine groups, is what may trigger the response to different pH values.44 Hypothetical mechanisms of protonation and deprotonation of the synthesized N-CDs at pH 2 and at pH 12 are illustrated in Fig. 3d.
 |
| | Fig. 3 (a) Photograph of N-CDs solutions at different pH under UV irradiation (365 nm). (b) The fluorescence intensity of N-CDs at different pH. (c) Normalized PL emission spectra of the N-CDs at different pH at the excitation wavelength of 410 nm. (d) Schematic illustration of the possible mechanism of protonation and deprotonation of N-CDs at different pH values. | |
The fluorescence stability of N-CDs in the presence of salt was also evaluated by measuring fluorescence spectra across a range of NaCl concentrations. As shown in Fig. S4 (ESI†), the synthesized N-CDs showed good stability from 0 to 5 mol L−1 NaCl as they maintained 92% of the initial fluorescence intensity.
3.4. Multicolor emission of N-CDs solvatochromism-induced
The solvatochromism of N-CDs was investigated by measuring UV-vis and PL emission spectra of N-CDs dispersed in solvents of different polarities. The emission spectra of N-CDs dispersed in eight solvents ranging from low (CHCl3) to high (H2O) polarity were recorded at 410 nm excitation wavelength. As shown in Fig. 4a, the normalized spectra displayed a maximum fluorescence emission red shift from 460 nm (CHCl3) to 520 nm (H2O) with the increase of the solvent's polarity. The sigmoidal correlation between the maximum fluorescence emission and the relative solvent polarity is represented in Fig. 4b. The UV-vis spectra of the N-CDs dispersed in solvents with different polarities had variable characteristics (Fig. S5a, ESI†), indicating that the N-CDs had different surface states in different solvents. Previous research studies have explained the mechanism behind the observed solvatochromism, as arising from interactions between solvent molecules and the surface functional groups of the CDs.43–45 Highly electronegative nitrogen- and oxygen-containing functional groups on the surface of the N-CDs facilitate electron charge transfer towards the edges of the CDs, altering the electron density distribution and affecting the energy gap and electronic transitions.46 The FT-IR spectrum shown in Fig. 1d and the XPS analysis have shown that hydrophilic functional groups are present on the surface of the N-CDs. Therefore, it was hypothesized that in polar and protic solvents like water, methanol, ethanol, and isopropanol, hydrogen bonding (HB) was the primary interaction between the N-CDs and the solvent. This strong bond led to a gradual decrease in the emission energy level as solvent polarity increases, explaining the redshift of the fluorescence emission wavelength.47 To further support the hypothesis that hydrogen bonding plays a crucial role in the emission properties of N-CDs in polar environments, it was observed that the emission peak intensity decreased by rising the temperature of the N-CDs aqueous solutions (Fig. 2d), as result of the disruption of hydrogen bonds at elevated temperatures.48 In aprotic solvents, it was hypothesized that dipole–dipole interactions were the main interactions influencing the surface electronic structure. As the solvent polarity increased, the dipole moment had a greater impact on the surface electronic structure, reducing the energy gap and causing the observed redshift of the maximum fluorescence emission wavelength. This dipole–dipole interaction accounts for the solvatochromic effect observed in the examined aprotic solvents: acetonitrile, dimethyl sulfoxide, acetone, and chloroform. Besides hydrogen bonding and dipole–dipole interactions, it has been recently suggested that the emission mechanism of CDs could be influenced by the inhomogeneous distribution of fluorescence energies, associated with size distribution. Polydispersity in various solvents affects the core bandgap, consequently, modifying the alignment between the valence band and the surface accepting level, and ultimately determining the absorption and emission energies.49 A schematic illustration of the solvent-dependent fluorescence is shown in Fig. 4e.
 |
| | Fig. 4 (a) Normalized PL emission spectra of the N-CDs in different solvents at the excitation wavelength of 410 nm. (b) Emission wavelength as a function of the solvent relative polarity. (c) Normalized PL emission spectra of the N-CDs dispersed in deionized water at different concentration. The excitation wavelength is 410 nm. (d) Emission wavelength as a function of the N-CDs solutions concentrations. The inset shows the optical images of N-CDs solutions at different concentrations under 365 nm UV irradiation. (e) Schematic illustration of the possible mechanism of N-CDs in different solvents and with increasing concentration. | |
3.5. Concentration-dependent emission of N-CDs
To further characterize the photoluminescence properties of N-CDs, the concentration-dependent fluorescence emission behavior was investigated. The PL spectra of the aqueous solutions, excited at 410 nm (Fig. 4c), revealed a redshift in the emission wavelength from 517 to 541 nm, corresponding to a color change from bluish-green color to a vivid green, as the N-CD concentration was increased from 0.1 mg mL−1 to 10 mg mL−1. This shift resulted in a linear correlation between the fluorescence emission wavelength and the increasing concentration of N-CDs, as shown in Fig. 4d. The concentration-dependent property of the N-CDs is graphically depicted in Fig. 4e and is related to the shortening distance between individual N-CDs with increasing concentrations, resulting in stronger hydrogen bond interactions, likely causing the formation of aggregates. The aggregation tendency of the N-CDs can be explained considering that their surface is abundant in nitrogen- and oxygen-containing hydrophilic groups which are prone to hydrogen bond formation, acting both as acceptors and receptors. The increased proximity of inter-CDs surface groups, particularly carboxyl groups, disrupts π–π interactions causing a distortion in the conjugated system and resulting in a broader absorption and a redshift in photoluminescence, moving the emission towards longer wavelengths.50 As shown in Fig. S5 (ESI†), as well as from the emission redshift displayed in the inset of Fig. 4d, the fluorescence intensity increased up to N-CD concentrations of 1 mg mL−1 and then started to decrease progressively, likely due to an inner filter effect (IFE), where the fluorescence intensity was reduced due to the reabsorption of excitation or emission light by the solution itself, or formation of aggregates, and consequent enhancement of non-radiative relaxation among them and the lowering of fluorescence intensity.51,52 N-CD aggregation also influences the redshift of the emission wavelength. As the aggregates enlarge, the carbon dots are layered together, and this results in smaller energy gaps than those of single N-CDs, resulting in the redshift of their emission wavelength.53
3.6. Invisible fluorescent N-CD inks
The exceptional fluorescence, photostability, and dispersibility of the synthesized N-CDs in diverse solvents make them excellent candidates for producing fluorescent inks. In this work N-CD inks were developed aiming to produce anticounterfeiting markers invisible to the naked eye and visible under UV light. Fig. 5 shows fluorescence features obtained by deposition of N-CD aqueous inks of different concentrations on Whatman® filter paper, using brushing and pen writing with a medium-nib Parker® fountain pen. The aqueous solution 25 mg mL−1 produced a more fluorescent and readable marker (Fig. 5f), but the brushing was slightly visible under daylight (Fig. 5c). On the other hand, the N-CDs water solution 5 mg mL−1 resulted in a completely invisible mark, while remaining brightly fluorescent, as illustrated in Fig. 5b and e.
 |
| | Fig. 5 Aqueous solution 25 mg mL−1 of N-CDs handwritten on Whatman® filter paper, shown (a) under daylight and (d) under 365 nm UV light. Aqueous solution 5 mg mL−1 of N-CDs brushed on Whatman® filter paper, shown (b) under daylight and (e) under 365 nm UV light. Aqueous solution 25 mg mL−1 of N-CDs brushed on Whatman® filter paper, shown (c) under daylight and (f) under 365 nm UV light. | |
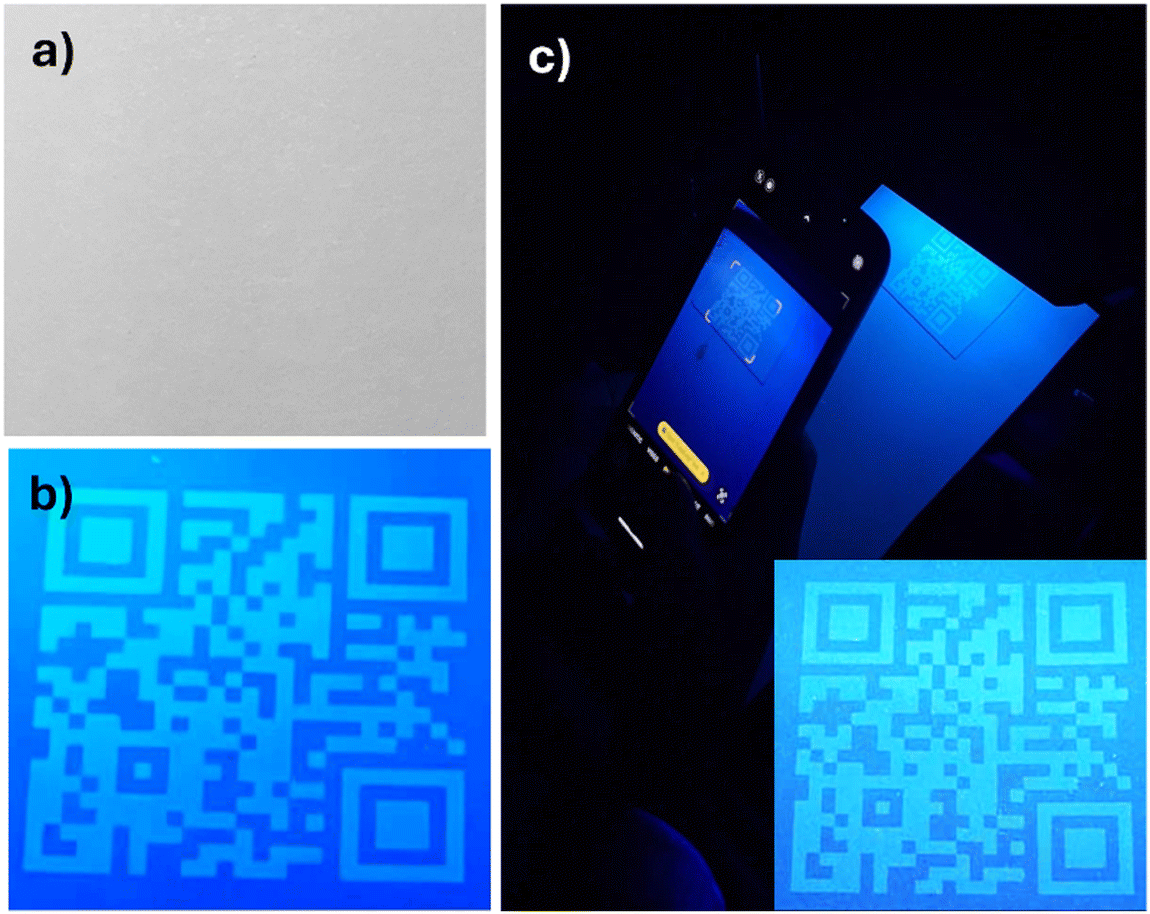
Fig. 6 shows photographs of a QR code inkjet printed on commercial Bristol drawing paper with a 25 mg mL−1 water solution of N-CDs. The QR code resulted completely invisible under daylight and was visible upon illumination with a commercial UV lamp (365 nm). The mark remained clearly visible and was readable with a smartphone, even after one year of storage (Fig. 6c).
 |
| | Fig. 6 Aqueous solution 25 mg mL−1 of N-CDs inkjet printed on Bristol drawing paper, (a) shown under daylight and (b) under 365 nm UV light. (c) Smartphone read out of the printed QR code after one year of storage in the dark at room temperature. Inset of the QR emission after one year of storage. | |
3.7. Accelerated aging of the N-CDs ink
To further explore the possibility of fabricating a wider range of photostable inks, two different ink formulations were investigated by dispersing N-CDs (5 mg mL−1) in a solution 4% w/v of PVA in water and in a solution 3% w/v of PVP, prepared using a mixture of water and ethanol in equal proportions. Accelerated aging procedures were performed on these formulations deposited on filter paper by pen and brushing. N-CDs PVA-based inks were deposited on filter paper by a brush and fountain pen. Fig. 7(a–c) shows photographs of the inks under daylight and UV illumination before and after hydrothermal aging, indoor photoaging and sunlight accelerating aging, respectively. The photographs show that deposited inks remained stable, with the marks remaining invisible under daylight illumination and their fluorescence emission still readable after the hydrothermal aging, which exposed the ink to extreme conditions of humidity and temperature. Following indoor photoaging, the inks were invisible under daylight and fluorescence emission was detected, although with decreased intensity. Exposure to UV light (sunlight aging) can promote the photooxidation of the fluorescent nanoparticles, resulting in discoloration, and the concurrent increase in moisture can further aggravate the degradation of the N-CDs and contribute to the deterioration of the binder (PVA and PVP), reducing the ink's adhesion to the surface.54 The effect of this aging process was significant, and extensive fluorescence fading was observed. In all samples, the handwritten mark faded more easily than the brushed mark. This was due to the differences in layer thickness resulting from the two deposition methods. The fountain pen marks were thinner and resulted in deposition of less material than the brush marks, therefore being more susceptible to fading. Fig. 7(d–f) reports the result of equivalent tests carried out on N-CD PVP-based inks, showing no significant difference in behavior compared to the PVA formulations. Overall, although some treatments affected the fluorescence emission, it should be noted that the conditions imposed on the inks by accelerating aging tests are extreme, resulting in different outcomes compared to the natural aging conditions shown in Fig. 6.
 |
| | Fig. 7 N-CDs and 4% w/v PVA ink handwritten and brushed on filter paper: (a) before and after hydrothermal aging under daylight (top left and right) and UV light (bottom left and right); (b) before and after indoor photoaging under daylight (top left and right) and UV light (bottom left and right); (c) before and after sunlight-accelerated aging under daylight (top left and right) and UV light (bottom left and right). N-CDs and 3% w/v PVP ink handwritten and brushed on filter paper: (d) before and after hydrothermal aging under daylight (top left and right) and UV light (bottom left and right); (e) before and after indoor photoaging under daylight (top left and right) and UV light (bottom left and right); (f) before and after sunlight-accelerated aging under daylight (top left and right) and UV light (bottom left and right). | |
4. Conclusions
This research presents the synthesis and comprehensive characterization of N-CDs obtained by a green bottom-up electrochemical method and the investigation of their use as anticounterfeiting inks. The N-CDs exhibited excitation-wavelength-dependent fluorescence properties with the strongest emission centered at 520 nm when excited at 410 nm and showed bright green fluorescence under UV illumination (365 nm) and good transparency under ambient light. The N-CDs showed good fluorescence stability over a wide range of temperature, pH, and ionic strength. They also displayed good photostability when stored in the dark at low temperatures. Various N-CD ink formulations were developed and deposited on paper substrates by writing, brushing and printing. All formulations showed bright and stable fluorescence after one year of storage at room temperature and in the dark. The inks that underwent accelerated aging showed impressive resistance to extreme conditions of temperature and humidity, but limited fluorescence endurance under constant UV illumination. Overall, this work showed the development of an environmentally friendly approach for the fabrication of luminescent inks with potential applications such as security inks and markers.
Author contributions
Martina Piletti, Themis Krasoudaki, Andrea Matulac, Labrini Sygellou, Dario Angelone: data curation, formal analysis, investigation, resources, validation, visualization, Sanathana Konugolu Venkata Sekar, Rodorico Giorgi, Aidan J. Quinn, Daniela Iacopino: conceptualization, funding acquisition, project administration, supervision, writing – review & editing.
Data availability
The data supporting this article have been included as part of the ESI.†
Conflicts of interest
The authors declare that they have no known competing financial interests or personal relationships that could have appeared to influence the work reported in this paper.
Acknowledgements
This work was done under the project “Artwork Unique RecognitiOn and tRacking through chemicAl encoded data, miniaturized devices and blockchain alliance (AURORA)” and supported by Grant agreement no. 101094245 under the HORIZON-CL2-2022-HERITAGE-01-07 topic from the European Research Executive Agency. The European Union's Horizon 2020 Research and Innovation Programme as part of the PHAST-ETN project under the Marie Skłodowska-Curie Actions (Grant Agreement No. 860185); Taighde Éireann – Research Ireland (22/RP-2TF/10293 and 12/RC/2276 P2).
Notes and references
- M. Bortolami, I. I. Bogles, C. Bombelli, F. Pandolfi, M. Feroci and F. Vetica, Molecules, 2022, 27, 5150 CrossRef CAS PubMed.
- B. B. Chen, M. L. Liu and C. Z. Huang, TrAC, Trends Anal. Chem., 2021, 134, 116116 CrossRef CAS.
- V. Sharma, P. Tiwari and S. M. Mobin, J. Mater. Chem. B, 2017, 5, 8904–8924 RSC.
- G. Calabrese, G. De Luca, G. Nocito, M. G. Rizzo, S. P. Lombardo, G. Chisari, S. Forte, E. L. Sciuto and S. Conoci, Int. J. Mol. Sci., 2021, 22, 11783 CrossRef CAS PubMed.
- D. Ghosh, K. Sarkar, P. Devi, K.-H. Kim and P. Kumar, Renewable Sustainable Energy Rev., 2021, 135, 110391 CrossRef CAS.
- R. Simões, J. Rodrigues, V. Neto, T. Monteiro and G. Gonçalves, Small, 2024, 20, 2311526 CrossRef PubMed.
-
Counterfeiting and Product Piracy [Internet]. Available from: https://www.europol.europa.eu/crime-areas/intellectual-property-crime/counterfeiting-and-product-piracy.
- S. Ren, B. Liu, M. Wang, G. Han, H. Zhao and Y. Zhang, J. Mater. Chem. C, 2022, 10, 11338–11346 RSC.
- D. Sun, R. Ban, P.-H. Zhang, G.-H. Wu, J.-R. Zhang and J.-J. Zhu, Carbon, 2013, 64, 424–434 CrossRef CAS.
- L. Zhu, Y. Yin, C.-F. Wang and S. Chen, J. Mater. Chem. C, 2013, 1, 4925 RSC.
- W. Lu, X. Qin, S. Liu, G. Chang, Y. Zhang, Y. Luo, A. M. Asiri, A. O. Al-Youbi and X. Sun, Anal. Chem., 2012, 84, 5351–5357 CrossRef CAS PubMed.
- V. N. Mehta, S. Jha, H. Basu, R. K. Singhal and S. K. Kailasa, Sens. Actuators, B, 2015, 213, 434–443 CrossRef CAS.
- Z. Zhang, W. Sun and P. Wu, ACS Sustainable Chem. Eng., 2015, 3, 1412–1418 CrossRef CAS.
- H. Im, S. Noh and J. H. Shim, Electrochim. Acta, 2020, 329, 135172 CrossRef CAS.
- P. Miao, Y. Tang, K. Han and B. Wang, J. Mater. Chem. A, 2015, 3, 15068–15073 RSC.
- J. Deng, Q. Lu, N. Mi, H. Li, M. Liu, M. Xu, L. Tan, Q. Xie, Y. Zhang and S. Yao, Chem. – Eur. J., 2014, 20, 4993–4999 CrossRef CAS PubMed.
- T. C. Canevari, M. Nakamura, F. H. Cincotto, F. M. de Melo and H. E. Toma, Electrochim. Acta, 2016, 209, 464–470 CrossRef CAS.
- F. Niu, Y. Xu, J. Liu, Z. Song, M. Liu and J. Liu, Electrochim. Acta, 2017, 236, 239–251 CrossRef CAS.
- L. Hu, H. Li, C. Liu, Y. Song, M. Zhang, H. Huang, Y. Liu and Z. Kang, Nanoscale, 2018, 10, 2333–2340 RSC.
- M. Zhang, H. Wang, B. Wang, Y. Ma, H. Huang, Y. Liu, M. Shao, B. Yao and Z. Kang, Small, 2019, 15, 1901512 CrossRef CAS PubMed.
- C.-I. Wang, W.-C. Wu, A. P. Periasamy and H.-T. Chang, Green Chem., 2014, 16, 2509 RSC.
- Y. Hou, Q. Lu, J. Deng, H. Li and Y. Zhang, Anal. Chim. Acta, 2015, 866, 69–74 CrossRef CAS PubMed.
- P. Anastas and N. Eghbali, Chem. Soc. Rev., 2010, 39, 301–312 RSC.
- D. Rocco, V. G. Moldoveanu, M. Feroci, M. Bortolami and F. Vetica, ChemElectroChem, 2023, 10, e202201104 CrossRef CAS PubMed.
- K. Jiang, S. Sun, L. Zhang, Y. Lu, A. Wu, C. Cai and H. Lin, Angew. Chem., Int. Ed., 2015, 54, 5360–5363 CrossRef CAS PubMed.
- D. Gao, P. R. Barber, J. V. Chacko, Md. A. Kader Sagar, C. T. Rueden, A. R. Grislis, M. C. Hiner and K. W. Eliceiri, PLoS One, 2020, 15, e0238327 CrossRef CAS PubMed.
- L. Greenspan, J. Res. Natl. Bur. Stand., Sect. A, 1977, 81A, 89 CrossRef.
- F. E. M. O’Brien, J. Sci. Instrum., 1948, 25, 73–76 CrossRef.
- J. Choi, N. Kim, J.-W. Oh and F. S. Kim, J. Ind. Eng. Chem., 2018, 65, 104–111 CrossRef CAS.
- Q. Lu, C. Wu, D. Liu, H. Wang, W. Su, H. Li, Y. Zhang and S. Yao, Green Chem., 2017, 19, 900–904 RSC.
-
J. Gorham, NIST X-ray Photoelectron Spectroscopy Database - SRD 20 [Internet], National Institute of Standards and Technology, 2012. Available from: https://srdata.nist.gov/xps/ Search PubMed.
- A. I. Large, S. Wahl, S. Abate, I. da Silva, J. J. Delgado Jaen, N. Pinna, G. Held and R. Arrigo, Catalysts, 2020, 10, 1289 CrossRef CAS.
- H. Kim, Y. Park, S. Beack, S. Han, D. Jung, H. J. Cha, W. Kwon and S. K. Hahn, Adv. Sci., 2017, 4, 1700325 CrossRef PubMed.
- C. J. Reckmeier, Y. Wang, R. Zboril and A. L. Rogach, J. Phys. Chem. C, 2016, 120, 10591–10604 CrossRef CAS.
- C. M. Carbonaro, R. Corpino, M. Salis, F. Mocci, S. V. Thakkar, C. Olla and P. C. Ricci, J. Carbon Res., 2019, 5, 60 CrossRef CAS.
- Y. Dong, H. Pang, H. B. Yang, C. Guo, J. Shao, Y. Chi, C. M. Li and T. Yu, Angew. Chem., Int. Ed., 2013, 52, 7800–7804 CrossRef CAS PubMed.
- Q. An, Q. Lin, X. Huang, R. Zhou, X. Guo, W. Xu, S. Wang, D. Xu and H.-T. Chang, Dyes Pigm., 2021, 185, 108878 CrossRef CAS.
- Y.-S. Lee, C.-C. Hu and T.-C. Chiu, J. Environ. Chem. Eng., 2022, 10, 107413 CrossRef CAS.
- J. Zhou, H. Zhou, J. Tang, S. Deng, F. Yan, W. Li and M. Qu, Microchim. Acta, 2017, 184, 343–368 CrossRef CAS.
- Q. Lou, Q. Ni, C. Niu, J. Wei, Z. Zhang, W. Shen, C. Shen, C. Qin, G. Zheng, K. Liu, J. Zang, L. Dong and C. Shan, Adv. Sci., 2022, 9, 2203622 CrossRef CAS PubMed.
- N. Javed and D. M. O’Carroll, Part. Part. Syst. Charact., 2021, 38, 2000271 CrossRef CAS.
- L. J. Mohammed and K. M. Omer, Nanoscale Res. Lett., 2020, 15, 182 CrossRef PubMed.
- M. Moniruzzaman and J. Kim, Sens. Actuators, B, 2019, 295, 12–21 CrossRef CAS.
- J. Bai, Y. Ma, G. Yuan, X. Chen, J. Mei, L. Zhang and L. Ren, J. Mater. Chem. C, 2019, 7, 9709–9718 RSC.
- H. Wang, C. Sun, X. Chen, Y. Zhang, V. L. Colvin, Q. Rice, J. Seo, S. Feng, S. Wang and W. W. Yu, Nanoscale, 2017, 9, 1909–1915 RSC.
- G. Sandeep Kumar, R. Roy, D. Sen, U. K. Ghorai, R. Thapa, N. Mazumder, S. Saha and K. K. Chattopadhyay, Nanoscale, 2014, 6, 3384 RSC.
- T. Zhang, J. Zhu, Y. Zhai, H. Wang, X. Bai, B. Dong, H. Wang and H. Song, Nanoscale, 2017, 9, 13042–13051 RSC.
- S. Wu, W. Li, Y. Sun, X. Zhang, J. Zhuang, H. Hu, B. Lei, C. Hu and Y. Liu, J. Colloid Interface Sci., 2019, 555, 607–614 CrossRef CAS PubMed.
- A. Sciortino, E. Marino, B. van Dam, P. Schall, M. Cannas and F. Messina, J. Phys. Chem. Lett., 2016, 7, 3419–3423 CrossRef CAS PubMed.
- X.-X. Ba, L. Zhang, Y.-L. Yin, F.-L. Jiang, P. Jiang and Y. Liu, J. Colloid Interface Sci., 2020, 565, 77–85 CrossRef CAS PubMed.
- S. Lai, Y. Jin, L. Shi, R. Zhou, Y. Zhou and D. An, Nanoscale, 2020, 12, 591–601 RSC.
- Y. Mu, N. Wang, Z. Sun, J. Wang, J. Li and J. Yu, Chem. Sci., 2016, 7, 3564–3568 RSC.
- Y. Su, Z. Xie and M. Zheng, J. Colloid Interface Sci., 2020, 573, 241–249 CrossRef CAS PubMed.
- A. L. Andrady, A. M. Heikkilä, K. K. Pandey, L. S. Bruckman, C. C. White, M. Zhu and L. Zhu, Photochem. Photobiol. Sci., 2023, 22, 1177–1202 CrossRef CAS PubMed.
|
| This journal is © The Royal Society of Chemistry 2025 |
Click here to see how this site uses Cookies. View our privacy policy here. 
 Open Access Article
 This Open Access Article is licensed under a
  b,
Andrea
Matulac
b,
Andrea
Matulac