DOI:
10.1039/D5TC00036J
(Paper)
J. Mater. Chem. C, 2025,
13, 8151-8168
Optoelectronic characteristics and stability evaluation of Ba2TiMxO6 (Mx = Ge, Sn, Se, Te) p-type semiconductors as candidates for functional layers in optoelectronic devices
Received
3rd January 2025
, Accepted 10th March 2025
First published on 20th March 2025
Abstract
Driven by the escalating demand for direct band gap semiconductors, this study elucidates for the first time the potential of Ba2TiMxO6 (Mx = Ge, Sn, Se, Te) perovskites in the realm of advanced photovoltaics and optoelectronics. The scope of this study spans the cutting-edge density functional theory computations of the structural, optoelectronic, and thermodynamic characteristics of specified materials. Additionally, it includes a comprehensive stability analysis that delves into their geometrical parameters (τ and μ), cohesive, formation, and decomposition energies, and their temperature-dependent phonon spectra, which provide critical insights into the stability of probed materials. The analyzed materials are from a notable class of direct gap semiconductors, as determined within the PBE–GGA framework, showcasing band gaps of 1.915, 2.315, 1.963, and 1.433 eV at 300 K for the investigated Ge-, Sn-, Se- and Te-bearing perovskites, respectively. Furthermore, band gap modulation with temperature is studied, denoting a stable optoelectronic behavior of these materials. Probing the optical characteristics reveals UV range optical spectra of absorption and extinction coefficients, dielectric constants, refractive indices, and optical band gaps. This study observed the enticing optoelectronic characteristics and robust stabilities of the materials studied, accentuating their potential as candidates for UV-based optoelectronic devices.
1 Introduction
Perovskite materials with multifunctional facets have emerged with great potential for a myriad of applications, spanning the development of third-generation solar cells, sophisticated optoelectronic and thermoelectric devices, efficient high-temperature solid oxide cells, and photo-catalytic water splitting systems.1–3 Besides, these versatile materials are driving innovation in designing and enhancing the efficiency of electromagnetic devices, such as next-generation light-emitting diodes, lasers, spintronic devices, optical sensors, and high-performance transistors.4–7 The materials science community has extensively investigated single perovskite materials to explore their scope and transformative capabilities in diverse applications. Siddique et al. analyzed AeVH3 (Ae = Be, Mg, Ca, Sr) halide perovskites using first-principles methods to reveal their suitability for advanced hydrogen storage systems,8 while Fang et al. leveraged Ti-based SrTiO3 perovskites to develop a low cost and mass-scale producible optoelectronic synaptic device (In2O3·SnO2/Nb: SrTiO3(ITO/NSTO)) capable of processing multimodal signals.9 Recently, double perovskites have received significant attention due to their superior stability and enhanced performance. Mustafa et al. revealed the potential of vacancy-ordered double perovskites Tl2WX6 (X = Cl and Br) for spintronic and thermoelectric applications10 and further analyzed K2ScAuX6 (X = Cl, Br) double perovskites for next-generation optoelectronic devices.11 These studies underscore that double perovskite materials exhibit outstanding structural, electronic, optical, and thermoelectric properties, such as higher conductivities and absorption coefficients, longer diffusion lengths, enhanced carrier mobilities, higher figure of merits, and tunable band gaps. Moreover, they can be produced easily using solution processing techniques.
In the realm of perovskite-based solar cells and optoelectronics, multiple studies have uncovered a class of barium-based double perovskite oxides (DPOs), Ba2BB′O6, with improved structural stability and desirable optoelectronic properties. In these DPOs, B and B′ ions occupy the corner positions of the unit cell. These ions are octahedrally coordinated with six oxygen anions, forming BO6 and B′O6 octahedra, and A ions are located at the voids between octahedra and are coordinated with 12 oxygen anions.12–15
Lately, titanium, with its appealing natural abundance, non-toxic nature, and stable tetravalent oxidation state, has been used in Ba2BB′O6 DPOs alongside various elements having an oxidation number of +4 at B or B′ sites.16,17 Having Zr at the B-site, barium–titanium based Ba2ZrTiO6 exhibits ultraviolet (UV) light absorption characteristics in experimental and theoretical studies of their electronic and optical properties. Its high absorption coefficient for UV radiation and figure of merit (ZT) indicate its suitability for optical sensors and thermoelectric devices.18–20 In experimental studies by Tahir Ghrib et al., the optical and thermoelectric properties of cerium-doped Ba2TiMoO6 double perovskite evidenced its potential in photo-catalytic applications and a new generation of thermal barrier coatings.21,22 Likewise, various studies underscore the potential of Ba2TiMnO6 for use in solar cells and optoelectronics due to its high optical conductivity, absorption coefficient, and dielectric constant.23–25 Recently, employing TB-mBJ functionals, Shah et al. explored the optoelectronic prospects of Ba2HfTiO6, Ba2CeTiO6, and Ba2TiTeO6 DPOs that exhibit band gaps of 3.44, 2.96, and 1.26 eV, respectively. As it has a band gap energy close to the red edge of the visible spectrum, Ba2TiTeO6 exhibits absorption and optical conductivity peaks in the visible region. The figure of merit values of these three oxides are 0.79, 0.75, and 0.85, respectively. The author deduced that the higher visible absorption and ZT value make Ba2TiTeO6 more suitable for solar cells.26 These investigations demonstrate that barium–titanium DPOs have great potential in various photovoltaics, photo-catalytic, thermoelectric, and vis-UV optoelectronic applications.
Inspired by these studies and pursuing lead-free, inorganic double perovskites characterized by dynamic stability and compelling optoelectronic properties, this study explores the potential of novel Ba2TiMxO6 (Mx = Ge, Sn, Se, Te) DPOs in solar cells and optoelectronic applications. It presents the innovative concept of integrating titanium at the B-site alongside p-block tin (Sn) metal, germanium (Ge), and tellurium (Te) metalloids and selenium (Se) non-metal at the B′ site of barium-based DPOs. This deliberate incorporation of metal, metalloids, and non-metal at the B′ site allows us to examine the changes in optoelectronic properties contingent upon B′ elements belonging to the same block, different groups, and different periods. Likewise, incorporating titanium at the B sites is strategically adopted to harness its 3d electronic states to enhance the conduction band states. Given its natural abundance and potential to support a transformative approach to cost-effective technology, this integration presents an innovative solution, paving the way for sustainable advancements in the field.
This study meticulously analyzes the structural, electronic, and optical properties at temperatures of 0 and 300 K, and thermodynamic properties in the pressure range of 0 to 20 GPa and temperature range of 0 to 700 K. Additionally, the dynamic stability of the considered DPOs is examined through geometric factors, structural energetics, and temperature-dependent phonon spectra. Moreover, the temperature-induced narrowing and widening of band gaps are elucidated to analyze these perovskites’ optoelectronic behavior under temperature effects. Prior research about the selected DPOs has not involved a similar investigation, except for a recent theoretical study of Ba2TeTiO6,26 which made a comparison of its structural, electronic, and optical properties. In this study, a comparison is provided of the previously reported experimental or theoretical findings for the resembled double perovskites. This study underscores the scope of the selected DPOs and serves as an outline for experimentalists and theorists to fabricate these novel materials and investigate their efficiencies further.
2 Methodology
This investigation employed the Vienna Ab Initio Simulation Package (VASP) to perform first-principles calculations.27–29 To address ion–electron interactions, projector-augmented wave potentials are used, and to incorporate the exchange–correlation effects, Perdew–Burke–Ernzerhof (PBE) formalized generalized gradient approximation (GGA)30 is applied. However, the Heyd–Scuseria–Ernzerhof (HSE06) hybrid functional,31 which incorporates the Hartree–Fock exchange, is also utilized to acquire another theoretical estimation of the electronic band structure for comparative purposes. Shape, volume, and ionic positions are relaxed until the static energies converge up to 1 × 10⁻⁷ eV, and the maximum Hellmann forces on each atom are less than 0.001 eV Å−1. A 6 × 6 × 6 Gamma scheme sampled k-point grid and a plane-wave basis with a cutoff energy value of 450 eV as determined by a convergence test are set for the energy calculations. The k-point sampling is performed using the Gaussian smearing method with a smearing width of 0.02 eV. However, for the density of states, a fine k-point grid of 12 × 12 × 12 is used, and the partial occupancies are treated with the tetrahedron method along with the Blöchl corrections.
The employed method is borrowed from previous research demonstrating that density functional theory (DFT) is a powerful approach for accurately predicting material properties. Recently, multiple studies have shown the usefulness of the PBE–GGA approach for obtaining insights into the diverse facets of materials. Hasan et al. have published impactful research elucidating the efficacy of DFT calculations within the framework of the PBE–GGA method. The authors conducted a comprehensive investigation of the pressure-varied optoelectronic properties of ASnX3 (A = Li, Na, X = Cl, Br, I) halide perovskites, portraying the competitive structural properties, band structures, density of states, and optical spectra under 0, 1, 2, 3, 4, and 5 GPa pressures for every studied material.32 Sun et al. demonstrated the suitability of the PBE–GGA method by scrutinizing band gaps of GeS, GeSe, SnS, and SnSe semiconductors. The authors underscore that the employed method resulted in band gaps without overestimation that closely match the experimental values.33 Recent investigations of double perovskite oxides have also utilized the PBE–GGA exchange–correlation functional. The optoelectronic properties of La2FeWO6 and A2NbTbO6 (A = Ca, Sr, Ba) DPOs have been analyzed using the PBE–GGA method to determine their potential for use in solar cells and optoelectronics.34,35 In the same regard, Mera et al. examined Sr2MgWO6 and Ba2BiVO6 DPOs for their photocatalytic applications, employing the PBE–GGA method.36 Karlicky et al. compared the experimental band gap of fluorographene (3 eV) with the results of various functionals. They found that the PBE–GGA result (3.1 eV) closely aligns with experimental values compared to the HSE06 (5.1), G0W0 (7.3), and BSE-G0W0 (5.4) results, highlighting its reliability and effectiveness for accurate predictions in material science.37 These studies and others from the literature38–40 underline the reliability of DFT calculations using the GGA–PBE functional, establishing a solid basis for our methodology.
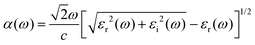
The optical properties of the studied DPOs are computed from the optical response theory as implemented in VASP, which illustrates that the frequency-dependent complex dielectric function ε(ω) has a pivotal role in characterizing the interaction of a material with incident photons.41,42 The ε(ω) consists of a real part εr(ω) and an imaginary part εi(ω), as eqn (1) describes.43
Here ω is the photon frequency. The more significant part is the imaginary part of the dielectric function that represents the permissible intra- and inter-band optical transitions from the valence to conduction band.43,44 Mathematically, a 3 × 3 Cartesian optical tensor of εi(ω) can be written as,45
| |  | (2) |
where
Ω is the primitive cell volume,
wk are the
k-point weights whose sum is equal to 1,
eα and
eβ are the unit vectors for
α and
β bands, respectively,
ck and
vk are the conduction and valence bands states from the
k-space of the Brillouin zone, and
uck and
uvk are the cell periodic functions of the conduction and valence band states. At any
k-point,
c runs over the conduction band empty states, and
v runs over the valence band occupied states. This tensor becomes a scaler for the cubic symmetry of the structure as the selected structures exhibit. The real part of the dielectric function can be obtained from the imaginary part by utilizing the Kramers–Kronig transformation,
43,45 described as follows.
| |  | (3) |
Here, P stands for the principal value. The absorption coefficient α(ω), extinction coefficient k(ω), refractive index n(ω), reflectivity R(ω), and the energy-loss function L(ω) are derived from the dielectric functions, as illustrated by the expressions below.45–47
| |  | (4) |
| |  | (5) |
| |  | (6) |
| |  | (7) |
| |  | (8) |
Quasi-harmonic Debye model (QHDM)48 is employed to compute the pressure- and temperature-dependent thermodynamic properties. The predictability of this model is precise and dependable when determining thermodynamic properties, particularly at low temperatures.49 In this model, the vibrational Helmholtz free energy (Fvib) can be computed from the following eqn (9),48
| | 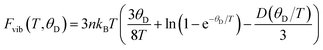 | (9) |
where
n denotes the number of atoms in the formula unit, and
kB represents Boltzmann's constant.
θD is the Debye temperature, described as a function of volume in
eqn (11).
50 The Debye integral,
D, is calculated from
eqn (10).
50,51| |  | (10) |
where

. Debye's theory views vibrations in a solid as elastic waves, and the Debye temperature of these waves depends on their average sound velocity. The Debye model describes the Debye temperatures of the isotropic solids as given in
eqn (11),
50| |  | (11) |
where
M represents the molecular mass per formula unit and
σ is the Poisson ratio. The static bulk modulus
Bst(
V) and the function
f(
σ) are determined using
eqn (12) and (13).
48| |  | (12) |
| |  | (13) |
A commonly used value of the Poisson ratio for Cauchy solids,48 equal to 0.25, is adopted in this calculation.
The Debye temperatures at the equilibrium volumes for given temperatures and pressures are used to compute other thermodynamic properties by employing eqn (14)–(18) respectively.48,50
| |  | (14) |
| |  | (15) |
| |  | (16) |
| |  | (18) |
3 Results and discussion
3.1 Structural properties
In the cubic (Fm![[3 with combining macron]](https://www.rsc.org/images/entities/char_0033_0304.gif) m) crystal structures of Ba2TiMxO6 (Mx = Ge, Sn, Se, Te) DPOs, consisting of 40 atoms per unit cell, as depicted in Fig. 1, the Ba+2, Ti+4, Mx+4, and O−2 ions are located at 8c (0.25, 0.25, 0.25), 4a (0, 0, 0), 4b (0.5, 0.5, 0.5), and 24e (x, 0, 0) Wyckoff positions, respectively. Depending on the ionic radii of Mx+4 ions, the value of x varies, and is 0.748, 0.756, 0.755, and 0.761 for the optimized structures of the Ge, Sn, Se, and Te bearing DPOs, respectively. Table 1 lists the interatomic bond lengths between Mx+4, Ba+2, and Ti+4 cations and O−2 anions at both 0 and 300 K. It shows that the Ba–O bond length is greater than that of the Mx–O and Ti–O bonds in these structures, which is due to the lower electronegativity and lower affinity of Ba+2 for the O−2 anion compared to Ti+4 and Mx+4 cations. This implies the presence of large BO6 octahedra in these DPOs, which are essential for perovskite structures.
m) crystal structures of Ba2TiMxO6 (Mx = Ge, Sn, Se, Te) DPOs, consisting of 40 atoms per unit cell, as depicted in Fig. 1, the Ba+2, Ti+4, Mx+4, and O−2 ions are located at 8c (0.25, 0.25, 0.25), 4a (0, 0, 0), 4b (0.5, 0.5, 0.5), and 24e (x, 0, 0) Wyckoff positions, respectively. Depending on the ionic radii of Mx+4 ions, the value of x varies, and is 0.748, 0.756, 0.755, and 0.761 for the optimized structures of the Ge, Sn, Se, and Te bearing DPOs, respectively. Table 1 lists the interatomic bond lengths between Mx+4, Ba+2, and Ti+4 cations and O−2 anions at both 0 and 300 K. It shows that the Ba–O bond length is greater than that of the Mx–O and Ti–O bonds in these structures, which is due to the lower electronegativity and lower affinity of Ba+2 for the O−2 anion compared to Ti+4 and Mx+4 cations. This implies the presence of large BO6 octahedra in these DPOs, which are essential for perovskite structures.
 |
| | Fig. 1 3D unit cell structure of crystalline Ba2TiMxO6 (Mx = Ge, Sn, Se, Te) compounds. | |
Table 1 Bond lengths between Mx+4 cations and O−2 anions in Ba2TiMxO6 (Mx = Ge, Sn, Se, Te)
| DPOs |
Bonds |
Bond lengths [Å] |
| 0 K |
300 K |
| Ba2TiGeO6 |
Ge–O |
1.982 |
1.994 |
| Ba–O |
2.832 |
2.848 |
| Ti–O |
2.023 |
2.034 |
| Ba2TiSnO6 |
Sn–O |
2.104 |
2.117 |
| Ba–O |
2.906 |
2.923 |
| Ti–O |
2.004 |
2.016 |
| Ba2TiSeO6 |
Se–O |
2.081 |
2.094 |
| Ba–O |
2.891 |
2.909 |
| Ti–O |
2.007 |
2.019 |
| Ba2TiTeO6 |
Te–O |
2.181 |
2.196 |
| Ba–O |
2.959 |
2.979 |
| Ti–O |
2.002 |
2.015 |
| Ba2ZrTiO620 |
Zr–O |
2.14 |
|
| Ti–O |
1.99 |
|
| Ba2TiMnO623 |
Mn–O |
1.903 |
|
| Ba–O |
2.735 |
|
| Ti–O |
1.965 |
|
Ba2MgReO6expt.,![[thin space (1/6-em)]](https://www.rsc.org/images/entities/char_2009.gif) 52 52 |
Mg–O |
2.08 |
|
| Ba–O |
2.85 |
|
| Re–O |
1.96 |
|
All the calculated bond lengths of the studied structures are higher at 300 K than at 0 K. These bond lengths closely match those of Ba2ZrTiO6 and Ba2TiMnO6 structures calculated by Naseri et al., and Deluque-Toro et al.20,23 Bramnik et al. reported the experimental bond lengths of Ba2MgReO6, demonstrating that the Ba–O bond length is greater than the others.52 The fourth-order Birch–Murnaghan's equation of state,53 as described in eqn (19), is utilized to fit the energy–volume (E–V) data of Ba2TiMxO6 structures. Fig. 2 displays the fitted E–V curves. The fitting yields the equilibrium volumes (Vo), corresponding equilibrium energies (Eo), bulk moduli (B), and pressure derivatives of bulk moduli (B′). Using the values of Vo and B along with other constants in eqn (11), the Debye temperatures of these structures are determined. Table 2 presents the static and equilibrium structural properties per unit cell of the selected DPOs. The higher bulk moduli of 160.41, 151.55, 145.55, and 141.02 GPa and higher Debye temperatures of 549.59, 517.50, 525.67, and 499.79 K for the Ge-, Sn-, Se-, and Te-bearing structures, respectively, indicate the hardness of these materials. Table 2 also portrays that our results are comparable to the theoretical and experimental findings for similar DPOs.
| |  | (19) |
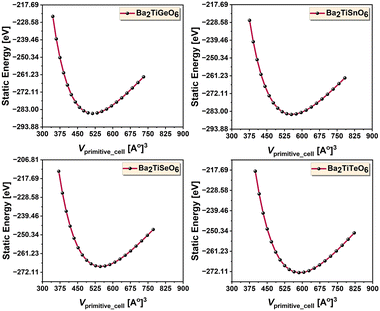 |
| | Fig. 2 Energy–volume curves – visualizing the structural optimization of the analyzed compounds. | |
Table 2 Structural properties of Ba2TiMxO6 (Mx = Ge, Sn, Se, Te)
| Quantities (PBE) |
Mx |
Ba2TiTeO6 (PBEsol)26 |
Ba2ZrTiO619,20 (mBJ) |
Ba2CaTeO654 (mBJ) |
Ba2MgXO6 (X = Se, Te)55 |
Ba2MnTeO6 expt. (100 K)56 |
Ba2MgWO6 expt. (0 GPa)57 |
| Ge |
Sn |
Se |
Te |
|
a [Å] |
8.01 |
8.22 |
8.18 |
8.37 |
8.25 |
8.154, 8.24 |
8.39 |
8.07, 8.29 |
8.2106 |
8.1345 |
|
V
st [Å]3 |
513.76 |
554.77 |
546.44 |
585.49 |
|
|
|
|
|
|
|
V
o [Å]3 |
514.39 |
556.34 |
547.91 |
588.58 |
563.448 |
542.22, 559.48 |
590.342 |
525.83, 568.89 |
|
538.26 |
|
E
st [eV] |
−285.458 |
−284.892 |
−268.735 |
−272.670 |
|
|
|
|
|
|
|
E
o [eV] |
−285.461 |
−284.898 |
−268.740 |
−272.689 |
|
|
|
|
|
|
|
B [GPa] |
160.41 |
151.55 |
145.55 |
141.02 |
148.98 |
168.98, 152 |
155.72 |
|
|
137 |
|
B′ |
4.85 |
4.78 |
4.74 |
4.70 |
|
3.79, NA |
10.76 |
|
|
3.9 |
|
θ
D [K] |
549.59 |
517.50 |
525.67 |
499.79 |
|
|
|
|
|
|
3.2 Electronic properties
Utilizing the optimized crystallographic configurations of the examined materials, the electronic properties are determined at 0 K and ambient 300 K temperatures. To understand these characteristics, the Fermi energy level is set to 0 eV in the results displayed. The band structures are computed along the high symmetry points of the k-path in the first Brillouin zone of the reciprocal lattice as shown in Fig. 3. These band gap penned results unveil the direct band gap semiconductor nature of the studied DPOs, displaying that the band gaps in the Ge- and Sn-containing structures are located at the Γ high symmetry point, and in the Se- and Te-bearing structures, these are positioned at the L high symmetry point. As expected, the HSE06 method yields higher band gap values than PBE–GGA, consistent with its incorporation of exact exchange. Although the HSE06-calculated band gaps are higher than PBE–GGA ones – the two results are qualitatively the same, portraying the same pattern in band structures with differences in gap energies. Both calculations depict the smallest band gap of Ba2TiTeO6 and that of Ba2TiSnO6 is the largest. In the TB-mBJ-based DFT calculations, Shah et al. determined the band gap energy of Ba2TeTiO6 to be 1.26 eV.26 Meanwhile, Mustonen et al. reported that the GGA-calculated band gap of the Te-containing Ba2MnTeO6 perovskite is 1.75 eV.56 Compared to these findings, which involve different B- or B′-cations, our GGA-computed band gap of Ba2TiTeO6 is 1.394 eV, providing a good point of comparison. Shah et al. also reported the band gaps for barium–titanium based Ba2HfTiO6 and Ba2CeTiO6 DPOs, with values of 3.44 eV and 2.96 eV, respectively. These values are comparable to our findings for Ba2TiGeO6, Ba2TiSnO6, and Ba2TiSeO6 double perovskites. The materials exploration utilizing different functionals theoretically yields varying results, each offering a unique perspective for comparison against experimental findings. Nonetheless, no exact theoretical or experimental data regarding the electronic properties of Ba2(Ge,Sn,Se)TiO6 DPOs is found for comparative reference, making this research pioneering. Therefore, our PBE–GGA and HSE06 calculated band gaps both provide worthwhile reference values that can guide future investigations.
 |
| | Fig. 3 Graphical representation of the band structures of the examined DPOs at 0 and 300 K. | |
The partial density of states (PDOS) presented in Fig. 4 shows that the valence band maximum (VBM) in the studied perovskites containing Ge, Sn, and Se is primarily occupied by O-p states, with some minor contributions from Ba-p and Ba-d states in the cases of Ge- and Sn-DPOs. While, in the case of Ba2TiSeO6, the minor contributions to the VBM are from the Se-s and Ti-p states. However, for Ba2TiTeO6, the VBM is predominantly occupied by Te-s states, with minor contributions from Ti-p states. Therefore, the VBM of Ba2(Ge,Sn,Se)TiO6 exhibits mainly a p-orbital characteristic, while the VBM of Ba2TeTiO6 shows an s-orbital characteristic. On the other hand, the conduction band minimum (CBM) in the Ge- and Sn-based studied perovskites is primarily occupied by the Ti-d states and contributions from the Ge-s and Sn-s states, while, for Ba2TiSeO6 and Ba2TiTeO6, the CBM is predominantly determined by Ti-d states, with significant contributions from the Se-p and Te-p states, respectively. This indicates that the CBM of Ba2TiGeO6 and Ba2TiSnO6 have s-orbital characteristics, while that of Ba2TiSeO6 and Ba2TiTeO6 have p-orbital characteristics. Moreover, these findings align with the PDOS results of Shah et al., which underlined the main contribution of oxygen atoms to the VBM and that of Ti atoms to the CBM and also indicated that the Ba atom does not make a significant contribution to the electronic structure.26
 |
| | Fig. 4 The partial density of states of the examined DPOs at 300 K. | |
The band structures of Ba2(Ge,Sn,Se)TiO6 materials show smaller band gaps at 300 K than 0 K, with a prominent decline in the Ge and Sn-bearing DPOs and a minute decrease in the Ba2TiSeO6, as Fig. 3 depicts. In contrast, the Te-bearing perovskite exhibits a slightly enhanced band gap at 300 K. The temperature-dependent band gaps in the 0 to 1000 K range, as shown in Fig. 5, illustrate the narrowing of band gaps in Ba2(Ge,Sn,Se)TiO6 DPOs while widening in Te-containing perovskite. The narrowing of band gaps agrees with the Ünlü's thermodynamic model that characterizes the effect of pressure and temperature on the band gap of semiconductors. It explains that at elevated temperatures, the interaction of free electrons, holes, and recombined electron–hole pairs with lattice phonons produces thermal vibration energy, and the linear expansion in the lattice induces thermal strain energy. The aggregate of these energies is equal to the narrowing of band gap energies.58 Linearity in temperature-dependent band gap curves is also aligned with a linear relationship proposed by O’Donnell and Chen between the band gap of semiconductors and temperature,59 as given by eqn (20).
| |  | (20) |
 |
| | Fig. 5 Temperature-induced variations in the band gaps of Ba2TiMxO6 (Mx = Ge, Sn, Se, Te) DPOs. | |
In this relationship, Eg(0) is the band gap at 0 K, k is the Boltzmann constant, and S is the dimensionless coupling constant. In their study, the band gaps of GaAs, GaP, and Si exhibited a negligible reduction up to a certain temperature and then decreased prominently. Likewise, the band gaps of Ba2TiGeO6 and Ba2TiSnO6 DPOs display a negligible decrease up to around 100 K and then decrease noticeably with the temperature rise.
In optical experiments conducted by Tauber et al., the direct band gap energy of the Te containing PbTe semiconductor at the L high symmetry point increases linearly with the temperature rise from 80 to 350 K with a temperature coefficient (δEg/δT) of 4.1 × 10⁻⁴ eV K−1,60 as in the case of our studied Te-containing Ba2TiTeO6. Tsang et al., in a theoretical band structure calculation based on the empirical pseudopotentials, found almost the same positive temperature coefficient as 3.9 × 10⁻⁴ eV K−1 of the PbTe semiconductor for the band gaps determined at the L high symmetry point for 40 to 200 K. They asserted the volumetric expansion and thermal vibrations of the ionic cores are two main effects that alter the band gaps with temperature. They referred to these effects as the lattice effect and the Debye–Waller effect. The lattice expansion, which reduces the kinetic-energy term ħ2|![[K with combining right harpoon above (vector)]](https://www.rsc.org/images/entities/i_char_004b_20d1.gif) +
+ ![[G with combining right harpoon above (vector)]](https://www.rsc.org/images/entities/i_char_0047_20d1.gif) |2/2m in the pseudopotential Hamiltonian matrix element, accounts for the negative temperature coefficient. However, the Debye–Waller factor, which relates to the average squared displacement of the ion cores from their lattice positions, can cause a positive temperature coefficient depending upon the s-like or p-like symmetries in the conduction band minimum (CBM). The p-like elliptic symmetry is more sensitive to temperature than the s-like spherical symmetry, for example, the p-like CBM of PbTe causes Debye–Waller factors that lead to the positive temperature coefficient of PbTe.
|2/2m in the pseudopotential Hamiltonian matrix element, accounts for the negative temperature coefficient. However, the Debye–Waller factor, which relates to the average squared displacement of the ion cores from their lattice positions, can cause a positive temperature coefficient depending upon the s-like or p-like symmetries in the conduction band minimum (CBM). The p-like elliptic symmetry is more sensitive to temperature than the s-like spherical symmetry, for example, the p-like CBM of PbTe causes Debye–Waller factors that lead to the positive temperature coefficient of PbTe.
Similarly, at elevated temperatures, the pronounced symmetry of the s-like characteristic in the conduction band of Ba2(Ge,Sn)TiO6 and the valence band of Ba2(Se,Te)TiO6 structures results in an isotropic Debye–Waller effect of thermal vibrations that induces a prominent shift of the density of states towards lower energy in Ge- and Sn- and towards higher energy in Se- and Te-bearing structures exhibited by both the band structures and total density of states depicted in Fig. 3 and 6. In contrast, the low symmetry p-like characteristic in the valence band of Ba2(Ge,Sn)TiO6 and the conduction band of Ba2(Se,Te)TiO6 structures results in unsymmetrical thermal vibrations and causes no significant shift. Moreover, the lattice expansion diminishes the electron screening effects, thus causing a redistribution of the electronic density of the valence band to higher energy states and that of the conduction band electron density to lower energy states. These shifts render the negative temperature coefficients as −3.8 × 10⁻⁴ and −4.0 × 10⁻⁴ eV K−1 of Ge- and Sn-keeping structures, respectively, and a little negative temperature coefficient as −2.78 × 10⁻⁵ of Se- and a little positive temperature coefficient as 7.94 × 10⁻⁵ eV K−1 of Te-bearing DPOs. These smaller coefficients denote the stable optoelectronic behavior of these materials under temperature change, which extends their application to high-temperature optoelectronic synaptic devices.
 |
| | Fig. 6 The total density of states of the examined DPOs at 300 K. | |
In semiconductors, the Fermi levels are typically positioned between the valence and the conduction band. The Fermi level's proximity to the VBM signifies p-type semiconductors, while its closeness to the CBM indicates n-type semiconductors.61–64 Petit et al. and Park et al. noted a Fermi level in p-type ZnO semiconductors near the VBM.65,66 Nolan et al. noted that a Fermi level closer to the VBM is a characteristic of p-type semiconductors.67 Likewise, as Fig. 3 depicts, the Fermi levels of all the selected DPOs are situated near the VBM and indicate their p-type semiconducting properties.
The band gap energies of both PBE–GGA and HSE06 calculations indicate the UV range optical absorption of the studied compounds, denoting the applicability of studied materials in UV-driven optoelectronic devices. However, the PBE–GGA calculation for the Ba2TiTeO6 perovskite shows a 1.433 eV band gap at ambient temperature that not only indicates its potential for UV optoelectronics but also falls within the ideal range of 1.1–1.5 eV suited for the solar cells. Cao et al. derived the band gap temperature coefficient of the Te-based PbTe semiconductor as 4.4 × 10⁻⁴ eV K−1 and witnessed that this positive coefficient is advantageous in attaining a high thermoelectric performance.68 Therefore, the positive coefficient of Ba2TiTeO6 as 7.94 × 10⁻⁵ eV K−1 also indicates the benefit of its thermoelectric characteristics.
3.3 Optical properties
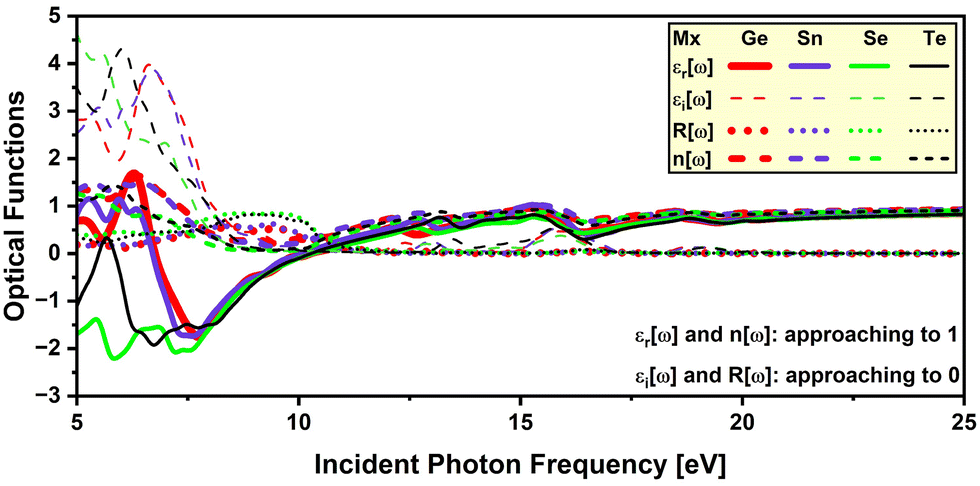
This study computed the optical properties at 300 K. The computation reveals that the selected DPOs exhibit isotropic optical properties and show symmetrical spectra in the x, y, and z directions due to their cubic structures. The frequency-dependent real part of the dielectric function εr(ω) describes the polarization and dispersion of the light.69,70 Under static conditions, at zero frequency, the εr(0) represents the dielectric constant or the static dielectric function. A higher dielectric constant suggests a lower recombination rate of the charge carriers,71 a lower band gap,72,73 and a better optoelectronic performance of a material.74 As seen in Fig. 7, the chosen perovskites bearing Ge, Sn, Se, and Te have dielectric constants of 5.13, 4.90, 6.75, and 6.15, respectively. So, Ba2TiTeO6 with the lower band gap of 1.433 eV and a higher dielectric constant of 6.15 is indicated to be a better optoelectronic material.
 |
| | Fig. 7 Frequency-dependent optical properties – dielectric functions (εr(ω), εi(ω)), energy loss functions L(ω), and absorption coefficients α(ω) of the analyzed DPOs at 300 K. | |
Several studies reported an inverse relationship between the band gap and the dielectric constant as εr(0) ≈ 1 + (ħωp/Egap)2, where ħωp denotes the plasma frequency and Egap is the Penn band gap which is the energy equivalent frequency of the absorption peak.72,73,75 The studied perovskites appear to follow this inverse relationship, where the Ba2TiSnO6 with the highest band gap of 2.315 eV among the selected DPOs exhibits the lowest dielectric constant of 4.90, Ba2TiGeO6 and Ba2TiTeO6 with 1.915 and 1.433 eV band gaps exhibit comparatively higher dielectric constants as 5.13 and 6.15, and differently Ba2TiSeO6 exhibits a higher band gap of 1.963 eV and a higher dielectric constant of 6.75 due to its lower Penn band gap and higher plasma frequency, examined as follows. It is mentioned that the Penn band gap corresponds to the frequency of the absorption peak,72 and a comparatively low-frequency absorption peak of Ba2TiSeO6 close to the violet-edge (3.26 eV) of the visible spectrum indicates its lower Penn band gap and that denotes its higher dielectric constant. The plasma frequency is a characteristic frequency at which free electrons collectively oscillate, and below this frequency, semiconductors exhibit metallic behavior and reflect most of the incident light.76–78
The energy loss function, which is the imaginary part of the inverse of the complex dielectric function (−Im[1/ε(ω)]) and describes the energy loss of an electron on interaction with the material, peaks at the plasma frequency.79 Given these definitions, the plasma frequencies of the Ge-, Sn-, Se-, and Te-containing studied DPOs are 10.34, 10.08, 10.32, and 10.28 eV, respectively, as evident in Fig. 7 for the peaks of energy loss functions. These values are comparable to the reported ones for double perovskites. The plasma frequencies of Sr2FeReO6 and Ba2FeReO6 DPOs are cited as 12.0 and 11.4 eV, respectively,80 and that of Ba2ScNbO6 and Ba2ScTaO6 are noted as 10.16 and 10.24 eV, respectively.81 Like the lower Penn band gap, the higher plasma frequency of the Ba2TiSeO6 perovskite also suggests its higher dielectric constant in connotation to Penn's model.
As seen in Fig. 7, the εr(ω) functions reach maximum values of 8.69, 8.04, 12.14, and 10.16 at frequencies of 2.79, 3.07, 2.28, and 2.45 eV for the Ge-, Sn-, Se-, and Te-bearing studied DPOs respectively. These values exhibit similar patterns to the dielectric constants, showing a higher peak value of the dielectric function for Ba2TiSeO6. All these peaks are within the visible light range, indicating maximum polarization and dielectric response in this range. Above critical frequencies of 3.923, 4.344, 3.687, and 3.934 eV for the studied Ge, Sn, Se, and Te-containing DPOs, as highlighted in yellow in both Fig. 7 and 8, the εr functions become negative and exhibit a metallic reflective response. The corresponding peaks in the reflectivity spectra are apparent. However, in the case of Ge- and Sn-containing chosen perovskites, the εr functions fluctuate around zero value above the critical frequencies, and the negative region begins at around 6.76 and 6.72 eV, indicating their subtle metallic responses at higher frequencies. Fig. 7 depicts that, after minima, the reflective response region ends near the plasma frequencies. Correspondingly, peaks in the reflectivity spectra can be observed before plasma frequencies.
 |
| | Fig. 8 Frequency-dependent optical properties – extinction coefficients K(ω), refractive indexes n(ω), and reflectivities R(ω) of the analyzed DPOs at 300 K. | |
Moreover, the Ge and Sn-containing studied perovskites show a valley region in their εr functions starting from zero frequency with a dip at 0.31 and 0.27 eV, respectively. These dips characterize the Drude peaks in the spectra of εi, absorption coefficients, and extinction coefficients. These peaks express that Ba2TiGeO6 and Ba2TiSnO6 are degenerate semiconductors, showing the intra-band optical transitions for the intrinsic far infra-red (Far-IR) absorption within Ge-3d and Sn-3d conduction bands states of the Ba2TiGeO6 and Ba2TiSnO6, respectively.82–86 Islam et al. observed this far-IR peak for Cs2AgBiBr6 double halide perovskites below 1.5 eV due to the intra-band optical transitions within the Bi-6p and Ag-3d conduction band states.87 Nguyen et al. observed this peak at 0.14 eV for Ba2TiMnO6 that occurs due to the intra-band excitation of Mn-3d orbitals of the conduction band.25 Bulutay has discussed the intra-band transition peaks at around 0.5 eV for Si and Ge nano-crystals and underlined the use of these transitions in mid- and near-infrared photodetection.82
The imaginary part of the dielectric function εi(ω) is an essential function, describing the optical transitions that correspond to the band structures and indicating the light absorption characteristics.69,70,88 Initial peaks in the εi functions of Ba2TiGeO6 and Ba2TiSnO6 depict the far-IR absorption peaks, as discussed earlier, showing the electronic excitation of Ge-3d and Sn-3d conduction band states, respectively. The spectra of εi, absorption coefficients, and the extinction coefficients exhibit the onset of the inter-band transitions in the visible energy range almost at the electronic band gap energies, highlighted green in Fig. 7 and 8. This indicates the visible-light absorption of the chosen DPOs. However, in the case of Ge- and Sn-bearing perovskites, these spectra peak a little ahead of the violet edge of the visible spectrum, denoting their pronounced UV absorption. Instead, the εi spectra of Se- and Te-bearing perovskites peak in the visible range and span over the UV region, indicating their vis-UV absorption.
Interestingly, the absorption spectra of all studied DPOs exhibit peaks at the critical energies in the UV range, showing the absorption coefficients of 67.196 × 10⁴, 70.269 × 10⁴, 87.260 × 10⁴, and 84.557 × 104 cm−1 for the studied Ge-, Sn-, Se-, and Te-containing DPOs. Besides, the studied DPOs exhibit around 15.02%, 14.26%, 19.72%, and 18.10% reflection at low frequencies that increase to 34.37%, 31.26%, 45.36%, and 40.89% near the critical energies of Ge-, Sn-, Se-, and Te-bearing perovskites, respectively.
The refractive index n(ω) characterizes the transparent nature of a material. As depicted in Fig. 8, the static refractive indexes,  as implied by eqn (6), are 2.27, 2.21, 2.60, and 2.48 for the studied Ge, Sn, Se, and Te-containing DPOs. The refraction spectra manifest peak indexes of 3.02, 2.89, 3.56, and 3.30, at 2.84, 3.11, 2.36, and 2.51 eV within the visible frequencies. High refractive indexes within the visible spectrum demonstrate that these materials are less transparent and more prone to light absorption in this range. Also, the refraction spectra of Ge- and Sn-containing perovskites display a trough at low frequency, indicative of the far-IR light absorption.
Notably, beyond plasma frequencies, the εr functions approach an asymptotic value of one, while the εi functions approach a null value, R ≈ 0, and n ≈ 1, as depicted in Fig. 9. These elucidate that the studied materials tend toward transparent behavior beyond plasma frequencies.
 |
| | Fig. 9 Optical response of dielectric functions, reflectivities, and refractive indexes at higher frequencies of the studied Ba2TiMxO6 DPOs. | |
Another essential optical parameter is the optical band gap (Eopt) that represents the energy threshold for optical absorption that merely creates a bound electron–hole pair (exciton). In contrast, the electronic band gap (Eg) represents the energy required to excite an electron from the VBM to the CBM and create an unbound electron–hole pair that necessarily includes the binding energy of the exciton.89,90 In solar cell or optoelectronic studies, the optical gaps are more important for indicating the minimum energy absorption requirement.91 Herein, the optical band gaps are determined using Tauc plot technique.92,93 The values of (αhν)1/2 as a function of incident photon frequency are plotted and then extrapolate the linear region in the rise of (αhν)1/2 to the abscissa, where the intersections provide us with the optical band gaps, as shown in Fig. 10. Table 3 lists the electronic and optical band gaps, illustrating that the optical band gaps of Ba2TiGeO6 and Ba2TiSnO6 are higher, while those of Ba2TiSeO6 and Ba2TiTeO6 are lower than their electronic band gaps.
 |
| | Fig. 10 Optical band gap calculation – graphical representation of Tauc plot for Ba2TiMxO6 (Mx = Ge, Sn, Se, Te) DPOs. | |
Table 3 Electronic and optical band gaps of Ba2TiMxO6 (Mx = Ge, Sn, Se, Te) at 300 K
| Band gap [eV] |
Ba2TiGeO6 |
Ba2TiSnO6 |
Ba2TiSeO6 |
Ba2TiTeO6 |
|
E
g
|
1.915 |
2.315 |
1.963 |
1.433 |
|
E
opt
|
2.311 |
2.603 |
1.681 |
1.325 |
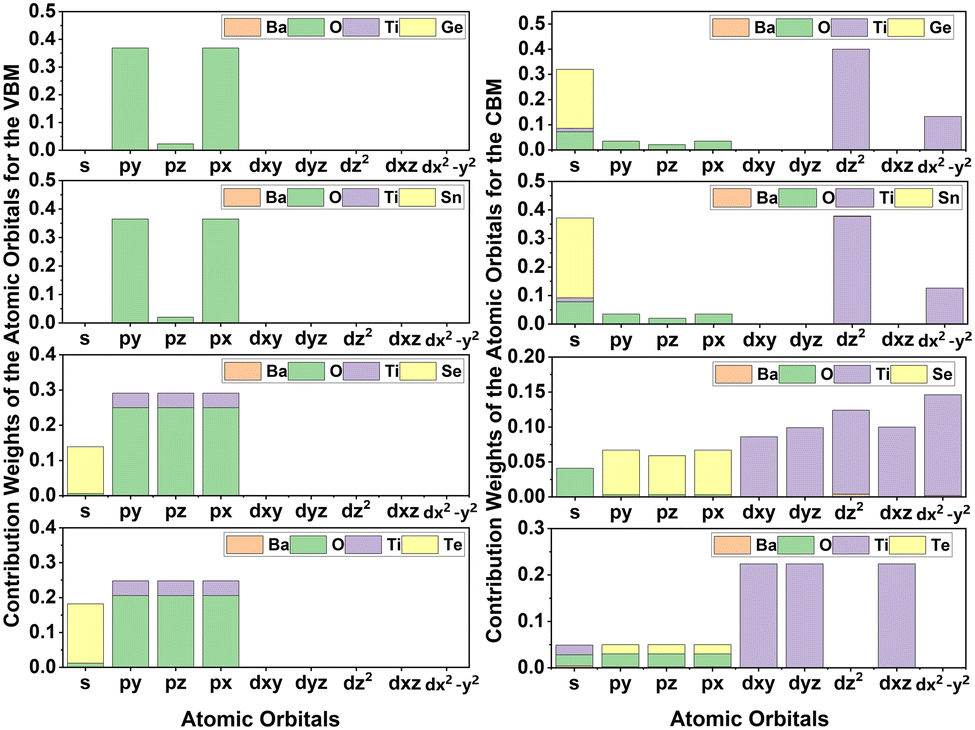
Typically, optical band gaps are lower than electronic band gaps. To understand the higher optical band gaps of the studied Ge- and Sn-containing DPOs, the transition probabilities (P2) that represent the sum of the squared transition dipole moments (TDM) are calculated along the k-path, as shown in Fig. 11. Moreover, the contribution weights of the atomic orbitals of each element for the VBM and CBM are calculated and presented as histograms in Fig. 12. The contribution weights of the atomic orbitals for the VBM and CBM dictate that the O-py and O-px states constitute the VBM, while Ti-dz2, Ti-dx2–y2, and Ge-s and Sn-s constitute the CBM in the studied Ge- and Sn-containing materials.
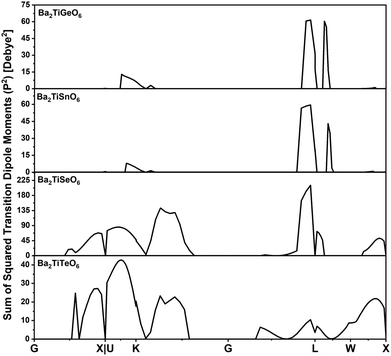 |
| | Fig. 11 Probabilities of transitions from the valence band to the conduction band across the high symmetry k-path for the chosen DPOs. | |
 |
| | Fig. 12 Contribution weights of each atom's electronic orbitals to the valence and conduction band edges. | |
Selection rules govern dipole transitions, allowing transitions between states of opposite parity. Although the transitions from O-p states to Ge-s or Sn-s states are allowed transitions, these are not witnessed in Fig. 11. This is because the lack of sufficient overlap, as indicated by the contribution weights of orbitals, prevents these transitions from occurring. Transitions from O-p to Ti-d states are also permitted. However, the inversion symmetry in the perovskite structures of Ba2TiGeO6 and Ba2TiSnO6 prevents these transitions at the Γ point, which is a location of their band gaps. This is evident from the absence of peaks in P2 at the Γ point, as depicted in Fig. 11. Thus, for Ba2TiGeO6 and Ba2TiSnO6, the optical transitions are symmetry-forbidden, and the presence of transition peaks at other k-points accounts for the higher optical gaps observed in the Ge- and Sn-containing materials. In contrast, for Ba2TiSeO6 and Ba2TiTeO6, the VBM is primarily occupied by Op, Se-s, and Te-s states, and the CBM is predominantly Ti-d states. This electronic structure suggests the potential for optical transitions from s to d and p to d states. However, at the L high symmetry point—which corresponds to the band gap of these materials—the P2 plot expresses the weak transitions. This is due to the imperfect spatial overlap between the O-p and Ti-d states, particularly in the case of Ba2TiSeO6 perovskite.
These optical properties demonstrate that Ba2TiSeO6 and Ba2TiTeO6 exhibit low optical band gaps of 1.681 and 1.325 eV within the visible energy range, higher dielectric constants of 6.75 and 6.15, higher absorption coefficients of 87.260 × 10⁴ and 84.557 × 104 cm−1 at critical energies, higher static refractive indexes of 2.60 and 2.48 and higher peak values of 3.56 and 3.30 at 2.36 and 2.51 eV within visible frequencies. Consequently, these perovskites exhibit more suitable optical characteristics for vis-UV absorption.
3.4 Thermodynamic properties
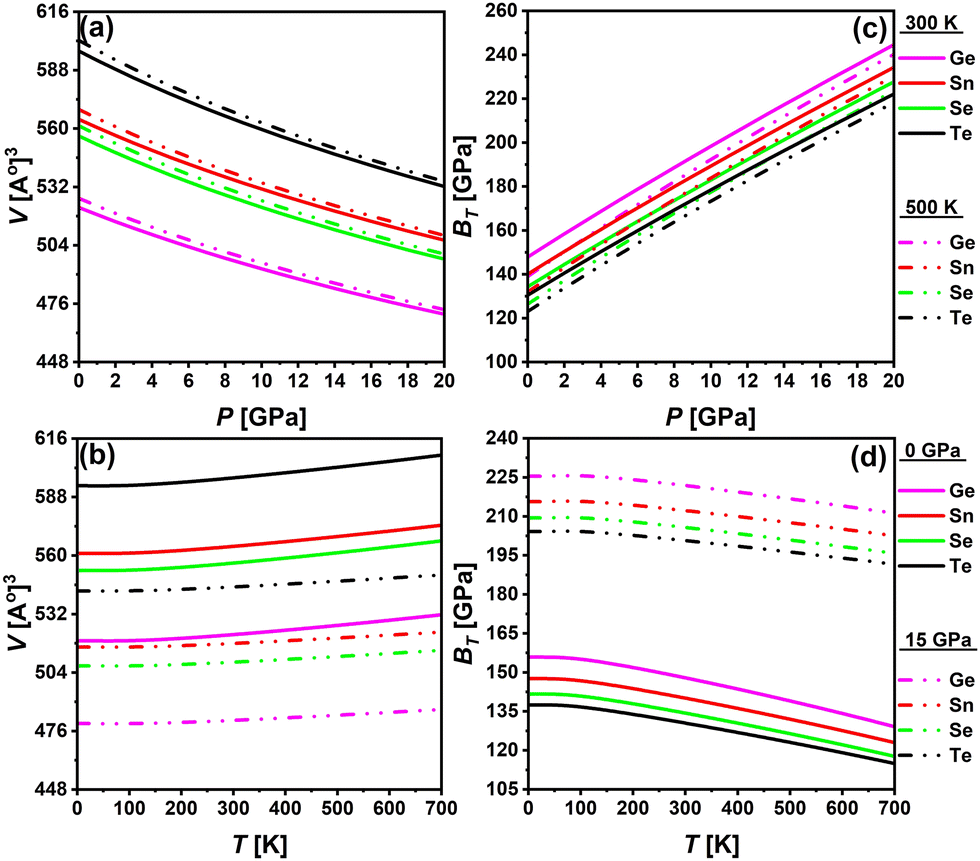
Employing QHDM, the thermodynamic properties of the investigated DPOs are computed for temperature variations ranging from 0 to 700 K at constant pressures of 0 and 15 GPa and pressure variations from 0 to 20 GPa at temperatures of 300 and 500 K. Fig. 13 demonstrates that the cell volume of all structures decreases under pressure and increases with temperature, regardless of the specific temperature or pressure selected. The curves of the isothermal bulk moduli show an increasing trend under pressure for both 300 and 500 K temperatures and a decrease for both 0 and 15 GPa pressures. Under pressure, atoms are forced closer together, reducing the overall volume of the crystal and increasing its hardness, as shown by an increase in bulk modulus. Instead, an increase in temperature causes the lattice parameters to expand, resulting in an overall increase in the crystal's volume. This expansion is due to the thermal vibration of atoms within the lattice, leading to a decrease in material hardness, evident with decreasing bulk modulus. However, at very low temperatures below 90 K, the cell volume and the bulk moduli exhibit a static behavior. This is because the interatomic forces that tightly pack atoms in a crystal lattice are strong enough to resist significant expansion at low temperatures. The characteristics of both cell volumes and bulk moduli of all studied DPOs are smooth with slight gradients, and no abnormalities are apparent, demonstrating their thermal stability.
 |
| | Fig. 13 Pressure and temperature-restrained effects of crystal volumes and isothermal bulk moduli of Ba2TiMxO6 (Mx = Ge, Sn, Se, Te). | |
The molar heat capacities per formula unit, displayed in Fig. 14, decrease as pressure increases for each studied DPO, exhibiting more steepness at 300 K compared to 500 K. At high temperatures, the atoms already possess a significant amount of kinetic energy, so the additional compression from increased pressure has a minor impact on the heat capacities, and vice versa. Essentially, the O-p states along with Ge-s, Sn-s, Se-p, and Te-p states of the Ge-, Sn-, Se-, and Te-bearing studied perovskites, respectively, near the Fermi level provide a bunch of electronic states that make a reasonable electronic contribution to heat capacities. Besides, these curves manifest that the values of Cp are consistently higher than those of Cv for all selected materials. This observation aligns with the established understanding that Cv does not account for the expansion work associated with volume, while Cp values include work done in the expansion.94 As noticed, the pressure-dependent isotherms of Cp of the studied DPOs are closer at high temperatures, highlighting that their values are approaching the same limit, and the trend is the same for Cv. This is because, as temperature surpasses the Debye temperatures, which are 549.59, 517.50, 525.67, and 499.79 K for Ge-, Sn-, Se-, and Te-bearing DPOs, respectively, Cv curves approach a Dulong–Petit limit equal to 3NR, which is equal to 249.3 J mol−1 K−1 for structures of ten atoms in their formula unit. Seen here, the temperature-dependent isobars of Cv exhibit the values of 242.96, 243.64, 243.51, and 244.03 J mol−1 K−1 at 0 GPa and 700 K, however, the values approach 246.48, 246.78, 246.73, and 246.96 at 0 GPa and 1000 K for the Ge-, Sn, Se-, Te-bearing studied DPOs, respectively.
 |
| | Fig. 14 Pressure and temperature-restrained effects of molar heat capacities of Ba2TiMxO6 (Mx = Ge, Sn, Se, Te). | |
The pressure and temperature-varied thermal expansion coefficients (α), presented in Fig. 15(a) and (b), exhibit a substantial parabolic reduction in α with increasing pressure and a rapid rise in α with temperature up to approximately 250 K. Following 250 K, a low gradient rising linear function α(T) is evident. At 300 K, the pressure-dependent α values are lower than those at 500 K, while the temperature-dependent α exhibits greater values at lower pressure. Eqn (16) elucidates the dependency of α on bulk moduli and Cv values. Higher bulk moduli and lower Cv at 300 K, as evidenced in Fig. 13(c) and 14(c) respectively, yield lower α at 300 K, with the converse is observed at 500 K. Likewise, the lower bulk moduli and elevated values of Cv at low pressure, as demonstrated in Fig. 13(d) and 14(d), respectively, lead to heightened α at lower pressure, and conversely.
 |
| | Fig. 15 Pressure and temperature-restrained effects of thermal expansion coefficients (α), and Debye temperatures (θD) of Ba2TiMxO6 (Mx = Ge, Sn, Se, Te). | |
The Debye temperature (θD) represents the upper limit of atomic vibrational frequencies in crystalline materials. It provides a correlation between thermal and elastic properties and assists in characterizing phonons and the thermal behavior of materials, like specific heat, thermal conductivity, and enthalpies. It reflects the stiffness of solids and thus correlates with melting temperatures, such as a higher Debye temperature indicating a higher melting point.95–98 The investigated materials exhibit rising θD under pressure and decreasing θD with temperature rise, as shown in Fig. 15(c) and (d). Primarily, eqn (11) governs the dependence of θD on bulk moduli. A pressure rise increases the bulk modulus and implies higher θD, which raises the stiffness and the melting points. While temperature reduces the bulk modulus and accordingly the θD. Typical solids show the values of θD in the 200 to 400 K range. The studied DPOs with the Ge-, Sn-, Se-, and Te-containing structures exhibit θD values of 531.09, 507.96, 501.03, and 484.05 K, respectively, at 0 GPa and 300 K. These values are higher than the typical range, indicating the stiffness and hardness of the studied perovskites.
Table 4 compares our results with theoretical and experimental findings at an ambient pressure of 0 GPa and a temperature of 300 K. The comparison demonstrates that our results agree with the reported data overall. The bulk modulus of Ba2TiGeO6 is very close to those of Ba2CeCoO6 and Ba2MgReO6 DPOs, and the values of Cp, Cv, and α closely match the theoretical values, while the experimental Cp and α values are slightly lower. The slight differences adhere to the diversity of material compositions.
Table 4 Thermodynamic properties of Ba2TiMxO6 (Mx = Ge, Sn, Se, Te) at the ambient temperature and pressure (300 K, 0 GPa)
| DPOs |
V [Å]3 |
B
T
[GPa] |
C
p [J mol−1 K−1] |
C
v [J mol−1 K−1] |
θ
D [K] |
α [× 10−5 K−1] |
| Ba2TiGeO6 |
522.16 |
147.93 |
220.65 |
214.33 |
531.09 |
4.25 |
| Ba2TiSnO6 |
564.40 |
140.12 |
224.01 |
217.84 |
507.96 |
4.16 |
| Ba2TiSeO6 |
556.39 |
134.35 |
223.41 |
217.04 |
501.03 |
4.35 |
| Ba2TiTeO6 |
597.17 |
130.51 |
225.91 |
219.76 |
484.05 |
4.19 |
| Ba2TiMnO623 |
|
|
219.06 |
213.90 |
540.98 |
4.12 |
| Ba2NaIO612 |
612.89 |
97.76 |
234.42 |
225.69 |
428.93 |
5.68 |
| Ba2CeCoO699 |
|
147.32 |
|
218.32 |
496.56 |
4.06 |
| Ba2MgReO6100 |
|
146.99 |
|
220.01 |
489.77 |
4.14 |
| Ba2HoRuO6expt.,101 |
|
|
204.92 |
|
|
|
| Ba2HoIrO6expt.,101 |
|
|
204.30 |
|
|
|
| Ba2MgWO6expt.,102 |
|
|
|
|
|
3.22 |
3.5 Stability analysis
3.5.1 Stability analysis based on the geometric parameters.
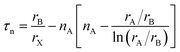
The formability and stability of perovskite structures can be assessed using the geometric parameters, known as tolerance (τ) and octahedral factors (μ).103,104 Goldschmidt proposed an empirical relationship for the tolerance factor, as given in eqn (21), to predict the formability of perovskites based on the sizes of ionic radii that constitute the perovskite structure.105| |  | (21) |
Here, rA, rB, and rX are the ionic radii of A and B cations, and X anions, respectively. In the case of double perovskites, the average ionic radii of B and B′ ions are equivalent to rB. Goldschmidt documented that a structure is a stable cubic perovskite structure in the limit 0.8 < τ < 1. The dataset of perovskites, including double perovskites, has accumulated over the decades, leading to frequent fluctuations in this limit. A recent research study stated that DPOs (A2BB′O6) are stable in the limit 0.82 < τ < 1.1.106 The tolerance factors of the selected DPOs are computed using the Shannon revised data for ionic radii corresponding to the oxidation state and the coordination number of the individual ion.107 Additionally, the tolerance factors according to Goldschmidt's non-rattling principle, which minimizes the ionic rattling and ionic space such that the cation's surface touched the anion's surface,103 are calculated. For this purpose, the cation–anion bond lengths provided in Table 1 are utilized for rA + rX and rB + rX sums. Tolerance factors of both calculations are presented in Table 5 which indicates that the selected DPOs are stable structures both ways, as the values are lying within the limit 0.82 < τ < 1.1, where the calculation based on the non-rattling principle reveals the perfect cubic structure of these DPOs with τ equal to 1 at both 0 and 300 K. The stability as examined with the non-rattling principle which does not account for the octahedral tilting and distortions are further evaluated by an octahedral factor (μ = rB/rX) as Li et al. proposed.108 This factor limits the octahedral tilting or distortions and together with the tolerance factor is necessary to predict the formability of perovskites. By Li et al., μ > 0.425 endorses the formability of perovskite oxides, for which rX = rO. As demonstrated in Table 5, the octahedral factors of the BaSnTiO6 and BaTeTiO6 structures surpass the lower limit, signifying their superior structural robustness and formability. Conversely, the octahedral factors of the other two structures marginally fall short of the limit, underscoring their diminished structural stability. In contrast to these two descriptors (τ, μ) stability analysis that has 80% accuracy as Marina et al. reported,103 the new tolerance factor (τn) recently introduced by Bartel et al., which has integrated μ in its formulation described in eqn (22), exhibited 92% accuracy solely sufficient in predicting stable perovskite structures.109
| |  | (22) |
Table 5 Geometric parameters of Ba2TiMxO6 (Mx = Ge, Sn, Se, Te)
| DPOs |
τ
|
τ (no rattling) |
τ
n
|
μ
|
| 0 K |
300 K |
| Ba2TiGeO6 |
1.082 |
1.00001 |
0.99992 |
3.908 |
0.405 |
| Ba2TiSnO6 |
1.039 |
1.00041 |
1.00018 |
3.621 |
0.463 |
| Ba2TiSeO6 |
1.090 |
1.00012 |
1.00023 |
3.983 |
0.395 |
| Ba2TiTeO6 |
0.973 |
1.00039 |
1.00046 |
3.495 |
0.563 |
| Ba2CaTeO654 |
0.93 |
|
|
|
|
| Ba2MnTeO656 |
1.00 |
|
|
|
|
| Ba2ZrTiO618 |
1.031 |
|
|
|
|
| Ba2ZrTiO619 |
1.1 |
|
|
|
|
| Ba2ZrTiO620 |
0.85 |
0.94 |
|
|
0.47 |
| Ba2TiMnO623 |
1.0778 |
|
|
|
|
| Ba2AsVO6110 |
1.057 |
|
|
3.590 |
0.467 |
| Ba2AsNbO6110 |
1.067 |
|
|
3.652 |
0.452 |
The author reported the stability of perovskites for τn < 4.18. Listed in Table 5, our calculated values of τn being less than 4.18 indicate the stable structures of the selected DPOs.
In multiple studies, the authors reported the structural stability of Ba2CaTeO6, Ba2MnTeO6, and Ba2ZrTiO6 DPOs, exhibiting tolerance factors within the range of 0.82 < τ < 1.1 as mentioned in Table 5. Landinez et al. asserted the possibility of structural distortions in Ba2ZrTiO6 for showing a tolerance factor greater than 1.18 Deluque-Toro et al. discussed that the computed τ = 1.0778 for Ba2TiMnO6 disallows the perfect packing of Mn+4 and Ti+4 ions and indicates a distorted cubic structure.23 In a recent study, Dai et al. described the stable cubic structures of Ba2AsXO6 DPOs for demonstrating the tolerance and octahedral factors within the stability limits.110 These studies ascertain our deductions about the stability of the chosen DPOs based on the geometric parameters.
3.5.2 Stability analysis based on the structural energetics.
Cohesive and formation energies.
The stability of the studied materials is further assessed from the computations of cohesive and formation energies, which are key factors in determining atomic forces in solids, as well as phase stability and formability. The formulation of these energies is described in eqn (23) and (24). It defines the cohesive energies as determined by subtracting the equilibrium energies of primitive lattices from the sum of elemental energies of isolated constituent atoms. Otherwise, the formation energies are calculated by subtracting the sum of the bulk energies of the individual constituent atoms from the equilibrium energies of the primitive lattices. These are divided by the total number of atoms in the primitive lattices to obtain the energy per atom.12,111,112| | 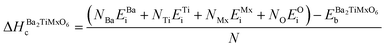 | (23) |
| |  | (24) |
| | | N = NBa + NTi + NMx + NO | (25) |
Here, Eb represents the bulk energies per atom, calculated from the stable bulk phases of each element or structure,112 while Ei refers to the energies of isolated constituent atoms. Table 2 lists the calculated cohesive and formation energies that witness the structural phase stability of Ba2TiMxO6 (Mx = Ge, Sn, Se, Te) DPOs for exhibiting positive cohesive energies and negative formation energies in each case. More positive cohesive energies and more negative formation energies of Ba2Ti(Ge,Sn)O6 DPOs demonstrate more tight atomic bonding in these structures and their higher phase stability compared with Ba2Ti(Se,Te)O6 DPOs. Nevertheless, the Ba2TiSnO6 exhibits superior stability with the lowest formation energy value of −2.789 eV per atom. Kazim et al. and Naseri et al. indicated the stability of the Ba2ZrTiO6 cubic structure based on their energies. This structure resembles our selected structures, showing a very low negative formation enthalpy of −14.991 eV per atom and positive cohesive energy of 4.43 eV per atom.19,20 Ishfaq et al. recently studied Te-based Ba2CaTeO6 double perovskite with the same Fmm cubic structure as in our calculations. The author described its stability for exhibiting the negative enthalpy of formation as −3.604 eV per atom.54 Our results align with these findings. However, the condition Ef ≤ 0 does not express the overall thermodynamic stability of a compound. Instead, it only evaluates the stability of a compound in terms of its ability to resist dissociation into elemental constituents. Besides cohesive and formation energies, decomposition energies of compounds, which indicate the possible decomposition of a compound into its parent phases,113 are crucial in determining the stability of compounds.
Decomposition energies.
Like cohesive and formation energies, decomposition energies can be utilized to evaluate the thermodynamic phase stability of a compound. Higher decomposition energies indicate more stable compounds, while lower decomposition energies suggest less stable compounds. Moreover, the compounds that exhibit negative decomposition energies in any of their possible decomposition reaction paths are supposed to be thermodynamically unstable, and they will spontaneously break down into their binary or ternary phases. Conversely, the positive decomposition energies signify the thermodynamic stability of the structure.114–116 This investigation focused on the decomposition of the selected DPOs into their possible solid binary (MxO2) and ternary oxide phases (BaMxO3, BaTiO3, Ba2TiO4). Considering these binary and ternary oxide phases, the decomposition energies are computed for the following potential reaction pathways.| | | Ba2TiMxO6 → BaTiO3 + BaMxO3 | (I) |
| | | Ba2TiMxO6 → Ba2TiO4 + MxO2 | (II) |
The crystal structures of the experimentally observed solid phases of the considered binary and ternary oxides, as listed in Table 6, are utilized for computing the decomposition energies. Employing eqn (26) and (27) and after computing the static energies per formula unit of the selected DPOs and their decomposition phases, decomposition energies are determined.
| | | ΔHId = EBaTiO3 + EBaMxO3 − EBa2TiMxO6 | (26) |
| | | ΔHIId = EBa2TiO4 + EMxO2 − EBa2TiMxO6 | (27) |
Table 6 Cohesive energies, formation energies, structural energies of the parent binary and ternary oxides, and the corresponding decomposition energies of Ba2TiMxO6 (Mx = Ge, Sn, Se, Te)
| Quantities |
Ba2TiGeO6 |
Ba2TiSnO6 |
Ba2TiSeO6 |
Ba2TiTeO6 |
Ba2ZrTiO619,20 |
Ba2CaTeO654 |
| ΔHc [eV per atom] |
6.946 |
6.933 |
6.527 |
6.626 |
NA, 4.43 |
|
| ΔHf [eV per atom] |
−2.765 |
−2.789 |
−2.464 |
−2.552 |
−14.991, NA |
−3.604 |
| Binary/ternary phase |
Crystal structures |
Static energy [eV f.u.−1] |
Ba2TiGeO6 |
Ba2TiSnO6 |
Ba2TiSeO6 |
Ba2TiTeO6 |
| BaGeO3 |
Orthorhombic P212121 |
−32.4444 |
|
|
|
|
| BaSnO3 |
Cubic Pmm |
−31.5522 |
|
|
|
|
| BaSeO3 |
Monoclinic P121/m1 |
−29.7556 |
|
|
|
|
| BaTeO3 |
Monoclinic P121/m1 |
−29.6012 |
|
|
|
|
|
|
ΔHId [eV f.u.−1] |
| BaTiO3 |
Tetragonal P4/mmm |
−30.8188 |
8.1012 |
8.8520 |
6.6092 |
7.7473 |
| Orthorhombic Amm2 (I) |
−36.0201 |
2.8999 |
3.6508 |
1.4079 |
2.5460 |
| Orthorhombic Amm2 (II) |
−35.2095 |
3.7105 |
4.4614 |
2.2186 |
3.3567 |
| Ba2TiO4 |
Monoclinic P121/c1 |
−52.1318 |
|
|
|
|
|
|
ΔHIId [eV f.u.−1] |
| GeO2 |
Tetragonal P42/mnm |
−19.1739 |
0.0587 |
|
|
|
| Orthorhombic Pnnm |
−19.1753 |
0.0574 |
|
|
|
| Orthorhombic Pbcn |
−19.0673 |
0.1654 |
|
|
|
Trigonal P322![[1 with combining macron]](https://www.rsc.org/images/entities/char_0031_0304.gif) |
−19.0097 |
0.2230 |
|
|
|
| Cubic Pa |
−18.5424 |
0.6903 |
|
|
|
| Trigonal P312 |
−19.0103 |
0.2224 |
|
|
|
Tetragonal P41![[2 with combining macron]](https://www.rsc.org/images/entities/char_0032_0304.gif) 1 1 |
−19.0025 |
0.2301 |
|
|
|
| SnO2 |
Tetragonal P42/mnm |
−18.7786 |
|
0.3127 |
|
|
| Orthorhombic Pnnm |
−18.7796 |
|
0.3118 |
|
|
| Cubic Pa |
−18.4793 |
|
0.6121 |
|
|
| SeO2 |
Tetragonal P42/mbc |
−15.4542 |
|
|
−0.4023 |
|
| Orthorhombic Pmc21 (I) |
−15.4231 |
|
|
−0.3712 |
|
| Orthorhombic Pmc21 (II) |
−15.4113 |
|
|
−0.3594 |
|
| Orthorhombic Pbam |
−15.4663 |
|
|
−0.4144 |
|
| TeO2 |
Tetragonal P42/mnm |
−15.4753 |
|
|
|
0.5604 |
| Orthorhombic Pbca |
−16.1341 |
|
|
|
−0.0985 |
| Tetragonal P431 |
−16.1009 |
|
|
|
−0.0653 |
| Tetragonal P411 |
−16.1011 |
|
|
|
−0.0655 |
| Orthorhombic P2112 (I) |
−16.0962 |
|
|
|
−0.0606 |
| Orthorhombic P2112 (II) |
−16.1004 |
|
|
|
−0.0648 |
As listed in Table 6, the decomposition energies indicate that Ba2(Ge,Sn)TiO6 are thermodynamically stable among the selected DPOs exhibiting all positive decomposition energies in both reaction pathways. In contrast, ΔHId energies of Ba2(Se,Te)TiO6 structures are positive while their ΔHIId energies are negative except one computed with tetragonal P42/mm TeO2. These negative energies indicate that Ba2(Se,Te)TiO6 are thermodynamically unstable.
Sun et al. analyzed the decomposition energies of barium, strontium, and calcium-based perovskites. They noted that all perovskite compounds with positive decomposition energies demonstrated stability under experimental conditions, and the Ca2BiVO6 double perovskite characterized by negative decomposition energy was deemed unstable in experiments. They also found that barium-based perovskites exhibit higher stability than the strontium- or calcium-based ones, with the calcium-based perovskites being the least stable. Additionally, they discovered that Ba2BiTaO6, Ba2SbTaO6, and Ba2BiVO6 exhibit significant stability with decomposition energies of approximately 0.25, 0.2, and 0.195 eV per atom, respectively.117 Given these results, our calculated decomposition energies indicate thermodynamically stable Ba2(Ge,Sn)TiO6 structures which exhibit all positive decomposition energies and unstable structures of Ba2(Se,Te)TiO6 DPOs with negative ΔHIId decomposition energies.
3.5.3 Stability analysis based on phonon spectra.
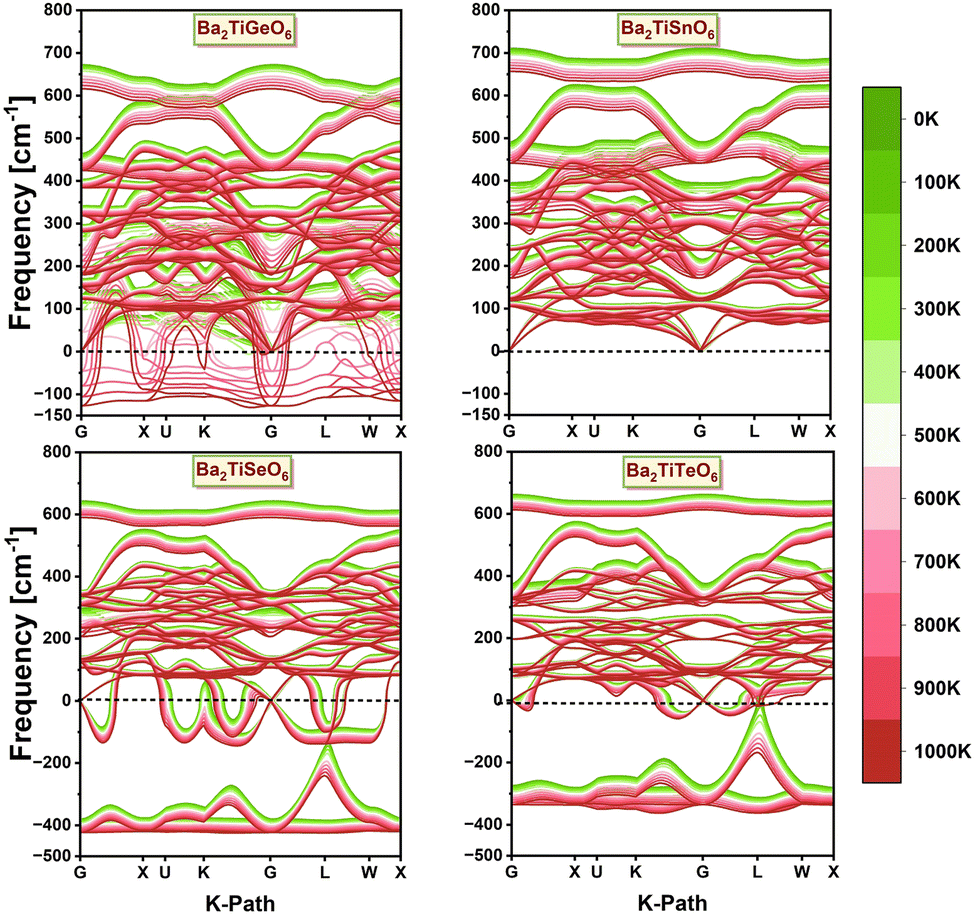
The temperature-dependent phonon dispersion spectra of the chosen DPOs, as displayed in Fig. 16, provide details about the stability concerning the structural distortions across a temperature range of 0 to 1000 K. Strict criteria are employed to obtain these spectra, including a fine k-mesh of 12 × 12 × 12 grid points and the structures are relaxed until the maximum Hellmann forces acting on each atom are less than 10−6 eV Å−1. The phonon spectrum of Ba2TiGeO6 indicates that this structure remains stable below 600 K, after which it becomes unstable, evident by the presence of soft modes with imaginary frequencies above this temperature. In contrast, the phonon spectrum of Ba2TiSnO6 demonstrates a stable structure for all temperatures, apparent by the real frequency modes throughout the whole range of temperatures. However, the structures with Se+4 and Te+4 cations are observed to be dynamically unstable at all temperatures, exhibiting soft modes across the entire temperature range. These findings are consistent with our conclusions drawn from the stability analyses based on the geometric factor and the structural energetics. The Ba2TiSnO6 structure, which has a tolerance factor within limits, a higher octahedral factor than other selected DPOs, more positive cohesive energy, and more negative formation energy, and all positive decomposition energies, exhibits none of the negative frequency phonon modes over an entire selected temperature range. Meanwhile, the Ba2TiGeO6 structure, which has slightly lower cohesive energy and less negative formation energy than Ba2TiSnO6, exhibits dynamic stability up to 600 K, above which it shows soft phonon modes. Likewise, the Ba2(Se,Te)TiO6 DPOs, which exhibit unstable structures in the energetic analysis, also demonstrate dynamic instability through their phonon spectra.
 |
| | Fig. 16 Phonon dispersion spectra of the investigated Ba2TiMxO6 (Mx = Ge, Sn, Se, Te) DPOs for the temperature range from 0 to 1000 K. | |
These stability analyses elucidate that Ba2TiGeO6 and Ba2TiSnO6 DPOs can be synthesized, while Ba2(Se,Te)TiO6 perovskites will decompose spontaneously even after synthesis. In other words, the experimental reactions may result in a mixture of BaTiO3, Ba2TiO4, SeO2 and BaSeO3, or TeO2 and BaTeO3 parent phases instead of the desired perovskites. However, the doping techniques with various concentrations of doped and dopant may enhance the structural stability of these DPOs.
4 Conclusions
This investigation uncovers the direct band gap p-type semiconducting characteristics of studied materials. Probing the temperature-modulated band gaps finds a narrowing of the band gap in Ba2Ti(Ge,Sn,Se)O6 and a widening in Ba2TiTeO6. The temperature coefficients (δEg/δT) are −3.8 × 10⁻⁴, −4.0 × 10⁻⁴, −2.78 × 10⁻⁵, and +7.94 × 10⁻⁵ eV K−1, respectively. These low-value coefficients infer the closely steady optoelectronic aspects under changing temperature conditions, indicating these materials' applicability for high-temperature optoelectronic synaptic devices like those used in aerospace and image processing.
The optical spectra of studied DPOs exhibit (1) the onset of optical transitions within the visible light spectrum near the band gap energies at 300 K and the absorption peaks at the critical frequencies of 3.923, 4.344, 3.687, and 3.934 eV in the UV region with absorption coefficients of 67.196, 70.269, 87.260, and 84.557 × 104 cm−1 and reflection of 34.37%, 31.26%, 45.36%, and 40.89% for Ba2Ti(Ge,Sn,Se,Te)O6 DPOs, respectively, highlighting the potential of these materials in UV-optoelectronics, and (2) the dielectric constants of 5.13, 4.90, 6.75, and 6.15 and optical band gaps of 2.311, 2.603, 1.681, and 1.325 eV, respectively, indicating their favorable optical performance. In addition, Ba2TiGeO6 and Ba2SnTiO6 exhibit Drude peaks at 0.31 and 0.27 eV, showing intra-band transition within Ge-3d and Sn-3d conduction band states, respectively, demonstrating their application in mid- and near-infrared photodetection systems.
In the span of stability, thermodynamic analysis shows that, under ambient conditions of 0 GPa and 300 K, the Ba2Ti(Ge,Sn,Se,Te)O6 DPOs exhibit bulk moduli of 147.93, 140.12, 134.35, and 130.51 GPa, Debye temperatures of 531.09, 507.96, 501.03, and 484.05 K, and thermal expansion coefficients of 4.25, 4.16, 4.35, and 4.19 × 10⁻⁵ K−1, respectively, indicating the brittleness and hardness of these materials. The stability analyses established on geometric factors, cohesive energies, and formation energies demonstrate the dynamic stability of the chosen DPOs. Nevertheless, the decomposition energies and phonon spectra reveal the unstable structures of Ba2(Se,Te)O6 perovskites and the stable structure of Ba2TiSnO6 across the entire temperature range of 0 to 1000 K, and the stable structure of Ba2TiGeO6 up to 600 K. It establishes that among the materials studied, Ba2TiGeO6 and Ba2TiSnO6 stand out due to their stability. Therefore, with closely temperature-tolerant enticing optoelectronic characteristics and robust stabilities, these DPOs are promising candidates as a p-type functional layer in high-temperature UV-based photovoltaics and optoelectronics.
Data availability
The authors confirm that the data supporting the findings of this study are available upon reasonable request.
Conflicts of interest
There are no conflicts of interest.
Acknowledgements
This work is sponsored by the National Natural Science Foundation of China (No. 12374017 & 12074362) and the Innovation Program for Quantum Science and Technology (2021ZD0303303). The computing time of the Supercomputing Center of the University of Science and Technology of China is gratefully acknowledged.
References
- J. George, A. P. Joseph and M. Balachandran, Int. J. Energy Res., 2022, 46, 21856–21883 CrossRef.
- M. Lamhani, Z. Chchiyai, A. Elomrani, B. Manoun and A. Hasnaoui, Inorg. Chem., 2023, 62, 13405–13418 CrossRef CAS PubMed.
- A. Liu, H. Zhu, S. Bai, Y. Reo, T. Zou, M.-G. Kim and Y.-Y. Noh, Nat. Electron., 2022, 5, 78–83 CrossRef CAS.
- N. Ahmed, S. Khan, A. A. Khan, A. G. Nabi, H. Ahmed, Z. ur Rehman and M. Nasim, J. Supercond. Novel Magn., 2018, 31, 4079–4089 CrossRef CAS.
- L. Zhang, X. Yang, Q. Jiang, P. Wang, Z. Yin, X. Zhang, H. Tan, Y. Yang, M. Wei and B. R. Sutherland,
et al.
, Nat. Commun., 2017, 8, 15640 CrossRef CAS PubMed.
- J. Yan and B. R. Saunders, RSC Adv., 2014, 4, 43286–43314 RSC.
- A. Nechache and S. Hody, Renewable Sustainable Energy Rev., 2021, 149, 111322 CrossRef CAS.
- A. Siddique, A. Khalil, B. S. Almutairi, M. B. Tahir, M. Sagir, Z. Ullah, A. Hannan, H. E. Ali, H. Alrobei and M. Alzaid, Int. J. Hydrogen Energy, 2023, 48, 24401–24411 CrossRef CAS.
- H. Fang, S. Ma, J. Wang, L. Zhao, F. Nie, X. Ma, W. Lü, S. Yan and L. Zheng, Adv. Funct. Mater., 2024, 34, 2409045 CrossRef CAS.
- G. M. Mustafa, Z. Ullah, M. A. Ameer, N. Noor, S. Mumtaz and M. K. Al-Sadoon, RSC Adv., 2024, 14, 18385–18394 RSC.
- G. M. Mustafa, M. Maqbool, Z. Ullah, N. Noor, M. Muzamil, Y. M. Alanazi and S. Mumtaz, Chem. Phys., 2023, 571, 111920 CrossRef CAS.
- Z. U. Rehman and Z. Lin, J. Mater. Chem. A, 2024, 12, 8846–8861 RSC.
- S. Belhachi, S. Al-Qaisi, S. Samah, H. Rached, A. Zaman, T. A. Alrebdi, A. Boutramine, N. Erum, R. Ahmed and A. S. Verma, J. Inorg. Organomet. Polym. Mater., 2024, 1–16 Search PubMed.
- D. Wlodarczyk, M. Amilusik, K. M. Kosyl, M. Chrunik, K. Lawniczak-Jablonska, H. Przybylinska, P. Kosmela, M. Strankowski, L.-I. Bulyk and V. Tsiumra,
et al.
, Inorg. Chem., 2024, 63, 10194–10206 CrossRef CAS PubMed.
- W. Guenez, S. Boudiba and F. Chemam, Phys. Scr., 2023, 98, 055913 CrossRef CAS.
- O. Caballero-Calero, J. R. Ares and M. Martín-González, Adv. Sustainable Syst., 2021, 5, 2100095 CrossRef CAS.
- M. El Khalloufi, O. Drevelle and G. Soucy, Minerals, 2021, 11, 1425 Search PubMed.
- D. A. Landínez-Téllez, C. E. Deluque Toro and J. Roa-Rojas, Dyna, 2014, 81, 126–131 CrossRef.
- M. Z. Kazim, M. Yaseen, S. A. Aldaghfag, M. Ishfaq, M. Nazar, M. Zahid and R. Neffati,
et al.
, J. Solid State Chem., 2022, 315, 123419 CrossRef CAS.
- M. Naseri, D. R. Salahub, S. Amirian and M. A. Rashid, J. Solid State Chem., 2022, 314, 123385 CrossRef CAS.
- T. Ghrib, J. Heat Transfer, 2022, 144, 121001 Search PubMed.
- T. Ghrib, A. Al-Otaibi, F. Ercan, A. A. Manda, B. Ozcelik and I. Ercan, Phys. B, 2023, 649, 414454 Search PubMed.
- C. E. Deluque-Toro, D. A. Landínez-Téllez and J. Roa-Rojas, Dyna, 2018, 85, 27–36 CrossRef.
- T. T. H. Nguyen, M. Sahakyan and V. H. Tran, J. Magn. Magn. Mater., 2023, 587, 171274 Search PubMed.
-
V. H. Tran, T. T. H. Nguyen and M. Sahakyan, Available at SSRN 4852923.
- I. A. Shah, M. Imran, N. A. Niaz, F. Hussain, U. Rasheed, M. Alam, S. M. Ali, R. Khalil and M. Shoaib, J. Comput. Electron., 2024, 23, 396–406 CAS.
- G. Kresse and J. Hafner, Phys. Rev. B:Condens. Matter Mater. Phys., 1993, 47, 558–561 CrossRef CAS PubMed.
- G. Kresse and J. Furthmüller, Phys. Rev. B:Condens. Matter Mater. Phys., 1996, 54, 11169–11186 CrossRef CAS PubMed.
- G. Kresse and D. Joubert, Phys. Rev. B:Condens. Matter Mater. Phys., 1999, 59, 1758–1775 CrossRef CAS.
- J. P. Perdew, K. Burke and M. Ernzerhof, Phys. Rev. Lett., 1996, 77, 3865 CrossRef CAS PubMed.
- J. Heyd and G. E. Scuseria, J. Chem. Phys., 2004, 121, 1187–1192 CrossRef CAS PubMed.
- M. Ratul Hasan, I. A. Apon, I. Ahmed Ovi and F.-T. Zahra, Int. J. Energy Res., 2024, 2024, 8213804 CrossRef.
- Q. Sun and Y. Yin, Comput. Mater. Sci., 2024, 239, 112956 CrossRef CAS.
-
A. Ejjabli, M. Karouchi, H. Errahoui, O. Bajjou, J. Guerroum, A. Elhajji, K. Rahmani and Y. Lachtioui, E3S Web of Conferences, 2024, p. 02001.
- S. Ali, H. S. Ali, K. Ismail, A. R. Iftikhar, H. Ali and H. H. Raza, Opt. Quantum Electron., 2024, 56, 1174 CrossRef CAS.
- A. Mera, M. A. Rehman, Z. ur Rehman, U. Farrukh, M. Usman and A. Rehman, Inorg. Chem. Commun., 2024, 162, 112259 CAS.
- F. Karlicky and M. Otyepka, J. Chem. Theory Comput., 2013, 9, 4155–4164 CAS.
- M. Ullah, R. Neffati, G. Murtaza, S. Khan, M. Haneef and M. W. Ashraf, Mater. Sci. Semicond. Process., 2022, 150, 106977 CAS.
- F. Pakravesh and M. Izadyar, J. Photochem. Photobiol., A, 2024, 453, 115602 CAS.
- M. M. Saad H-E and B. Alsobhi, J. Phys. Chem. Solids, 2024, 194, 112246 CAS.
- A. B. Djurišić, Y. Chan and E. H. Li, Mater. Sci. Eng., R, 2002, 38, 237–293 Search PubMed.
-
Y. Toyozawa, Optical processes in solids, Cambridge University Press, 2003 Search PubMed.
- C. Ambrosch-Draxl and J. O. Sofo, Comput. Phys. Commun., 2006, 175, 1–14 CAS.
- V. Keast, J. Electron Spectrosc. Relat. Phenom., 2005, 143, 97–104 CAS.
- V. Wang, N. Xu, J.-C. Liu, G. Tang and W.-T. Geng, Comput. Phys. Commun., 2021, 267, 108033 CAS.
- J. Y. Al-Humaidi, A. Ullah, N. U. Khan, J. Iqbal, S. Khan, A. Algahtani, V. Tirth, T. Al-Mughanam, M. S. Refat and A. Zaman, RSC Adv., 2023, 13, 20966–20974 CAS.
- S. A. Dar, R. Sharma, V. Srivastava and U. K. Sakalle, RSC Adv., 2019, 9, 9522–9532 CAS.
- A. Otero-de-la Roza, D. Abbasi-Pérez and V. Luaña, Comput. Phys. Commun., 2011, 182, 2232–2248 CrossRef CAS.
- R. M. Wentzcovitch, Y. G. Yu and Z. Wu, Rev. Mineral. Geochem., 2010, 71, 59–98 CrossRef CAS.
- M. Blanco, E. Francisco and V. Luana, Comput. Phys. Commun., 2004, 158, 57–72 CrossRef CAS.
-
N. Merhav, Vibrations in a Solid – Phonons and Heat Capacity, Springer International Publishing, Cham, 2018, pp. 95–102 Search PubMed.
- K. G. Bramnik, H. Ehrenberg, J. K. Dehn and H. Fuess, Solid State Sci., 2003, 5, 235–241 CrossRef CAS.
-
https://aoterodelaroza.github.io/gibbs2/manual/eos/
.
- M. Ishfaqa, A. Aziza, S. Aldaghfagb, S. Noreenc, M. Zahidc and M. Yaseena, Chalcogenide Lett., 2024, 21, 615–629 CrossRef CAS.
- Q. Dai, Q.-Q. Liang, T.-Y. Tang, H.-X. Gao, S.-Q. Wu and Y.-L. Tang, Mater. Sci. Semicond. Process., 2024, 171, 108003 CrossRef CAS.
- O. H. Mustonen, C. E. Pughe, H. C. Walker, H. M. Mutch, G. B. Stenning, F. C. Coomer and E. J. Cussen, Chem. Mater., 2020, 32, 7070–7079 CrossRef CAS.
- S. Meenakshi, V. Vijayakumar, S. Achary and A. Tyagi, J. Phys. Chem. Solids, 2011, 72, 609–612 CrossRef CAS.
- H. Ünlü, Solid-State Electron., 1992, 35, 1343–1352 CrossRef.
- K. P. O’donnell and X. Chen, Appl. Phys. Lett., 1991, 58, 2924–2926 CrossRef.
- R. Tauber, A. Machonis and I. Cadoff, J. Appl. Phys., 1966, 37, 4855–4860 CrossRef CAS.
- J. Wang, J. Li and S.-S. Li, J. Appl. Phys., 2011, 110, 054907 CrossRef.
- P. King, T. D. Veal, P. Jefferson, C. F. McConville, H. Lu and W. Schaff, Phys. Rev. B:Condens. Matter Mater. Phys., 2007, 75, 115312 CrossRef.
- A. W. Bott, Curr. Sep., 1998, 17, 87–92 CAS.
- A. Dimoulas, P. Tsipas, A. Sotiropoulos and E. Evangelou, Appl. Phys. Lett., 2006, 89, 252110 CrossRef.
- L. Petit, T. C. Schulthess, A. Svane, Z. Szotek, W. M. Temmerman and A. Janotti, Phys. Rev. B:Condens. Matter Mater. Phys., 2006, 73, 045107 CrossRef.
- C. Park, S. Zhang and S.-H. Wei, Phys. Rev. B:Condens. Matter Mater. Phys., 2002, 66, 073202 CrossRef.
- M. Nolan and S. D. Elliott, Phys. Chem. Chem. Phys., 2006, 8, 5350–5358 RSC.
- J. Cao, J. D. Querales-Flores, S. Fahy and I. Savić, Mater. Today Phys., 2020, 12, 100172 CrossRef.
-
J. Piprek, Semiconductor optoelectronic devices: introduction to physics and simulation, Elsevier, 2013 Search PubMed.
- B. Quan, X. Liang, G. Ji, Y. Cheng, W. Liu, J. Ma, Y. Zhang, D. Li and G. Xu, J. Alloys Compd., 2017, 728, 1065–1075 CrossRef CAS.
- M. P. Hughes, K. D. Rosenthal, N. A. Ran, M. Seifrid, G. C. Bazan and T.-Q. Nguyen, Adv. Funct. Mater., 2018, 28, 1801542 CrossRef.
- D. R. Penn, Phys. Rev., 1962, 128, 2093 CrossRef CAS.
- P. Sharma and S. Auluck, Phys. Rev. B:Condens. Matter Mater. Phys., 1981, 23, 874 CrossRef CAS.
- X. Liu, B. Xie, C. Duan, Z. Wang, B. Fan, K. Zhang, B. Lin, F. J. Colberts, W. Ma and R. A. Janssen,
et al.
, J. Mater. Chem. A, 2018, 6, 395–403 RSC.
- A. C. Sharma and S. Auluck, Phys. Rev. B:Condens. Matter Mater. Phys., 1983, 28, 965 Search PubMed.
-
M. Razeghi, Fundamentals of solid state engineering, Springer, 2009, pp. 1–53 Search PubMed.
-
B. Ancker-Johnson, Semiconductors and Semimetals, Elsevier, 1966, vol. 1, pp. 379–481 Search PubMed.
-
J. Hodgson, Optical Absorption and Dispersion in Solids, Springer, 1970, pp. 84–96 Search PubMed.
- A. M. Ferrari, R. Orlando and M. Rérat, J. Chem. Theory Comput., 2015, 11, 3245–3258 CAS.
- D. Rai, A. Shankar, M. Ghimire and R. Thapa,
et al.
, Comput. Mater. Sci., 2015, 101, 313–320 CrossRef CAS.
- B. Rameshe, R. Murugan and B. Palanivel, Int. J. Mod. Phys. B, 2016, 30, 1550246 CrossRef CAS.
- C. Bulutay, Phys. Rev. B:Condens. Matter Mater. Phys., 2007, 76, 205321 CrossRef.
-
https://docslib.org/doc/8671453/solid-state-physics-part-ii-optical-properties-of-solids
.
- S. Fratini and S. Ciuchi, SciPost Phys., 2021, 11, 039 CrossRef CAS.
- H. U. Yang, J. D’Archangel, M. L. Sundheimer, E. Tucker, G. D. Boreman and M. B. Raschke, Phys. Rev. B:Condens. Matter Mater. Phys., 2015, 91, 235137 CrossRef.
- J. Carbotte, K. Bryenton and E. Nicol, Phys. Rev. B, 2019, 99, 115406 CrossRef CAS.
- M. N. Islam, J. Podder, T. Saha and P. Rani, RSC Adv., 2021, 11, 24001–24012 RSC.
- B. Ghebouli, M. Ghebouli, H. Choutri, M. Fatmi, T. Chihi, L. Louail, A. Bouhemadou, S. Bin-Omran, R. Khenata and H. Khachai, Mater. Sci. Semicond. Process., 2016, 42, 405–412 CrossRef CAS.
- M. M. Ugeda, A. J. Bradley, S.-F. Shi, F. H. Da Jornada, Y. Zhang, D. Y. Qiu, W. Ruan, S.-K. Mo, Z. Hussain and Z.-X. Shen,
et al.
, Nat. Mater., 2014, 13, 1091–1095 CrossRef CAS PubMed.
- J.-L. Bredas, Mater. Horiz., 2014, 1, 17–19 RSC.
-
G. P. Smestad, Optoelectronics of solar cells, SPIE Press, 2002, vol. 118 Search PubMed.
- A. Sáenz-Trevizo, P. Amézaga-Madrid, P. Pizá-Ruiz, W. Antúnez-Flores and M. Miki-Yoshida, Mater. Res., 2016, 19, 33–38 CrossRef.
- J. Klein, L. Kampermann, B. Mockenhaupt, M. Behrens, J. Strunk and G. Bacher, Adv. Funct. Mater., 2023, 33, 2304523 CrossRef CAS.
- Z. Guo and X. Yang, Mater. Res. Express, 2019, 6, 115034 CrossRef CAS.
- E. Steigmeier, Appl. Phys. Lett., 1963, 3, 6–8 CrossRef CAS.
- G. Grimvall and S. Sjödin, Phys. Scr., 1974, 10, 340 CrossRef CAS.
- S. Abrahams and F. Hsu, J. Chem. Phys., 1975, 63, 1162–1165 CrossRef CAS.
- H. Inaba and T. Yamamoto, Netsu Sokutei, 1983, 10, 132–145 CAS.
- H.-H. Xie, Q. Gao, L. Li, G. Lei, X.-R. Hu and J.-B. Deng, Solid State Commun., 2016, 239, 49–54 CAS.
- S. A. Dar, V. Srivastava, U. K. Sakalle and G. Pagare, Comput. Condens. Matter, 2018, 14, 137–143 CrossRef.
- Y. Hinatsu, Y. Izumiyama, Y. Doi, A. Alemi, M. Wakeshima, A. Nakamura and Y. Morii, J. Solid State Chem., 2004, 177, 38–44 CAS.
- S. Patwe, S. Achary, M. Mathews and A. Tyagi, J. Alloys Compd., 2005, 390, 100–105 CAS.
- M. R. Filip and F. Giustino, Proc. Natl. Acad. Sci. U. S. A., 2018, 115, 5397–5402 CAS.
-
N. Joshi, V. Kushvaha and P. Madhushri, Machine Learning for Advanced Functional Materials, Springer, 2023 Search PubMed.
- V. M. Goldschmidt, Naturwissenschaften, 1926, 14, 477–485 CAS.
- Y. Wang, B. Baldassarri, J. Shen, J. He and C. Wolverton, Chem. Mater., 2024, 36, 6816–6830 CAS.
- R. D. Shannon, Found. Crystallogr., 1976, 32, 751–767 Search PubMed.
- C. Li, K. C. K. Soh and P. Wu, J. Alloys Compd., 2004, 372, 40–48 CrossRef CAS.
- C. J. Bartel, C. Sutton, B. R. Goldsmith, R. Ouyang, C. B. Musgrave, L. M. Ghiringhelli and M. Scheffler, Sci. Adv., 2019, 5, eaav0693 CrossRef CAS PubMed.
- Q. Dai, Q.-Q. Liang, T.-Y. Tang, H.-X. Gao, S.-Q. Wu and Y.-L. Tang, Inorg. Chem. Commun., 2024, 166, 112591 CrossRef CAS.
- R. Ullah, M. A. Ali, G. Murtaza, A. Khan and A. Mahmood, Int. J. Energy Res., 2020, 44, 9035–9049 CrossRef CAS.
- A. M. Mebed, M. Mushtaq, I. Muhammad, I. U. N. Lone, A.-Q. Samah, N. Algethami, E. EL-Shamy, A. Laref and N. AL-Hosiny, Phys. Scr., 2022, 98, 015807 CrossRef.
- C. J. Bartel, J. Mater. Sci., 2022, 57, 10475–10498 CrossRef CAS.
- M. Bhuyan, R. Hossain, F. Ara and M. Basith, Phys. Chem. Chem. Phys., 2022, 24, 1569–1579 RSC.
- W. Zheng, X. Gan, D. Du, Y. Wang, S. Dai, L. Guo and H. Liu, J. Wuhan Univ. Technol., Mater. Sci. Ed., 2023, 38, 520–529 CrossRef CAS.
- W. Feng, R. Zhao, X. Wang, B. Xing, Y. Zhang, X. He and L. Zhang, J. Energy Chem., 2022, 70, 1–8 CrossRef CAS.
- Q. Sun, J. Wang, W.-J. Yin and Y. Yan, Adv. Mater., 2018, 30, 1705901 CrossRef PubMed.
|
| This journal is © The Royal Society of Chemistry 2025 |
Click here to see how this site uses Cookies. View our privacy policy here. 
 Open Access Article
 This Open Access Article is licensed under a Creative Commons Attribution-Non Commercial 3.0 Unported Licence
 *a and
Zijing
Lin
*a and
Zijing
Lin


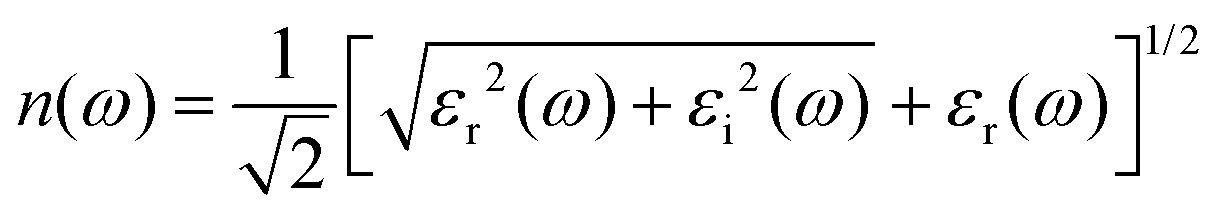


 . Debye's theory views vibrations in a solid as elastic waves, and the Debye temperature of these waves depends on their average sound velocity. The Debye model describes the Debye temperatures of the isotropic solids as given in eqn (11),50
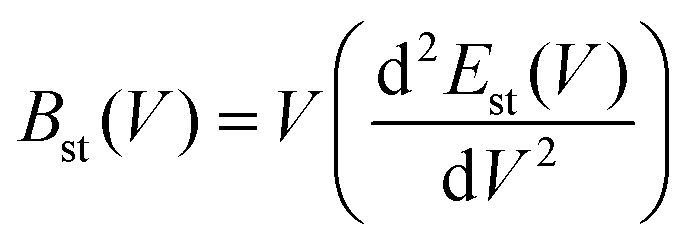


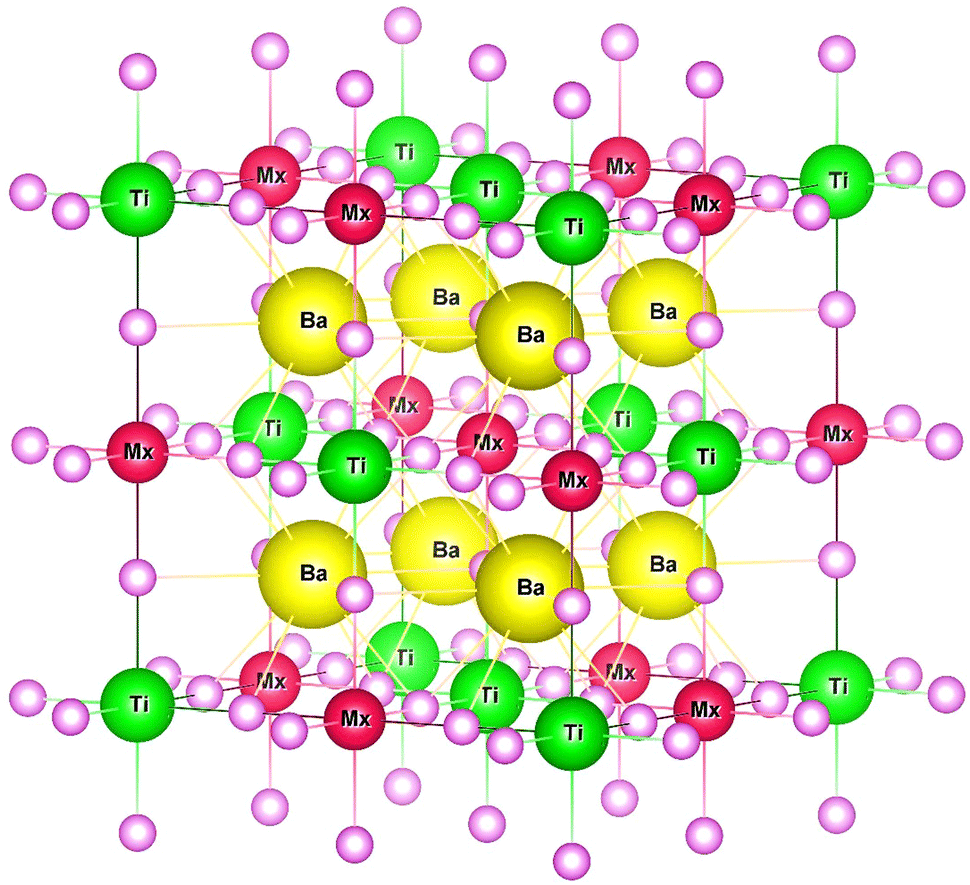


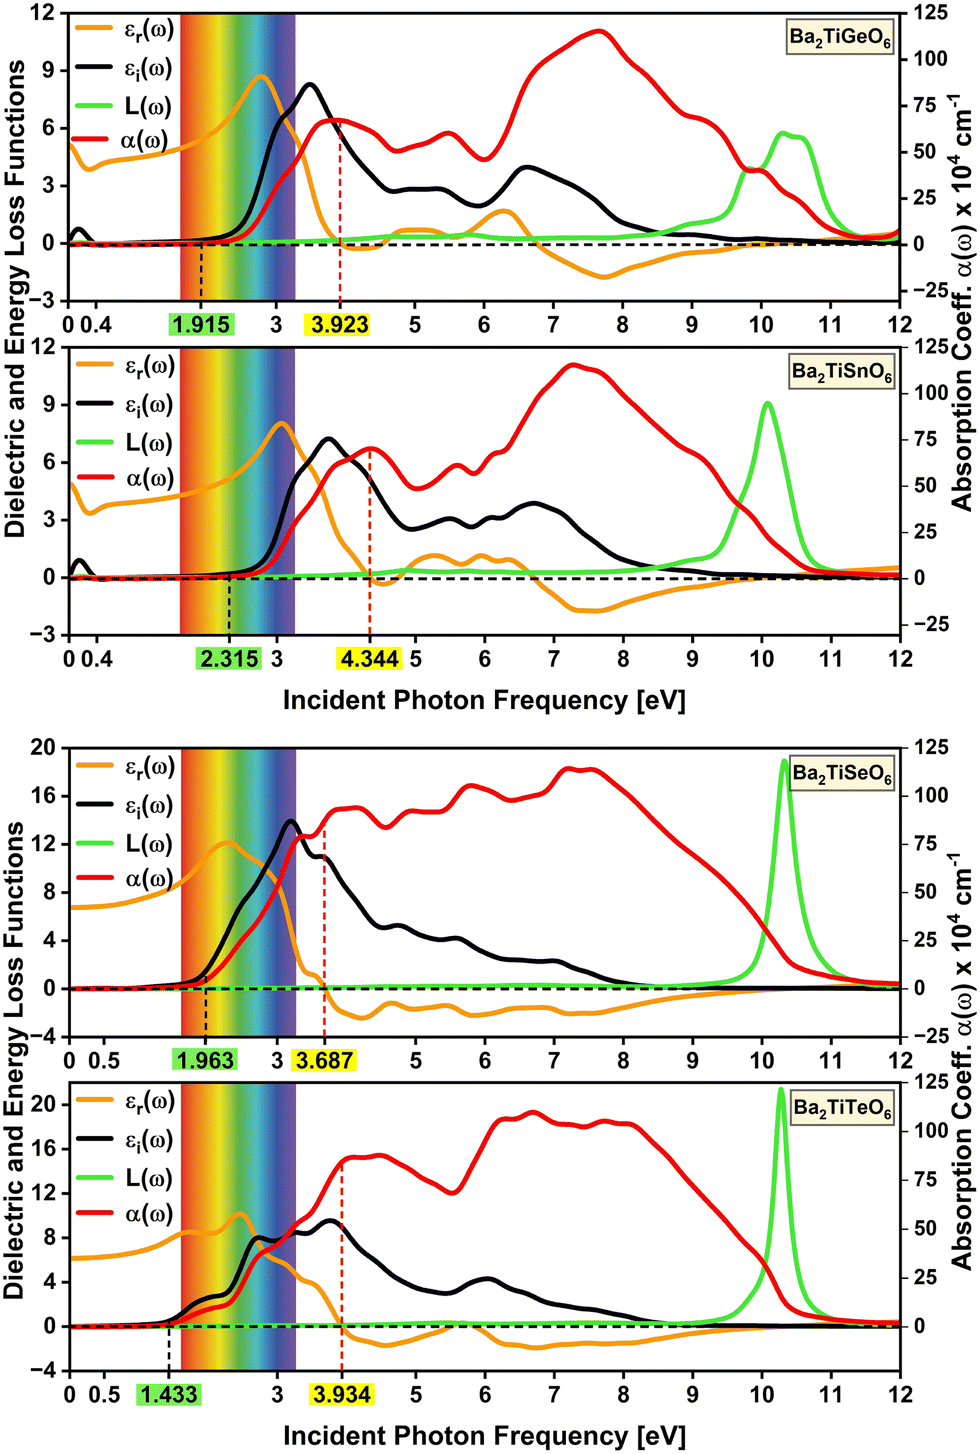

 as implied by eqn (6), are 2.27, 2.21, 2.60, and 2.48 for the studied Ge, Sn, Se, and Te-containing DPOs. The refraction spectra manifest peak indexes of 3.02, 2.89, 3.56, and 3.30, at 2.84, 3.11, 2.36, and 2.51 eV within the visible frequencies. High refractive indexes within the visible spectrum demonstrate that these materials are less transparent and more prone to light absorption in this range. Also, the refraction spectra of Ge- and Sn-containing perovskites display a trough at low frequency, indicative of the far-IR light absorption.