A novel broadband near-infrared phosphor Na3Mg4LiSi12O30:Cr3+: moderate synthesis and application†
Received
29th September 2024
, Accepted 28th October 2024
First published on 6th November 2024
Abstract
Broadband near-infrared (NIR) phosphors are the key for the preparation of NIR phosphor-converted light-emitting diodes (pc-LEDs), which have great application potential in night vision, medical diagnosis, bioimaging, and food quality analysis. Silicate based NIR phosphors have received wide attention due to their excellent thermal stability, while facing the challenge of being synthesized over 1000 °C. In this study, a novel NIR phosphor Na3Mg4LiSi12O30:Cr3+ (NMLS:Cr3+) has been successfully synthesized at 600 °C, and a strong electro-phono coupling effect of Cr3+ is proved to ensure its broad NIR emission peaking at 785 nm with a full width at half maximum (FWHM) of ∼118 nm. The prepared NIR phosphor is fabricated into a NIR pc-LED, which shows application potential in organizational penetration and night vision. Based on the characteristic absorption of alcohol around 900 nm, a portable NIR detector is designed for alcohol detection. This study provides a suitable low-temperature synthesized host for Cr3+ doped broadband NIR phosphors and new ideas for exploring advanced applications of NIR luminescent materials.
1. Introduction
Near-infrared (NIR) light is an important component of the electromagnetic spectrum, characterized by its invisibility to human eyes, strong penetration, lack of radiation damage, and ability to absorb corresponding molecular vibrations. It has great application potential in various fields, such as night vision, medical diagnosis, spectral analysis, bioimaging, machine vision, food quality analysis, etc.1–5 Compared to traditional NIR light sources, such as halogen lamps with large size and low efficiency, broadband NIR phosphor-converted light-emitting diodes (NIR pc-LEDs) are considered to be an ideal new generation NIR light sources. They have the advantages of small size, high efficiency, adjustable spectral bandwidth, low cost, fast response, and long lifespan, enabling them to be particularly suitable as a component and efficient broadband light source for portable wearable electronic products, achieving health management or microspectral detection functions.6–9 High performance NIR phosphors have become the key to fabricate pc-LED type NIR light sources.
Extensive efforts have been made to explore novel NIR phosphors, and a number of phosphors with good performance have been developed. For example, CaO:Eu2+ can generate broadband NIR emissions through parity-allowed f–d transition with a high quantum efficiency.10 Sr2−yCayInSbO6:Fe3+(y = 0–2) and Ca2(InSb)1−zSn2zO6:Fe3+(z = 0–1) can also achieve long-wavelength NIR emissions excited by ultraviolet light.11 Although various rare earth ions and transition metal ions can produce NIR emission, the unique energy level structure of the Cr3+ ion makes it an ideal choice for broadband NIR emission centers. In a weak crystal field environment, Cr3+ exhibits broadband tunable NIR emission, and its wide absorption band can match well with blue LED chips, which makes the Cr3+ activated phosphors a promising candidate for NIR luminescent materials.12–22
Hosts for Cr3+ activated phosphors are plentiful.23 Among them, silicate-based phosphors have the advantages of resistant to moisture and high thermal stability, but most of them have to be prepared at very high temperature, mostly higher than 1000 °C, as summarized in Table S1 (ESI†). Moderate synthesis conditions are very important for the popularization of industrial production and energy saving. So, finding a host that can be synthesized at low temperatures is a challenging but meaningful task. From the viewpoint of crystallography, alkali metal ions are the ideal cationic choice. They are helpful in reducing the melting point due to the amplified ion polarization effect, which facilitates the shift from ionic bonding to covalent bonding and thereby making the compound easier to crystallize. Moreover, the excessive alkali metal raw materials can also act as flux agents to lower the melting point of the solid solution, and synthesize compounds at lower temperature. However, the sites of alkali metal ions are not suitable for Cr3+ ion substitution because of the significant valence state differences. Then a bivalent or trivalent cation in the unit cell is necessary for the ideal host. At the same time, considering that a broadband emission of Cr3+ requires a weak crystal field environment,24 which requires a larger cation site, Mg2+ ions are another suitable cation for the host.25–28 Then a milarite structure compound Na3Mg4LiSi12O30 is selected as the host to develop novel NIR phosphors.
In this work, a series of Na3Mg4LiSi12O30:xCr3+ phosphors were prepared at a moderate temperature of only 600 °C by a solid-state reaction method, which is the lowest synthesis temperature of silicates. Upon 475 nm light excitation, the prepared phosphors show a broadband NIR emission peaking at 785 nm, with an FWHM of ∼118 nm, which comes from the NIR emission of octahedra Cr3+ ions on the Mg2+ sites. The electro-phono coupling (EPC) mechanism in Na3Mg4LiSi12O30 (NMLS) is clarified by temperature-dependent luminescence, and a NIR pc-LED is fabricated by combining the NMLS:9%Cr3+ phosphor with a 475 nm LED chip to evaluate the application potential of it in tissue penetration, night vision, and solution composition detection. This study presents an effective idea to obtain moderate-temperature synthetic hosts, which can be applied to other luminescent material hosts. Moreover, a variety of novel application designs of NIR pc-LEDs are also presented.
2. Experimental section
A series of Na3Mg4LiSi12O30:x%Cr3+ (x = 1, 3, 5, 7, 9, 11, and 13) samples were prepared with starting reactants Na2CO3(AR), MgO(AR), Li2CO3(AR), SiO2(99.99%) and Cr2O3(99.5%) in stoichiometric ratio. The target products were successfully synthesized by sintering at the moderate temperature 600 °C for only 5 hours in air, which is a very fast solid state reaction process. The purity of the as-prepared samples was verified using XRD patterns, which were obtained using a Bruker D8 ADVANCE diffractometer (X’Pert Pro, PANalytical B.V., Netherlands) operating at 40 kV and 40 mA with Cu Kα radiation (λ = 1.5406 Å). The refinement data for Rietveld analysis were collected in a step-scanning mode over the 2θ range from 10° to 130° at intervals of 0.017°. Scanning electron microscopy (SEM, SU8020, HITACHI, Japan) with energy dispersive X-ray spectroscopy (EDX, EMAX, HORIBA) was used to characterize the morphology of the samples. Electron paramagnetic resonance (EPR) spectra were obtained using a Bruker EMXplus-6/1 EPR spectrometer. The photoluminescence (PL) and photoluminescence excitation (PLE) spectra at room temperature were measured using a fluorescence spectrometer (Edinburgh Instruments, FS5, England) equipped with a 150 W Xenon lamp. The temperature-dependent photoluminescence (PL) spectra were measured using a Xenon lamp of FLS920, equipped with heating apparatus (Tianjin Orient Koji Co., Ltd, TAP-02). The photoluminescence quantum yield (PLQY) was measured using a calibrated integrating sphere. The fluorescence lifetime of millisecond was obtained using a 100 w μF900 lamp as the light source and a R928P photo-multiplier as the detector. NIR pc-LEDs were fabricated by combining the Na3Mg4LiSi12O30:9%Cr3+ phosphors with a 475 nm InGaN LED chip. The photoelectric properties of the pc-LEDs were measured using a HAAS 2000 photoelectric measuring system, and the transmission spectra were also obtained using the same photoelectric measuring system.
3. Results and discussion
3.1. Structure characterization
Na3Mg4LiSi12O30 crystallized in a hexagonal crystal system with the space group of P6/mcc (192). As shown in Fig. 1a and Fig. S1 (ESI†), the fundamental building unit of NMLS is SiO4 tetrahedra, which are connected to each other via bridging oxygen atoms and form layers along the (a, b) plane. The Na atoms are coordinated with 12 and 9 oxygen atoms. The Mg1 atoms are six-coordinated with oxygen atoms to form octahedra, which are located between the SiO4 tetrahedral layers. A mixed occupancy is found to exist in Mg2 sites, with partial replacement by 33.3% Li. They are four-coordinated oxygen atoms to form tetrahedra. Obviously, the Mg1 sites are favorable to form a weak crystal field environment for Cr3+ ions.
 |
| | Fig. 1 (a) Crystal structure of NMLS and coordination of Mg1 and Si. (b) XRD patterns of NMLS:xCr3+ for x = 1–13%, and the enlarged view of the diffraction peaks around 27.5°. (c)–(e) Rietveld refinement results, EDS mapping and EPR for NMLS:9%Cr3+. | |
The XRD patterns of NMLS:xCr3+ samples are shown in Fig. 1b. All of them are consistent with the standard pattern (PDF#73-0934), indicating that the pure phase phosphors are successfully synthesized. From the enlarged view of the selected peaks in Fig. 1b, it can be inferred that the diffraction peaks shift to a higher angle with the increasing concentration of Cr3+, which indicates the shrinking of the lattice unit and a replacement by ions with smaller radii. Considering the large crystal-field stabilization energy of an electronic configuration of d3 and d8 in the octahedral coordination, and the ionic radii of the cations in NMLS (CN = 6,  ), Mg (CN = 6,
  ), Cr3+ ions prefer to occupy the Mg1 sites. To further confirm the detailed crystallographic information, Rietveld refinement is performed by using the structure of NMLS as the initial model with the TOPAS program.29 The refinement process is implemented according to Cr3+ ions occupying the Mg1 site. As shown in Tables S2 and S3 (ESI†) and Fig. 1c, the smaller cell volume of 1258.37 Å3 and the reliable agreement factors (Rp = 8.21%, Rwp = 10.95%, and GOF = 1.85) support the site preference and the above discussion.
As shown in Fig. 1d, the elemental mapping images demonstrate that Na, Mg, Li, Si, O and Cr ions are distributed in NMLS homogeneously and Cr3+ ions are successfully doped into the sample. The Li element cannot be detected using the SEM-EDS system owing to its light weight (Fig. S2, ESI†).30 To investigate the valence state and local site symmetry of paramagnetic ions, the EPR of NMLS:9%Cr3+ was recorded at RT. In Fig. 1e, two resonance signals with effective g values are presented; the asymmetric signal at g = 4.19 belongs to the isolated Cr3+ signal in octahedral sites, and the intense signal at g = 1.97 corresponds to Cr3+–Cr3+ electron exchange coupling pair.31
3.2. Photoluminescence properties
The PLE and PL spectra of NMLS:9%Cr3+ are shown in Fig. 2a. Under 475 nm excitation, NMLS:Cr3+ shows a broad NIR emission peaking at about 785 nm with a FWHM value of 118 nm, which is due to the 4T2(4F) to 4A2 transition of Cr3+ in a weak crystal field. The PLE spectra consist of three excitation bands centered at 305, 475, and 670 nm, corresponding to 4A2 → 4T1(4P), 4A2 → 4T1(4F), and 4A2 → 4T2(4F) transitions of Cr3+, respectively. The strong excitation band at 210 nm belongs to the O2−–Cr3+ charge-transfer band (CTB). It is worth noting that there are two dips located at 639 and 672 nm in both samples (Fig. S3, ESI†), which are interpreted as Fano antiresonance between the 2E/2T1 and the vibrationally broadened 4T2 levels.32–34
 |
| | Fig. 2 (a) PLE and PL spectra of NMLS:9%Cr3+ phosphors at RT. (b) Tanabe–Sugano energy level diagram of Cr3+ ions with octahedral coordination. (c) PL spectra of the NMLS:xCr3+ phosphors under 475 nm excitation at RT. The inset shows the relative intensity. (d) Fluorescence decay of NMLS:xCr3+. | |
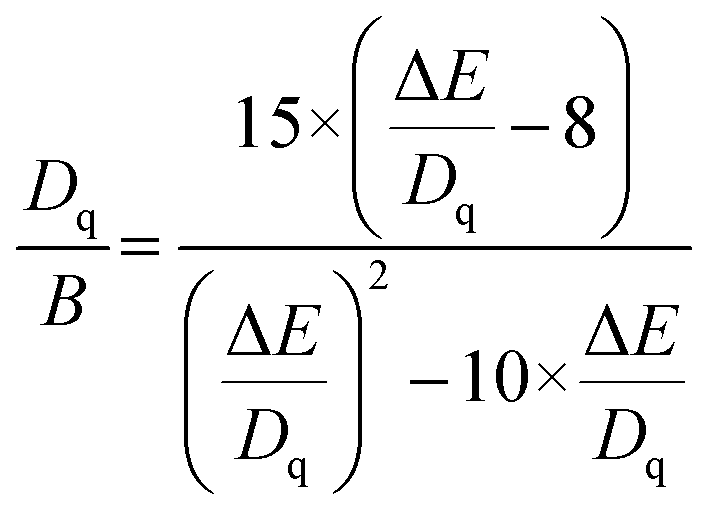
The NIR luminescence of Cr3+ ions is strongly influenced by the crystal-field. In the NMLS host, only a broad emission band from the 4T2(4F) to 4A2 transition is observed, while the spin-forbidden 2E(2G) → 4A2 transition (R line) cannot be detected in the PL spectrum in Fig. 2a. Therefore, Cr3+ ions are located in a weak crystal field environment in NMLS. Crystal field theory was used to explain the change of crystal field strength and crystal field splitting energy. The relevant parameters can be evaluated from the following equation.35–37
| |  | (1) |
| |  | (2) |
where
Dq is the crystal field parameter and
B is the Racah electron repulsion parameter. The Stokes shift Δ
S represents the energy difference of
E(
4A
2 →
4T
2) and
E(
4T
2 →
4A
2), and Δ
E represents the energy difference between the two energy levels
E(
4A
2 →
4T
1) and
E(
4A
2 →
4T
2). Based on the PLE and PL spectra, the calculated values of
Dq and
B at room temperature (RT) are 1381.12 and 622.13 cm
−1 respectively, and
Dq/
B is 2.22 (Fig. S4 (ESI
†) and
Fig. 2b). The small
Dq/
B value proves that Cr
3+ undergoes a weak CF splitting in NMLS. Therefore, the luminescence of Cr
3+ in NMLS shows a broadband NIR emission centered at 785 nm.
As shown in Fig. 2c, the emission intensity of NMLS:xCr3+ reaches the maximum when the Cr3+-doping concentration is 9% and then decreases due to the concentration quenching effect. The quantum yield of NMLS:9%Cr3+ is 15.2% (Fig. S5, ESI†). The nonradiative energy transition between luminescent centers is usually caused by exchange interactions (less than 5 Å) and multipolar interactions (greater than 5 Å), resulting in the concentration quenching effect. The critical energy transfer distance Rc was calculated from the following equation:38
| | 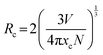 | (3) |
where
V is the cell volume,
xc is the critical concentration of Cr
3+, and
N is the cation number that Cr
3+ could occupy in per unit cell. For NMLS:9%Cr
3+,
V = 1257.23 Å
3,
N = 4,
xc = 9%, and the
Rc value is determined to be 18.8 Å. The calculation result is greater than 5 Å, which means that the multipolar interactions lead to concentration quenching in NMLS:9%Cr
3+. The mechanism of multipolar interactions between Cr
3+ ions can be further explained using the following formula:
39| |  | (4) |
where
I is the emission intensity of the sample,
x is the concentration of the Cr
3+ ion, and
k and
β are constants. The value of
θ is 3, which corresponds to the energy transfer among the nearest-neighbor ions, while 6, 8 and 10 correspond to dipole–dipole, dipole–quadrupole and quadrupole–quadrupole interactions, respectively. Fig. S6 (ESI
†) shows the relationship between log(
I/
x) and log(
x), and the value is equal to 2.1, which is close to 3. Therefore, the main concentration quenching mechanism for NMLS:
xCr
3+ is the energy transfer among the nearest-neighbor ions.
40,41
Fig. 2d shows the fluorescence decay curves of NMLS:xCr3+ at room temperature monitored at 785 nm upon 475 nm excitation as a function of Cr3+ content. The lifetime of Cr3+ in NMLS decreases from 67.0 to 62.3 μs with the increasing x value being caused by the super exchange interactions between Cr3+ ions. The decay curves of NMLS:xCr3+ can be well fitted by a single exponential equation, which when combined with the normalized PL result without shift in Fig. S7 (ESI†) indicate that the Cr3+ luminescence comes from one site.
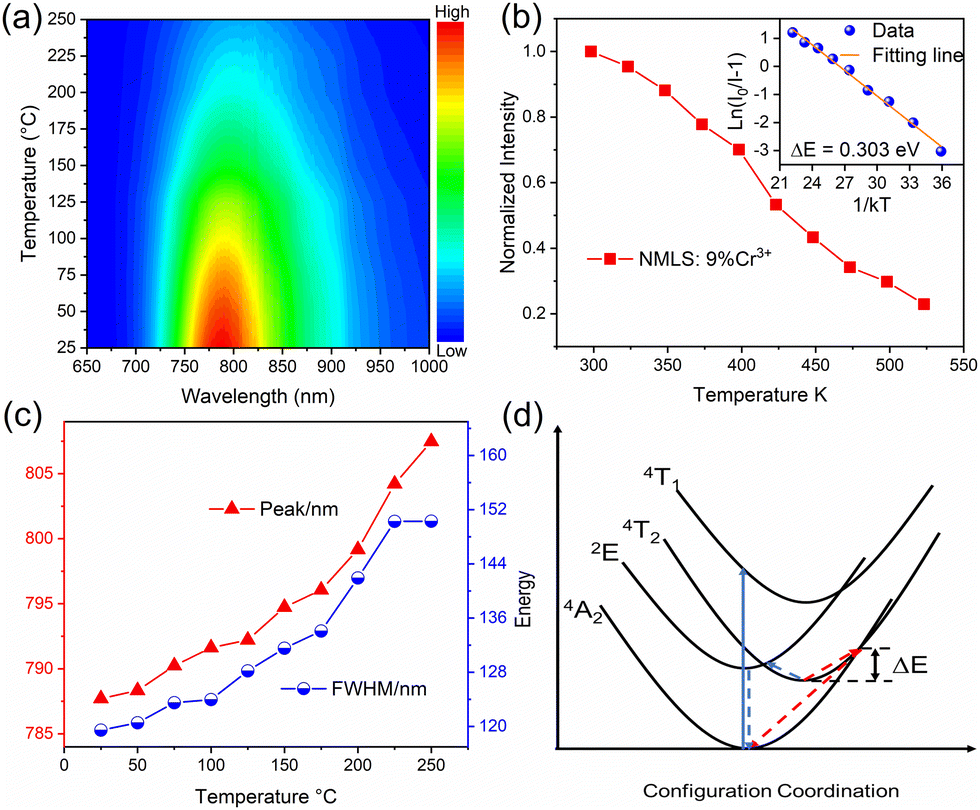
3.3. Temperature-dependent emission spectra
To meet the high temperature conditions during the operation of pc-LED chips, the thermal stability of NMLS:9%Cr3+ was characterized. As shown in Fig. 3a and b, the emission intensity of NMLS:9%Cr3+ decreases with the temperature increase from 25 °C (298 K) to 250 °C (523 K), while the emission intensity remains at 53% of room temperature at 150 °C (423 K). The temperature dependence of the emission intensity can be fitted using the Arrhenius formula.3,42| |  | (5) |
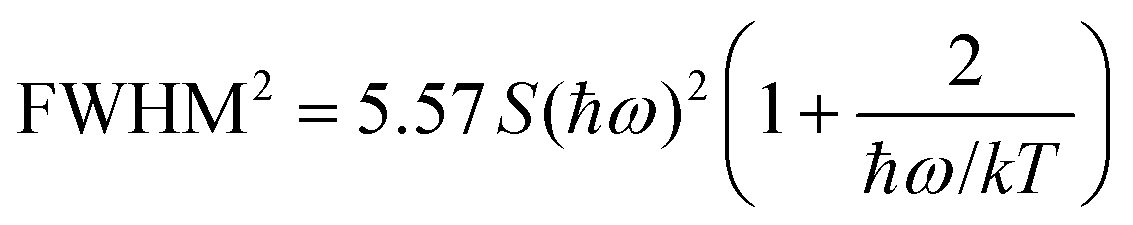
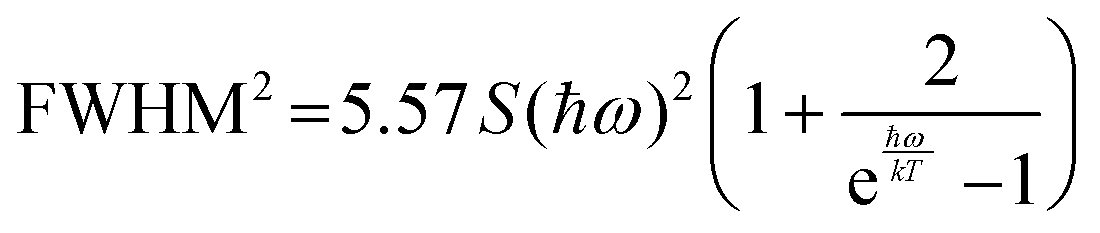
where IT is the integrated intensity at a certain temperature, I0 is the initial integrated intensity, and k is the Boltzmann constant. The thermal activation energy ΔE was estimated to be 0.303 eV. The nonradiative transition was caused by multi-phonon relaxation at the cross-point of the 4A2 ground level and 4T2 excited level (Fig. 3d). The temperature-dependent peak positions and FWHM values of NMLS:9%Cr3+, as well as the normalized temperature-dependent emission spectra, are shown in Fig. 3c and Fig. S8 (ESI†). With increasing temperature, a red shift from 787 to 807 nm is observed at the central peaks, owing to the decrease of the crystal field caused by lattice expansion at higher temperatures. It can be explained in the Tanabe–Sugano energy level diagram that the decrease in Dq/B value means a shorter distance between the excited and ground states, leading to a decrease in the transition energy between 4T2 and 4A2, and as a result, it causes a redshift in the spectrum (Fig. 2b). The emission spectra broaden with increasing temperature with an increasing FWHM from ∼119 to ∼150 nm, which is attributed to the strengthened EPC effect of the 4T2g(4F) → 4A2g transition in NMLS:Cr3+. The Huang–Rhys parameter S can be used to evaluate the strength of EPC and can be estimated using the following equation.43–45| |  | (6) |
where ħ is Planck's constant, ω is phonon frequency, ħω represents the effective phonon energy, and k is the Boltzmann constant and  .
.
 |
| | Fig. 3 (a) Temperature-dependent emission spectra of NMLS:9%Cr3+ phosphors. (b) Normalized integrated PL intensities, and the fitted result by the Arrhenius equation. (c) Temperature-dependent peak positions and FWHM values of NMLS:9%Cr3+. (d) Schematic configuration coordinate diagram of Cr3+. | |
On modifying the formula, we obtain
| |  | (7) |
Considering that  ,
,
| | 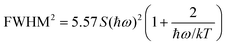 | (8) |
Thus, it can be written as
where
A = 5.57
Sħω, and
B = 5.57
S(
ħω)
2.
Based on the fitting results, the value of S and ħω are determined to be 5.36 and 0.023 eV (Fig. S9, ESI†) respectively. The big S value indicates a strong EPC of Cr3+ in NMLS, thus, the temperature-dependent luminescence of NMLS:9%Cr shows redshift and an increasing FWHM. The relative emission intensity in the range of 650–725 nm increases and shows blue-shift with increasing temperature in Fig. S8 (ESI†), which comes from the interaction between the 2Eg(2G) and 4T2g(4F) states.46
3.4. NIR pc-LED fabrication and applications
The NIR pc-LED was fabricated using NMLS:9%Cr3+ phosphors with a 475 nm InGaN chip. Fig. 4a shows the luminescence spectra of the as-fabricated NIR pc-LEDs under different drive currents and its photographs. The strong emission peak at ∼475 nm comes from the LED chip and the broad NIR emission band comes from NMLS:Cr3+. The NIR luminescence intensity increases with the increasing driving current from 10 to 300 mA, while the NIR luminescence spectral profile remains unchanged. The NIR output power increases with the driving current, and achieves 6.09 mW at 100 mA. The decrease in photoelectric efficiency is mainly caused by the decrease in chip efficiency (Fig. S10, ESI†). The good performance enables the prepared NIR pc-LED to achieve multifunctional applications. Due to the excellent penetration ability and insensitivity for human eyes, NIR light can be used for non-destructive penetration examination of human tissues and night vision. Fig. 5a shows the photographs of fingers and palms passing through NIR light, and the distribution of blood vessels can be clearly observed with a NIR camera. This proves that the NMLS:Cr3+ phosphors have potential application in the medical fields. Under fluorescent lamps, part of the fruits is obscured by a 760 nm long-pass filter and viewed with a visible camera. Using the fabricated NIR pc-LED as the sole light source, the whole fruits can be observed clearly in a NIR camera, meanwhile, the glass bottle, alcohol and mixed solutions can also be observed clearly, which means the prepared device with NIR emission have promising application in night vision. To explore the potential applications of NMLS:Cr3+ pc-LED for alcohol component detection, the transmission and calculated absorbance spectra of the glass bottle, alcohol, water and mixed solution were analyzed. As shown in Fig. 5b–d, the glass bottle shows no absorption, which excluding the influence of bottles on the subsequent experiments. The sample with alcohol shows the characteristic absorption in the region of 875–950 nm, while that of water shows absorption in the 900–1000 nm region. This characteristic can be used to detect the composition of transparent liquids. The transmission and absorption spectra of mixed solutions with different alcohol concentrations are shown in Fig. S11 (ESI†) and Fig. 5e. The peaks corresponding to alcohol are observed clearly, which proves the capability of the prepared device to detect alcohol components in aqueous solutions. It can be used further to detect the concentration of alcohol in alcoholic beverages. Flammable liquids need to be checked out at the security checkpoints, which requires easy and quick identification. Here, some commercial daily products are selected to verify the effectiveness of the prepared device in alcohol detection. As shown in Fig. 5f, g and Fig. S12a, b (ESI†), the absorption peak of alcohol is detected from a commercial no washing antibacterial hand sanitizer, which contains large amounts of alcohol, while no absorption peak of alcohol is detected from a commercial bacteriostatic hand wash, which is mainly composed of aloe vera. Another example is made from a non-alcoholic commercial facial toner, which shows no alcohol absorption peak, while the absorption peak appeared after adding alcohol to it (Fig. S12c, d and S13, ESI†). Based on the above experimental results, a portable NIR detector is designed for rapid detection of alcohol. As illustrated in Fig. 5h and i, a bandpass filter is placed between the sample and the NIR photoresistor. Then only the light within the alcohol absorption band is allowed to pass through. When the sample with different alcohol concentrations is placed in the device, different intensities of light passing through will lead to the changed resistance value of the photoresistor. On the parallel circuit, each red LED is connected in series with a resistor of different resistance values. Then the changed current in the circuit will light up different number of red LEDs according to the different alcohol concentration. When the detected alcohol concentrations are low, medium, and high, the device will have one, two, and three red LEDs lighted respectively. The miniaturized device makes the detection more convenient and efficient, which can be further applied to the detection of other solutions that have absorption in the NIR region. The above experiments prove that the prepared device has potential application in rapid identification of dangerous goods containing alcohol at security checkpoints. In addition, the small size of the NMLS:Cr3+ NIR pc-LED makes it a good candidate for a new intelligent broadband NIR light source, which can be used to fabricate smart wearable devices such as smart watch, smart glasses and smart phone, enabling fast and convenient applications in daily life.
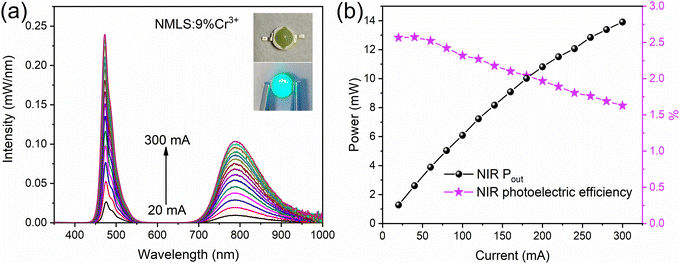 |
| | Fig. 4 Performance of the fabricated pc-NIR LED device (a) EL spectra. (b) NIR output power (650–1000 nm), photoelectric efficiency of the NIR pc-LED. | |
 |
| | Fig. 5 (a) Applications in penetration ability and night vision. (b)–(d) Transmission spectra and calculated absorbance spectra for glass bottle, water, and alcohol. Calculated absorbance spectra of the mixed solution of water and alcohol (e), no washing antibacterial hand sanitizer mainly composed of alcohol (f), and bacteriostatic hand wash mainly composed of aloe vera (g). Designed NIR portable detector (h) and the circuit principle diagram (i). | |
4. Conclusions
In conclusion, a novel broadband NIR phosphor NMLS:Cr3+ is successfully prepared at a moderate temperature (600 °C) via the conventional solid-state reaction method. The results of Rietveld refinement and EPR indicate that the Cr3+ ions occupy the Mg2+ octahedral sites. The as-prepared phosphors exhibit a broad NIR emission from 650 to 1100 nm with a FWHM of 118 nm under blue light excitation. By analyzing temperature-dependent PL, the Huang–Rhys parameter S is calculated to be 5.36, which indicates a strong EPC of Cr3+ in NMLS. A NIR pc-LED was fabricated using a NMLS:9%Cr3+ phosphor and a 475 nm blue LED chip, which showed application potential in tissue penetration, night vision, and alcohol detection. It could be a portable detector to identify some flammable liquids containing alcohol rapidly in security checkpoints, and realize the miniaturization of the next generation of smart devices.
Author contributions
Z. W. J. performed the experiments and wrote the manuscript. L. W. guided the research. X. H. Z., J. Y. G., T. Q. S., Y. F. K., and J. J. X. commented on this work.
Data availability
The data supporting this article have been included as part of the ESI.†
Conflicts of interest
There are no conflicts of interest to declare.
Acknowledgements
This work was financially supported by the National Natural Science Foundation of China (12274244), and the 111 Project (B23045).
References
- G. Liu, W. Chen, Z. Xiong, Y. Wang, S. Zhang and Z. Xia, Nat. Phton., 2024, 18, 562–568 CrossRef CAS.
- C. Zhong, Y. Xu, X. Wu, S. Yin, X. Zhang, L. Zhou and H. You, Adv. Mater., 2024, 36, 2309500 CrossRef CAS.
- Z. Jia, C. Yuan, Y. Liu, X.-J. Wang, P. Sun, L. Wang, H. Jiang and J. Jiang, Light: Sci. Appl., 2020, 9, 86 CrossRef CAS PubMed.
- C. Pasquini, Anal. Chim. Acta, 2018, 1026, 8–36 CrossRef CAS.
- R. Li, Y. Liu, C. Jin, L. Zhang, J. Zhang, X.-J. Wang, G. Chen and J. Jiang, Laser Photonics Rev., 2024, 18, 2300608 CrossRef CAS.
- M. Vasilopoulou, A. Fakharuddin, F. P. García De Arquer, D. G. Georgiadou, H. Kim, A. R. B. Mohd Yusoff, F. Gao, M. K. Nazeeruddin, H. J. Bolink and E. H. Sargent, Nat. Photon., 2021, 15, 656 CrossRef CAS.
- S. Liu, H. Cai, S. Zhang, Z. Song, Z. Xia and Q. Liu, Mater. Chem. Front., 2021, 5, 3841 RSC.
- H. Xiao, J. Zhang, L. Zhang, H. Wu, H. Wu, G. Pan, F. Liu and J. Zhang, Adv. Opt. Mater., 2021, 9, 2101134 CrossRef CAS.
- X. Zhou, J. Xiang, J. Zheng, X. Zhao, H. Suo and C. Guo, Mater. Chem. Front., 2021, 5, 4334 RSC.
- J. Qiao, S. Zhang, X. Zhou, W. Chen, R. Gautier and Z. Xia, Adv. Mater., 2022, 34, 2201887 CrossRef CAS.
- D. Liu, G. Li, P. Dang, Q. Zhang, Y. Wei, L. Qiu, M. Molokeev, H. Lian, M. Shang and J. Lin, Light: Sci. Appl., 2022, 11, 112 CrossRef CAS.
- C. Yuan, R. Li, Y. Liu, L. Zhang, J. Zhang, G. Leniec, P. Sun, Z. Liu, Z. Luo, R. Dong and J. Jiang, Laser Photonics Rev., 2021, 15, 2100227 CrossRef CAS.
- A. Satpathy, W.-T. Huang, T.-H. Liu, T.-Y. Su, W. Zhang, M. Kamiński, M. Grzegorczyk, J.-H. Chen, D.-H. Cherng, K.-M. Lu, X. Chen, S. Mahlik and R.-S. Liu, Adv. Opt. Mater., 2024, 12, 2400130 CrossRef CAS.
- Y. Zhao, X. Wang, Q. Wang, T. Zhou, Y. Chen, J. Xu, X. Tang and R.-J. Xie, J. Mater. Chem. C, 2024, 12, 10532–10539 RSC.
- L. Zhang, D. Wang, Z. Hao, X. Zhang, G. Pan, H. Wu and J. Zhang, Adv. Opt. Mater., 2019, 7, 1900185 CrossRef.
- R. Li, Y. Liu, C. Yuan, G. Leniec, L. Miao, P. Sun, Z. Liu, Z. Luo, R. Dong and J. Jiang, Adv. Opt. Mater., 2021, 9, 2100388 CrossRef CAS.
- L. Yao, Q. Shao, S. Han, C. Liang, J. He and J. Jiang, Chem. Mater., 2020, 32, 2430–2439 CrossRef CAS.
- X. Zhang, D. Sun, P. Luo, L. Zhou, X. Ye and H. You, J. Mater. Chem. C, 2024, 12, 16422–16430 RSC.
- P. Xiong, B. Huang, D. Peng, B. Viana, M. Peng and Z. Ma, Adv. Funct. Mater., 2021, 31, 2010685 CrossRef CAS.
- P. Shao, P. Xiong, Y. Xiao, Z. Chen, D. Chen and Z. Yang, Adv. Powder Mater., 2023, 100165 Search PubMed.
- B. Xiao, S. Wu, P. Xiong, Y. Xiao, P. Shao, Z. Zhou, Y. Wang and F. Wang, Chem. Eng. J., 2024, 498, 155040 CrossRef CAS.
- P. Shao, D. Chen, Z. Lun, Y. Wu, Z. Chen, Y. Xiao, P. Xiong, S. Wang, B. Viana, W. Im and Z. Yang, Small, 2024, e2402352 CrossRef.
- P. Dang, Y. Wei, D. Liu, G. Li and J. Lin, Adv. Optical Mater., 2022, 11, 2201739 CrossRef.
- B. Malysa, A. Meijerink and T. Jüstel, J. Lumin., 2018, 202, 523–531 CrossRef CAS.
- L. Fang, L. Zhang, H. Wu, H. Wu, G. Pan, Z. Hao, F. Liu and J. Zhang, Inorg. Chem., 2022, 61, 8815 CrossRef CAS.
- L. Fang, Z. Hao, L. Zhang, H. Wu, H. Wu, G. Pan and J. Zhang, Mater. Res. Bull., 2022, 149, 111725 CrossRef CAS.
- W. Nie, L. Yao, G. Chen, S. Wu, Z. Liao, L. Han and X. Ye, Dalton Trans., 2021, 50, 8446 RSC.
- B. Malysa, A. Meijerink and T. Jüstel, Opt. Mater., 2018, 85, 341 CrossRef CAS.
- H. M. Rietveld, Acta Cryst., 1967, 22, 151–152 CrossRef CAS.
- C. Yuan, R. Li, Y. Liu, L. Zhang, J. Zhang, G. Leniec, P. Sun, Z. Liu, Z. Luo, R. Dong and J. Jiang, Laser Photonics Rev., 2021, 15, 2100 Search PubMed.
- H. Zeng, T. Zhou, L. Wang and R.-J. Xie, Chem. Mater., 2019, 31, 5245–5253 CrossRef CAS.
- C. Lee, Z. Bao, M.-H. Fang, T. Lesniewski, S. Mahlik, M. Grinberg, G. Leniec, S. M. Kaczmarek, M. G. Brik, Y.-T. Tsai, T.-L. Tsai and R.-S. Liu, Inorg. Chem., 2020, 59, 376–385 CrossRef CAS PubMed.
- A. Lempicki, L. Andrews, S. Nettel, B. McCollum and E. Solomon, Phys. Rev. Lett., 1980, 44, 1234–1237 CrossRef CAS.
- U. Fano, Phys. Rev., 1961, 124, 1866–1878 CrossRef CAS.
- Y. Tanabe and S. Sugano, J. Phys. Soc. Jpn., 1954, 9, 5 Search PubMed.
- B. Struve and G. Huber, Appl. Phys. B, 1985, 36, 195 CrossRef.
- C. Cai, S. Liu, F. Zhao, H. Cai, Z. Song and Q. Liu, J. Mater. Chem. C., 2023, 11, 8462–8469 RSC.
- G. Blasse, J. Solid State Chem., 1986, 62, 207–211 CrossRef CAS.
- L. G. Van Uitert, J. Electrochem. Soc., 1967, 114, 1048–1053 CrossRef CAS.
- C.-H. Huang, Y.-C. Chiu, Y.-T. Yeh and T.-M. Chen, ACS Appl. Mater. Interfaces, 2012, 4, 6661–6668 CrossRef CAS PubMed.
- Z. Xia, J. Liu, Q. Li and J. Sun, Electrochem. Solid-State Lett., 2007, 10, J4–J8 CrossRef CAS.
- W. Lv, Y. Jia, Q. Zhao, M. Jiao, B. Shao, W. Lü and H. You, Adv. Opt. Mater., 2014, 2, 183–188 CrossRef.
- X. Zhou, W. Geng, J. Li, Y. Wang, J. Ding and Y. Wang, Adv. Optical Mater., 2020, 8, 1902003 CrossRef CAS.
- K. McCall, C. Stoumpos, S. Kstina, M. Kanatzidis and B. Wessels, Chem. Mater., 2017, 29, 4129 CrossRef CAS.
- J. Luo, X. Wang, S. Li, J. Liu, Y. Guo, G. Niu, L. Yao, Y. Fu, L. Gao, Q. Dong, C. Zhao, M. Leng, F. Ma, W. Liang, L. Wang, S. Jin, J. Han, L. Zhang, J. Etheridge, J. Wang, Y. Yan, E. H. Sargent and J. Tang, Nature, 2018, 563, 541 CrossRef CAS.
- Z. Jia, C. Yuan, R. Li, P. Sun, R. Dong, Y. Liu, L. Wang, H. Jiang and J. Jiang, Phys. Chem. Chem. Phys., 2020, 22, 10343–10350 RSC.
|
| This journal is © The Royal Society of Chemistry 2025 |
Click here to see how this site uses Cookies. View our privacy policy here. 
 *,
Li
Wu
*,
Li
Wu

 ), Mg (CN = 6,
  ), Cr3+ ions prefer to occupy the Mg1 sites. To further confirm the detailed crystallographic information, Rietveld refinement is performed by using the structure of NMLS as the initial model with the TOPAS program.29 The refinement process is implemented according to Cr3+ ions occupying the Mg1 site. As shown in Tables S2 and S3 (ESI†) and Fig. 1c, the smaller cell volume of 1258.37 Å3 and the reliable agreement factors (Rp = 8.21%, Rwp = 10.95%, and GOF = 1.85) support the site preference and the above discussion.
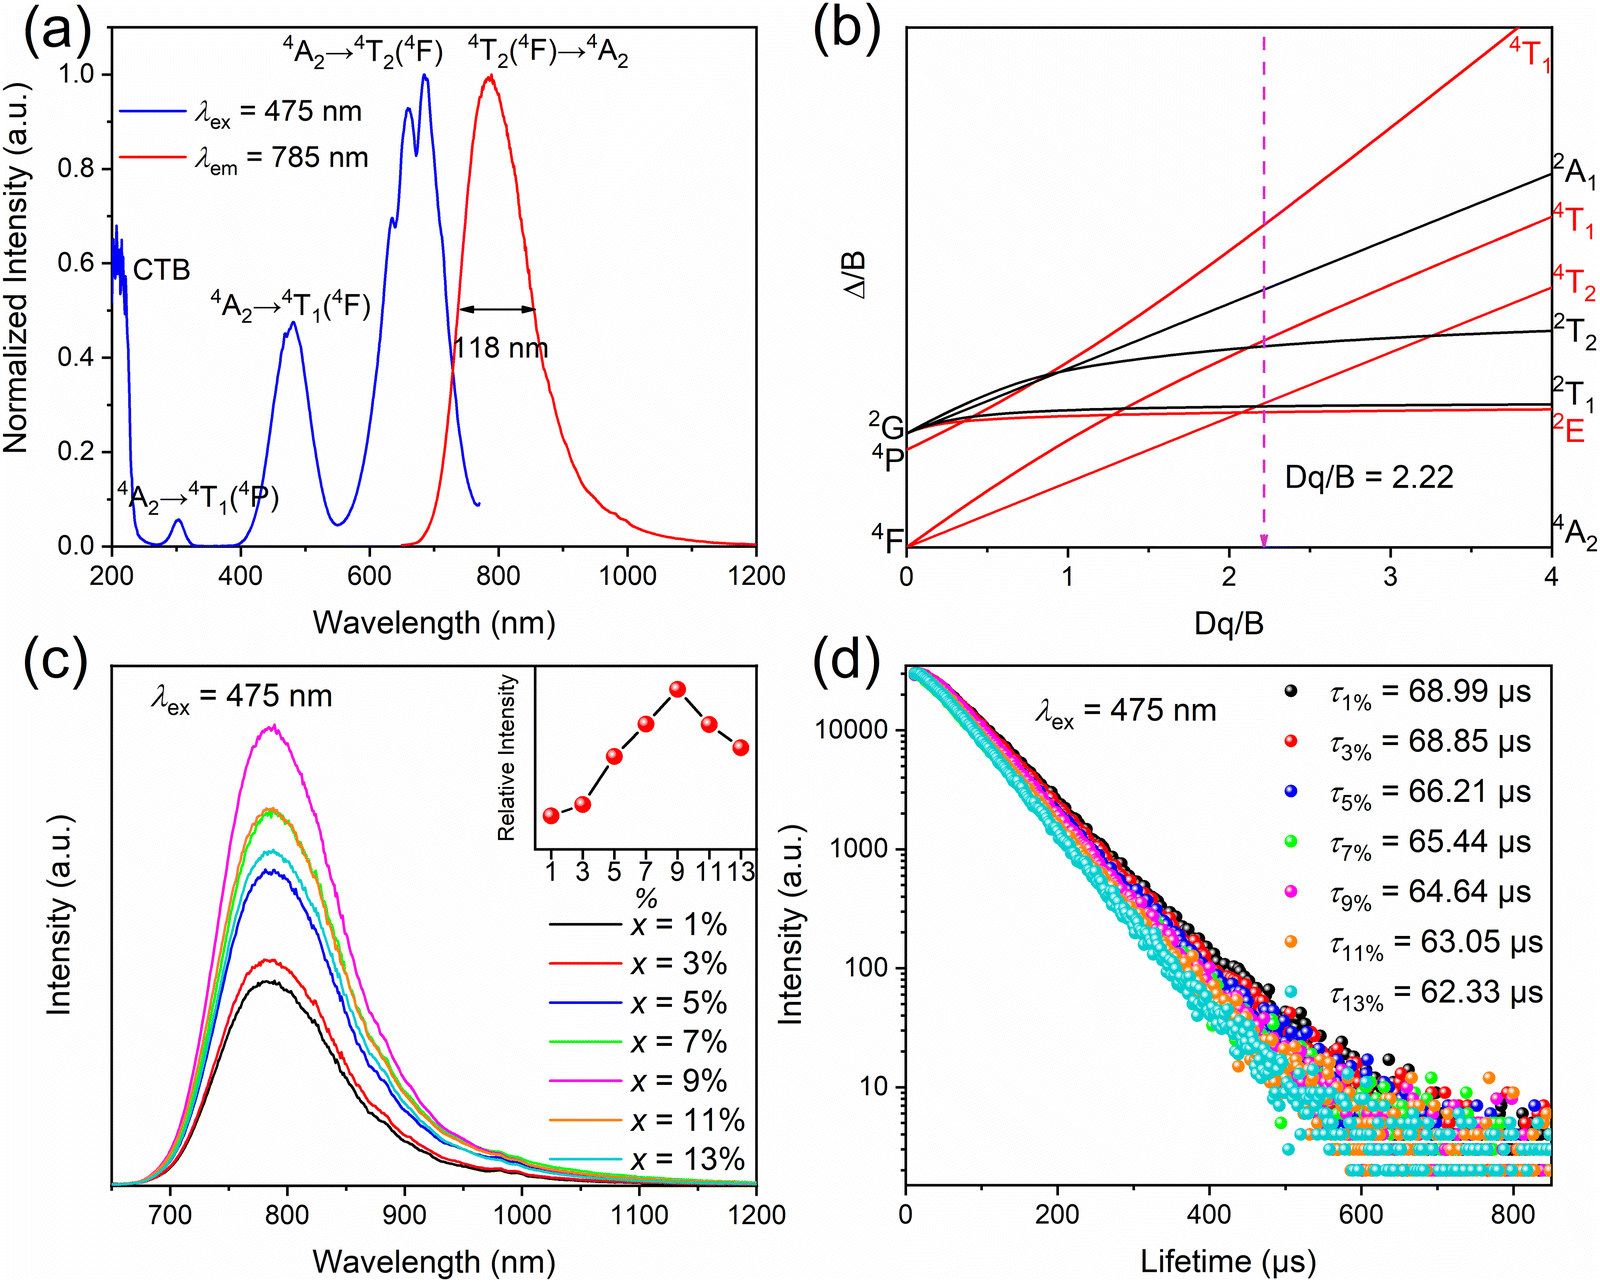


 .
.
 ,
,