Multimode stimulated luminescence of LiNbO3:Pr3+/ZnS:Cu/PDMS flexible films†
Received
14th September 2024
, Accepted 21st October 2024
First published on 23rd October 2024
Abstract
The versatility of emission modes and colors in flexible films is essential for broadening their potential applications. This study presents the development of a multi-mode luminescent flexible film by integrating ZnS:Cu and LiNbO3:Pr3+ powders into a polydimethylsiloxane (PDMS) matrix. The ZnS:Cu and LiNbO3:Pr3+ powders are uniformly distributed in the PDMS matrix. The effect of the LiNbO3:Pr3+ content on the photoluminescence (PL), electroluminescence (EL), mechanoluminescence (ML), thermoluminescence (TL), and photostimulated luminescence (PSL) properties of the films has been investigated. The PL colors of the LiNbO3:Pr3+/ZnS:Cu/PDMS flexible films due to the distinct intrinsic emissions of ZnS:Cu and LiNbO3:Pr3+ can be changed by altering the excitation wavelength. An appropriate content of the LiNbO3:Pr3+ powder introduces PSL into the flexible films, while the films demonstrate excellent EL and ML performance, along with multicolored TL emissions, including red and green. This research offers a novel approach to enhancing flexible electronic displays, EL devices, and optical anti-counterfeiting technologies.
1. Introduction
Luminescent materials have attracted much attention due to their excellent optoelectronic performances.1–7 Among these materials, ZnS:Cu stands out as a particularly important luminescent compound, garnering significant attention for its photoluminescence (PL), electroluminescence (EL), mechanoluminescence (ML), and thermoluminescence (TL) properties. ZnS:Cu is frequently combined with polydimethylsiloxane (PDMS) to further investigate its unique luminescent behaviors.8–17 However, the luminescent color of ZnS:Cu is notoriously difficult to modify. While the PL color can be slightly altered by varying the concentration of Cu2+ dopants, it remains predominantly within the blue-green spectrum.18 Similarly, the EL, ML, and TL emissions of ZnS:Cu are typically confined to blue or green hues.19–23 This limitation in tunability poses challenges for its broader application, as the ability to control luminescent colors is critical for the diverse uses of luminescent materials. Recent investigations have shown that integrating with different luminescent particles can endow flexible films with complex emission modes or better performances. For instance, researchers have successfully achieved color-tunable and multimodal emission in the flexible films by integrating ZnS:Cu and ferroelectric materials Er3+/Pr3+ co-doped Ca2Nb2O7 into PDMS.24 A lower operating voltage as well as higher brightness have been achieved in the ZnS:Cu/PDMS flexible EL devices by introducing the La-doped barium titanate nanocuboids into the film.25 It is found that the piezoelectric properties of ferroelectric polyvinylidene fluoride (PVDF)-based polymers can enhance the ML performances of ZnS:Mn.26 However, the effect of ferroelectric materials on the PL, EL, ML, and TL properties of the ZnS:Cu/PDMS film has not been investigated.
Herein, the present investigation aims to explore how the ferroelectric materials LiNbO3:Pr3+ enrich the luminescent properties of ZnS:Cu/PDMS films. Previous research has demonstrated that LiNbO3:Pr3+ ceramics exhibit excellent red TL and PL performance, along with notable ML under UV irradiation and mechanical stress.27 By preparing flexible PDMS films that incorporate both LiNbO3:Pr3+ and ZnS:Cu, we seek to combine their optical properties to achieve tunable luminescence, including photostimulated luminescence (PSL) and multicolor TL.28 Additionally, we will investigate how the LiNbO3:Pr3+ powder influences the PL, EL and ML properties of the flexible films.
2. Experimental section
2.1. Preparation process
LiNbO3:xPr3+ (x = 0.004, 0.008, 0.01, 0.012, and 0.016) with different Pr3+ contents were prepared to investigate the effect of the Pr3+ content on their luminescence performances. LiNbO3:xPr3+ powders were prepared via a high temperature solid-state reaction method. First, raw materials Li2CO3 (99.99%), Nb2O5 (99.9%), and Pr2O3 (99.9%) (Shanghai Aladdin Bio-Chem Technology Co., Ltd) were weighed to synthesize the LiNbO3:xPr3+ powders. Then, they were ball milled using ethanol as a milling medium for 12 h. Afterwards, the dried materials were crushed and sieved with 80 mesh sieves. In the end, the prepared powders were calcined to form a LiNbO3:xPr3+ compound at 1050 °C for 8 h in air.27 Subsequently, the LiNbO3:xPr3+ compound was ball milled using ethanol as a milling medium for 12 h and the dried LiNbO3:xPr3+ compound was sieved with 80 mesh sieves to obtain LiNbO3:xPr3+ powders. ZnS:Cu (Shanghai Keyan Optoelectronic Technology Co., Ltd, with a particle size of ∼40 μm) and PDMS (Sylgard® 184 organosilicon elastomer, prepolymer and curing agent mixed in a 9![[thin space (1/6-em)]](https://www.rsc.org/images/entities/char_2009.gif) :1 weight ratio) were weighed in proportion and mixed, then added with an appropriate amount of LiNbO3:xPr3+. Subsequently, a vacuum pumping operation was performed after stirring for 15 minutes. The obtained solution was scraped onto a glass plate, and cured at 80 °C for 10 minutes. In the end, the LiNbO3:Pr3+/ZnS:Cu/PDMS flexible film was obtained. The thickness of the prepared flexible film was about 200 μm. The preparation procedure is shown in Fig. 1.
:1 weight ratio) were weighed in proportion and mixed, then added with an appropriate amount of LiNbO3:xPr3+. Subsequently, a vacuum pumping operation was performed after stirring for 15 minutes. The obtained solution was scraped onto a glass plate, and cured at 80 °C for 10 minutes. In the end, the LiNbO3:Pr3+/ZnS:Cu/PDMS flexible film was obtained. The thickness of the prepared flexible film was about 200 μm. The preparation procedure is shown in Fig. 1.
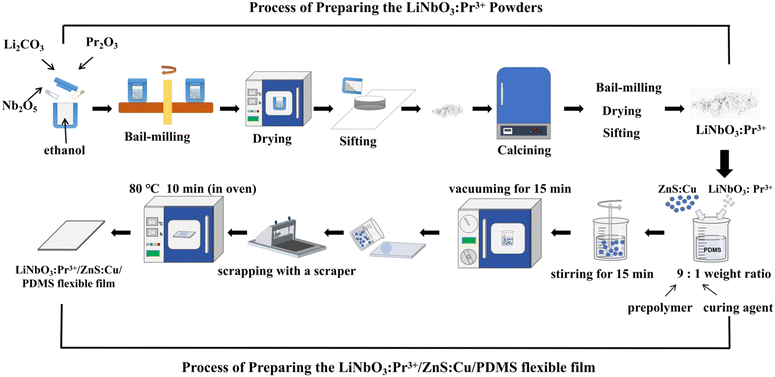 |
| | Fig. 1 The preparation process of the LiNbO3:xPr3+ powders and the LiNbO3:Pr3+/ZnS:Cu/PDMS flexible film. | |
2.2. Characterization
The phase structure of LiNbO3:xPr3+ was analyzed using a powder X-ray diffraction (XRD) analyzer with Cu-Kα radiation (D8 Advance, Bruker, Germany). The microstructure of LiNbO3:xPr3+ and the element distribution of the flexible film were analyzed by scanning electron microscopy (SEM, Hitachi SUS-700). The PL excitation and emission spectra were recorded using a fluorescence spectrometer (FS5, Edinburgh Instrument, United Kingdom). The TL curves were recorded using an Ocean Optics USB4000 CCD spectrometer after irradiating with 365 nm UV light for 5 minutes. The 980 nm diode laser was applied as an excitation source for obtaining the PSL emission spectra. The EL spectra were recorded using an Ocean Optics USB4000 CCD spectrometer. The ML spectra were recorded using a flexible electronic tester (Prtronic, FT2000) and an Ocean Optics QE65 PRO CCD spectrometer. The PL/EL/ML/TL photographs were directly recorded using an iPhone14 pro phone.
3. Results and discussion
3.1. XRD pattern, SEM structure, and the PL and TL properties of LiNbO3:xPr3+
The XRD patterns of LiNbO3:xPr3+ are shown in Fig. 2(a). As shown in Fig. 2(a), it can be clearly seen that all samples have good crystallinity and no impurity phases are identified. When x ≤ 0.01, the (012) peak shifts towards a small angle with x. While x ≥ 0.01, this peak shifts towards a large angle. Such results indicate that the doping sites of Pr3+ in LiNbO3 depend on the doping content of Pr3+. To gain a deep understanding of the morphology, SEM was carried out. The SEM morphology of the representative composition LiNbO3:0.01Pr3+ is shown in Fig. 2(b). The average size of LiNbO3:0.01Pr3+ particles is approximately 5 μm calculated using nano measurer 1.2. Furthermore, the grain size is uneven and the grain shape is irregular. This is ascribed to the random fracture of the particles during ball milling. As shown in Fig. 2(c), the PL spectrum of LiNbO3:0.01Pr3+ was examined at room temperature. Under excitation with 261 nm light, LiNbO3:0.01Pr3+ exhibits the characteristic emission band of Pr3+ with a maximum at 618 nm. This dominant red emission is attributed to the 1D2 → 3H4 transition of Pr3+.29,30Fig. 2(d) illustrates the PL excitation spectrum of LiNbO3:0.01Pr3+ obtained at 618 nm. Two broad bands centered at 261 and 345 nm between 440 and 510 nm are observed in the excitation spectrum besides the characteristic peaks of Pr3+. The sharp excitation peaks centered at 463, 487, and 504 nm are the characteristic peaks of Pr3+ ions, and these peaks are related to the 3H4 → 3P2, 3H4 → 3P1 and 3H4 → 3P0 4f–4f transitions of Pr3+, respectively.28,31 Herein, the broad excitation band in 300–400 nm can be assigned to the intervalence charge transfer (IVCT).32,33 This means that 300–400 nm excitation through IVCT produces Pr3+–O–Nb5+ → Pr4+–O–Nb4+ transition. The strongest excitation peak centered at 261 nm is ascribed to the Nb5+–O2− → Nb4+–O− transition, in which electrons from the O-2p valence band are excited into the Nb-4d conduction band.34 In addition, Fig. 2(e) shows the PL emission spectra of LiNbO3:xPr3+ at room temperature under 504 nm excitation and the emission light reaches the maximum value at x = 0.008. The TL spectra of LiNbO3:xPr3+ powders were also measured. The samples were set on a thermal plate of 200 °C during measuring after irradiation with 365 nm ultraviolet light for 5 minutes. All the compositions show strong red emission (Fig. 2(f)). The TL intensity is the strongest at x = 0.01. In LiNbO3:Pr3+, Pr3+ is substituted into the Li+ site.35 Accordingly, the trap levels are created in the forbidden band. After the irradiation of 365 nm UV light, the excited electrons would be trapped by  . Under thermal stimulus, the captured electrons can be transferred to the charge transfer state (CTS) through the conduction band and then relaxed to 1D2. The captured electrons can also be directly relaxed to the excited level 1D2 as a result of the tunneling effect.36 Finally, the de-excitation from 1D2 to 3H4 levels produces a pure red emission (Fig. S1, ESI†). Considering both excellent PL and obvious TL of composition LiNbO3:0.01Pr3+, this composition is selected as the component for device applications.
 |
| | Fig. 2 (a) The XRD patterns of LiNbO3:xPr3+, (b) the SEM morphology of LiNbO3:0.01Pr3+, (c) emission spectra of LiNbO3:0.01Pr3+ monitored at 261 nm, (d) PLE spectrum monitored at 618 nm excitation, (e) PL properties of the LiNbO3:xPr3+, and (f) TL spectra. | |
3.2. SEM structure of the LiNbO3:0.01Pr3+/ZnS:Cu/PDMS flexible film
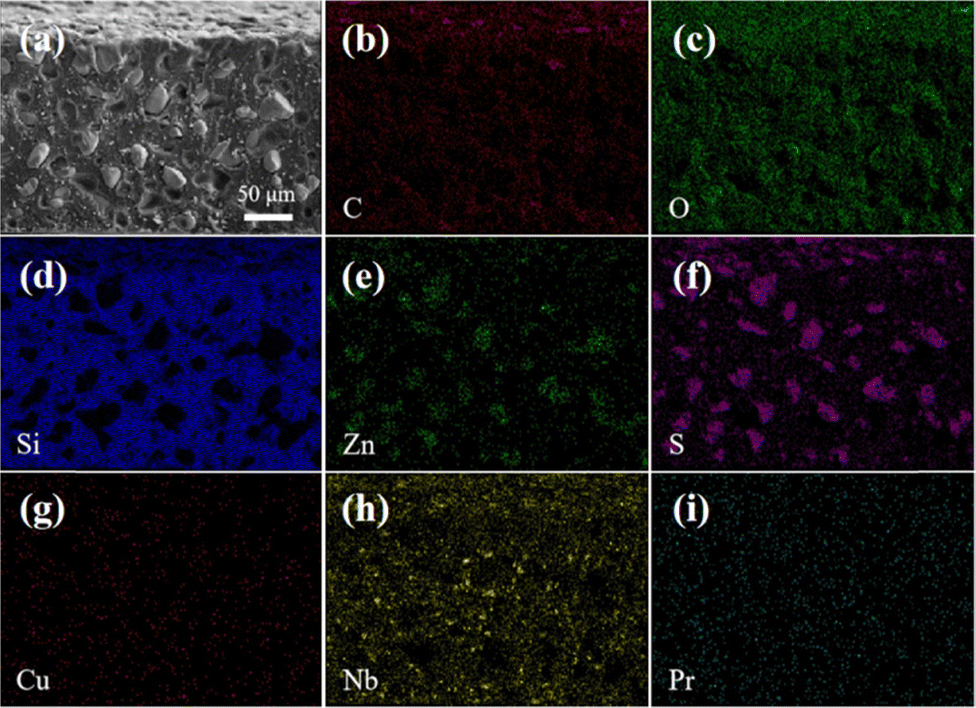
Flexible films with different LiNbO3:0.01Pr3+ contents were prepared. The mass ratio of ZnS:Cu phosphors and LiNbO3:0.01Pr3+ powders to PDMS was set to 1.5:1, and the weight ratio between LiNbO3:0.01Pr3+ and ZnS:Cu was 0%, 10%, 20%, and 30%. To investigate the distribution of the ZnS:Cu phosphors and LiNbO3:0.01Pr3+ in PDMS for the as prepared films, the fracture surface and the element distribution of the flexible films for the representative composition of LiNbO3:0.01Pr3+ at 30% were studied using SEM, as shown in Fig. 3(a)–(i). It can be seen that C and Si are the constituent elements of PDMS, which encapsulate ZnS:Cu and LiNbO3:xPr3+ particles. Zn and S are the constituent elements of ZnS:Cu. Therefore the larger particles are ZnS:Cu, with an average particle diameter of ∼40 μm. Nb is a constituent element of LiNbO3:xPr3+, and the small particles in the cross-section are LiNbO3:0.01Pr3+. It can be seen that ZnS:Cu and LiNbO3:0.01Pr3+ particles are uniformly encapsulated in PDMS, which helps in the transfer of force and further improves the output performance.14 Due to the high curing temperature and short curing time, the deposition of ZnS:Cu and LiNbO3:0.01Pr3+ particles at the bottom of the flexible film was greatly reduced.
 |
| | Fig. 3 (a)–(i) Element mapping analysis of the LiNbO3:0.01Pr3+/ZnS:Cu/PDMS flexible film. | |
3.3. Properties of PL and PSL
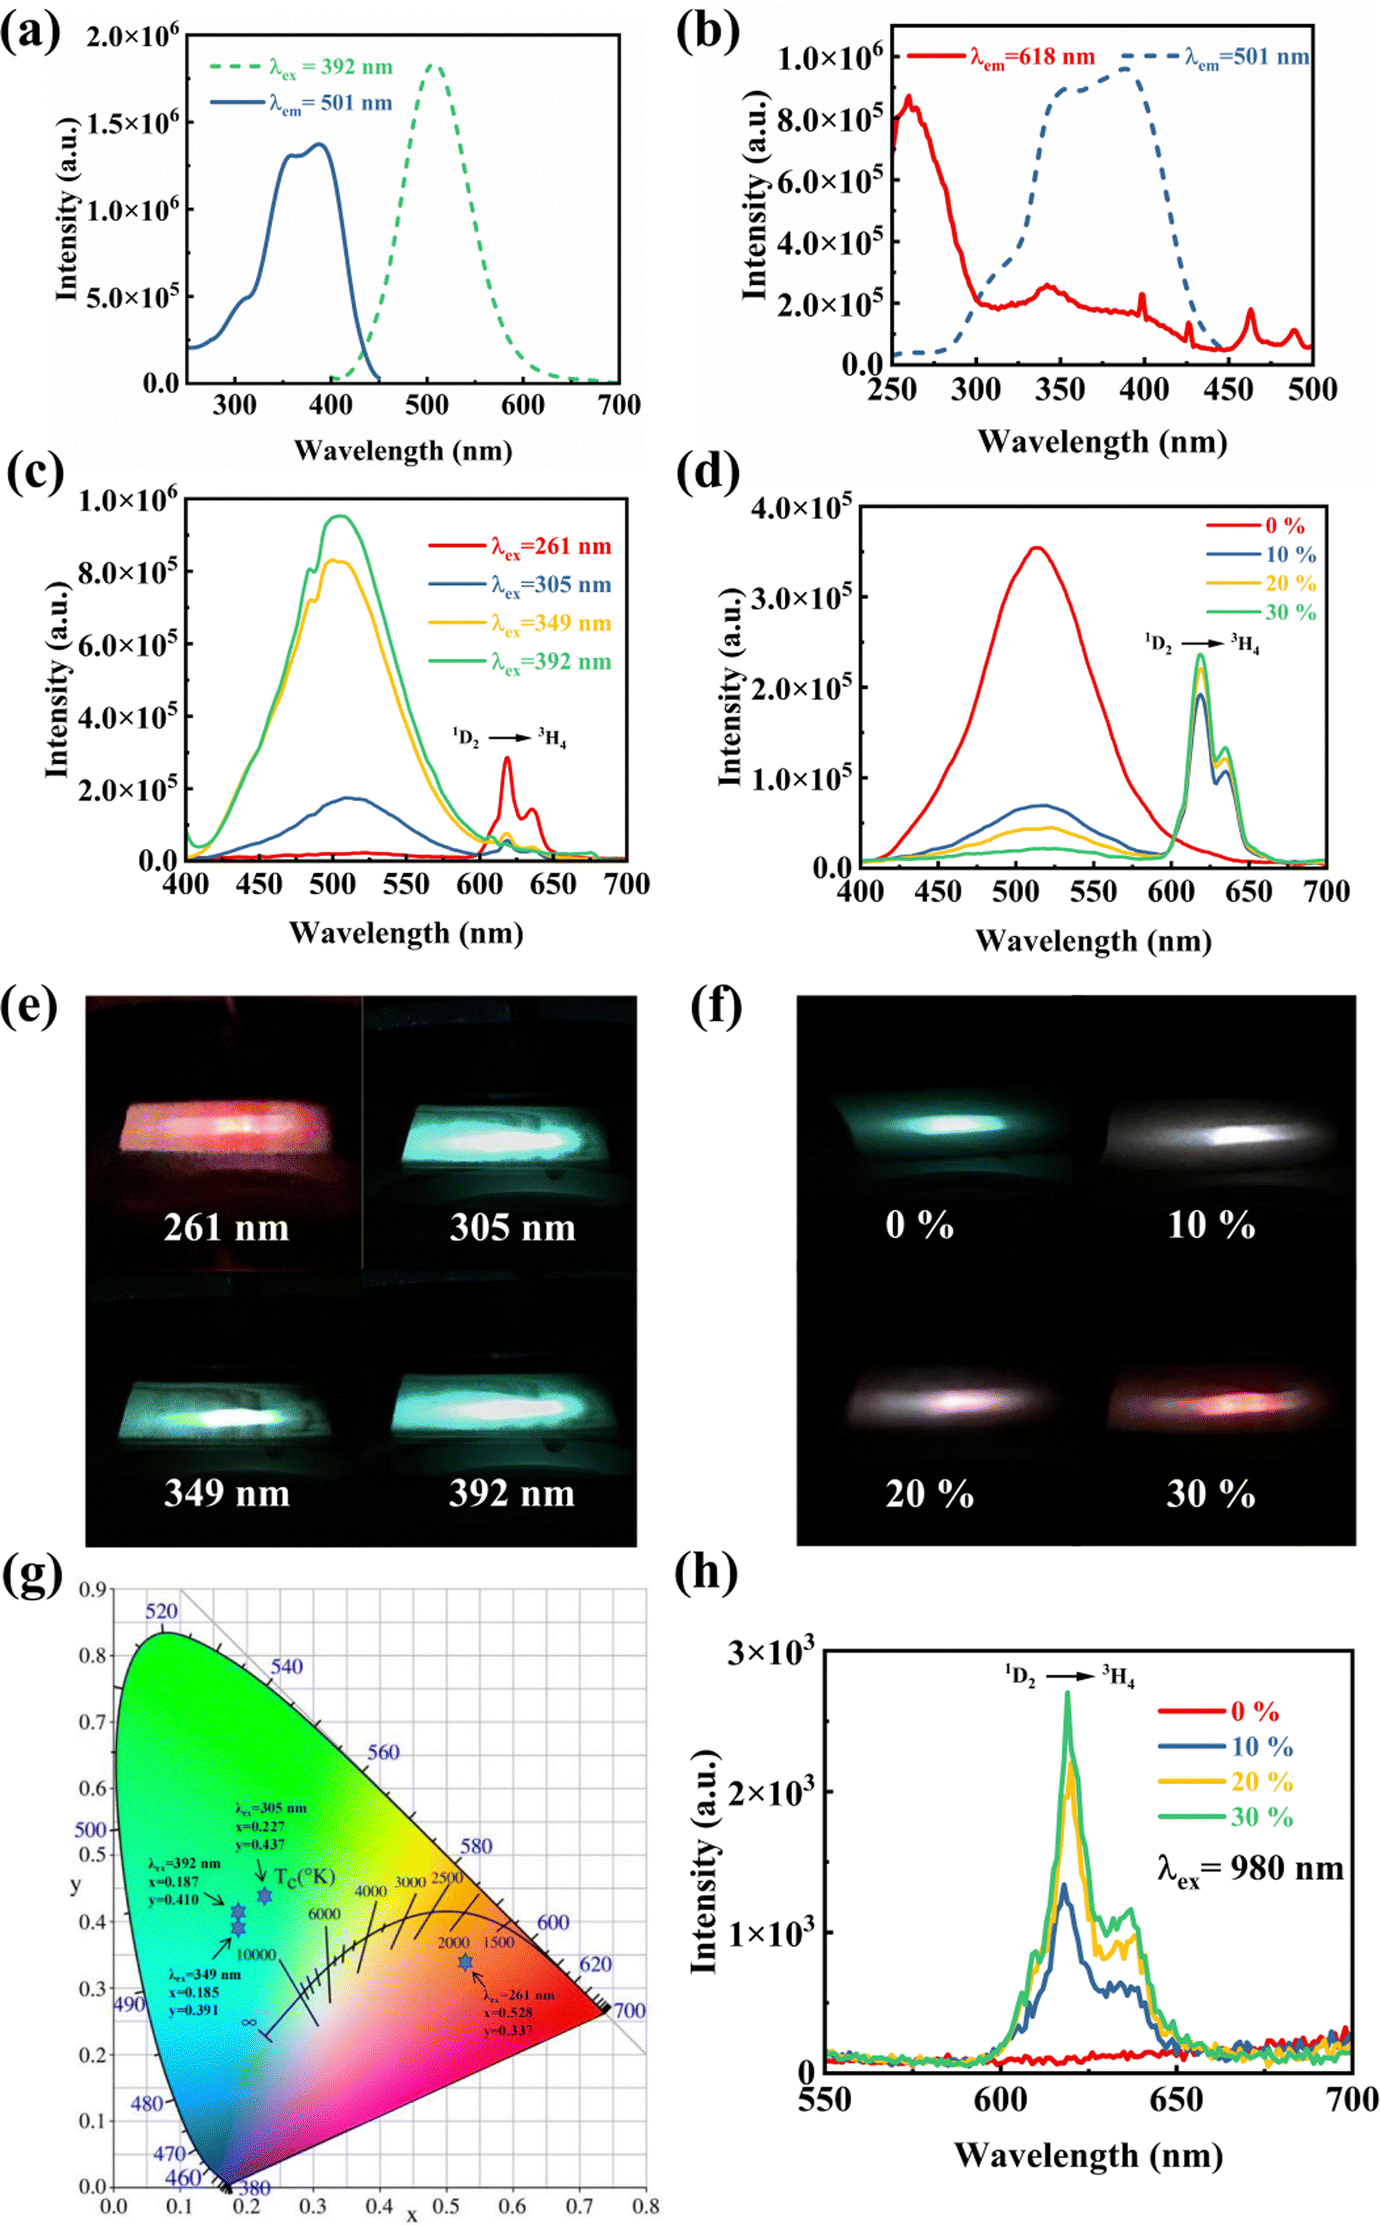
The PL emission and PL excitation spectra of ZnS:Cu at room temperature were obtained, as shown in Fig. 4(a). Under excitation with 392 nm light, ZnS:Cu powder shows green luminescence. The ZnS:Cu powder has a strong excitation band between 300–400 nm when monitored at 501 nm. Fig. 4(b) shows the PL excitation spectra of flexible films with a ratio of 30% between LiNbO3:0.01Pr3+ and ZnS:Cu monitored at 501 and 618 nm. The PL excitation spectra are the typical PL excitation ones for ZnS:Cu and LiNbO3:xPr3+ when monitored at 501 and 618 nm, respectively. And there is a strong overlap between the two spectra between 275–450 nm. Therefore, the flexible film produces different luminescent colors at different excitation wavelengths. Taking the flexible film with a ratio of 30% between LiNbO3:0.01Pr3+ and ZnS:Cu as an example, the luminescent color of the same flexible film can be adjusted via altering the excitation wavelength. Fig. 4(c) shows the emission spectra when the films are excited under 261, 305, 349 and 392 nm. When the excitation wavelength is 261 nm, the flexible film shows red luminescence. When the excitation wavelength is altered to 305, 349 and 392 nm, the green luminescence of the flexible film is much stronger than the red luminescence. Fig. 4(e) shows the color change of the flexible film under different excitation wavelengths. The color varies greatly with excitation wavelengths. Through the chromaticity diagram, it can be visually seen that the flexible film can produce different colors at different excitation wavelengths (Fig. 4(g)). As shown in Fig. 4(d), with the increased content of LiNbO3:0.01Pr3+, the red emission becomes stronger when excited at 261 nm. As expected, the red emission is strongest when the mass content of LiNbO3:0.01Pr3+ is 30%. From Fig. 4(f), it can be clearly seen that the luminescent color of the flexible film gradually changes from green to red. With the increasing content of LiNbO3:0.01Pr3+, the luminescent color of the flexible film varies from cold to warm (Fig. S2, ESI†). Moreover, it is well known that the Pr3+ ions have not visible light when exited with 980 nm laser. However, after 261 nm light irradiation for 5 min, a strong red is observed when stimulated with a 980 nm laser, as shown in Fig. 4(h). Furthermore, the emission intensity increases with the increase of the LiNbO3:0.01Pr3+ content. This film added with LiNbO3:0.01Pr3+ has facilitated real-time visual reading of optical information, demonstrating its potential in encrypted display and optical anti-counterfeiting applications.37–40
 |
| | Fig. 4 (a) Emission and excitation spectra of ZnS:Cu, (b) excitation spectra of the LiNbO3:0.01Pr3+/ZnS:Cu/PDMS flexible film, (c) emission spectra of the flexible film under different excitation wavelengths, (d) emission spectra of flexible films with different contents of LiNbO3:0.01Pr3+, (e) the color change of the flexible film under different excitation wavelengths, (f) the color change of the flexible film with different contents of LiNbO3:0.01Pr3+, (g) CIE coordinates (x, y) calculated from the emission spectra, and (h) PSL spectra of the LiNbO3:0.01Pr3+/ZnS:Cu/PDMS flexible film. | |
3.4. EL properties
ZnS:Cu is a kind of luminescent particle with excellent EL properties. The EL of the flexible film is from the ZnS:Cu particles rather than LiNbO3:Pr3+. To measure the EL of the flexible film, conductive copper foil tape was applied as one electrode of the LiNbO3:0.01Pr3+/ZnS:Cu/PDMS flexible film and let out with a wire, and an ITO transparent conductive film was utilized as another electrode. The EL photograph of the device driven at a frequency of 15 kHz is shown in Fig. 5(a). The size of the flexible film sample prepared was 6 × 6 cm, and the EL sample was cut from it, and the samples for other luminescence mode test were also cut according to the needs. The EL device shows a strong blue emission. However, at low frequency, the EL color of ZnS:Cu is green.10,22,41 The EL device shows a green emission at a frequency of 50 Hz (Fig. S3, ESI†). The frequency dependent color change is attributed to the presence of two different types of shallow and deep traps, where deeper traps have a longer lifetime than the shallower ones. For the low frequency with weak electron/hole injection, mainly shallow traps are occupied, leading to the green emission. With the increasing frequency, the deeper traps responsible for the blue emission become filled and begin to saturate, while the shallower trap states become depopulated, leading to the high-energy blue emission.25,42 As shown in Fig. 5(b), keeping the input voltage at 170 V and altering the input frequency with an interval of 5 kHz within the range of 5–30 kHz, the EL intensity of the EL device first increases and then decreases, and finally tends to reach a plateau. It can be seen that the EL intensity is the strongest at 15 kHz. Therefore, 15 kHz input frequency is used to obtain the optimal EL intensity for the following test. As shown in Fig. 5(c), maintaining the input frequency constant and altering the input voltage (U = 150 V, 160 V, and 170 V), the EL intensity of the EL device increases as the voltage increases. As shown in Fig. 5(d), it can be observed that the EL intensity increases with the increase of the ZnS:Cu content (ZnS:Cu:PDMS mass ratio: 1:1, 1.5:1, and 2:1). The effect of the LiNbO3:0.01Pr3+ content (the mass ratios between LiNbO3:0.01Pr3+ and ZnS:Cu are 0%, 10%, 20%, and 30%) on the EL of EL device is investigated. Maintaining the content of phosphors constant (the mass ratio of ZnS:Cu and LiNbO3:0.01Pr3+ to PDMS is 1.5:1) during the fabrication of the EL devices, the EL intensity decreases with the increase of the LiNbO3:0.01Pr3+ content (Fig. 5(e)). We speculate that it may be due to the LiNbO3:Pr3+ powder blocking the emission of light from the EL device due to the enhanced light scattering. Finally, the effect of the LiNbO3:0.01Pr3+ content on the threshold voltage of the EL device is investigated. The threshold voltage is mainly related to the frequency and the thickness of the flexible film. The increase in frequency directly leads to an increase in the probability of excited luminescence by overheated electrons, thereby gradually lowering the luminescence threshold. In addition, the thickness of the flexible film also affects the threshold voltage, and the thicker the film, the higher the threshold voltage. As shown in Fig. 5(f), when the voltage amplitude is less than 170 V, the EL intensity gradually increases with the increase of voltage for the four EL devices. When the voltage amplitude is greater than 170 V, the intensity increases rapidly with the increase of voltage. Hence it can be considered that 170 V is the threshold voltage of the EL devices. The results show that the LiNbO3:0.01Pr3+ content has almost no effect on the threshold voltage.
 |
| | Fig. 5 (a) Photographic image of the EL device under high-frequency voltage, (b) EL intensity under different input frequencies at 170 V, (c) luminescence spectra of the EL device under different voltages, (d) luminescence spectra of the devices with different ZnS:Cu contents, (e) luminescence spectra of the devices with different LiNbO3:0.01Pr3+ contents, and (f) the variation of threshold voltage with the LiNbO3:0.01Pr3+ content. | |
3.5. ML properties and TL properties of the LiNbO3:0.01Pr3+/ZnS:Cu/PDMS flexible film
In order to test the ML performance of flexible films, four types of flexible films with different LiNbO3:0.01Pr3+ contents were prepared. The investigation on the ML performance of flexible films was conducted. Fig. 6(a) shows the photograph of the ML generated by stretching the flexible film. The flexible film produces a significant green glow when stretched by hand. During plastic deformation, the electric field of the charged dislocations causes band bending of the ZnS:Cu particles. Next, the electrons trapped in the shallow donor level tunnel to the conduction band. Generally, it has been reported that ZnS:Cu does not show ML during elastic deformation because the local piezoelectrification near the Cu centers may not be sufficient to cause the detrapping of electrons from the filled electron traps. When these electrons located in the conduction band recombine with the hole trapped by the t2 state of Cu, green emission is dominant under a low mechanical stress rate.14,43,44 In addition, the effect of the LiNbO3:0.01Pr3+ content on the ML of flexible films is investigated. As expected, the ML intensity decreases with the LiNbO3:0.01Pr3+ content (Fig. 6(b)). The LiNbO3:0.01Pr3+/ZnS:Cu/PDMS flexible film, as a flexible material, may exhibit luminescent properties under stress or deformation, suggesting its potential applications for flexible sensors, deformation monitoring, and strain sensors. Since both LiNbO3:xPr3+ and ZnS:Cu have strong TL, the LiNbO3:0.01Pr3+/ZnS:Cu/PDMS film is expected to show TL properties. Herein, the LiNbO3:0.01Pr3+/PDMS flexible film was prepared, where the mass ratio of LiNbO3:0.01Pr3+ to PDMS is 0.45:1. The results indicate that after being irradiated under 365 nm ultraviolet light for 5 minutes, the TL color of the LiNbO3:0.01Pr3+/PDMS film is red (Fig. S4a, ESI†). While the TL color of ZnS:Cu is green.21 The LiNbO3:0.01Pr3+/ZnS:Cu/PDMS flexible film was also prepared, where the mass ratio of ZnS:Cu to PDMS is 1.5:1, and the mass ratio of LiNbO3:0.01Pr3+ to ZnS:Cu is 30%. After being irradiated under 365 nm ultraviolet light for 5 minutes, the flexible film shows a bright red and green mixed TL (Fig. S4b and Video S1, ESI†). The experimental results indicate that the addition of LiNbO3:Pr3+ enriches the TL color of the flexible film. The flexible films show excellent light/thermal dual stimulus response performances, demonstrating their application prospects in the field of flexible optical memory devices.24
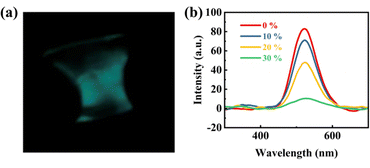 |
| | Fig. 6 (a) ML photograph of flexible films (screenshot obtained from the video) and (b) ML of the films with different LiNbO3:0.01Pr3+ contents. | |
4. Conclusions
In conclusion, we have prepared a flexible film with multi-mode stimulated luminescence that simultaneously exhibits multi color PL, PSL, EL, ML, and TL. Tunable PL has been achieved by adjusting the excitation wavelength to change the color of the emitted light from the flexible film. The introduction of LiNbO3:Pr3+ also endows the flexible film with PSL performances by the 980 nm light stimulation. However, the addition of LiNbO3:Pr3+ has an inhibitory effect on the EL and ML of flexible films. For EL, LiNbO3:Pr3+ only affects the EL intensity of the EL device, and does not affect the threshold voltage. It may be because of the enhanced light scattering due to the introduction of LiNbO3:Pr3+ particles. After adding LiNbO3:Pr3+, the LiNbO3:Pr3+/ZnS:Cu/PDMS flexible film exhibits multiple TL colors, enriching the luminescence display of the flexible film. This study provides a new path for improving flexible electronic displays, EL devices, and optical anti-counterfeiting.
Author contributions
Laihui Luo and Hai Jiang conceived the idea and supervised the project. Laihui Luo, Lidong Wang and Xueting Fu prepared the manuscript and developed the figures. Peng Du and Lidong Wang significantly contributed to the technical discussions and edited the manuscript. All the authors actively participated in discussions and collaboratively contributed to the manuscript development.
Data availability
All data generated or analysed during this study are included in this published article and its ESI.†
Conflicts of interest
There are no conflicts to declare.
Acknowledgements
This investigation was supported by the National Natural Science Foundation of China (12374087), the Natural Science Foundation of Ningbo (2021J063) and the Science and Technology Innovation 2025 Major Project of Ningbo City (2022Z211).
Notes and references
- Z. Huang, B. Chen, B. Ren, D. Tu, Z. Wang, C. Wang, Y. Zheng, X. Li, D. Wang, Z. Ren, S. Qu, Z. Chen, C. Xu, Y. Fu and D. Peng, Adv. Sci., 2023, 10, e2204925 CrossRef.
- R. N. Bhargava, D. Gallagher, X. Hong and A. Nurmikko, Phys. Rev. Lett., 1994, 72, 416–419 CrossRef CAS PubMed.
- W. Chen, J. O. Malm, V. Zwiller, Y. N. Huang, S. M. Liu, R. Wallenberg, J. O. Bovin and L. Samuelson, Phys. Rev. B: Condens. Matter Mater. Phys., 2000, 61, 11021–11024 CrossRef CAS.
- Z. Wang, S. Zhao, Y. Wang, F. Wang, A. A. Ansari and R. Lv, Anal. Bioanal. Chem., 2024, 416, 3975–3984 CrossRef CAS.
- Y. Bai, F. Wang, L. Zhang, D. Wang, Y. Liang, S. Yang and Z. Wang, Nano Energy, 2022, 96, 107075 CrossRef CAS.
- J. A. Li, J. Zhou, Z. Mao, Z. Xie, Z. Yang, B. Xu, C. Liu, X. Chen, D. Ren, H. Pan, G. Shi, Y. Zhang and Z. Chi, Angew. Chem., Int. Ed., 2018, 57, 6449–6453 CrossRef CAS PubMed.
- D. Liang, H. Xiao, W. Cai, S. Lu, S. Zhao, Z. Zang and L. Xie, Adv. Opt. Mater., 2023, 11, 2202997 CrossRef CAS.
- K. B. Lin and Y. H. Su, Appl. Phys. B, 2013, 113, 351–359 CrossRef CAS.
- S. Muthukumaran and M. Ashok kumar, Mater. Lett., 2013, 93, 223–225 CrossRef CAS.
- S. Song, H. Shim, S. K. Lim and S. M. Jeong, Sci. Rep., 2018, 8, 3331 CrossRef PubMed.
- J. Wang and P. S. Lee, Nanophotonics, 2017, 6, 435–451 Search PubMed.
- J. Kaur, V. Dubey, N. S. Suryanarayana, N. Kumar Swamy, S. V. N. Pammi and P. V. Ramakrishna, Res. Chem. Intermed., 2012, 39, 3895–3900 CrossRef.
- X. Qian, Z. Cai, M. Su, F. Li, W. Fang, Y. Li, X. Zhou, Q. Li, X. Feng, W. Li, X. Hu, X. Wang, C. Pan and Y. Song, Adv. Mater., 2018, 30, e1800291 CrossRef.
- S. Moon Jeong, S. Song, S.-K. Lee and B. Choi, Appl. Phys. Lett., 2013, 102, 051110 CrossRef.
- J. Yin, X. Huo, X. Cao, R. Li, Y. Zhou, T. Jiang, L. Wang, Z. Wu and Z. L. Wang, ACS Mater. Lett., 2022, 5, 11–18 CrossRef.
- J. Cui, J. Yu, C. Liu, Y. Bu and X. Wang, J. Mater. Sci.: Mater. Electron., 2022, 33, 24794–24802 CrossRef CAS.
- M. A. Listyawan, H. Song, G.-T. Hwang, H.-C. Song and J. Ryu, J. Alloys Compd., 2022, 923, 166250 CrossRef CAS.
- W. Q. Peng, G. W. Cong, S. C. Qu and Z. G. Wang, Opt. Mater., 2006, 29, 313–317 CrossRef CAS.
- J. Wang, C. Yan, K. J. Chee and P. S. Lee, Adv. Mater., 2015, 27, 2876–2882 CrossRef CAS.
- K.-S. Sohn, S. Timilsina, S. P. Singh, T. Choi and J. S. Kim, APL Mater., 2016, 4, 106102 CrossRef.
- A. N. Yazici, M. Öztaş and M. Bedir, Opt. Mater., 2007, 29, 1091–1096 CrossRef CAS.
- Y. Zuo, X. Shi, X. Zhou, X. Xu, J. Wang, P. Chen, X. Sun and H. Peng, Adv. Funct. Mater., 2020, 30, 2005200 CrossRef CAS.
- T. Gahlmann, T. Tschorn, T. Maschwitz, L. Gomell, T. Haeger, G. Grotsch, R. Heiderhoff and T. Riedl, ACS Appl. Mater. Interfaces, 2021, 13, 28514–28520 CrossRef CAS PubMed.
- Z. Lu, J. Tang, P. Du, W. Li, Z. Liu, J. Wang and L. Luo, Ceram. Int., 2021, 47, 8248–8255 CrossRef CAS.
- R. Shanker, S. Cho, A. Choe, M. P. Kim and H. Ko, Adv. Funct. Mater., 2019, 29, 1904377 CrossRef.
- Z. Wang, Y. Tai, Z. Ye, J. Nam and Y. Yin, Adv. Funct. Mater., 2024, 2410358 CrossRef.
- D. Tu, C. N. Xu, A. Yoshida, M. Fujihala, J. Hirotsu and X. G. Zheng, Adv. Mater., 2017, 29, 1606914 CrossRef PubMed.
- Z. Lu, L. Luo, P. Du and W. Li, J. Am. Ceram. Soc., 2020, 103, 3748–3756 CrossRef CAS.
- P. Boutinaud, L. Sarakha and R. Mahiou, J. Phys. Condens. Matter Inst. Phys. J., 2009, 21, 025901 CrossRef CAS.
- A. Lorenzo, L. E. Bausá and J. G. Solé, Phys. Rev. B: Condens. Matter Mater. Phys., 1995, 51, 16643 CrossRef CAS.
- H. Sun, Q. Zhang, X. Wang and C. Bulin, J. Am. Ceram. Soc., 2015, 98, 601–606 CrossRef CAS.
- P. Boutinaud, E. Cavalli and M. Bettinelli, J. Phys.: Condens. Matter, 2007, 19, 386230 CrossRef.
- P. Boutinaud, P. Putaj, R. Mahiou, E. Cavalli, A. Speghini and M. Bettinelli, Spectrosc. Lett., 2007, 40, 209–220 CrossRef CAS.
- P. Dorenbos, Opt. Mater., 2017, 69, 8–22 CrossRef CAS.
- A. Lorenzo, H. Jaffrezic, B. Roux, G. Boulon and J. García-Solé, Appl. Phys. Lett., 1995, 67, 3735–3737 CrossRef CAS.
- K. Van den Eeckhout, P. F. Smet and D. Poelman, Materials, 2010, 3, 2536–2566 CrossRef CAS.
- K. Jiang, L. Zhang, J. Lu, C. Xu, C. Cai and H. Lin, Angew. Chem., 2016, 128, 7347–7351 CrossRef.
- M. You, J. Zhong, Y. Hong, Z. Duan, M. Lin and F. Xu, Nanoscale, 2015, 7, 4423–4431 RSC.
- V. K. Singh, R. K. Chitumalla, S. K. Ravi, Y. Zhang and S. C. Tan, ACS Appl. Mater. Interfaces, 2017, 9, 33071–33079 CrossRef CAS PubMed.
- D. Gao, J. Gao, F. Gao, Q. Kuang, Y. Pan, Y. Chen and Z. Pan, J. Mater. Chem. C, 2021, 9, 16634–16644 RSC.
- S. M. Jeong, S. Song, S. K. Lee and N. Y. Ha, Adv. Mater., 2013, 25, 6194–6200 CrossRef CAS.
- X. Zhang, C. Liu, J. Shan, Z. Li, X. Guo, X. Zhao, J. Ding and H. Yang, J. Mater. Sci.: Mater. Electron., 2024, 35, 123 CrossRef CAS.
- B. P. Chandra, V. K. Chandra and P. Jha, Appl. Phys. Lett., 2014, 104, 031102 CrossRef.
- V. K. Chandra, B. P. Chandra and P. Jha, Appl. Phys. Lett., 2013, 103, 161113 CrossRef.
|
| This journal is © The Royal Society of Chemistry 2025 |
Click here to see how this site uses Cookies. View our privacy policy here. 
 ,
Hai
Jiang
and
Laihui
Luo
,
Hai
Jiang
and
Laihui
Luo

 . Under thermal stimulus, the captured electrons can be transferred to the charge transfer state (CTS) through the conduction band and then relaxed to 1D2. The captured electrons can also be directly relaxed to the excited level 1D2 as a result of the tunneling effect.36 Finally, the de-excitation from 1D2 to 3H4 levels produces a pure red emission (Fig. S1, ESI†). Considering both excellent PL and obvious TL of composition LiNbO3:0.01Pr3+, this composition is selected as the component for device applications.