
Theoretical study on the optoelectronic properties of fluorinated phenylpyrrole-based hole transport materials for perovskite solar cells†
Wenhui
You
,
Jie
Yang
* and
Quansong
Li
 *
*
Key Laboratory of Cluster Science of the Ministry of Education, Beijing Key Laboratory of Photoelectronic/Electrophotonic Conversion Materials, School of Chemistry and Chemical Engineering, Beijing Institute of Technology, 100081 Beijing, China. E-mail: jieyang24@bit.edu.cn; liquansong@bit.edu.cn
First published on 23rd October 2024
Abstract
Hole transport materials (HTMs) in perovskite solar cells (PSCs) are crucial for hole transport and exciton dissociation; therefore, developing efficient HTMs is key to improving the stability and photoelectric conversion efficiency of PSCs. In this study, a series of high twist phenylpyrrole (PP)-based HTMs with D–A–D structures were developed by adjusting fluorine substitution. The optoelectronic and interfacial properties of the synthesized single fluorine-substituted parent molecule (T3-pF) (Yi C, et al. Angew. Chem., Int. Ed., 2023, 62: e202300314) and ten newly designed molecules were investigated using density functional theory (DFT) and time-dependent DFT (TD-DFT) methods. Results indicated that the position of fluorine substitution had a more significant impact on hole mobility than the number of substitutions. The newly designed molecules T3-mF, T3-2F-C, and T3-3F-B exhibited the highest hole mobility in mono-, di-, and tri-fluorine-substituted molecules, all of which showed approximately twice the hole mobility of the parent HTM T3-pF. Additionally, ortho-fluorine substituted molecules demonstrated greater advantages in intramolecular charge transfer. The calculations of interfacial performance revealed that anchoring more fluorine sites on Pb can enhance interface interactions (an increase in adsorption energy by up to 0.5 eV) and promote hole transfer between the HTM and perovskite substrates (a doubling of the Bader charge). Among all the HTMs studied, the trifluorinated molecule T3-3F-B exhibited a good balance between bulk phase charge transfer and interfacial properties, with hole mobility and Bader charge being about twice that of the parent molecule. Therefore, this molecule can be used as an excellent HTM candidate. This work elucidates the microscopic mechanism of fluorine substitution on novel HTM molecules and provides theoretical guidance for designing efficient HTMs.
1. Introduction
Perovskite solar cells (PSCs) have emerged as one of the most promising renewable energy sources for future power demands as the power conversion efficiency (PCE) of single-junction solar cells has exceeded 26% at the laboratory scale over the past decade.1,2 Based on the device structure of PSCs, ideal hole transport materials (HTMs) should exhibit both interfacial modification and intrinsic hole-transport capability to ensure charge transfer within the bulk phase and between the interfaces.3–5 Organic small molecule HTMs are favored owing to their structural simplicity, ease of synthesis and high batch-to-batch stability.6,7 Spiro-OMeTAD (2,2′,7,7′-tetrakis[N,N-di(4-methoxyphenyl)amino]-9,9′-spirobifluorene) was often chosen in previous studies, but its high production costs and dependence on chemical doping limit its applications.8,9 Chemical dopants and hazardous solvents, such as toluene, cause pollution in industrial manufacturing.10 Therefore, developing processable, low-cost, and dopant-free HTMs with stable performance is a research priority.Constructing a donor(D)–acceptor(A) conjugated system has proven to be a promising design strategy for efficient HTMs owing to their enhanced intramolecular charge transfer and high dipole moment.11–13 In the current molecular design of HTMs, it is preferable to construct D–A–D type molecules with electron-withdrawing core groups (e.g., thiophene and pyrrole) and electron-donating terminal groups (e.g., triphenylamine (TPA) and diphenylamine (DPA)) because the structure could be more conductive to hole transport.10–12,14–17 This configuration permits straightforward molecular modification of the highest occupied molecular orbital (HOMO) level and conductivity by adjusting the conjugation structure, modifying substituents with different electronic structures, or adopting alternative strategies.15–18
Fluorine, the most electronegative element with a relatively small atomic size, is frequently employed as an electron-withdrawing group in side substituents.19–22 The incorporation of fluorine into functional materials design effectively enables the regulation of energy levels, defect passivation, and modulation of film morphology.19,23–25 Cheng et al. constructed centrosymmetric-structural HTMs (nFPPYs, where n represents the number of fluorine substitutions, which can be 2, 4 or 6) and observed that the charge transport properties improved sequentially with increasing fluorination, leading to a PCE of 20.1% based on trifluoro-substituted 6FPPY.26 However, Zhu et al. developed new amorphous HTMs (JY5, JY6 and JY7) with fluorinated benzothiadiazole units, and they found that more fluorine is not always better.27 Compared to non-fluorinated JY5 and difluorinated JY7, the device based on monofluorinated JY6 exhibits better film morphology and higher hole mobility, which results in higher device performance.27 Furthermore, it has been demonstrated that the substitution of fluorine atoms at different positions can also result in alterations to the material properties.23,28,29
Phenylpyrrole (PP) is a twisted structure with good photophysical properties such as dual fluorescence, large dipole moment and easy substitution modification.30 The polymerization of PP yields the poly-phenylpyrrole, which is frequently employed as a conductive polymer, but the PP unit is seldom incorporated into the design of small molecule materials to the best of our knowledge.31,32 Recently, an experimental synthesized molecule T3-F (renamed T3-pF in this study), comprising PP as the core unit and TPA as the end group, has been used as HTM in PSC, and excellent band alignment and hole extraction properties were observed, resulting in a remarkable PCE of 24.85%.33 T3-F exhibits a simple but diversified structure, low synthesis cost, and high yield.33 Previous studies have shown that the substitution modification of the phenyl ring can significantly modulate the planarity of the PP unit, which may further affect the overall properties of molecules.34 By adjusting the number and position of fluorine substitutions on the PP unit, we designed 10 fluorine-substituted HTMs based on the parent molecule T3-pF (including two monofluorinated molecules, six difluorinated molecules, and two trifluorinated molecules) (Fig. 1). We focus on the effect of fluorine atoms on their molecular geometries, optical properties, and transport properties to screen for potential HTMs. Our results theoretically reveal that different fluorine substitutions affect the molecular charge distribution of small molecule HTMs while influencing the hole mobility of the molecules and the interfacial charge transfer process at the HTM/MAPbI3 interface.
 | ||
| Fig. 1 Molecular structures of the studied molecules. T3-pF is marked in blue and new molecules are marked in black. | ||
2. Computational details
The isolated molecular properties were calculated based on density functional theory (DFT) and time-dependent density functional theory (TD-DFT). The geometries and properties of the investigated molecules were calculated at the B3LYP/6-31G(d,p) level. To obtain a reliable method for simulating the optical properties, seven functionals with different Hartree–Fock (HF) ratios (ScaHFX) were considered. The results (Table S2, ESI†) indicate that the functional PBE38 gives the nearest maximum absorption wavelength values in comparison with the experimental data. Therefore, the optical properties of the designed HTMs modified from T3-pF were calculated at the PBE38/6-31G(d,p) level. A dichloromethane solvent based on the conductor-like polarizable continuum model (C-PCM)35 was used to simulate the solvent effects. All the above calculations were performed using Gaussian 16 code.36 The electrostatic potential (ESP) and dipole moment were analyzed with Multiwfn 3.8.37The hole mobility of the investigated molecules was calculated based on the Einstein relation and Marcus theory.38–40 The crystal structures of the studied molecules were predicted by the Polymorph module in the Materials Studio software package.41 The polymorph predictor simulation was restricted to the all built-in ten space groups P21/C, P1, P212121, C2/C, P21, PBCA, PNA21, CC, PBCN and C2. Based on the obtained crystal structures, the hole transfer paths are screened. Then, the hole transfer integrals are calculated at the M06-2X/6-31G(d,p) level using the Gaussian 16 program package, which can better estimate intermolecular electronic coupling at the DFT level.42
The HTM/perovskite interface was investigated using the GGA-PBE functional on the Vienna ab initio Simulation Package (VASP).43 In our calculations, we chose the stable PbI2-terminated 110-MAPbI3 surface in the tetragonal phase with a Goldschmidt tolerance factor of 0.91 to build the interfacial models (a total of 460 atoms with the HTMs), which were commonly utilized in previous works.44–48 Our slab models had a 2 × 3 periodicity in-plane, and a 20 Å vacuum region was added in the z direction to avoid periodic interactions. The plane wave energy cutoff was set to 400 eV, and all atomic positions were fully loosened during optimization (residual forces, <0.05 eV Å−1). The k-point grids of 1 × 1 × 1 and 2 × 2 × 1 were adopted for geometry optimization and electronic properties calculations, respectively. van der Waals (vdW) interactions were considered with Grimme's DFT-D349 correction to describe weak interactions.
3. Results and discussion
3.1. Geometric and electronic structures
The new HTMs were constructed using T3-pF as the parent molecule.33 To investigate the effect of different fluorine substitutions on the molecular geometry, we statistically analyzed some of the bond lengths, bond angles and dihedral angles of T3 series molecules, as presented in Table S3 (ESI†). The incorporation of fluorine results in a slight deformation of the phenyl ring, leading to a change in the internal angles by approximately 3°. Except for the phenyl, the dihedral angles between the phenyl ring plane and the pyrrole ring plane at the PP unit change by about 5°, while the angles between the TPA and the pyrrole ring plane demonstrate a range of variations (Fig. 2). Among them, the torsion at the PP core of T3-mF, T3-2F-B, T3-2F-C, and T3-3F-B is relatively small, which results in increased conjugation at the central core site, and may further affect the charge transport. This recalls the previous finding that the better the planarity of the central unit, the stronger the conjugation of the system, and the more favorable it is for charge transfer.50 It is noteworthy that T3-2F-D exhibits a large torsion, resulting in a significant reduction in molecular backbone symmetry. The position of fluorine substitutions, rather than the quantity of substitutions, has a more pronounced impact on the planarity of HTMs.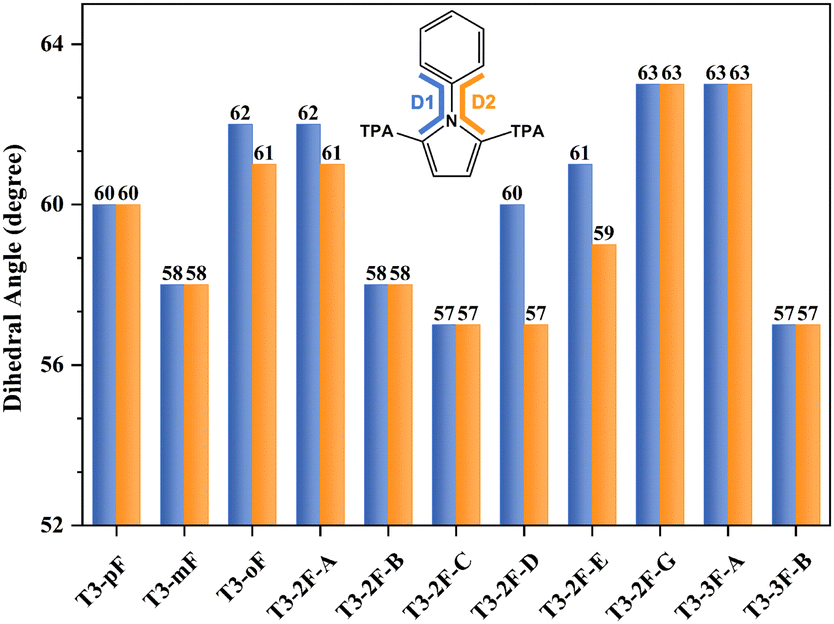 | ||
| Fig. 2 Dihedral angles (D1/D2) between phenyl and pyrrole rings of the studied molecules. | ||
Ideal HTMs should possess energy levels that align with the perovskite levels, which is a prerequisite for hole transport.4 For the calculated frontline molecular orbitals (FMOs) of the 11 molecules, the lowest unoccupied molecular orbitals (LUMOs) are mainly located on the central PP unit and the phenyl group attached to the pyrrole, while their highest occupied molecular orbitals (HOMOs) exhibit a more extensive distribution over the π-conjugated backbone, which facilitates hole transport. The distributions of FMOs exhibit consistency based on the same conjugated backbone and are not significantly associated with different fluorine substitutions. To obtain reliable HOMO values, we adopted a semi-empirical formula (Y = 1.107X–0.118 (R = 0.941)) to calibrate the HOMO energy levels.51 The calibrated value of T3-pF (5.11 eV) agrees well with the experimental value (5.13 eV). As shown in Fig. 3, the HOMO energy levels of monofluorinated, difluorinated and trifluorinated molecules are 5.11–5.12 eV, 5.13–5.19 eV and 5.16 eV, respectively. The HOMO energy level of T3-2F-D exhibits a notable decrease, which is potentially attributable to its poor molecular planarity and symmetry. In addition, the remaining difluorinated molecules display a concentration of 5.13–5.15 eV. As the number of fluorine substitutions increases, the HOMO energy levels of the investigated molecules appear to undergo a shift to a deeper value, which would provide higher open-circuit voltages.52,53 The value of LUMO was estimated by adding the optical bandgap (approximately equal to the first excitation energy) to the HOMO value.54 In all cases, the LUMO levels are higher than the conduction band of perovskite, indicating that charge recombination can be effectively suppressed.
 | ||
| Fig. 3 (a) Energy diagram of a perovskite and the studied molecules. (b) Frontier molecular orbital distribution of T3-pF. | ||
3.2. Surface charge distribution
To understand the distribution of surface charge, we calculated the electrostatic potential of all HTMs (plotted in Fig. 4), which provides information on intramolecular charge transfer.55,56 The ESP distributions of all molecules are relatively similar on the conjugated backbone. The negative potentials are primarily concentrated in the pyrrole site and the nitrogen center region of the TPA, while the methoxy of the end groups and the phenyl of the PP unit exhibit positive potentials. The primary distinctions among the molecules lie in the phenyl group of the PP unit, which exhibits localized negative potential at the fluorine-substituted position due to the strong electronegativity of fluorine, and further affects the charge distribution of the pyrrole unit. | ||
| Fig. 4 Electrostatic potential (ESP) distribution and dipole moment for the studied molecules. The blue parts indicate negative ESP, and the red parts indicate positive ESP. The red and black arrows represent the overall dipole moment (value in orange) of the molecule and the partial dipole moment (value in grey) of the core PP unit, respectively. The final diagram represents ESP extremum difference versus the dipole moment diagram for the studied molecules. | ||
Dipole moments can effectively characterize the spacing from the electropositive to the electronegative center within a molecule. Because the geometrical differences are mainly concentrated in the PP unit, we calculated the dipole moments of the T3 molecules and subsequently decomposed the dipole moment of the PP units to clarify the differences in local charges. The concentration of fluorines away from pyrrole results in an accumulation of negative potential, leading to a change in the negative center of the PP unit in T3-2F-B and T3-3F-B. The partial dipole moments of these two molecules are oriented in opposition to those of the other molecules, which ultimately results in a reduction in the overall dipole moments. Compared to T3-pF, the partial dipole moments of PP units containing ortho-substituted fluorine atoms demonstrate an increase, while the overall dipole moments also increase. It is well known that high the dipole moment of the PP unit enhanced the localized polarization due to the electronegativity of fluorine atoms, which is beneficial for intramolecular charge transfer (ICT).57 In addition, the orientation of dipoles in these molecules is observed with changed direction, which may also affect the charge transport. Moreover, it is worth noting that the dipole moment value and the ESP extremum difference (the difference between the maximum and minimum values, listed in Table S4, ESI†) are fitted with a linear distribution between the values (see Fig. 4).
3.3. Hole transport properties
Hole transport properties of HTMs are responsible for the charge transport within the bulk phase.58 The semi-classical Marcus theory and the Einstein relation are widely used to estimate the hole transfer mobility.40,58 The related key parameters, including hole recombination energy (λ), centroid distance (d), hole transfer integral (V), hole hopping rate (k), and average hole mobility (μ), are listed in Table S6 (ESI†). The average electron mobility value of T3-pF is 1.30 × 10⁻² cm2 V−1 s−1. Among the monofluorinated HTMs, the meso-substituted molecule T3-mF exhibits the highest mobility (2.93 × 10⁻² cm2 V−1 s−1), which is more than twice that of the para-substituted T3-pF, and 20 times more than the ortho-substituted T3-oF (1.37 × 10⁻³ cm2 V−1 s−1). For the difluorinated molecules, the order of optimal performance is as follows: T3-2F-C > T3-2F-D > T3-2F-A > T3-2F-B > T3-2F-G > T3-2F-E. The symmetrically substituted molecule T3-2F-C (2.49 × 10⁻² cm2 V−1 s−1) is the most effective. In contrast, among the trifluorinated HTMs, T3-3F-B exhibited a hole mobility of 2.54 × 10⁻² cm2 V−1 s−1, which is approximately five times that of T3-3F-A. In molecules with an identical number of fluorine substituents, there is a notable variation in mobility with the variation in fluorine substitution position, which is consistent with previous studies.59As postulated by Marcus charge transport theory, there is a negative correlation between recombination energy (λ) and the hole hopping rate (k).40 To explore the underlying causes of the differences in mobility, we first investigated the hole recombination energy, which is intimately linked to the alteration in molecular geometries from the neutral state to the cationic state. Compared with T3-pF, except for T3-oF, the λ values of the other molecules exhibit a reduction to varying degrees, which is conducive to optimal hole transport performance. It is worth mentioning that the λ of T3-oF is 0.325 eV, representing the lowest mobility among all molecules. Large recombination energy restricts the enhancement of mobility.
The transfer integral (V) is another vital parameter that affects the hole transfer mobility, which depends on the relative position of the dimer and the overlap of molecular orbitals.58,60 Based on the crystal structure, we constructed models of hole transport routes (Fig. S1, ESI†) and calculated the transfer integral of each pathway separately. In accordance with Marcus charge transfer theory, the pathway with the highest hole hopping rate exerts the most significant influence on mobility. Consequently, we compared the maximum transfer integrals of each molecule, as presented in Fig. 5. For T3-mF, T3-2F-C, and T3-3F-B, which exhibit high mobility, their λ values do not decrease significantly in comparison to the remaining eight molecules, but the advantage lies in the transfer integral. Given that the transfer integral depends on the configuration of the dimer, we calculated the HOMO orbital coupling diagrams for the maximum transfer integral paths of the three, as shown in Fig. S2 (ESI†). It can be observed that all three molecules adopt the face-to-face overlap stacking mode. The improved planarity of the central core PP units results in greater orbital overlap integrals for the dimers, which in turn leads to higher transfer integrals compared to other HTMs. Despite similarities in the conjugated backbones, fine-tuning the hole transfer integrals by adjusting the substituents is still an effective method for enhancing the hole mobility.
 | ||
| Fig. 5 Hole mobility (μ, in orange), internal reorganization energy (λ, in purple), and ten times the value of the largest transfer integral (Vmax × 10, in green) of the studied molecules. | ||
3.4. Optical and thermodynamic properties
The optical properties of HTMs have an important impact on the short-circuit current density and fill factor (FF) of PSC devices.61 We simulated the UV-vis absorption and emission spectra of T3 series molecules in dichloromethane solution at the PBE38/6-31G(d,p) level and subsequently calculated the Stokes shifts, as listed in Table S7 (ESI†). The absorption (340–347 nm) and the emission (448–462 nm) of T3 series molecules exhibit similarity owing to their identical conjugated structure. The first excitation process (S0 → S1) is mainly dominated by the HOMO to LUMO transition. The Stokes shifts of polyfluorinated molecules show a more pronounced tendency to increase than those of monofluorinated molecules, which may be conducive to the pore-filling of HTMs.61High-performance devices need to be supported by stable materials, and hole transport layers can serve to safeguard the perovskite layer from external damage.62 The chemical stability of HTMs can be estimated by the absolute hardness (η), which is defined by the following formula: η = (IPa − EAa)/2, where IPa and EAa represent the ionization potential and the adiabatic electron affinity, respectively.63 The results demonstrate that the absolute hardness of all molecules is concentrated around 1.55–1.60 (see Fig. 6), indicating a similar degree of chemical stability. In addition to stability, ideal HTMs should also be easily soluble in organic solvents, which affects the film-forming properties of the materials and further influences the charge transfer at the HTM/perovskite interface.58 To characterize the solubility, the solvation Gibbs free energy (ΔGsolv) of the HTMs was calculated, where ΔGsolv is defined as the Gibbs free energy in the solvent (dichloromethane) minus the Gibbs free energy in vacuum.64 A negative ΔGsolv value indicates good solubility. The results show that the ΔGsolv of other molecules decreased to different degrees compared to T3-pF. In theory, all molecules should be no less soluble than T3-pF, which provides the intrinsic driving force for good film-forming properties.
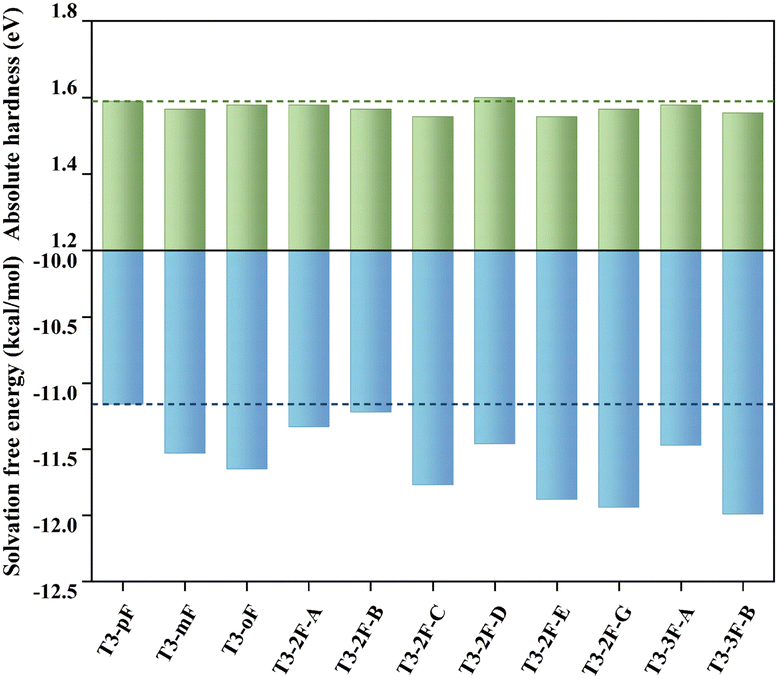 | ||
| Fig. 6 Absolute hardness (η) in eV and solvation free energy (ΔGsolv) in kcal mol−1 at the B3LYP/6-31G(d,p) level. The dotted lines indicate the values of T3-pF. | ||
3.5. Interfacial properties
Charge recombination and exciton dissociation between the hole transport layer and the perovskite interface are the key issues of interfacial hole transport. For simulation, T3-pF, T3-2F-C and T3-3F-B, which feature different fluorine quantities, were selected as the representative molecules. The HTMs were adsorbed on the perovskite surface in the parallel configuration58 to optimize the HTM/MAPbI3 interface model, as shown in Fig. 7(a)–(c). We can observe that the fluorine atoms close to the interface interact with Pb atoms, and the distances between F and Pb are 3.9 Å, 3.2 Å, and 3.2 Å/3.7 Å, respectively. It is obvious that the F–Pb distances are gradually reduced. In addition, the surface Pb atoms connect with the heteroatoms N and O, especially with the N on the PP unit and the O on the methoxy group. The distances between N and Pb range in 3.0–4.6 Å, while the distances between Pb and O on the end methoxy group are in the range of 3.0–5.2 Å. The heteroatoms, which are distributed uniformly in the backbones of the studied molecules, also promote parallel adsorption at the interface between HTM and perovskite. In model (c), the parallel distance of the interface is significantly shortened. To ascertain the adsorption capacity and the spontaneous interaction between HTM and perovskite, we also investigated the surface binding energy (Eads), which can be obtained using the following formula: Eads = EHTM/MAPbI3 − EHTM − EMAPbI3, where EHTM/MAPbI3, EHTM and EMAPbI3 are the total electronic energies of the HTM adsorbed on the perovskite system, the pristine HTM, and the perovskite surface, respectively. The Eads values of models (a), (b) and (c) are −1.27 eV, −1.34 eV and −1.76 eV, respectively. An increase in the number of fluorine sites on the phenyl group that can be anchored to Pb also results in an enhancement of the Eads, which indicates stronger adsorption. | ||
| Fig. 7 Optimized interface configuration of (a) T3-pF, (b) T3-2F-C, and (c) T3-3F-B on the MAPbI3 (110) face, along with the adsorption energies (Eads), the HTM-MAPbI3 separation (in black), and key distances between Pb and heteroatoms (N–Pb distance in blue, O–Pb distance in red, and F–Pb distance in green). | ||
To further explore the charge distribution at the interface, we performed the charge difference density (CDD) plots of the interface models. Fig. 8(a)–(c) depicts the CDD and the planar average electron density difference (Δρ) integrated over the x–y plane for the HTM/MAPbI3 systems as a function of the z coordinate.58,65 From the CDD maps, it can be observed that the adsorption model exhibits effective charge coupling and interfacial charge transfer. In conjunction with the planar charge differential density (PACDD) map, electrons are gained in the perovskite and lost at the HTM. In other words, the holes flow from the perovskite substrate to the HTMs, which indicates that the HTMs have a good capacity for transporting holes and hindering exciton recombination. To further assess the extent of hole transfer across the interface, we performed a topological investigation of the electron density by employing Bader charge analysis to quantify the charge displacement that occurred across the HTM/perovskite interface.66 The results showed that 0.078, 0.084, and 0.141 holes are transferred from perovskite to T3-pF, T3-2F-C, and T3-3F-B, respectively, which facilitates improving the efficiency of interface transfer and avoiding recombination.
 | ||
| Fig. 8 Bader charge analysis and charge density difference for the (a) T3-pF, (b) T3-2F-C, and (c) T3-3F-B interfaced surface. The number represents the amount of the Bader charge. The planar average electron density difference (Δρ) is integrated over the x-y plane for the HTM/perovskite systems as a function of the z coordinate (perpendicular to the surface), shown in the form of internal illustrations. The isosurface level for charge density difference was set at 0.0003 e per bohr−3. Yellow and cyan colors indicate charge accumulation and depletion, respectively. | ||
Density of state (DOS) distributions can visualize the electronic properties of the perovskite substrate interface.67,68 In comparison to the pure surface, the valence band and conduction band of the perovskite adsorbed with HTM decrease to different degrees as a consequence of the perturbation of electrons on the perovskite surface. As shown in Fig. 9, after the adsorption of HTMs, the band gap of the MAPbI3 slab in the three interface models is larger than that of the pristine MAPbI3 slab, which may facilitate the suppression of electron–hole recombination and elongate the carrier lifetime.68,69 This indicates that the introduction of HTMs makes the substrate more stable and achieves partial passivation, thereby contributing to the stability of PSC devices. It is noteworthy that the DOS diagrams depicted in Fig. 9 appear to have some metallic behavior, which is due to the trap states generated by the adsorption of HTMs. This is consistent with previous studies with HTM, electron transport materials (ETM), or passivation molecules on perovskite surfaces.21,60,70–72 According to the local density of state (LDOS) analysis (Fig. S3, ESI†), the presence of trap states is associated with nitrogen in HTMs, while there is no significant correlation with fluorine.
 | ||
| Fig. 9 Density of states (DOSs) of the (a) pristine MAPbI3, (b) T3-pF interfaced surface, (c) T3-2F-C interfaced surface, and (d) T3-3F-B interfaced surface. Zero energy is the setting for the Fermi level. | ||
4. Conclusions
In this study, we designed a series of fluorinated organic small molecule HTMs by precisely manipulating the number and position of fluorine on the phenyl ring within the PP structure and investigating them theoretically. With identical conjugated structures, the molecules exhibit similar molecular orbitals and optical properties, but the substitution of different fluorine atoms affects the molecular geometry and surface charge distribution. In particular, ortho-fluorinated molecules exhibit enhanced intramolecular charge differences, which facilitate intramolecular charge transport. The molecules T3-mF, T3-2F-C, and T3-3F-B exhibit the highest hole mobility among mono-, di-, and tri-fluorine-substituted molecules, respectively, which may be related to the enhanced planarity of the central conjugated unit. Notably, the differences in mobility among the three are not large, suggesting that the position of fluorine substitution may have a greater impact than the substitution quantity. All the fluorinated molecules present good chemical stability and solubility. Furthermore, the augmentation of fluorine atoms increases the anchoring sites of the interface between HTMs and perovskite, thereby enhancing the HTM/MAPbI3 interaction while passivating the substrate. The trifluorinated HTMs may have better potential in improving interfacial properties. T3-3F-B, representing a combination of both efficient hole transport and favorable interfacial properties, may be a particularly promising candidate in this regard. In the molecular design of D–A–D HTMs, precise control over the position and number of fluorine substitutions on the central conjugated unit has emerged as a well-established strategy. This study provides valuable insights into the design of novel and efficient fluorinated HTMs.Author contributions
Wenhui You: writing – original draft. Jie Yang and Quansong Li: review and editing.Data availability
The data supporting this article have been included as part of the ESI.†Conflicts of interest
There are no conflicts to declare.Acknowledgements
We thank the funding support of the National Natural Science Foundation of China (22173008) and Beijing Key Laboratory for Chemical Power Source and Green Catalysis (2013CX02031). We thank professor Lijie Li for the code to predict crystal structures.References
- Z. Liang, Y. Zhang, H. Xu, W. Chen, B. Liu, J. Zhang, H. Zhang, Z. Wang, D. H. Kang, J. Zeng, X. Gao, Q. Wang, H. Hu, H. Zhou, X. Cai, X. Tian, P. Reiss, B. Xu, T. Kirchartz, Z. Xiao, S. Dai, N. G. Park, J. Ye and X. Pan, Nature, 2023, 624, 557–563 CrossRef CAS PubMed.
- Best Research-Cell Effciencies Chart.
- L. Calió, S. Kazim, M. Grätzel and S. Ahmad, Angew. Chem., Int. Ed., 2016, 55, 14522–14545 CrossRef.
- A. Krishna and A. C. Grimsdale, J. Mater. Chem. A, 2017, 5, 16446–16466 RSC.
- C. Wu, R. Wang, Z. Lin, N. Yang, Y. Wu and X. Ouyang, Chem. Eng. J., 2024, 493, 152899 CrossRef CAS.
- S. Mabrouk, M. Zhang, Z. Wang, M. Liang, B. Bahrami, Y. Wu, J. Wu, Q. Qiao and S. Yang, J. Mater. Chem. A, 2018, 6, 7950–7958 RSC.
- X. Wang, Z. Xie, R. Wang, Y. Xiao, K. Yan, Y. Zhao, R. Lin, C. Redshaw, Y. Min, X. Ouyang and X. Feng, Small, 2024, 20, 2311914 CrossRef CAS.
- H. S. Kim, C. R. Lee, J. H. Im, K. B. Lee, T. Moehl, A. Marchioro, S. J. Moon, R. Humphry-Baker, J. H. Yum, J. E. Moser, M. Gratzel and N. G. Park, Sci. Rep., 2012, 2, 591 CrossRef PubMed.
- M. Jeong, I. W. Choi, E. M. Go, Y. Cho, M. Kim, B. Lee, S. Jeong, Y. Jo, H. W. Choi, J. Lee, J. H. Bae, S. K. Kwak, D. S. Kim and C. Yang, Science, 2020, 369, 1615–1620 CrossRef CAS PubMed.
- X. Yu, D. Gao, Z. Li, X. Sun, B. Li, Z. Zhu and Z. A. Li, Angew. Chem., Int. Ed., 2023, 62, e202218752 CrossRef CAS PubMed.
- Y. Wang, W. Chen, L. Wang, B. Tu, T. Chen, B. Liu, K. Yang, C. W. Koh, X. Zhang, H. Sun, G. Chen, X. Feng, H. Y. Woo, A. B. Djurišić, Z. He and X. Guo, Adv. Mater., 2019, 31, 1902781 CrossRef.
- Z. Z. Sun, S. Feng, W. L. Ding, X. L. Peng, J. L. Liu and X. L. Xu, Sol. Energy, 2021, 224, 491–499 CrossRef CAS.
- L. Yuan, W. Zhu, Y. Zhang, Y. Li, C. C. S. Chan, M. Qin, J. Qiu, K. Zhang, J. Huang, J. Wang, H. Luo, Z. Zhang, R. Chen, W. Liang, Q. Wei, K. S. Wong, X. Lu, N. Li, C. J. Brabec, L. Ding and K. Yan, Energy Environ. Sci., 2023, 16, 1597–1609 RSC.
- P. Xu, P. Liu, Y. Li, B. Xu, L. Kloo, L. Sun and Y. Hua, ACS Appl. Mater. Interfaces, 2018, 10, 19697–19703 CrossRef CAS.
- Q. Cheng, H. Chen, F. Yang, Z. Chen, W. Chen, H. Yang, Y. Shen, X. M. Ou, Y. Wu, Y. Li and Y. Li, Angew. Chem., Int. Ed., 2022, 61, e202210613 CrossRef CAS PubMed.
- K. Yang, Q. Liao, J. Huang, Z. Zhang, M. Su, Z. Chen, Z. Wu, D. Wang, Z. Lai, H. Y. Woo, Y. Cao, P. Gao and X. Guo, Angew. Chem., Int. Ed., 2022, 61, e202113749 CrossRef CAS.
- H. Wang, J. Wang, Q. He, J. Chang, S. Chen, C. Zhong, M. Wu, X. Zhao, H. Chen, Q. Tian, M. Li, J. Lai, Y. Yang, R. Li, B. Wu, W. Huang, T. Qin and F. Wang, Angew. Chem., Int. Ed., 2024, e202404289 CAS.
- Y. Wang, N. Wu, X. Zhang, X. Liu, M. Han, R. Ghadari, F. Guo, Y. Ding, M. Cai and S. Dai, ACS Appl. Energy Mater., 2022, 5, 10553–10561 CrossRef CAS.
- G. Sathiyan, H. Wang, C. Chen, Y. Miao, M. Zhai and M. Cheng, Dyes Pigm., 2022, 198, 110029 CrossRef.
- T. J. Aldrich, M. Matta, W. Zhu, S. M. Swick, C. L. Stern, G. C. Schatz, A. Facchetti, F. S. Melkonyan and T. J. Marks, J. Am. Chem. Soc., 2019, 141, 3274–3287 CrossRef CAS.
- Z. Z. Sun and R. Long, J. Phys. Chem. C, 2023, 127, 8953–8962 CrossRef CAS.
- F. Zhang, Z. Yao, Y. Guo, Y. Li, J. Bergstrand, C. J. Brett, B. Cai, A. Hajian, Y. Guo, X. Yang, J. M. Gardner, J. Widengren, S. V. Roth, L. Kloo and L. Sun, J. Am. Chem. Soc., 2019, 141, 19700–19707 CrossRef CAS PubMed.
- K. M. Lee, Y. S. Huang, W. H. Chiu, Y. K. Huang, G. Chen, G. B. Adugna, S. R. Li, F. J. Lin, S. I. Lu, H. C. Hsieh, K. L. Liau, C. C. Huang, Y. Tai, Y. T. Tao and Y. D. Lin, Adv. Funct. Mater., 2023, 33, 2306367 CrossRef CAS.
- J. Wu, M. Hu, L. zhang, G. Song, Y. Li, W. Tan, Y. Tian and B. Xu, Chem. Eng. J., 2021, 422, 130124 CrossRef CAS.
- R. Wang, Z. Lin and X. Ouyang, Mater. Today Adv., 2024, 22, 100501 CrossRef CAS.
- B. Wang, H. Wang, G. Sathiyan, C. Chen, Y. Xu and M. Cheng, ACS Appl. Energy Mater., 2022, 5, 5901–5908 CrossRef CAS.
- F. Wu, Y. Ji, C. Zhong, Y. Liu, L. Tan and L. Zhu, Chem. Commun., 2017, 53, 8719–8722 RSC.
- Z. Yao, F. Zhang, L. He, X. Bi, Y. Guo, Y. Guo, L. Wang, X. Wan, Y. Chen and L. Sun, Angew. Chem., Int. Ed., 2022, 61, e202201847 CrossRef CAS.
- Z. Li, Y. Yun, H. Huang, Z. Ding, X. Li, B. Zhao and W. Huang, J. Energy Chem., 2021, 57, 341–350 CrossRef CAS.
- I. Knysh, K. Letellier, I. Duchemin, X. Blase and D. Jacquemin, Phys. Chem. Chem. Phys., 2023, 25, 8376–8385 RSC.
- A. F. L. O. M. Santos and M. A. V. Ribeiro da Silva, J. Chem. Thermodyn., 2010, 42, 734–741 CrossRef CAS.
- L. S. Duan, Q. P. Wu, Y. Y. Xu, H. Wang, Z. Sun, Y. Chen and S. Xue, Chin. J. Chem. Phys., 2021, 34, 217–226 CrossRef CAS.
- J. Zhou, H. Li, L. Tan, Y. Liu, J. Yang, R. Hua and C. Yi, Angew. Chem., Int. Ed., 2023, 62, e202300314 CrossRef CAS.
- A. F. L. O. M. Santos and M. A. V. Ribeiro da Silva, J. Chem. Thermodyn., 2010, 42, 1441–1450 CrossRef CAS.
- M. Cossi, N. Rega, G. Scalmani and V. Barone, J. Comput. Chem., 2003, 24, 669–681 CrossRef CAS.
- M. J. Frisch, G. W. Trucks, H. B. Schlegel, G. E. Scuseria, M. A. Robb, J. R. Cheeseman, G. Scalmani, V. Barone, G. A. Petersson, H. Nakatsuji, X. Li, M. Caricato, A. V. Marenich, J. Bloino, B. G. Janesko, R. Gomperts, B. Mennucci, H. P. Hratchian, J. V. Ortiz, A. F. Izmaylov, J. L. Sonnenberg Williams, F. Ding, F. Lipparini, F. Egidi, J. Goings, B. Peng, A. Petrone, T. Henderson, D. Ranasinghe, V. G. Zakrzewski, J. Gao, N. Rega, G. Zheng, W. Liang, M. Hada, M. Ehara, K. Toyota, R. Fukuda, J. Hasegawa, M. Ishida, T. Nakajima, Y. Honda, O. Kitao, H. Nakai, T. Vreven, K. Throssell, J. A. Montgomery Jr., J. E. Peralta, F. Ogliaro, M. J. Bearpark, J. J. Heyd, E. N. Brothers, K. N. Kudin, V. N. Staroverov, T. A. Keith, R. Kobayashi, J. Normand, K. Raghavachari, A. P. Rendell, J. C. Burant, S. S. Iyengar, J. Tomasi, M. Cossi, J. M. Millam, M. Klene, C. Adamo, R. Cammi, J. W. Ochterski, R. L. Martin, K. Morokuma, O. Farkas, J. B. Foresman and D. J. Fox, Gaussian 16 Rev. C.01, 2016 Search PubMed.
- T. Lu and F. Chen, J. Comput. Chem., 2012, 33, 580–592 CrossRef CAS PubMed.
- L. B. Schein and A. R. McGhie, Phys. Rev. B: Solid States, 1979, 20, 1631–1639 CrossRef CAS.
- R. A. Marcus, Angew. Chem., Int. Ed. Engl., 1993, 32, 1111–1121 CrossRef.
- J. L. Brédas, J. P. Calbert, D. A. da Silva and J. Cornil, Proc. Natl. Acad. Sci. U. S. A., 2002, 99, 5804–5809 CrossRef.
- One Molecular Simulation Software.
- Y. Zhao and D. G. Truhlar, Theor. Chem. Acc., 2008, 120, 215–241 Search PubMed.
- G. Kresse and J. Furthmüller, Phys. Rev. B: Condens. Matter Mater. Phys.s, 1996, 54, 11169–11186 Search PubMed.
- Y. Li, Y. Zhang, P. Heng, R. Shao, Y. Liu, W. Qiao, L. Wang and J. Zhang, Org. Electron., 2018, 54, 14–20 CrossRef CAS.
- W. Travis, E. N. K. Glover, H. Bronstein, D. O. Scanlon and R. G. Palgrave, Chem. Sci., 2016, 7, 4548–4556 RSC.
- S. R. Kumavat, G. Sachdeva, Y. Sonvane and S. K. Gupta, RSC Adv., 2022, 12, 25924–25931 RSC.
- S. R. Kumavat, Y. Sonvane, D. Singh and S. K. Gupta, J. Phys. Chem. C, 2019, 123, 5231–5239 CrossRef CAS.
- R. Wang, M. Mujahid, Y. Duan, Z. K. Wang, J. Xue and Y. Yang, Adv. Funct. Mater., 2019, 29, 1808843 CrossRef CAS.
- S. Grimme, J. Antony, S. Ehrlich and H. Krieg, J. Chem. Phys., 2010, 132, 154104 CrossRef PubMed.
- R. Zhu, Q. S. Li and Z. S. Li, Nanoscale, 2018, 10, 17873–17883 RSC.
- W. J. Chi, Q. S. Li and Z. S. Li, Nanoscale, 2016, 8, 6146–6154 RSC.
- M. I. Dar, N. Arora, C. Steck, A. Mishra, M. H. Alotaibi, P. Bäuerle, S. M. Zakeeruddin and M. Grätzel, Eur. J. Inorg. Chem., 2018, 4573–4578 CrossRef CAS.
- J. Zhang, B. Xu, M. B. Johansson, N. Vlachopoulos, G. Boschloo, L. Sun, E. M. J. Johansson and A. Hagfeldt, ACS Nano, 2016, 10, 6816–6825 CrossRef CAS PubMed.
- G. Zhang and C. B. Musgrave, J. Phys. Chem. A, 2007, 111, 1554–1561 CrossRef CAS PubMed.
- Z. Tu, G. Han and Y. Yi, J. Phys. Chem. Lett., 2020, 11, 2585–2591 CrossRef CAS PubMed.
- M. Hao, D. Tan, W. Chi and Z. S. Li, Phys. Chem. Chem. Phys., 2022, 24, 4635–4643 RSC.
- S. Tan, N. Zhou, Y. Chen, L. Li, G. Liu, P. Liu, C. Zhu, J. Lu, W. Sun, Q. Chen and H. Zhou, Adv. Energy Mater., 2019, 9, 1803024 CrossRef.
- M. Hao, W. Chi and Z. Li, Nanoscale, 2021, 13, 4241–4248 RSC.
- K. X. Liu, J. Yang, Y. Bai and Q. S. Li, J. Phys. Chem. A, 2023, 127, 8985–8993 CrossRef CAS.
- Q. Guo and Q. S. Li, ACS Appl. Energy Mater., 2023, 6, 7433–7444 CrossRef CAS.
- H. Li, K. Fu, A. Hagfeldt, M. Grätzel, S. G. Mhaisalkar and A. C. Grimsdale, Angew. Chem., Int. Ed., 2014, 53, 4085–4088 CrossRef CAS.
- G. W. Kim, H. Choi, M. Kim, J. Lee, S. Y. Son and T. Park, Adv. Energy Mater., 2020, 10, 1903403 CrossRef CAS.
- R. G. Pearson, J. Am. Chem. Soc., 1985, 107, 6801–6806 CrossRef CAS.
- J. Ho, A. Klamt and M. L. Coote, J. Phys. Chem. A, 2010, 114, 13442–13444 CrossRef CAS PubMed.
- C. J. Yu, Y. H. Kye, U. G. Jong, K. C. Ri, S. H. Choe, J. S. Kim, S. G. Ko, G. I. Ryu and B. Kim, ACS Appl. Mater. Interfaces, 2020, 12, 1858–1866 CrossRef CAS.
- M. Kosa and D. T. Major, CrystEngComm, 2015, 17, 295–298 RSC.
- S. K. Gupta, D. Singh, K. Rajput and Y. Sonvane, RSC Adv., 2016, 6, 102264–102271 RSC.
- R. Long, J. Liu and O. V. Prezhdo, J. Am. Chem. Soc., 2016, 138, 3884–3890 CrossRef CAS PubMed.
- P. Mishra, D. Singh, Y. Sonvane and R. Ahuja, Mater. Today Energy, 2022, 27, 101026 CrossRef CAS.
- R. Zhu, Q. S. Li and Z. S. Li, J. Mater. Chem. A, 2019, 7, 16304–16312 RSC.
- X. Hou, W. Zhang and Q. S. Li, Phys. Chem. Chem. Phys., 2023, 25, 13383–13392 RSC.
- W. Hu, J. An, F. Si, H. Xue, F. Tang and W. Li, J. Electron. Mater., 2021, 50, 2129–2136 CrossRef CAS.
Footnote |
| † Electronic supplementary information (ESI) available. See DOI: https://doi.org/10.1039/d4tc03432e |
| This journal is © The Royal Society of Chemistry 2025 |