
 Open Access Article
 This Open Access Article is licensed under a
 Creative Commons Attribution 3.0 Unported Licence
Establishing design principles for functional additives in antimony chalcogenide solar cells†
Matthew
Sutton
 a,
Neil
Robertson
b and
Tayebeh
Ameri
*acd
a,
Neil
Robertson
b and
Tayebeh
Ameri
*acd
aInstitute for Materials and Processes, School of Engineering, University of Edinburgh, Sanderson Building, Robert Stevenson Road, Edinburgh EH9 3FB, UK
bSchool of Chemistry, The University of Edinburgh, David Brewster Road, Edinburgh EH9 3FJ, UK
cChair for Composite Materials, Department of Materials Science, Faculty of Engineering, Christian-Albrechts-Universität zu Kiel, Kaiserstrasse 2, 24143 Kiel, Germany. E-mail: tam@tf.uni-kiel.de
dKiel Nano, Surface and Interface Science KiNSIS, Kiel University, Christian-Albrechts-Platz 4, D-24118 Kiel, Germany
First published on 31st March 2025
Abstract
Antimony chalcogenide solar cells are a promising thin-film solar technology, offering a tunable bandgap, high intrinsic stability, and a large absorption coefficient. Their solution-processability enables the straightforward incorporation of chemical additives. While many additives have been explored, their underlying chemical mechanisms remain poorly understood. In this study, we examine the chemical mechanism of a proven additive, EDTA, and leverage these insights to develop a screening process for identifying additives that match or surpass its performance. Our findings reveal a dual role of EDTA and similar molecules: (i) Sb3+ chelation, enhancing Sb2S3 film quality, and (ii) pH reduction in the precursor solution, suppressing Sb2O3 formation. Additionally, we propose a chemical mechanism for the in situ conversion of Sb2O3 to Sb2S3. These insights will aid in the rational design of future additives and establish general guidelines for optimizing the growth conditions of efficient antimony chalcogenide solar absorbers under widely used hydrothermal conditions.
1 Introduction
As a result of the increasing effects of climate change, renewable sources of energy such as solar energy are growing in importance. Solar power generation has been accelerating in recent years, with global generation reaching 4264 TW h (2.33% of total) in 2022, up from 3446 TW h (1.92% of total) the previous year.1,2 Silicon solar cells currently dominate the market. However, there is scope for lightweight solar technologies for use on electric vehicles.Antimony chalcogenides (Sb2E3, E = S,Se) are non-toxic,3–10 highly stable vs. moisture and air,3,6,7,11,12 have a strong absorption coefficient of >105 cm−1 at visible wavelengths3–11 and are comprised of earth-abundant materials.3–10 Sb2E3 has a variety of processing techniques, and is annealed at relatively low temperature (<400 °C).3–6,11–23 Additionally, the S sites in Sb2S3 can be interchanged for Se without changing the stibnite crystal structure to form Sb2E3, so the band gap can be adjusted between 1.1–1.8 eV and so be optimised for solar cell applications.3–7,11,12,24 Sb2E3 is a thin-film technology, allowing the absorber layer thickness to be optimised at around 300 nm,3,13,16,20,25 compared with the optimum for monocrystalline silicon of 170 μm.26 This represents an approximate 500-fold reduction in optimized thickness for Sb2E3, paving the way for decreased material usage and lighter modules compared to traditional silicon.
The main limitation facing antimony chalcogenide solar cells currently is that of low efficiency. To date, the highest efficiency that has been achieved is 10.75%.22 That record, along with the two previous record efficiencies of 10.7% and 10.5% were achieved through the application of chemical additives via hydrothermal deposition.17,18 Additionally, other additive strategies have been employed, such as the codoping of Sb2S3 with Cl and Se by Chen et al. (2022), which increased efficiency from 5.9% to 7.15% by reducing bulk and interface defect density.27 Similarly, Che et al. (2025) reported the post-treatment of Sb2Se3 with P2O5, which suppressed surface defects and minimized gaps between Sb2Se3 ribbons.28 In addition to the improvement of film quality and passivation of crystalline defects, the suppression of unwanted side-phases such as Sb2O3 is important to yield high efficiency, and additives such as phosphotungstic acid have previously been used for this purpose.19,20,29,30 Thus, the study of chemical additives is of great importance in the pursuit of increasing the efficiency of antimony chalcogenide solar cells.
While the material quality and cell efficiency outcomes of these additives have been observed, a deep understanding of their underlying mechanisms remains to be achieved. For example, the record efficiency of 10.75% was achieved by using ethanol as a co-solvent.22 The hypothesis was that ethanol reduces the solubility of Sb3+ in solution, and thus slows down deposition, forming larger grains. Similarly, when EDTA was used to achieve 10.5% efficiency,17 it was concluded that the EDTA chelates Sb3+ and preferentially deposits it on the film, leading to a faster ion-based deposition rather than a nanoparticle-based deposition, leading to large and compact grains. While ethanol was shown to directly reduce the solubility of the precursor potassium antimony tartrate, the evidence for the effectiveness of EDTA was only given in the form of improved film quality and/or altered deposition rate. Thus, direct chemical evidence of the proposed mechanisms of EDTA was not provided. We believe that in-depth fundamental studies of such mechanisms are essential to deepen current understanding. As such, we chose to conduct a deeper investigation into the effects of EDTA, and to probe its interactions with the hydrothermal precursors in order to elucidate how it improves film quality and cell efficiency.
2 Results and discussion
2.1 EDTA in Sb2S3/TiO2 solar cells
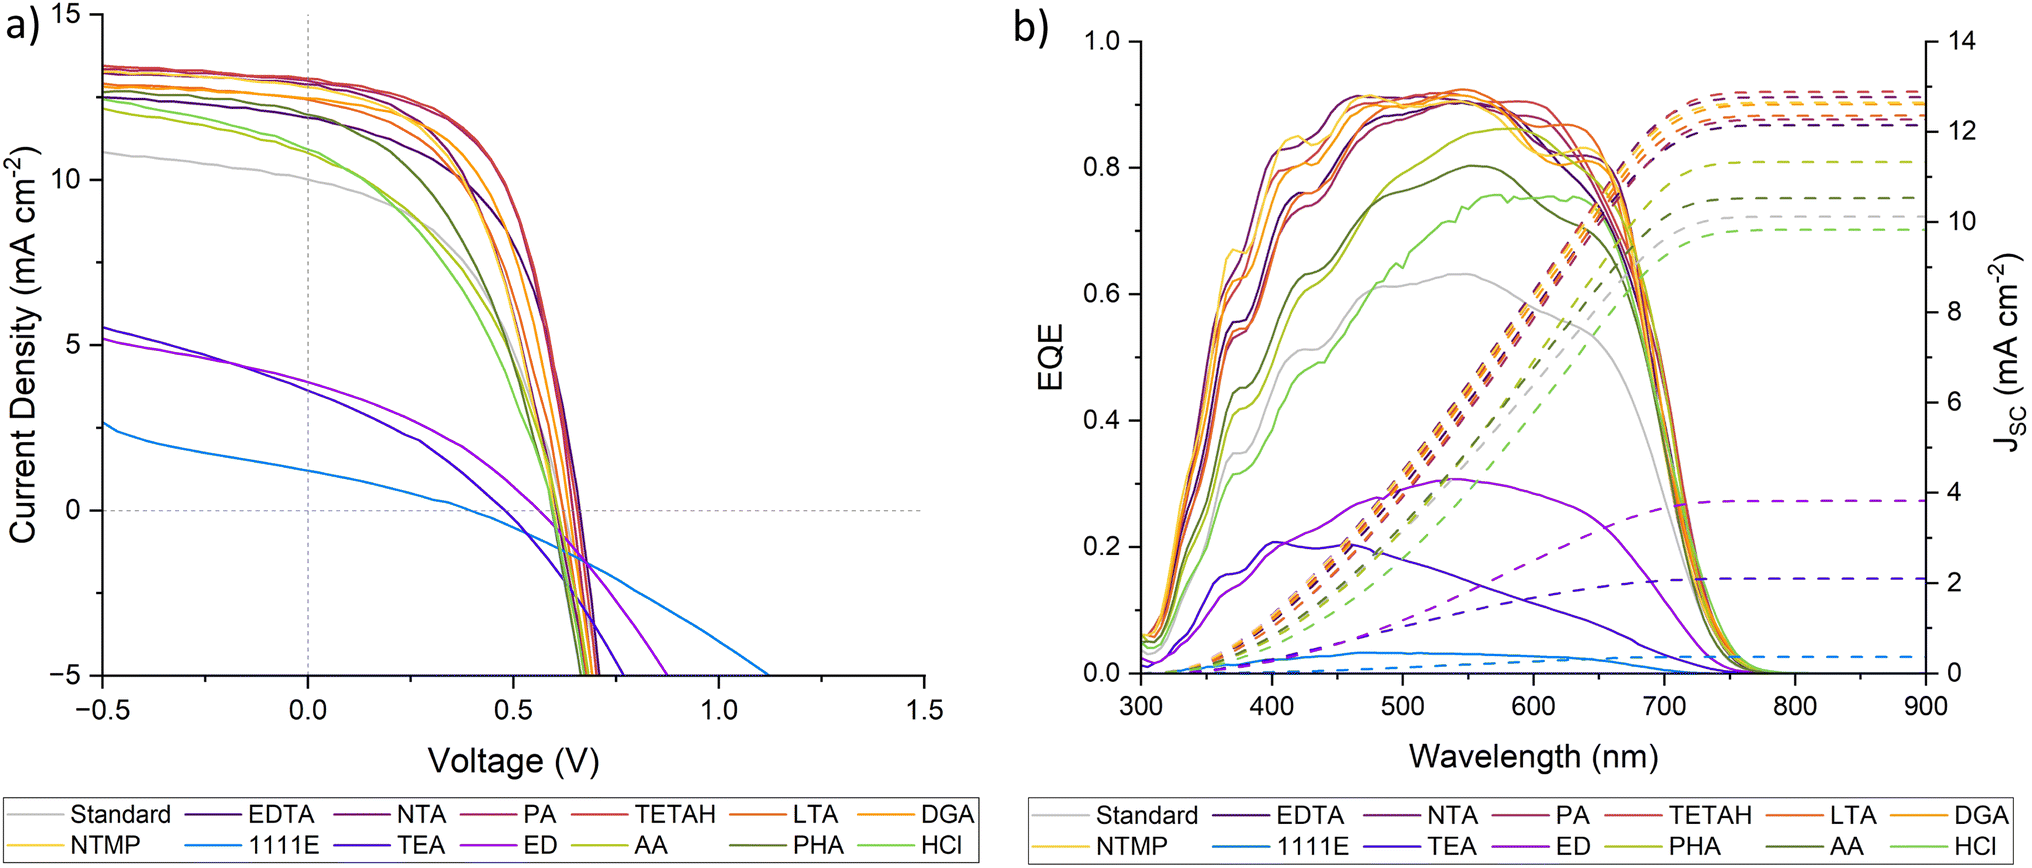
Before investigating the mechanisms of EDTA, we first confirmed its effectiveness as an additive in the Sb2S3/TiO2 system, which we selected over Sb2(S,Se)3/CdS for safety and environmental reasons detailed in ESI Discussion 1.† We used the precursors potassium antimony tartrate (PAT) and sodium thiosulfate (STS). We fabricated cells using EDTA, and achieved efficiency gains similar to those seen by Wang et al.,17 with an increase from 2.88 to 4.14 (1.26%) in our case, compared to the increase from 9.4 to 10.5% (1.1%) for Wang et al. using the Sb2(S,Se)3/CdS system. The J–V and EQE curves of the champion cells are shown in Fig. 1. Cell statistics are shown in ESI Fig. 1 and Table 2.† The enhanced performance following the addition of EDTA demonstrates its effectiveness as an additive in Sb2S3/TiO2 solar cells. | ||
| Fig. 1 (a) J–V curves, and (b) EQE response of champion standard (additive-free) and EDTA Sb2S3 solar cells. | ||
In the original study on EDTA, the performance improvement was largely attributed to higher film quality. Therefore, we looked at the surface of our bare Sb2S3/TiO2 films to confirm if this was the case for our cells too. Fig. 2 shows the surfaces of the standard (additive-free) and the EDTA Sb2S3 films under scanning electron microscopy (SEM). The surface of the standard film is covered with unevenly shaped formations, while the surface of the EDTA film is even and smooth. The crystals were proven to be Sb2O3 by powder X-ray diffraction (p-XRD), Raman mapping and SEM-EDS (ESI Fig. 2–4†). Sb2O3 is an insulator and known unwanted impurity in antimony chalcogenide solar cells,19,20,29,30 so it likely contributed to the standard film's poorer performance.
 | ||
| Fig. 2 Sb2S3 film quality shown through SEM images of Sb2S3 films using (a) no additive and (b) EDTA. | ||
The improvements made in Sb2S3 crystallinity by EDTA in literature were mainly in terms of increased grain size, with some marginal improvement in orientation, shown by the texture coefficient (TC) of the films.17 Since antimony chalcogenides are a 1-D material, charge transport is favoured along the ‘ribbons’ and therefore, an hkl-orientated film (with the ribbons running between the transport layers) yields favourable performance. In our case, TC(211) increased from 0.37 for the standard to 0.43 for EDTA, as did TC(221) from 0.30 to 0.37 (calculation given in ESI eqn (1)).† The ratio TC(211)/TC(120) also increased from 0.45 to 0.51 from the standard to EDTA. Each of these changes replicated those seen in literature.17 Grain size could not be precisely measured due to the presence of Sb2O3 formations on the surface of the standard film, so we cannot confirm whether this was a factor in our case. Overall, our results align with those of Wang et al.17 for the Sb2(S,Se)3 system, with the notable addition of Sb2O3 suppression as a key component of EDTA's working mechanism.
2.2 Mechanistic investigation of EDTA
The initially proposed working mechanism of EDTA was hypothesised as “a strong ligand to coordinate Sb3+ ions […] able to suppress the formation of [Sb2(S,Se)3] precipitate”.17 This [Sb2(S,Se)3] precipitate was considered unwanted due to its formation in a particle deposition regime on the bulk film, as opposed to an ion-reactive regime. A particle deposition regime involves the spontaneous formation of Sb2S3 nanoparticles in solution, which then deposit onto the film. In an ion-reactive regime, individual ions deposit onto the film directly, forming Sb2S3 as they deposit. An ion reactive regime is thought to result in a more compact film with larger grains. Therefore, we proposed two procedures to test these claims: (i) the binding of EDTA to Sb3+ investigated using NMR spectroscopy; (ii) the formation of antimony chalcogenide aggregate in a precursor solution both with and without EDTA, measured over time.Firstly, NMR spectroscopy was performed on four solutions containing different mixtures of the precursors and EDTA. The resulting spectra are shown in Fig. 3.
 | ||
| Fig. 3 1H NMR spectra of solution containing (a) EDTA in D2O, showing relative assignments of peaks to groups in EDTA structure, (b) EDTA + STS in D2O, (c) EDTA + PAT in D2O and (d) EDTA + STS + PAT in D2O. | ||
EDTA in D2O is known to produce two clear peaks31 which correspond to the ‘arm’ CH2 groups, which we observed at δ = 3.94 ppm, and ‘backbone’ CH2 groups, which we observed at δ = 3.62 ppm. When PAT is added to EDTA in D2O, the arm C-H2 splits into an A–B quartet, which is indicative of EDTA complexation.32 When STS is added to EDTA in D2O, the backbone CH2 signal shifts slightly downfield to 3.73 ppm, potentially indicating an interaction between EDTA and STS. The final solution with EDTA, STS and PAT shows both spectra overlapped, indicating that there is likely an STS interaction, as otherwise we would have expected a similar spectrum to EDTA + PAT (without overlap). In the solution with both precursors and EDTA, a broad peak also appears at 4.39 ppm, which indicates an exchangeable H somewhere in the mixture.33 These results show that there is clearly interaction between PAT and EDTA in solution, but there is also an interaction between STS and EDTA which was previously not identified. It is also still unproven that EDTA is binding specifically to Sb3+. However, due to the high O affinity of Sb, it is most likely the case.34
The formation of antimony chalcogenide aggregate in the precursor solution was investigated by mixing two solutions: one with the precursors STS and PAT in water, and another with STS, PAT and EDTA. All reagents were used at the same concentrations used in cell fabrication. Both solutions were left in ambient conditions, and the results are shown in Fig. 4. Initially, both solutions are clear and colourless, however over the course of a few minutes the EDTA-containing solution started to turn orange and opaque. Eventually, the solution once again became clear as the powder, now a deep red, settled to the bottom of the vial.
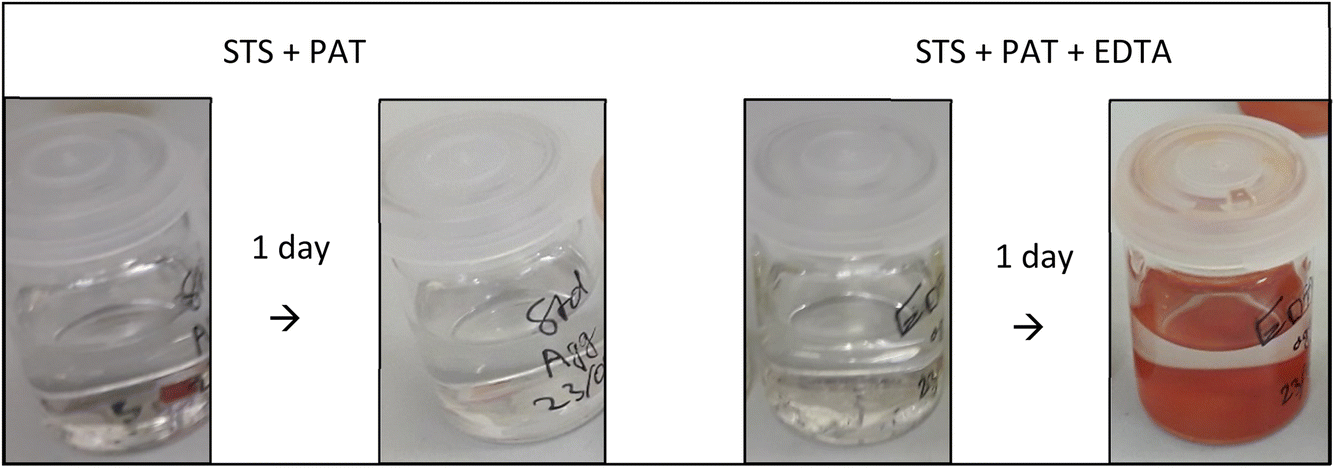 | ||
| Fig. 4 Vials of STS + PAT and EDTA + STS + PAT in water, showing that upon addition of EDTA, a red powder forms over time in ambient conditions. | ||
As presented in Section 2.4 below, we were able to prove that this powder is Sb2S3, indicating the direct opposite effect to the suppression of particle aggregation proposed by Wang et al.,17 as EDTA instead promoted the formation of these nanoparticles. Although this result was unexpected, we hypothesized that the formation of this red powder, given its correlation with the observed positive effects of EDTA, could potentially serve as a screening method for identifying other promising additives.
2.3 Additive screening process
To perform this screening test, we simply repeated the prior test, placing an additive of an equimolar amount to EDTA into a solution with the two precursors. We tested a series of additives with similar structural moieties to EDTA. The additives tested are listed below in Table 1, along with the colour of the resultant powder. Structures of each additive are shown in Fig. 5, and images of the powders formed are shown in ESI Fig. 5.†| Additive | Short name | Red RP? |
|---|---|---|
| Ethylenediaminetetraacetic acid | EDTA | Yes |
| Nitrilotriacetic acid | NTA | Yes |
| Pentetic acid | PA | Yes |
| Triethylenetetramine-N,N,N′,N′′,N′′′,N′′′-hexaacetic acid | TETAH | Yes |
| L-(+)-Tartaric acid | LTA | Yes |
| Diglycolic acid | DGA | Yes |
| Nitrilotris (methylenephosphonic) acid | NTMP | Yes |
| 1,1′,1′′,1′′′-(Ethane-1,2-diylbis(azanetriyl))tetrakis (propan-2ol) | 1111E | No |
| Triethanolamine | TEA | No |
| Ethylenediamine | ED | No |
| Phosphonic acid | PHA | Yes |
| Acetic acid | AA | Yes |
| Hydrochloric acid | HCl | Yes |
 | ||
| Fig. 5 Chemical structures of additives (a) EDTA, (b) NTA, (c) PA, (d) TETAH, (e) LTA, (f) DGA, (g) NTMP, (h) 1111E, (i) TEA, (j) ED, (k) PHA, (l) AA, and (m) HCl from Table 1. | ||
Additives with acid groups generally formed the red powder, while those without formed a white powder. To test the effectiveness of the powder formation as a screening process, cells were fabricated using the additives in Table 1. The champion JV curves and EQE responses are shown in Fig. 6. The cell statistics are shown in ESI Fig. 6 and Table 2.† Significantly, the formation of red powder in the screening process largely correlated with an improvement in performance, while the formation of the white powder correlated with a decrease in performance. In each of the ‘red powder’ cells, the films looked visually smoother and shiner than the standard (additive-free) and ‘white powder’ cells. An example of this effect is shown in ESI Fig. 7.† The best three performing additives, pentetic acid (PA), triethylenetetramine-N,N,N′,N′′,N′′′,N′′′-hexaacetic acid (TETAH) and diglycolic acid (DGA) all outperformed EDTA.
 | ||
| Fig. 6 (a) J–V curves, and (b) EQE response of champion Sb2S3 solar cells with no additive (standard) and with additives listed in Table 1. | ||
To investigate the effects on the film quality further, p-XRD was performed on a selection of films (ESI Fig. 8†), utilising red and white powder forming additives. The effects initially observed with the use of EDTA, specifically (1) a notable increase in the favorable (211) and (221) reflections, and (2) the suppression of Sb2O3, were also seen with each of the red-powder-forming additives tested.
SEM-EDS was used to compare the elemental composition and surface morphology of each of the standard, EDTA and high-performing PA films. The EDS results are shown in ESI Table 1.† The Sb![[thin space (1/6-em)]](https://www.rsc.org/images/entities/char_2009.gif) :S ratios of the annealed standard, EDTA and PA films were 2:2.09, 2:2.53, and 2:2.55, respectively. This suggests a higher level of incorporation of S into the film for EDTA and PA, indicating that the standard had either sulfur vacancies which would have acted as recombination centres, or the presence of Sb2O3 within the film itself, which would have a similar effect. The measured area of the standard was away from the surface Sb2O3 formations, and so was, to the best of our knowledge, representative of the underlying film and not the surface formations.
:S ratios of the annealed standard, EDTA and PA films were 2:2.09, 2:2.53, and 2:2.55, respectively. This suggests a higher level of incorporation of S into the film for EDTA and PA, indicating that the standard had either sulfur vacancies which would have acted as recombination centres, or the presence of Sb2O3 within the film itself, which would have a similar effect. The measured area of the standard was away from the surface Sb2O3 formations, and so was, to the best of our knowledge, representative of the underlying film and not the surface formations.
2.4 Mechanistic understanding of additives
To confirm the identity of the red and white powders, we investigated them using p-XRD and Raman spectroscopy (shown in Fig. 7). We also tested the EDTA and PA powders in SEM-EDS (results in ESI Table 1†). To attain the powders for testing, the solution was decanted. The powder was washed and decanted twice with DI water to remove residual dissolved precursors, then allowed to dry over 24 hours. Upon annealing in the same conditions as the films (350 °C, N2 atmosphere, 10 min), the red powders turned black. The black powder of the EDTA sample was measured using p-XRD and shown to be crystalline Sb2S3 (ESI Fig. 9†), indicating that the red powder was amorphous Sb2S3. p-XRD of the unannealed red powder showed no distinct peaks, further indicating an amorphous nature. Raman spectroscopy was a good match for the ‘as-deposited’, or amorphous Sb2S3 of Dielegros-Godines et al.,35 and SEM-EDS results confirmed the composition was a majority of Sb and S, in the Sb:S ratio of 2:2.60. These two elements accounted for 93% of the composition, with the remaining 7% comprising C, O, N and Na. These additional components were assumed to be trapped remnants of the precursors and/or EDTA which did not fully wash away. For the white powder, the patterns directly matched literature spectra for cubic Sb2O3 in both p-XRD (ICSD collection code 240206) and Raman spectroscopy.36
 | ||
| Fig. 7 Results of (a) normalised p-XRD and (b) normalised Raman spectroscopy for red and white powders extracted from screening process solutions. The top 7 spectra in each graph (displayed in red-yellow colours) correspond to red powders (Sb2S3), while the bottom three (displayed in blue-purple colours) correspond to white powders (Sb2O3). | ||
After confirming the identity of the red powder as amorphous Sb2S3, we proposed a potential mechanism for the suppression of Sb2O3 by the red powder forming additives. The proposed mechanism is as follows.
Release of reactive sulfur species H2S from STS:37
| S2O32− + 2H+ ⇌ H2S + SO3 | (1) |
Hydrolysis of Sb2O3:20
| Sb2O3 + H2O + 2H+ ⇌ 2Sb(OH)2+ | (2) |
These can be combined to lead to the formation of Sb2S3:
| 2Sb(OH)2+ + 3H2S → Sb2S3 + 4H2O + 2H+ | (3) |
Sb2O3 is a known decomposition product of PAT.38 The decomposition of S2O32− (eqn (1)), the hydrolysis of Sb2O3 (eqn (2)) and hence the final formation of Sb2S3 (eqn (3)) rely on the presence of H+, so we considered the effect of pH on the reaction. For each of the eqn (1)–(3), we expected an increase in pH as it occurred due to the consumption of H+. We prepared relevant solutions to test this hypothesis, and chose to use PA as our acid as it dissolved more readily at room temperature than EDTA, while still giving high efficiency in solar cells. A solution of STS + PA (eqn (1)) showed the expected behaviour by the pH increasing from 3.9 to 4.3 over one day. A solution of PAT + PA became more acidic, changing from 3.9 to 3.7 over the same time period. This was likely due to the release of tartaric acid upon the decomposition of PAT.25 A solution of STS + PAT + PA (eqn (1)–(3)) yielded the expected result of a larger pH increase, going from 4.2 to 4.7, giving good evidence of the final Sb2S3 formation mechanism. Overall, a lower pH allows and promotes this conversion from Sb2O3 to Sb2S3, as well as the release of sulfur from STS which is known to improve deposition.19 This understanding aligns with what we see in literature, with the use of acidic additives coinciding with a suppression of Sb2O3; for example, Chen et al. suppressed Sb2O3 formation using a range of acids including phosphotungstic acid,29 Xiao et al. found a reduction in Sb2O3 formation when using thioacetamide in conjunction with STS,19 and Chen et al. used Sb2O3 as a precursor to Sb2S3 by utilising EDTA-2Na and Al2(SO4)3.20 With our proposed mechanisms, the reasons leading to Sb2O3 formation and its suppression, such as was observed in these examples, can be comprehensively understood.
To gain a better understanding of the interaction between white powder additives and precursors, we also measured the NMR of 1111E as a representative additive and compared it with the NMR of EDTA. As shown in ESI Fig. 11,† there was little change to the signals upon the addition of PAT besides some expected chemical shift changes, and a slight increase in a multiplet corresponding to the –OH hydrogens. While this indicated that there may have been some small level of interaction between 1111E and PAT, it was very minor compared to the extent shown by EDTA, which was clearly and completely involved in chelation in the presence of PAT (as evident from the change between Fig. 3a and c where the arm CH2 signal for EDTA completely converts to an A–B quartet).
We then measured the pH of each additive in water, and correlated that back to the average performance of the cells. The resulting graph is shown in Fig. 8a. Overall, lower pH correlated with the formation of the red powder and higher performance, while a higher pH correlated with the formation of a white powder and lower performance. The standard, with no additive, remained clear and colourless. Fig. 8b shows the correlation of the readiness of an additive to bind with Sb3+ (based on available O− atoms) with the average performance of the additive in Sb2S3 solar cells. A general trend can be seen whereby the more available O− atoms the additive has, the greater its average efficiency. This is in agreement with a recent study by Ren et al. in 2025 on the chelation of Sb3+ by PO43− in Sb2(S,Se)3 solar cells, whereby the chelation of PO43− to Sb3+ was evidenced by XPS.39 There is a noticeable gap between the performance of some of the red-powder forming additives when they are compared relative to their pH, which may be explained by their ability to bind Sb3+ and effectively control film deposition. We demonstrated earlier in Fig. 3 that EDTA does bind to something in PAT. Our results correlate performance to this potential chelation ability quite well, as the poorest performing HCl has no sites with Sb affinity, while AA has one carboxylic acid group with 2 O atoms available to bind, PHA has one phosphonic acid group with 3 available O atoms, and so on, until the highest performing PA and TETAH with 5 and 6 carboxylic acid groups, for 10 and 12 available O atoms respectively. Overall, therefore, we agree with Wang et al.17 that EDTA “is able to control the nucleation and deposition process”, and this correlation between available ‘Sb binding sites’ and performance, along with our NMR results which strongly suggest EDTA binds to Sb3+, shown in Fig. 3, and the correlation shown in Fig. 8b, now provide some evidence of these effects.
 | ||
| Fig. 8 (a) pH of additives in Table 1vs. average cell performance of Sb2S3 solar cells made using that additive, (b) number of O atoms available in each additive to bind to Sb3+vs. average Sb2S3 solar cell performance. O atoms are considered ‘available to bind’ if they are readily deprotonated to give O−, therefore –COOH would count as one available O atom. | ||
Among the 10 red powder-forming additives, HCl was an outlier in terms of cell performance. While there were no available Sb3+ binding atoms as with the other additives, it actually performed worse than the standard despite suppressing Sb2O3 formation. We believe this to be due to an elemental sulfur-forming side reaction caused as a result of very low pH. A detailed explanation of this can be found in the ESI Discussion 2.†
It is worthwhile mentioning that the TEA additive has been previously shown to improve the performance of Sb2(S,Se)3 solar cells in a study by Zhu et al.40 This appears contradictory to our results; however, they also add HCl, which counteracts the pH effects of TEA observed here, allowing it to perform chelation effects.
In order to investigate the effects of the red Sb2S3 aggregate on cell performance (and whether or not a Sb2S3 film can still form if the precipitate is removed after forming), we fabricated cells under three conditions; (i) a standard EDTA cell, (ii) a standard EDTA cell, but the mixed precursor solution was left in ambient conditions for a day before hydrothermal synthesis, allowing Sb2S3 particles to form and settle out (named ‘settled’), and (iii) where a ‘settled’ solution was prepared, but the particles were then filtered out to leave a clear solution (named ‘filtered’). The results are shown in detail in ESI Fig. 10.† We observed that for the settled sample, the performance was very similar to the EDTA standard, suggesting that the presence of the Sb2S3 powder had little effect on performance. However, once filtered, the performance increased, primarily due to an increase in fill factor, suggesting that the removal of the red Sb2S3 aggregate not only still allows a film to form, but actually improves the resultant solar cell's performance.
The fact that the performance is unhindered, and even improved, by allowing the aggregation to occur suggests that the formation of the Sb2S3 aggregate does not drastically impact the availability of Sb for film deposition. We propose, therefore, that the Sb2S3 aggregate forms as a result of the conversion mechanism from Sb2O3, detailed in eqn (1)–(3). By allowing this conversion to occur and removing the particulates afterwards, the ‘particle-based’ deposition regime (whereby whole nanoparticles deposit onto the film) may be disfavoured over the ‘ion-based’ deposition regime (whereby individual ions, such as Sb3+ bound to EDTA) for film deposition. The ion-based deposition is preferred for larger and more compact grains, which could explain the slight performance gain for the filtered sample.17
3 Conclusions
Overall, we have elucidated the working mechanism of the established additive EDTA, leveraging this knowledge to develop a novel screening process for identifying effective additives and understanding their role in Sb2S3 solar cells. A simple test involving the addition of an additive to a PAT/STS precursor mixture in water provides direct insight into its effects: the formation of a red Sb2S3 precipitate indicates sufficient acidity to convert Sb2O3 to Sb2S3, while additional colour changes or precipitates signal potential side reactions that may hinder performance. This method offers a straightforward approach for screening additives and detecting unwanted interactions.Furthermore, we found that additives with a high number of oxygen atoms available for Sb3+ chelation performed better, supporting a two-fold working mechanism: (1) pH control—low enough to facilitate sulfur ion release and Sb2O3 conversion but not so low as to trigger elemental sulfur formation, and (2) Sb3+ chelation, which enhances film deposition. Our findings underscore the critical role of pH regulation in antimony chalcogenide solar cells, demonstrating that high pH promotes Sb2O3 formation while low pH drives its conversion to Sb2S3. The insights gained from this study not only inform the selection of future additives but also contribute to optimizing the deposition environment for efficient, lightweight solar power applications.
4 Methods
4.1 Reagents
Ethylenediaminetetraacetic acid (EDTA) was acquired from Apex Bio. Phosphonic acid (PHA) was acquired from Fluka Honeywell. Triethanolamine (TEA) and pentetic acid (PA) were acquired from Fluorochem. Triethylenetetramine-N,N,N′,N′′,N′′′,N′′′-hexaacetic acid (TETAH) and sodium thiosulfate (STS) were acquired from Thermo Scientific. Thiourea was acquired from VWR Chemicals. All other reagents were acquired from Merck.4.2 Fabrication of Sb2S3/TiO2 film
To pattern the bottom FTO electrode, the FTO-coated glass was etched using Zn metal and HCl, then sonicated in Hellmanex in UP water (2%), UP water and ethanol. TiO2 precursor solution was spin coated onto the substrate, which was masked with polyimide tape: Ti(IV) isopropoxide (140 μL), EtOH (1.984 mL), HCl in EtOH (41.6 μL, 1.25 M); 100 μL at 1650 rpm for 40 seconds. The substrates were annealed (550 °C, 2 °C min−1 ramp, hold for 50 min) to yield the TiO2 film. A seed layer of Sb2S3 was deposited in a nitrogen-filled glovebox by spin coating: thiourea (0.1 g), antimony acetate (0.2 g) in 252 μL DMSO/H2O solution (0.8:0.03 v/v), DMSO was added dropwise (1680 μL); coated 100 μL at 4000 rpm for 40 s. This was followed by annealing at 200 °C for 1 minute in the glovebox. The seeded films were placed into 50 mL autoclaves. Hydrothermal solutions were made up by dissolving the additive being used (7.5 × 10⁻⁵ moles) in a potassium antimony tartrate hydrate (PAT) solution (15 mL, 19 mM). This solution was then mixed with a sodium thiosulfate (STS) solution (15 mL, 220 mM) and loaded into the autoclave with the film. The autoclaves were placed into a preheated oven at 100 °C for 2 hours, and allowed to cool overnight. The films were washed in UP water, the glass side was wiped clean, and it was dried with nitrogen flow. The films were annealed in the glovebox at 350 °C for 10 minutes to yield the finished film.
4.3 Device assembly
The completed Sb2S3/TiO2 film, still in the glovebox, had a Spiro-OMeTAD solution spin coated: chlorobenzene (1 mL), tert-butylpyridine (28.814 μL), LiTFSI solution (9.5 μL, 520 mg mL−1 in MeCN) and Spiro-OMeTAD (36.6 mg, Solarpur SHT-263); 100 μL, 3000 rpm, 30 s. The film was heated at 100 °C for 10 minutes in air to dope Spiro-OMeTAD. The edges of the cell were etched using acetonitrile, then a KOH (5 M) solution. The etched cells were loaded into a thermal evaporator and the gold electrodes were deposited (5 × 10⁻⁶ mbar, 80 nm@0.5 Å s−1).4.4 Aggregation screening test
The additive (1.25 × 10⁻⁵ moles) was dissolved in PAT solution (2.5 mL, 38 mM) in ultrapure water. If the additive did not fully dissolve, it was swirled vigorously for a few minutes. A STS solution (2.5 mL, 440 mM) in ultrapure water was then added and the solution was swirled to yield a homogenous solution. This solution was left in a vial to react and settle over the course of one week.The aggregate was collected by decanting the water when settled, then refilling with fresh ultrapure water, sonicating and shaking through to remove unreacted PAT and STS. This process was repeated again once the powder had settled, and the final liquid was decanted once settled again. The resulting wet powder was allowed to dry overnight to yield the final product.
4.5 Materials characterisation
Crystalline information was collected on a Bruker D2 Phaser benchtop powder X-ray (p-XRD) diffractometer with Cu Kα radiation (λ = 1.54184 Å).SEM (4 nm Pd coating, WD = 7 mm, 10 kV) was used to attain morphological data, while SEM-EDS was used for elemental analysis of the films. EDS data was collected and processed using Oxford Instruments AZtec software.
Raman spectroscopy was performed at 785 nm with laser power of 0.2 mW.
NMR spectra were collected on a Bruker Avance spectrometer δH (500 MHz; D2O; Me4Si).
pH testing was performed using a Hanna Instruments HI98103 pH tester, calibrated against a HI70007P 7.01 pH buffer solution. The probe was inserted into the solution to be tested until a stable reading could be taken.
4.6 Solar cell characterisation
The complete solar cells were characterised by JV measurement and EQE. JV measurement was carried out using an AM1.5G solar simulator and a Keithley 2450 sourcemeter to apply bias voltage. The scans were done from −0.5 V to 1.5 V at 0.125 V s−1 with a step size of 0.035 V. The active area of the device was 0.04785 cm2, made using an aluminium mask. EQE measurements were taken using a dual-source quartz halogen and xenon lamp setup (Bentham ILD_75E powered by 2× Bentham 610 power sources with Bentham 418 optical chopper controller and 2-slot chopper blade) which was monochromated (Bentham TMc300 Monochromator), passed through a square 1.5 mm aperture and focussed onto the sample, with a masked active area of 0.04785 cm2. A reference silicon diode (Bentham DH-Si) with a known responsivity at the same fixed distance was used to calculate the EQE of the device. Data was collected using a Stanford Research Systems Model SR830 DSP lock-in amplifier connected to the cell.Data availability
The data supporting this article have been included as part of the ESI.†Conflicts of interest
There are no conflicts to declare.Acknowledgements
T. A. acknowledges finance support of DFG Heisenberg Programme, project AM 519/4-1. We acknowledge P. Valluri (University of Edinburgh) for additional supervision provided for M. S. during his PhD studies. We thank University of Edinburgh technicians G. Steedman and L. Mitchell for their assistance with equipment setup and maintenance, R. York and J. Bella for help with NMR measurements, G. Nichol for help with XRD measurements, A. Gromov for help with Raman measurements, and N. Cayzer for help with SEM/EDS measurements.References
- Statistical Review of World Energy, Energy Institute, https://www.energyinst.org/statistical-review, 2024 Search PubMed.
- Energy Production and Consumption, Global Data Change Lab, https://ourworldindata.org/energy-production-consumption, 2020 Search PubMed.
- C. Jiang, J. Zhou, R. Tang, W. Lian, X. Wang, X. Lei, H. Zeng, C. Zhu, W. Tang and T. Chen, Energy Environ. Sci., 2021, 14, 359–364 RSC
.
- R. Tang, X. Wang, W. Lian, J. Huang, Q. Wei, M. Huang, Y. Yin, C. Jiang, S. Yang, G. Xing, S. Chen, C. Zhu, X. Hao, M. A. Green and T. Chen, Nat. Energy, 2020, 5, 587–595 CrossRef CAS
- Y. Yin, C. Jiang, Y. Ma, R. Tang, X. Wang, L. Zhang, Z. Li, C. Zhu and T. Chen, Adv. Mater., 2021, 33, 2006689 CrossRef CAS PubMed
- C. Wu, W. Lian, L. Zhang, H. Ding, C. Jiang, Y. Ma, W. Han, Y. Li, J. Zhu, T. Chen and C. Zhu, Sol. RRL, 2020, 4, 1900582 CrossRef CAS
- C. Wu, C. Jiang, X. Wang, H. Ding, H. Ju, L. Zhang, T. Chen and C. Zhu, ACS Appl. Mater. Interfaces, 2019, 11, 3207–3213 CrossRef CAS PubMed
- L. Wang, D.-B. Li, K. Li, C. Chen, H.-X. Deng, L. Gao, Y. Zhao, F. Jiang, L. Li, F. Huang, Y. He, H. Song, G. Niu and J. Tang, Nat. Energy, 2017, 2, 17046 CrossRef CAS
- M. M. Nicolás-Marín, F. Ayala-Mato, O. Vigil-Galán and M. Courel, Sol. Energy, 2021, 224, 245–252 CrossRef
- Y. Pan, X. Hu, Y. Guo, X. Pan, F. Zhao, G. Weng, J. Tao, C. Zhao, J. Jiang, S. Chen, P. Yang and J. Chu, Adv. Funct. Mater., 2021, 31, 2101476 CAS
- C. Wu, L. Zhang, H. Ding, H. Ju, X. Jin, X. Wang, C. Zhu and T. Chen, Sol. Energy Mater. Sol. Cells, 2018, 183, 52–58 CAS
- S. Fan, C. Shi, K. Lv, Q. Wang, F. Guo and W. Chen, J. Nanopart. Res., 2021, 23, 42 CAS
- L. Zhang, W. Lian, X. Zhao, Y. Yin, T. Chen and C. Zhu, ACS Appl. Energy Mater., 2020, 3, 12417–12422 CAS
- W. Han, D. Gao, R. Tang, Y. Ma, C. Jiang, G. Li, T. Chen and C. Zhu, Sol. RRL, 2021, 5, 2000750 CAS
- Z. Li, X. Liang, G. Li, H. Liu, H. Zhang, J. Guo, J. Chen, K. Shen, X. San, W. Yu, R. E. I. Schropp and Y. Mai, Nat. Commun., 2019, 10, 125 Search PubMed
- X. Jin, Y. Fang, T. Salim, M. Feng, S. Hadke, S. W. Leow, T. C. Sum and L. H. Wong, Adv. Funct. Mater., 2020, 30, 2002887 CAS
- X. Wang, R. Tang, C. Jiang, W. Lian, H. Ju, G. Jiang, Z. Li, C. Zhu and T. Chen, Adv. Energy Mater., 2020, 10, 2002341 CAS
- Y. Zhao, S. Wang, C. Jiang, C. Li, P. Xiao, R. Tang, J. Gong, G. Chen, T. Chen, J. Li and X. Xiao, Adv. Energy Mater., 2022, 12, 2103015 CrossRef CAS
- S. Wang, Y. Zhao, B. Che, C. Li, X. Chen, R. Tang, J. Gong, X. Wang, G. Chen, T. Chen, J. Li and X. Xiao, Adv. Mater., 2022, 34, 2206242 CrossRef CAS PubMed
- L. Zhang, P. Xiao, B. Che, J. Yang, Z. Cai, H. Wang, J. Gao, W. Liang, C. Wu and T. Chen, ChemSusChem, 2023, 16, e202202049 CrossRef CAS PubMed
- Y. Huang, R. Tang, P. Xiao, B. Che, Y. Wang, H. Gao, G. Wang, C. Zhu and T. Chen, ACS Appl. Mater. Interfaces, 2022, 14, 54822–54829 CrossRef CAS PubMed
- X. Chen, B. Che, Y. Zhao, S. Wang, H. Li, J. Gong, G. Chen, T. Chen, X. Xiao and J. Li, Adv. Energy Mater., 2023, 13, 2300391 CrossRef CAS
- G.-Y. Chen, W.-X. Zhang and A.-W. Xu, Mater. Chem. Phys., 2010, 123, 236–240 CrossRef CAS
- R. Nie and S. I. Seok, Small Methods, 2020, 4, 1900698 CrossRef CAS
- Y. Huang, R. Tang, G. Wang, G. Li, B. Che, Y. Wang, W. Lian, C. Zhu and T. Chen, J. Mater. Chem. A, 2022, 10, 9892–9901 RSC
- P. Kowalczewski and L. C. Andreani, Sol. Energy Mater. Sol. Cells, 2015, 143, 260–268 CrossRef CAS
- S. Chen, M. Li, Y. Zhu, X. Cai, F. Xiao, T. Ma, J. Yang, G. Shen, A. Ke, Y. Lu, W. Liang, H.-Y. Hsu, C. Chen, J. Tang and H. Song, Adv. Energy Mater., 2022, 12, 2202897 CrossRef CAS
- B. Che, Z. Cai, H. Xu, S. Sheng, Q. Zhao, P. Xiao, J. Yang, C. Zhu, X. Zheng, R. Tang and T. Chen, Angew. Chem., Int. Ed., 2025, e202425639 Search PubMed
- Y. Zhang, S. a. Li, R. Tang, X. Wang, C. Chen, W. Lian, C. Zhu and T. Chen, Energy Technol., 2018, 6, 2126–2131 CrossRef CAS
- Y. C. Choi, D. U. Lee, J. H. Noh, E. K. Kim and S. I. Seok, Adv. Funct. Mater., 2014, 24, 3587–3592 CrossRef CAS
- E. Mathuthu, A. Janse van Rensburg, D. Du Plessis and S. Mason, Biochem. Cell Biol., 2021, 99, 465–475 CrossRef CAS PubMed
- E. Hafer, U. Holzgrabe, K. Kraus, K. Adams, J. M. Hook and B. Diehl, Magn. Reson. Chem., 2020, 58, 653–665 CrossRef CAS PubMed
- P. Charisiadis, V. G. Kontogianni, C. G. Tsiafoulis, A. G. Tzakos, M. Siskos and I. P. Gerothanassis, Molecules, 2014, 19, 13643–13682 Search PubMed
- R. S. Multani, T. Feldmann and G. P. Demopoulos, Hydrometallurgy, 2016, 164, 141–153 CAS
- C. Diliegros Godines, J. Santos, N. Mathews and M. Pal, J. Mater. Sci., 2018, 53, 11562–11573 CAS
- Z. Sui, S. Hu, H. Chen, C. Gao, H. Su, A. Rahman, R. Dai, Z. Wang, X. Zheng and Z. Zhang, J. Mater. Chem. C, 2017, 5, 5451–5457 CAS
- W. A. Pryor, J. Am. Chem. Soc., 1960, 82, 4794–4797 CAS
- J. R. Reddy, G. Ravi, P. Suresh, N. K. Veldurthi, R. Velchuri and M. Vithal, J. Therm. Anal. Calorim., 2014, 115, 1321–1327 CAS
- D. Ren, B. Fu, J. Xiong, Y. Wang, B. Zhu, S. Chen, Z. Li, H. Ma, X. Zhang, D. Pan, B. Zou and G. Liang, Adv. Mater., 2025, 37, 2416885 CAS
- Q. Zhu, W. Wang, Z. Chen, Z. Cao, W. Wang, X. Feng, H. Deng, C. Zhang, Q. Zheng, J. Wu, Y. Zhang and S. Cheng, Small, 2025, 21, 2408978 Search PubMed
Footnote |
| † Electronic supplementary information (ESI) available. See DOI: https://doi.org/10.1039/d5ta00947b |
| This journal is © The Royal Society of Chemistry 2025 |