
 Open Access Article
 This Open Access Article is licensed under a
 Creative Commons Attribution 3.0 Unported Licence
Structural evolution by heat treatment of soft and hard carbons as Li storage materials: a joint NMR/XRD/TEM/Raman study†
Jugo
Okabe
 a,
Yuan
Fang‡
b,
Isamu
Moriguchi
a and
István
Furó
*b
a,
Yuan
Fang‡
b,
Isamu
Moriguchi
a and
István
Furó
*b
aGraduate School of Engineering, Nagasaki University, Nagasaki 852-8521, Japan
bDivision of Applied Physical Chemistry, Department of Chemistry, KTH Royal Institute of Technology, Stockholm, SE-100 44, Sweden. E-mail: furo@kth.se
First published on 26th March 2025
Abstract
Thermally annealed soft carbon and hard carbon samples were investigated by a variety of methods. The ordering of the carbon matrix with increasing heat-treatment temperature was followed by X-ray diffraction (XRD), transmission electron microscopy (TEM) and Raman spectroscopy. The state of Li ions that can be incorporated in the evolved carbon structures was probed using 7Li NMR spectra and by 7Li NMR spin-relaxation that report the different aspects of order and disorder at the available sites. These latter observables were recorded at different temperatures that permitted separating the various structural and dynamic features (including Li ion diffusion) influencing them. Both the initial structures and their respective structural evolution were shown to be complex. While all observations pointed to an increasing order and an increasing size of domains upon increasing heat-treatment temperature, the change in Li capacity is either non-monotonic (soft carbon) or increasingly diverging from the graphite value (hard carbon). We propose that these, apparently, contradictory trends are partly caused by kinetic limitations. Heat treatment at 2500 °C turned the dominating fraction of the soft carbon to essentially graphite with regard to both atomic and electronic structures and long range order, yet also created a minor fraction with a disordered structure that is responsible for the total capacity exceeding that for graphite. Untreated hard carbon permitted metallic clusters, but heat treatment eliminated the necessary sites and/or access to those.
Introduction
In recent years, both soft carbons and hard carbons have been considered as potential anode materials for lithium-ion batteries (LIBs) and lithium-ion capacitors (LICs) because of their high capacity and superior rate performance compared to graphite electrodes. To be able to design a high-performance carbon anode using these materials, we must clarify the microstructures in them and their effect on the Li storage state and dynamics.The first microstructural models of soft carbons (SCs, graphitizable carbons) and hard carbons (HCs, non-graphitizable carbons) were suggested by Franklin who proposed that soft carbons consist of graphitic microcrystallites in a roughly parallel short-range arrangement relative to each other. Hard carbons were also modelled as graphitic microcrystallites but (i) arranged more randomly and (ii) with some crosslinks among them that (iii) facilitated voids in the structure.1 Upon heating (>2500 °C) under an inert atmosphere, the microcrystallites in soft carbons can re-arrange parallel to each other on all length scales and thereby the material anneals into graphite. On the other hand, the crystallites in hard carbons resist a similar re-arrangement and HCs scarcely graphitize completely even upon heating above 3000 °C.2,3 Several refinements4–7 to the Franklin model were subsequently put forward primarily by introducing curvature to graphene sheets that may be both (i) bundled constituents of and (ii) twisted/bent cross-links among domains of graphitic order. Yet, it is probably safe to say that a comprehensive model of disordered carbons8–10 and, among these, primarily hard carbon, remains to be constructed. In whichever case, SC and HC microstructures can be considered as co-existence of graphitic (rather ordered) and non-graphitic (disordered, probably in more than one way) domains, and, in materials prepared at high enough temperatures, the structure is essentially built by sp2 carbon atoms.8–10
SC and HC electrodes show characteristic lithiation/delithiation potential profiles that are completely different from that for graphite. In other words, the relevant electrochemical properties of carbonaceous materials greatly depend on their microstructure. Graphite electrodes store Li+ with staging intercalation between the constituting ordered graphene layers and exhibit stepwise potential plateaus corresponding to stage transitions. On the other hand, SC and HC electrodes typically exhibit sloping potential profiles without stepwise potential plateaus but slope down at low potential (near 0 V vs. Li/Li+). HC electrodes tend to show a more obvious low potential plateau than SC electrodes.3,11
Our current understanding of the Li storage state in these carbon materials and the storage mechanism during lithiation remains insufficient because of the complex SC and HC microstructures. Stevens and Dahn proposed that SC/HC lithiation and sodiation proceeds (i) by intercalation between graphene layers participating in locally ordered domains resembling graphite in the high potential slope region and (ii) filling voids in the low potential plateau region.12 Subsequently, they demonstrated the mechanism based on structural changes (interlayer distance and nanovoid volume) in both soft and hard carbon materials during lithiation and sodiation observed by in situ wide range X-ray scattering (WAXS) and in situ small angle X-ray scattering (SAXS).13 Neutron total scattering results seemed to concur with the proposed model.14 Complementing scattering, 7Li NMR is a useful tool to observe the Li storage state because it observes directly the Li ions within the microstructure. Many 7Li NMR studies in lithiated disordered carbons have been conducted so far, and the results were often interpreted in terms of three kinds of Li storage state grouped as (i) adsorption of Li ions on the surface of graphene sheets especially at defects, edges, and residual heteroatoms, (ii) intercalation of Li ions within graphitic bundles of graphene sheets, and (iii) formation of lithium clusters in voids.3,15 It seems that the mechanism (i) is relevant only for carbons heat-treated at rather low temperatures (500–1300 °C).16–20 With regard to mechanism (iii), Tatsumi et al. reported that Li stored in non-graphitizable (hard) carbon exhibited a quite large (over 100 ppm) frequency shift. Upon cooling, that shift showed itself to be a motionally averaged characteristic arising from two distinct peaks observable at low temperatures.21,22 These two peaks were attributed to Li ions in-between graphene layers (low shift) and (quasi-)metallic lithium clusters in voids (high shift). Lithium clusters of metallic character were observed only in HCs.19,21–23
Despite numerous studies, the effect of carbon microstructures on the Li storage state in HCs and SCs still remains unclear, primarily because of the lack of comprehensive/comparative studies (i) of different graphitization degrees (ii) by different methods. The ambition of the present study is to provide a remedy – perhaps partial, yet, in our opinion, useful – to that state of matter. On the material side, we explore a comparative series of HC and SC materials heat-treated from their initial state up to 2500 °C and then fully (see below) lithiated. On the characterization side, we make use of five main methods. Two of these are based on 7Li NMR but are different with regard to the material properties investigated. In particular, we record 7Li NMR spectra in a range of temperatures that provide information (frequency shift and quadrupole splitting) about the local state of Li ions averaged over different spatial (>nm, see below) extents. Besides spectra, we also record, in the same temperature range, the 7Li spin-lattice relaxation rate (1/T1, the inverse of the spin-lattice relaxation time T1)19,24–28 that has rarely been investigated in disordered carbon materials19,25,28 and was even more rarely related to the microstructure. As we are going to demonstrate, the observed relaxation rates can be rationalized as being the sum of electronic and quadrupolar terms. The quadrupolar contribution to the relaxation rate does not report about the average of local order but about the fluctuation of that order as Li ions thermally diffuse within the structure. In doing so, it gauges – roughly speaking – how far the Li environment is removed from that in graphite (that is, LiC6).
As the third method, we use XRD experiments that provide information not about the short-range order and its variation at the Li storage sites but about the long-range order of the carbon matrix that embeds the Li ions. The fourth method, transmission electron microscopy (TEM), provides intuitive observations of the variation of the same order while Raman spectroscopy enables us to provide a quantitative measure of the defect density and its change.
Finally, though limited to a single high (343 K) temperature, we have also exploited another method, diffusion NMR to obtain the self-diffusion coefficient of the Li ions in one SC sample (in other samples and at other temperatures, the relevant NMR signal parameters did not permit diffusion NMR studies). It is the slowing down of diffusion at low temperatures that suppresses the exchange of Li ions among storage sites so that it becomes slow with respect to the relevant NMR time scale.28 Under these conditions, the contributions from these sites become distinguishable in the spectrum.22,29 While the self-diffusion coefficient of Li ions in carbon materials has been measured by NMR24,27,28,30,31 it has been seldomly assessed in disordered carbons. It is useful to point out that diffusion NMR in carbon electrodes28,31 is less influenced by the process of de-solvation on the electrode–electrolyte interface, compared to relevant electrochemical measurements.31
Finally, and as detailed below, the data obtained for our series of HC and SC materials were analysed jointly in terms of structural evolution of storage sites and access.
Experimental
Petroleum coke Timrex PC40-OC (SCA, “A” for “as provided”), kindly supplied by Imerys Graphite & Carbon Switzerland Ltd (Switzerland), was used as soft carbon SC. Coal tar pitch-based carbon (HCA), kindly supplied by JFE Chemical Corporation (Japan), was used as hard carbon HC. The SCA (with the manufacturer-provided median particle size D50 of 14 μm) and HCA (with the manufacturer-provided D50 of 3 μm) powders were heat-treated at 1500, 2000 and 2500 °C for 1 hour under an Ar flow by Zhuzhou Xinyun Technology Development Ltd (China) yielding samples denoted, respectively, as SC1500, SC2000, and SC2500 on one hand and HC1500, HC2000, and HC2500 on the other hand. Artificial graphite was delivered by Kishida Chemical Co., Ltd.The crystallinity (or the lack thereof) of the carbon samples described above was evaluated by X-ray diffraction (Miniflex600-DX, Rigaku). Ni filtered Cu Kα radiation was used, and a semiconductor detector was employed as the X-ray detector. The powder carbon samples were loaded onto a Si sample holder with a depth of 0.3 mm.
A high-resolution scanning transmission electron (TEM) microscope (ARM-200CF, JEOL Ltd) in the transmission mode was used to obtain suitable images. The relevant powders were suspended in ethanol, the largest particles were permitted to sediment, and the remaining dilute suspension containing smaller particles was pipetted onto a copper mesh grid and dried. In addition to image recording, energy dispersive X-ray spectrometry (EDX) was performed in scanning transmission mode operated at 120 kV as elemental analysis. The EDX results (see Table S1†) confirm that the samples are essentially (99.9%) pure carbon with oxygen content being in the order of 0.1% or below.
The in-plane defects in graphene were quantitatively evaluated from the area ratio of the G-band and D-band (AG/AD1) by Raman spectroscopy (NRS-3200, JASCO Corporation) with a laser excitation wavelength of 532 nm.
The porosity of the samples was assessed using N2 adsorption/desorption isotherms at 77 K (BELSORP-Max, MicrotracBEL Corp.). The carbon samples were degassed at 120 °C for 2 h under vacuum prior to the measurement.
To evaluate the Li storage properties of the carbon samples described above, they were mixed with 10 wt% polyvinylidene difluoride (PVDF, Sigma-Aldrich) as a binder and 1-methyl-2-pyrrolidone (NMP, Sigma-Aldrich) and stirred using a mechanical mixer at 1000 rpm for 20 minutes to produce an electrode slurry. The slurry was coated on copper foil at a thickness of 100 μm and dried. These prepared carbon electrodes with 20 mm diameter (mass loadings of active materials are listed in Table S3†) were used as working electrodes and were assembled into pouch cells with Li foil (Sigma-Aldrich) as a counter electrode, 1 M LiPF6 in ethylene carbonate (EC)/diethyl carbonate (DEC) (1![[thin space (1/6-em)]](https://www.rsc.org/images/entities/char_2009.gif) :1 v/v, Sigma-Aldrich) as electrolyte, and Celgard 2300 (Celgard) as a polymeric separator. Lithiation of carbon electrodes was conducted on a potentiostat (VMP3, BioLogic). The lithiation (henceforth identified as complete lithiation) was accomplished by discharging at a constant current of 50 mA g−1, reaching 0.002 V vs. Li/Li+ from open circuit potential that was kept thereafter constant until reaching a cut-off current of 5 mA g−1 where the lithiation process was terminated.
:1 v/v, Sigma-Aldrich) as electrolyte, and Celgard 2300 (Celgard) as a polymeric separator. Lithiation of carbon electrodes was conducted on a potentiostat (VMP3, BioLogic). The lithiation (henceforth identified as complete lithiation) was accomplished by discharging at a constant current of 50 mA g−1, reaching 0.002 V vs. Li/Li+ from open circuit potential that was kept thereafter constant until reaching a cut-off current of 5 mA g−1 where the lithiation process was terminated.
After lithiation, the pouch cells were disassembled in an Ar-filled glovebox, and the Li metal foil and the separator were removed. Still in the glove box, the carbon electrodes (see their appearance in Fig. S1†) on the copper foil were washed by soaking in DEC for 5 minutes to remove the electrolyte from the carbon layer and then dried. After that, the carbon was carefully scraped off from copper foil and crushed into small flakes and filled (typical sample amount: 6–10 mg) into the bottom of an NMR sample tube hermetically closed with a screw cap lined with a Teflon septum (Wilmad), as has been described earlier.32 The air-tight nature of this sample enclosure was tested by observing Li metal similarly enclosed and kept under normal laboratory conditions for months without losing its metallic shine.
7Li NMR spectroscopic experiments at different temperatures (189–326 K) were performed on an Avance-II 300 MHz spectrometer (Bruker) at a resonance frequency of 116.6 MHz for 7Li using a probe (90° pulse length: 4.5 μs) home-built with extra isolation for long-time low-temperature studies. The temperature was regulated by varying the rate by which cold nitrogen gas flowed into the sample space. The shift scale is relative to the Li signal in aqueous solution of LiCl set to 0 ppm. The spin-lattice relaxation time (T1) was measured by conventional inversion recovery and obtained by fitting a single-exponential curve to the observed signal recovery. The Li+ self-diffusion coefficient in SCA was measured at 343 K by a pulsed-field-gradient stimulated-echo experiment performed on an Avance-III 500 MHz spectrometer (Bruker) equipped with a high-gradient probe (Diff60, Bruker) with diffusion pulse length δg = 1 ms, diffusion time Δ = 220 ms and the gradient strength g varied in 8 steps up to 1.3 T/m. The self-diffusion coefficient was obtained by fitting the conventional Stejskal–Tanner expression33 to the observed signal decay (see Fig. S6 in the ESI†) that provided DLi+ = 4.3 × 10⁻¹² m2 s−1. At lower temperatures and in other samples, the transverse relaxation of the signal was too rapid and did not permit meaningful diffusion experiments.
Results and discussion
Order/disorder of the carbon matrix
The collected XRD patterns are presented in Fig. 1. The peaks at 2θ ≈ 25° were assigned to the diffraction from the (002) plane in graphitic/graphite structures. Since the diffraction intensity at low angles is greatly influenced by the Lorentz-polarization factor and atomic scattering factor,34,35 we analysed the (002) diffraction peaks after suitable intensity correction. The data can be formally evaluated in terms of crystallite size along the graphene stacking direction (Lc) and in-plane size (La) using the Scherrer equation, see Table S2.† While such a classical analysis is still useful for carbon materials with disordered structures,36,37 the analysis includes a shape factor (Scherrer's constant), which is set based on rough assumptions. The numerical results depend a lot on these assumptions. Additionally, disordered carbon provides overlapping (00l) and (hk) reflections, further complicating the analysis. Here we used 0.89 for Scherrer's constant to evaluate crystallite size. Hence, while trends should be valid, the actual numbers in Table S2† must be treated with caution. | ||
| Fig. 1 X-ray diffraction patterns of graphite and soft carbon samples measured in a range of 2θ (a) from 15° to 35° and (b) from 30° to 90° and hard carbon samples measured in a range of 2θ (c) from 15° to 35° and (d) from 30° to 90°. | ||
In this context, it was proposed to refine parameters by fitting the entire XRD profile with theoretical model functions38–41 as implemented using a variety of software tools, such as CarbonXS GUI,38,42,43 Carbon Analyzer,40,44–46 and OctCarb (CarbX).41,47–50 Yet, in our (admittedly limited) experience, the results obtained in this manner seem to provide some results (primarily, in the hard carbon samples) that can go against most of the other observations here, such as decreasing apparent order upon heat treatment and feature sizes far above those discernible in the TEM images (see below). Moreover, these tools may not support analysis of multiphase materials. Hence, in this work we did not pursue further this avenue of potentially useful analysis.
In graphite we obtained a sharp peak at 2θ = 26.5° corresponding to the customary interlayer distance of d002 = 0.337 nm. SCA exhibited a very broad peak at 2θ = 25.8°, that indicates a large disorder with a larger average interlayer distance compared to graphite and small size of the ordered domains adding to the line width. In this latter respect, notice the broadening of all diffraction peaks indicating that the nature of disorder is not merely poor alignment of the bundled graphene layers. By heat treatment at increasing temperatures, the peak (and, indeed, all other peaks) of soft carbons gradually shifted to higher diffraction angles with sharpening. SC2500 yielded a sharp peak at 2θ = 26.4°, that is very close to graphite.
HC samples started out with more disorder relative to SC as signified by broader peaks that also shifted to higher diffraction angles with corresponding sharpening. Yet, the peaks did not sharpen in a homogeneous manner but rather split into two distinct (002) peaks, one at 2θ = 26.0° having retained a significant width and another at 26.4° having become slightly narrower (Fig. S2†). In other words, heat-treated HC samples exhibited several apparently distinct domains with structures of different states of disorder relative to graphite. These domains are large enough to provide distinguishable diffraction peaks. In particular, SC2500 and graphite provided clearly separated (100) and (101) peaks, whereas all HC samples showed a broad peak at 2θ ≈ 43°, which is attributed to (10) diffraction and lack of crystallinity in the graphene stacking direction (in other words, the stacking being turbostratic). The (10) peak width is also connected to orientational/crystalline persistence length within the constituting graphene sheets. Soft carbon samples showed thereby not only increasing orientational order but also increasingly orderly stacking consistent with graphene sheets fusing and lateral domain sizes of properly (that is, for graphite) stacked sheets growing. In contrast, the (10) peak in hard carbons sharpened only a little indicating the persistent lack of large laterally continuous graphitic order.
Relating to and visualising the XRD findings above, the TEM images display carbon microstructures that can be compared to that of the regular stacking of graphene sheets exhibited by graphite, Fig. 2e. Long-range order is lacking in both SCA and HCA (Fig. 2(a) and (b)), yet the spatial correlation length is clearly much longer in SCA. This is very well aligned with the XRD data. It is strikingly obvious that order develops upon heat treatment in both cases, reaching an almost graphitic state (yet, with discernible defects) in SC2500 (see Fig. 2c1). Moreover, all images obtained for any particular sample except SC2500 showed rather similar features for that given sample. In SC2500, there was a larger spread, and we illustrate this in Fig. 2 by showing two representative examples for the different types of structures visible.
 | ||
| Fig. 2 TEM images of (a) SCA, (b) HCA, (c1 and c2) SC2500, (d) HC2500, and (e) graphite. The two SC2500 images represent the larger spread of features that appeared in that sample. | ||
The developing order is signified with a decrease in features that, in Raman spectroscopy, are associated with defects or edges in carbon samples.51–53 Specifically, the two prominent peaks at 1340 cm−1 and 1580 cm−1, assigned respectively as D1 (disordered) and G (graphitic) bands, in Fig. 3 are the typical reporters of disorder features. Customarily, the D1-band is attributed to the A1g vibration mode, localized to the vicinity of defects in graphene, while the G-band is attributed to the E2g vibration mode in (defect-free) graphene.54 Hence, the area ratio of the G-band to D1-band (AG/AD1) shown in Table S2,† is another (that is, beyond XRD and TEM) indicator of graphitic order. Indeed, the AG/AD1 ratio increased upon heat treatment of both SC and HC, indicating fewer defects or edges as graphitic domains grow. Yet, while the general trend is clear, one should treat the actual indicator values with caution. While Raman spectroscopy shows SC2500 to be more ordered than our graphite reference (Table S2†), TEM images in Fig. 2 indicate the opposite relation, while the analysis of XRD data yields almost identical Lc and La figures for these two samples.
 | ||
| Fig. 3 Raman spectra (yellow) of (a) soft carbons and graphite and (b) hard carbons (red solid line: deconvoluted components, black broken line: sum of deconvoluted components, and green solid line: background). | ||
While the increase in stacking order (that is, increasing Lc) appears to be quite similar, the main difference between SC and HC seems to be the lack of topological limitations in the first case (at least, not on the length scale explored). In other words, there is less hindrance in SC2500 for having adjacent regions unfurled and reoriented to attain a common crystallographic state. In contrast, HC2500 retains an entwined manifold of twisted and bent bundles that are graphitic or turbostratic on the in-plane length scale (La) that is in the order of 10 nm. While the two-dimensional image in Fig. 2(d) does not permit us to discern the nature of the knots (that are, though, clearly present), the sheer fact of having these knotted/entwined features suggests that the structural subunits that create knots have a semblance to ribbons (that is, in contrast to broad sheets). These ribbons are then bent, splayed along planes, torn across planes and then realigned and merged with parts that arrive from nearby ribbons. In other words, there might be a long-range linear continuity along constituting individual graphene sheets (even if these sheets are continually morphed in many ways). In this sense, HC2500 appears to be well represented using the Jenkins model.55 Since heteroatoms are virtually absent in the system (see Table S1†) the limiting factor in structural re-organization seems to be a primarily topological one that may be present already in the original structure in HCA (that is, if entangled graphitic regions are large enough, the free energy cost for reorganization becomes that of breaking them up and this may turn out to be too high). This original structure is rather far from graphite by all measures explored here and a structural model such as that of Harris6 that conjures more extensive and more complex short-range disorder might be a good descriptor. If so, heat treatment lets HC evolve between states illustrated by these two models (unfortunately, it it difficult to condense the disorder of either model into simple numerical metrics).
We have also recorded the N2 adsorption isotherms at 77 K in some of the carbon samples as displayed in Fig. S3.† According to the IUPAC classification,56 the behaviour assigned to overlapping adsorption–desorption curves is categorized as type-II (no pore condensation) with the implication of having no micro- or nanopores that are accessible to N2. The BET specific surface area is below 10 m2 g−1 in all cases. We return to this point below.
Lithiation behaviour
For the compounded reason of (i) the intended use of the carbons investigated here being lithium storage and (ii) because 7Li NMR experiments presented below require lithiation, we exhibit here first the discharge (that is, lithiation using Li metal counter electrode) curves of carbon samples that are displayed in Fig. 4. The SC samples all showed sloping potential profiles. With increasing heat-treatment temperatures (HTTs), the apparent (that is, as achieved by the applied lithiation protocol) capacity first decreased and then increased (Fig. 4(a) and (b)). Specifically, SC2500 exhibited, similarly to graphite, potential plateaus with accompanying additional slope potential regions, while having a higher total capacity than graphite. The measured rather high capacity of HCA arises from potential keeping regions at 0.002 V vs. Li/Li+ in addition to potential sloping regions. By heat treatment, the capacity associated with potential keeping was lost, and the capacity of heat-treated hard carbons is mainly reached in the potential sloping region. The capacity of hard carbon samples decreased all the way with increasing HTTs, that is, no capacity was regained at the highest HTT. The lithiation capacity of each carbon electrode is listed in Table S3;† as is also shown in Fig. 4, there is a large variation in capacity by heat treatment for both SC and HC. The reversibility of lithiation/delithiation for SCA and HCA was examined through charge/discharge tests. The initial coulombic efficiencies were 69.5% for SCA and 70.5% for HCA, indicating no significant difference in reversibility (Fig. S4†).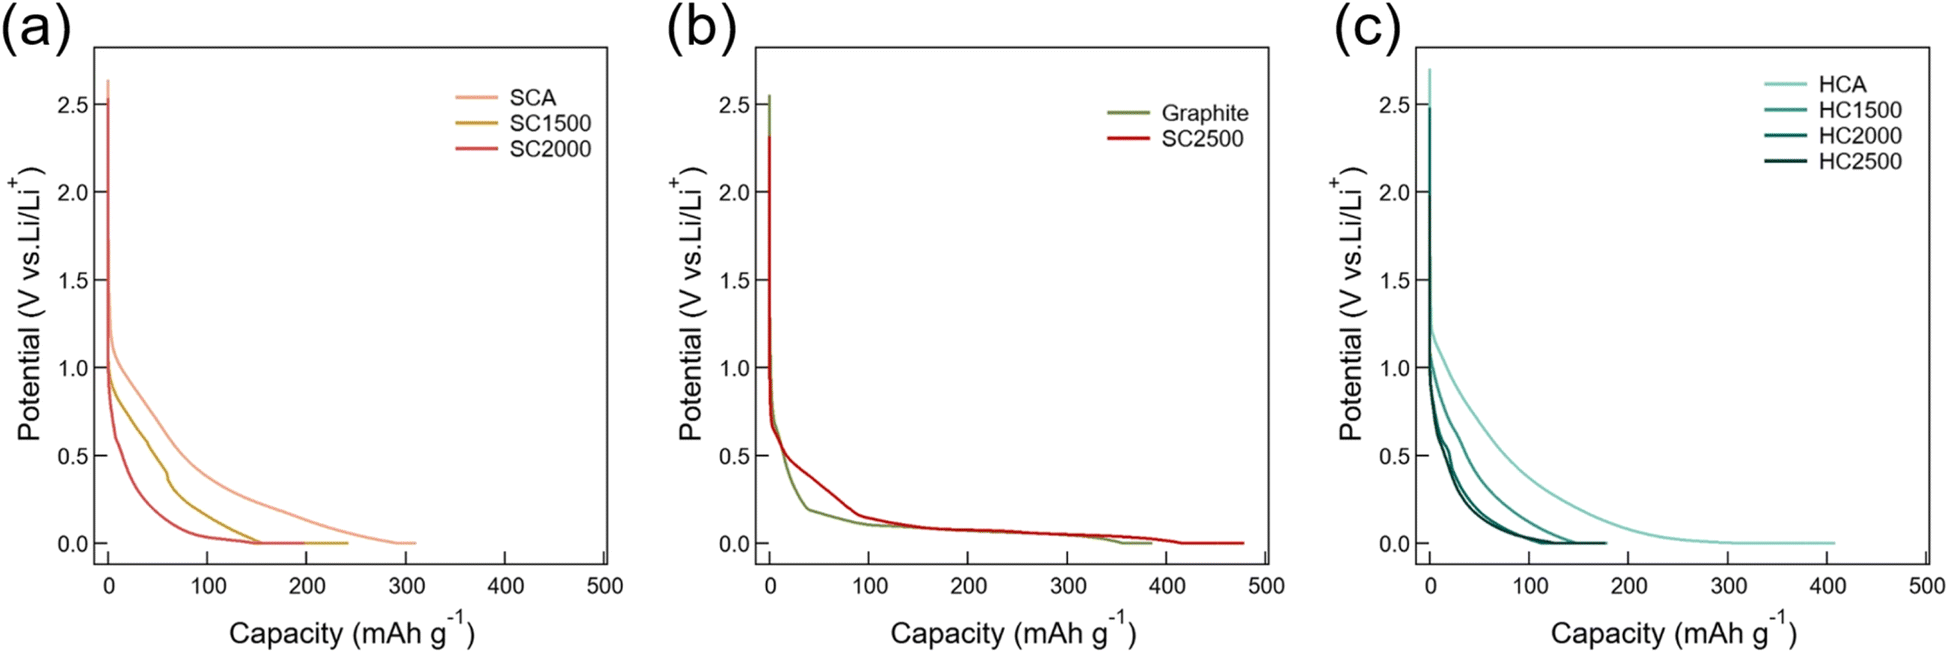 | ||
| Fig. 4 Galvanostatic discharge curves during lithiation of (a) SCA, SC1500 and SC2000, (b) graphite and SC2500, and (c) HCA, HC1500, HC2000, and HC2500. | ||
As shown in Fig. S1,† SC2500 exhibited a golden colour akin to lithiated graphite which suggests the formation of some LiC6. The lithiated soft carbon at lower HTT was reddish that may indicate some similarity with regard to the electronic state to LiC12 (red colour). Hard carbons did not show any discernible colour change upon lithiation.57
7Li NMR spectra and their temperature dependence
The 7Li NMR spectra of all lithiated carbon samples measured at room temperature are shown in Fig. 5. As has been verified and discussed in detail elsewhere,32 the 7Li NMR integral intensities (if that of the central peak, then properly scaled) are proportional to the Li content. By increasing HTT, one prominent feature of SC is increasing frequency shift δ which, plausibly, is contributed by both diamagnetic/paramagnetic (chemical shift by orbital electrons) and paramagnetic (Knight shift connected to conduction electrons) effects. The 23 ppm shift obtained in SCA is typically associated with lithium intercalated in turbostratic structures58 while the 49 ppm obtained in SC2500 is roughly a value assigned to LiC6.58 In addition to the shift change for the main peak, an additional smaller peak appears in SC2500, roughly at 13 ppm. An unambiguous assignment of shifts to specific structural motifs in complex materials such as disordered carbon is clearly difficult. Yet, low (<20 ppm) shifts were typically associated with more extensive disorder (prepared at relatively low temperatures <1600 °C)16–20 that is beyond turbostratic order. Henceforth, we refer to states that display such low shifts as “disordered” by which we imply that they arise from regions that lack a quasi-parallel arrangement of graphene-like sheets. The appearance of such a low shift in SC2500 after heat treatment suggests some remnant partial disorder while most regions graphitize. Still, this assignment permits a strong underlying structural diversity within the disordered region. | ||
| Fig. 5 7Li NMR spectra of fully lithiated (a) graphite and soft carbon samples and (b) hard carbon samples recorded at room temperature (293 K). The spectra are mass normalized, and the shift values explicitly given refer to the SCA/SC2500 and HCA/HC2500 samples. | ||
Besides the shift evolution, the spectra show the appearance of long-range order upon heat treatment. For SCA, there are no distinct quadrupolar satellites detected but, instead, the satellite transitions (for I = 3/2 nuclei as 7Li, between nuclear spin states m = 3/2 to m = 1/2 and m = −1/2 to m = −3/2) manifest as a broad peak underlying the narrower central (m = 1/2 to m = −1/2) peak.59,60 Such spectral appearance is a signature of the motional averaging of the quadrupolar coupling χQ that is dependent on the orientation of the axis characterizing the local order with respect to the external magnetic field. If persistence length (domain size) of local order is less than the path length over which Li ions diffuse during the time corresponding to the inverse of χQ, and if neighbouring regions are not oriented in the same manner, the spectra do not exhibit distinct satellite peaks but instead have an appearance as indeed for SCA. For SC1500 and SC2000, the spectra become generally broader (and for SC2000, asymmetric toward the high-shift side foreshadowing the appearance of the graphite-like shift at 2500) that may indicate some growth of the local domains (and thereby a slower averaging process). Finally, the spectrum of SC2500 exhibits distinct quadrupolar satellite peaks at the same quadrupole frequency as that for graphite. (Note here that the observed quadrupole splitting between the satellite peaks of ΔνQ = 47 kHz in our graphite samples – see also Fig. S5 in the ESI† – has double the value observed in “powder” spectra of LiC6.27 This can be caused by field-induced orientation of flakes as was also observed by others61). Hence, the majority – except the regions that contribute to the small peak at approx. 23 ppm – of the SC2500 sample exhibits a long-range order very similar to that of graphite.
The trends observed in HC samples are very different from those in the SC samples. There is a complete lack of any signature of long-range order, irrespective of HTT. Moreover, shift changes are quite opposite to those in SC samples; namely the HCA sample exhibits a high shift of 64 ppm, indicating some conductive/metallic contribution while heat treatment moves the main peak to lower frequency shifts with a smaller peak at graphitic shift appearing in HC2500.27
A more reliable assignment of the observed spectral features can be made on the basis of the temperature-dependent 7Li NMR spectra of SCA, HCA, SC2500 and HC2500 shown in Fig. 6. First of all, upon decreasing the temperature the spectral shape of SCA resembles more of SC1500 and SC2000 at room temperature, thereby confirming that these spectral shapes are a consequence of slower (that is, relative to SCA) averaging of spatially varying quadrupolar coupling. In the case of SC1500 and SC2000, this slower averaging is a consequence of growing domain size while in the case of the temperature-dependent spectra in Fig. 6(a), the reason is slower diffusion. The shift remains roughly unchanged which reflects that, despite some possible distribution of properties, the environment is turbostratic down to rather small length scales (see the discussion below on domain size ranges). SC2500 is dominantly graphitic with δ = 49 ppm and variation of spectral shape with temperature is similar to that shown by LiC6, see Fig. S5.† The detection of a small peak at 13 ppm being separate from the main graphitic peak means that the domains containing the Li nuclei that contribute to the 13 ppm peak must be large enough (see below; the absence of any sign of a 13 ppm contribution in SCA can be a consequence of either the lack of that environment in SCA or small domain size with resulting fast exchange) so that diffusional exchange with the graphitic region does not take place. The additional feature of broadening of the 13 ppm peak upon lowering temperature may indicate that there is a significant heterogeneity in the electronic environment within these domains.
 | ||
| Fig. 6 Temperature-dependent 7Li NMR spectra of fully lithiated (a) SCA, (b) HCA, (c) SC2500, and (d) HC2500. The shift values given refer to the 293 K data. For best visibility, maximum spectral amplitudes within the separate series of the separate panels were set to the same value. | ||
The temperature dependence of the HCA spectra provides an immediate explanation for the observed high room-temperature shift. Namely, at low temperature there appears a metallic peak in the vicinity of 200 ppm and another peak at around 24 ppm. It is likely that the spectral appearance is still influenced by some exchange effects (“slow exchange”)62 and the two peaks should move even more to the opposite direction upon further lowering the temperature. Plausibly, the sudden drop of shift in the room temperature spectra between HCA and HC1500 is a consequence of the elimination by heat treatment of the sites (or, access to them) that permitted the growth of metallic domains within them.
The temperature dependence of the HC2500 spectrum is primarily showing the general slowing down of Li ion dynamics with the two observable peaks at 47 (graphitic) and 17 (disordered) ppm persisting. At the lowest explored temperature, the graphitic peak attains observable quadrupolar satellites with a splitting of roughly ΔνQ = 25 kHz indicating that, at this temperature, the diffusional exchange out of the graphitic domains starts to get slow. Yet, the intensity ratios suggest that a majority of the HC did not obtain long-range graphitic order even at 2500 °C.
In the discussion above, we repeatedly referred to domain sizes in relation to diffusional path length and here we provide some quantitative considerations. The diffusional path length is expressed as
| 〈r2〉 = 6DLi+τ | (1) |
 | (2) |
If the diffusional exchange is fast, relative to this time, there is no separate signal observable for the involved components. In the case of slower exchange, separate components provide separate signal contributions. To illustrate this, the approx. 4 kHz frequency difference between the 49 ppm and 13 ppm peaks in Fig. 6(c) sets the limiting time τ between fast and slow exchange regimes to roughly 100 μs. The same quantity is roughly 20 μs for the HCA with spectra displayed in Fig. 6(b).
To estimate domain sizes, we need in addition estimates of the ion self-diffusion coefficients that are difficult to come by. We obtained DLi+ = 4.3 × 10⁻¹² m2 s−1 at 343 K in SCA which is in a similar order to the value measured by Fang et al. (DLi+ ∼10−12 m2 s−1)28 in a hard carbon material. At lower temperatures, diffusion slows down. While the extent of this effect is not readily accessible, Fang et al. estimated, based on the temperature dependence of the spin-lattice relaxation times,28 that diffusion below 200 K becomes roughly two orders of magnitude slower than that at 343 K. We rely here on the same estimate. Hence, we obtain viaeqn (1) and (2) that the relevant metallic domain size in HCA (Fig. 6(b)) is in the order of a few nanometers, while in SC2500 and HC2500 the domains providing the two observable peaks must be >10 nm. For these latter cases, we can get stricter estimates based on the spin-lattice relaxation behaviour, see below. In addition, the appearance of quadrupolar satellites in the HC2500 sample suggests that some regions of it must attain graphitic-like order with a persistence length in the order of 10 nm. Indeed, this is well aligned with the appearance of some features in Fig. 2d.
Finally, assuming that the observed frequency shift in HCA is the fast-exchange population average
| δ = Pmetallic·δmetallic + (1 − Pmetallic)·δnon-metallic | (3) |
Li+ motion and spin relaxation
The T1 relaxation times measured in the range 189–326 K are listed in Table S4,† and the temperature-dependent 7Li spin-lattice relaxation rates of the lithiated carbon samples are displayed in Fig. 7(a). In this system, spin-lattice relaxation is contributed by two factors, (i) the fluctuating hyperfine interaction between conduction electrons and the nuclear spin and (ii) the quadrupole coupling that is rendered fluctuating by the migration of Li ions over available sites. To be effective in causing spin-lattice relaxation, the site-to-site variation of the quadrupole coupling must be strong and must happen on the temporal scale close to the inverse of the Larmor frequency (here, 116.6 MHz). While we cannot a priori assume that this mechanism dominates in our disordered structures, we can see that, in LiC6, the conduction electron term dominates. Namely, spin-lattice relaxation caused by fluctuating hyperfine interactions with conduction electrons must follow the Korringa–Pines relation63,64 that predicts a constant T·T1 and thereby a relaxation rate that is linearly proportional to the temperature. Indeed, our data provide T·T1 = 587 ± 5 s K by a linear fit to the data below 300 K, see graphite data in Fig. 7(a); it has been reported that LiC6 does not obey the Korringa–Pines relation above 300 K exactly because of Li ion motion.27,65 The obtained T·T1 product, that is a characteristic of the electron density at the Fermi level, is close to the values reported previously by Estrade (650 ± 15 s K) et al.65 and Langer (600 ± 120 s K) et al.27 | ||
| Fig. 7 (a) Temperature dependence of spin-lattice relaxation rate 1/T1 of HCA (δ = 24–64 ppm) (light green closed square), SCA (δ = 23 ppm) (orange closed circle), HC2500 (δ = 17 ppm) (dark green closed square), HC2500 (δ = 47 ppm) (dark green open square), SC2500 (δ = 13 ppm) (red open circle), SC2500 (δ = 49 ppm) (red closed circle), and graphite (olive green closed circle). The inset shows an enlargement of the 1/T1 changes. The olive green broken line is the slope of 1/T1 changes in LiC6. (b) Temperature dependence of the quadrupolar component of 1/T1 that is obtained viaeqn (4), see text. | ||
The main 7Li component of SC2500 (δ = 49 ppm) behaves identically to LiC6 with relaxation thereby dominated by conduction electrons. Indeed, this is a new and independent assessment of the structural convergence of SC upon heat treatment to graphite. Another possible conclusion to draw from the convergence is that, locally, the electron conductivity in SC2500 is the same as that in graphite. If any difference is shown in macroscopic (electronic) conductivity, that difference must then be a consequence of discontinuous conduction pathways.66
The minor component in SC2500 (δ = 13 ppm) relaxes differently from the major component. There is also a difference between the relaxation rates for the (δ = 17 ppm)-component and the (δ = 47 ppm)-component in HC2500. The fact that no average (and thereby identical for the different peaks) relaxation rate is detected in either SC2500 or HC2500 provides us with new and stricter estimates for the domain size in these materials viaeqn (1) and (2) where we set τ to the (shorter of the) longitudinal relaxation time. In addition, we can rely on the data obtained at high temperature where we can assume that the self-diffusion coefficient is in the order of 10−12 m2 s−1. Hence, we can estimate that in SC2500 and HC2500 the domains that provide the two distinct signals and accompanying relaxation rates must be of ≳μm size. To clarify, this conclusion does not mean that there is no structural variation in the respective disordered domain over shorter length scales, but it means that the disorder is localised in continuous μm-scale regions. Because of this size range, the TEM images of SC2500 (as in Fig. 2(c)) with approx. 50 nm field of view may not capture all the disordered domains.
The behaviour of the other systems and the minor component in SC2500 is deviating from that shown by graphite and the major component of SC2500. Yet, all these systems (with the exception of HCA, see Fig. 7(a)) converge, at low temperature, toward the graphite behaviour. This can be explained as a consequence of disordered carbon structures in all the materials and components where the Li ions move by thermal activation among a greater variety of local environments with a greater accompanying fluctuation of the quadrupole coupling than that in graphite. The apparent convergence arises then because of the slowing down of the thermally activated diffusion (it cannot be a consequence of faster exchange, since we experience it upon decreasing temperature).
If we rely on the hypothesis presented above, we can further analyse the observed relaxation rates by having them represented as sums of electronic and quadrupolar rate contributions67
 | (4) |
The electronic rate contribution in eqn (4) can be derived using the Korringa–Pines relation that predicts it to be proportional (ideally,67 by a constant factor) to the square of the Knight shift.63,64 Assuming that the shown frequency shift is dominated by conduction electrons (this is almost certainly an overestimate, in particular for the components with small frequency shifts; the chemical shift of Li ions in different materials is roughly in the −3 to + 8 ppm range,68 with most compounds within the narrower interval of −1 to +3 ppm (ref. 69)), simple scaling of the graphitic contribution (see above) provides an (over)estimate the electronic term for the other peaks. By subtracting that estimate from the total rate, an estimate of the quadrupolar term as presented in Fig. 7(b) can be obtained. The horizontal scale in this figure is, as customary, set to the inverse temperature and the vertical scale to logarithmic to reflect the thermally activated nature of the underlying ionic migration. Although logarithmic-scale presentations are known to be forgiving with regard to discrepancies of underlying models, it is still satisfying to see linear variations in Fig. 7(b). The slopes provide the activation energies that are similar (10–12 kJ mol−1, close to the values obtained in related systems28) for all structures that are far from graphitic (SCA, HCA, and the low-shift components in both SC2500 and HC2500). On the other hand, the activation energy obtained for the minor graphitic component in HC2500 is significantly higher, as is, indeed, expected for a more ordered structure. A relevant comparison here is the ∼50 kJ mol−1 activation energy obtained for Li ion translational diffusion in LiC6.27
Structure and apparent capacity
The conundrum hidden in our results is the following: by all measures, both HC and SC exhibit monotonically increasing ordering upon increasing HTT. This seems to be a rather general feature shared by many other heat-treated (thermally annealed) systems. Specifically, other studies in disordered carbons showed the same trend.37,66,70–72 Recent HRTEM investigations highlighted that with increasing heat-treatment temperature there is an increase not only in the visible structural order but in several independent characteristics of order such as apparent crystallinity, the number of stacking layers and interlayer spacing.73 One should also note that heat treatment of hard carbons also lowered the barrier for charge/ion transfer at the electrolyte/carbon interface.74Clearly, while all the different methods used here signify increasing ordering in both SC and HC systems, the two carbon sorts are different with regard to the end point they reach in their respective evolutions (SC becomes seemingly graphite-like while HC does not so). Yet, the capacity does not evolve monotonically but decreases first in both systems and, finally, recovers in SC2500 to a value that exceeds that for graphite. A similar behaviour was already observed in PVDC-based hard carbons.71
The most natural conclusion is that the capacity decrease is largely connected to structural features that do not leave a sufficiently strong imprint in the detected experimental parameters. There are two exceptions to this. In HC, the metallic clusters detected in HCA are absent in HC1500 that could easily account (see discussion in connection to eqn (3)) for a significant part of the observed capacity decrease. The metallic clusters in HCA are probably very small (∼nm) so that surface effects (interaction with the carbon matrix) may significantly lower the Li chemical potential relative to that in bulk metallic Li. Indeed, there seems to be ample space for small voids in HCA as is shown by Fig. 2b. HCA shows no accessible pores by N2 gas adsorption, but Li ions can, in contrast to N2 molecules, traverse some carbon structures (such as in-plane diffusion in graphite) and reach voids/pores (closed to N2) to condense into metallic Li. In contrast, in HC2500 the pores are much larger.
In SC, the higher-than-graphite capacity of SC2500 may be connected by the remaining minor fraction of defective structures leaving the peak at 13 ppm as an imprint. It is tempting to relate the environments providing the two different chemical shifts (49 ppm and 13 ppm) to the different sorts of TEM images (see Fig. 2c) that can be observed in that sample. Yet, the different relaxation times for these two components set the sizes of the corresponding domains to ≳μm while the field of view of the TEM images is more than an order of magnitude less than that.
A plausible hypothesis is that the apparent loss of capacity is connected, primarily, not to the loss of available sites for Li storage but to the slowing down of kinetics. Recall that lithiation was terminated upon reaching the cut-off current of 5 mA g−1 in the potential keeping region. Hence, parts of the sample with decreased access to Li-ion transport pathways may not be filled at a rate set by the cutoff current. In HCA, highly curved and defective graphene-like sheets (similar ones depicted in the Harris model6) interspersed by voids (within which metallic domains could grow) permit good access by Li ions. As HCA evolves into HC2500, more ordered and thick multilayer ribbons73 become the dominant structural unit (see Fig. 2d) that may effectively block Li transport across them (that is, in the direction of the c axis) to some regions of the sample. Yet, as is reflected by the frequency shifts of the two observable 7Li NMR peaks, most of these domains lack graphitic stacking.
It is more difficult to explain the SC observations. Clearly, the structure evolves toward graphite, but that evolution has elements that may, at least partly, be independent from each other. The first element is the ordering of the domains parallel to each other as indicated by the apparent slowing down of the orientational modulation of the quadrupole coupling signified by the broadened features in the SC1500 and SC2000 spectra, see Fig. 6(a). The second element is constituted by having the graphene sheets in well-ordered domains properly stacked relative to each other (see the evolution of the (002) diffraction peak, Fig. 2a and c for TEM images, and the graphitic shift of 46 ppm appearing for SC2500). The third element is, plausibly, the fusing of graphene sheets constituting the different domains into more extended sheets.73 While ordering should facilitate ion migration along the sheets, fusing the sheets may provide additional hindrance for transport across. It may be so that at lower HTT we see the effect of fused sheets dominating over the other features, thereby leading to kinetic bottlenecks in Li transport.
Conclusions
Reading the relevant literature, one notices that adjectives used to be associated with hard and also soft carbons vary but tend nevertheless to be synonymous with either “complex” or “elusive” or both. Upon conclusion of the study summarized above we retain the notion of these carbons being complex but hope that they became slightly less elusive. Our hope is based on two general factors. First, irrespective of the structure at the outset, thermal annealing typically facilitates order. Tracking the trajectory of growing order and its consequences should be informative, also about the starting point. Secondly, we use a combination of methods that are broadly and in a complementary manner informative of the relevant structural features. The same strategy of combining complementary methods has been used, for example, to assess sodium storage in disordered carbons.75–85 Hence, XRD data probe the state of the carbon matrix while 7Li NMR spectra and relaxation rates recorded in a wide temperature range inform about the state of the Li ions that can be accommodated in the evolving carbon structures. TEM images provide graphic illustrations of structures that may appear while Raman spectroscopy informs about the defects present in the system. A connection between these broad sets of data is provided by the galvanostatic discharge curves terminating at the apparent capacities.While some of the conclusions drawn can be specific to the particular soft and hard carbons used in this study, it seems to be generic that most of the soft carbon treated at 2500 °C becomes something that is very close to pure graphite both with regard to atomic and electronic structures. Yet, it also retains a minor fraction of disordered carbon, and we associate that disordered domain as the provider of the extra capacity over graphite we find in this material. It is important to note that the characteristic size of such disordered domains is large (≳μm) and therefore such domains cannot be easily identified as edges/defects. It seems more probable that the SC samples studied here have a multiphase character.
In the starting material for the hard carbon series, a significant fraction of Li uptake is in the form of metallic clusters, presumably accommodated in small voids. Upon heat treatment, these voids may either disappear or become larger, and, in the latter case, surface effects may not be sufficient to stabilize metallic clusters in them. Other sites may be rendered unavailable, probably because of slow kinetics, by heat treatment.
The observed features point to the complex nature of “ordering” and its diverse consequences. As one example, ordering clearly manifests in more regular stacking of less defective graphene sheets that should facilitate Li migration along the sheets. Yet less defective graphene sheets can also hinder Li migration across them. Despite providing questions for any answers obtained, we deem that this line of investigation is promising and hope to continue it.
Data availability
The data supporting this article have been included as part of the ESI.† The raw NMR data are available at Zenodo at [https://doi.org/10.5281/zenodo.13986199].Author contributions
Jugo Okabe: conceptualization, methodology, investigation, formal analysis, data curation, visualization, writing – original draft. Yuan Fang: investigation, data curation. Isamu Moriguchi: conceptualization, funding acquisition, supervision, writing – review & editing. István Furó: conceptualization, funding acquisition, methodology, resources, supervision, writing – review & editing.Conflicts of interest
There are no conflicts to declare.Acknowledgements
This research was partially supported by grants from the Japan Society for the Promotion of Science (JSPS KAKENHI Grant Number: 22H00345), the Japan Science and Technology Agency (Grant Number: JPMJFS2134), the Swedish Energy Agency (Grant Number: P2023-00097) and the Swedish Research Council (Vetenskapsrådet, Grant Number: 2023-05555). Prof. Göran Lindbergh is thanked for help with sample preparation and for useful comments.Notes and references
- R. E. Franklin, Proc. R. Soc. London, Ser. A, 1951, 209, 196–218 CAS.
- D. Saurel, B. Orayech, B. Xiao, D. Carriazo, X. Li and T. Rojo, Adv. Energy Mater., 2018, 8, 1703268 CrossRef.
- L. Xie, C. Tang, Z. Bi, M. Song, Y. Fan, C. Yan, X. Li, F. Su, Q. Zhang and C. Chen, Adv. Energy Mater., 2021, 11, 2101650 CrossRef CAS.
- L. L. Ban, D. Crawford and H. Marsh, J. Appl. Crystallogr., 1975, 8, 415–420 CrossRef.
- S. J. Townsend, T. J. Lenosky, D. A. Muller, C. S. Nichols and V. Elser, Phys. Rev. Lett., 1992, 69, 921–924 CrossRef CAS PubMed.
- P. J. F. Harris and S. C. Tsang, Philos. Mag. A, 1997, 76, 667–677 CAS.
- A. P. Terzyk, S. Furmaniak, P. J. F. Harris, P. A. Gauden, J. Włoch, P. Kowalczyk and G. Rychlicki, Phys. Chem. Chem. Phys., 2007, 9, 5919–5927 RSC.
- V. Georgakilas, J. A. Perman, J. Tucek and R. Zboril, Chem. Rev., 2015, 115, 4744–4822 CrossRef CAS PubMed.
- V. Uskoković, Carbon Trends, 2021, 5, 100116 CrossRef.
- M. Monthioux, Carbon Trends, 2024, 14, 100325 Search PubMed.
- M. Winter, J. O. Besenhard, M. E. Spahr and P. Novák, Adv. Mater., 1998, 10, 725–763 CrossRef CAS.
- D. A. Stevens and J. R. Dahn, J. Electrochem. Soc., 2000, 147, 1271 CrossRef CAS.
- D. A. Stevens and J. R. Dahn, J. Electrochem. Soc., 2001, 148, A803 CrossRef CAS.
- M. Nagao, C. Pitteloud, T. Kamiyama, T. Otomo, K. Itoh, T. Fukunaga, K. Tatsumi and R. Kanno, J. Electrochem. Soc., 2006, 153, A914 CrossRef CAS.
- L. Zhao, Z. Hu, W. Lai, Y. Tao, J. Peng, Z. Miao, Y. Wang, S. Chou, H. Liu and S. Dou, Adv. Energy Mater., 2021, 11, 2002704 CrossRef CAS.
- Y. Mori, T. Iriyama, T. Hashimoto, S. Yamazaki, F. Kawakami, H. Shiroki and T. Yamabe, J. Power Sources, 1995, 56, 205–208 CrossRef CAS.
- N. Takami, A. Satoh, T. Ohsaki and M. Kanda, Electrochim. Acta, 1997, 42, 2537–2543 CrossRef CAS.
- N. Takami, A. Satoh, M. Oguchi, H. Sasaki and T. Ohsaki, J. Power Sources, 1997, 68, 283–286 CrossRef CAS.
- S. Yamazaki, T. Hashimoto, T. Iriyama, Y. Mori, H. Shiroki and N. Tamura, J. Mol. Struct., 1998, 441, 165–171 CrossRef CAS.
- S. Alvin, H. S. Cahyadi, J. Hwang, W. Chang, S. K. Kwak and J. Kim, Adv. Energy Mater., 2020, 10, 2000283 CrossRef CAS.
- K. Tatsumi, T. Kawamura, S. Higuchi, T. Hosotubo, H. Nakajima and Y. Sawada, J. Power Sources, 1997, 68, 263–266 CAS.
- K. Tatsumi, J. Conard, M. Nakahara, S. Menu, P. Lauginie, Y. Sawada and Z. Ogumi, Chem. Commun., 1997, 687–688 CAS.
- K. Tatsumi, J. Conard, M. Nakahara, S. Menu, P. Lauginie, Y. Sawada and Z. Ogumi, J. Power Sources, 1999, 81, 397–400 Search PubMed.
- P. Freiländer, P. Heitjans, H. Ackermann, B. Bader, G. Kiese, A. Schirmer, H.-J. Stöckmann, C. V. der Marel, A. Magerl and H. Zabel, Z. Phys. Chem., 1987, 151, 93–101 Search PubMed.
- Y. Sato, K. Tanuma, T. Takayama, K. Kobayakawa, T. Kawai and A. Yokoyama, J. Power Sources, 2001, 97, 165–170 Search PubMed.
- M. Schmid, C. Goze-Bac, S. Krämer, S. Roth, M. Mehring, C. Mathis and P. Petit, Phys. Rev. B, 2006, 74, 073416 Search PubMed.
- J. Langer, V. Epp, P. Heitjans, F. A. Mautner and M. Wilkening, Phys. Rev. B: Condens. Matter Mater. Phys., 2013, 88, 094304 Search PubMed.
- Y. Fang, K. Peuvot, A. Gratrex, E. V. Morozov, J. Hagberg, G. Lindbergh and I. Furó, J. Mater. Chem. A, 2022, 10, 10069–10082 CAS.
- S. Wang, H. Matsui, H. Tamamura, Y. Matsumura and T. Yamabe, Phys. Rev. B: Condens. Matter Mater. Phys., 1998, 58, 8163–8165 CAS.
- A. Schirmer and P. Heitjans, Z. Naturforsch. A, 1995, 50, 643–652 CAS.
- Y. Saito, H. Kataoka, K. Nakai, J. Suzuki, K. Sekine and T. Takamura, J. Phys. Chem. B, 2004, 108, 4008–4012 CAS.
- Y. Fang, A. J. Smith, R. W. Lindström, G. Lindbergh and I. Furó, Appl. Mater. Today, 2022, 28, 101527 Search PubMed.
- E. O. Stejskal and J. E. Tanner, J. Chem. Phys., 1965, 42, 288–292 Search PubMed.
- R. E. Franklin, Acta Crystallogr., 1951, 4, 253–261 CAS.
- Y. Hishiyama, Y. Kaburagi and A. Yoshida, Carbon, 2007, 45, 1717–1718 Search PubMed.
- N. Iwashita, C. R. Park, H. Fujimoto, M. Shiraishi and M. Inagaki, Carbon, 2004, 42, 701–714 Search PubMed.
- K. Kubota, S. Shimadzu, N. Yabuuchi, S. Tominaka, S. Shiraishi, M. Abreu-Sepulveda, A. Manivannan, K. Gotoh, M. Fukunishi, M. Dahbi and S. Komaba, Chem. Mater., 2020, 32, 2961–2977 CAS.
- H. Shi, J. N. Reimers and J. R. Dahn, J. Appl. Crystallogr., 1993, 26, 827–836 CAS.
- H. Azuma, J. Appl. Crystallogr., 1998, 31, 910–916 CAS.
- H. Fujimoto and M. Shiraishi, Carbon, 2001, 39, 1753–1761 CAS.
- W. Ruland and B. Smarsly, J. Appl. Crystallogr., 2002, 35, 624–633 CrossRef CAS.
- L. Tsui and F. Garzon, J. Appl. Crystallogr., 2017, 50, 1830–1833 CrossRef CAS.
- L. Tsui, CarbonXS GUI, available online: https://lktsui.github.io/carbon_xs_gui/index.html, accessed January 24, 2025.
- H. Fujimoto, Carbon, 2003, 41, 1585–1592 CrossRef CAS.
- H. Fujimoto, Carbon, 2010, 48, 3446–3453 CrossRef CAS.
- H. Fujimoto, Carbon Analyzer, available online: https://www.asahi-net.or.jp/%7Eqn6h-fjmt/, accessed January 24, 2025.
- T. Pfaff, M. Simmermacher and B. M. Smarsly, J. Appl. Crystallogr., 2018, 51, 219–229 CrossRef CAS.
- T. Pfaff, F. M. Badaczewski, M. O. Loeh, A. Franz, J.-U. Hoffmann, M. Reehuis, W. G. Zeier and B. M. Smarsly, J. Phys. Chem. C, 2019, 123, 20532–20546 CrossRef CAS.
- O. Osswald and B. M. Smarsly, C-J. Carbon Res., 2022, 8, 78 CrossRef CAS.
- O. Osswald and B. M. Smarsly, OctCarb, available online: https://www.uni-giessen.de/en/faculties/f08/departments/physchem/ag-prof-dr-bernd-smarsly/softwares/octcarb, accessed January 24, 2025.
- F. Tuinstra and J. L. Koenig, J. Chem. Phys., 1970, 53, 1126–1130 CrossRef CAS.
- D. S. Knight and W. B. White, J. Mater. Res., 1989, 4, 385–393 CrossRef CAS.
- M. Endo, Y. A. Kim, T. Hayashi, T. Yanagisawa, H. Muramatsu, M. Ezaka, H. Terrones, M. Terrones and M. S. Dresselhaus, Carbon, 2003, 41, 1941–1947 CrossRef CAS.
- A. Sadezky, H. Muckenhuber, H. Grothe, R. Niessner and U. Pöschl, Carbon, 2005, 43, 1731–1742 CrossRef CAS.
- G. M. Jenkins, K. Kawamura and L. L. Ban, Proc. R. Soc. Lond. A, 1972, 327, 501–517 Search PubMed.
- K. S. W. Sing, D. H. Everett, R. A. W. Haul, L. Moscou, R. A. Pierotti, J. Rouquérol and T. Siemieniewska, Pure Appl. Chem., 1985, 57, 603–619 CrossRef CAS.
- A. Shellikeri, V. Watson, D. Adams, E. E. Kalu, J. A. Read, T. R. Jow, J. S. Zheng and J. P. Zheng, J. Electrochem. Soc., 2017, 164, A3914–A3924 CrossRef CAS.
- K. Tatsumi, T. Akai, T. Imamura, K. Zaghib, N. Iwashita, S. Higuchi and Y. Sawada, J. Electrochem. Soc., 1996, 143, 1923–1930 CrossRef CAS.
- G. Jaccard, S. Wimperis and G. Bodenhausen, J. Chem. Phys., 1986, 85, 6282–6293 CrossRef CAS.
- I. Furó and B. Halle, Mol. Phys., 1992, 76, 1169–1197 CrossRef.
- G. Roth, K. Lüders, P. Pfluger and H.-J. Güntherodt, Solid State Commun., 1981, 39, 423–426 CrossRef CAS.
- J. I. Kaplan and G. Frankel, NMR of Chemically Exchanging Systems, Academic Press, New York, 1980 Search PubMed.
- J. Korringa, Physica, 1950, 16, 601–610 CrossRef CAS.
- D. Pines, Solid State Phys., 1955, 1, 367–450 CAS.
- H. Estrade, J. Conard, P. Lauginie, P. Heitjans, F. Fujara, W. Buttler, G. Kiese, H. Ackermann and D. Guérard, Physica, 1980, 99, 531–535 CAS.
- K. Takai, M. Oga, H. Sato, T. Enoki, Y. Ohki, A. Taomoto, K. Suenaga and S. Iijima, Phys. Rev. B: Condens. Matter Mater. Phys., 2003, 67, 214202 CrossRef.
- T. E. Faber, Solid State Commun., 1963, 1, 41–47 CrossRef CAS.
- S. S. Köcher, P. P. M. Schleker, M. F. Graf, R.-A. Eichel, K. Reuter, J. Granwehr and Ch. Scheurer, J. Magn. Reson., 2018, 297, 33–41 CrossRef PubMed.
- B. M. Meyer, N. Leifer, S. Sakamoto, S. G. Greenbaum and C. P. Grey, Electrochem. Solid-State Lett., 2005, 8, A145 CrossRef CAS.
- J. R. Dahn, T. Zheng, Y. Liu and J. S. Xue, Science, 1995, 270, 590–593 CrossRef CAS.
- C. Kim, K. S. Yang, Y. J. Kim and M. Endo, J. Mater. Sci., 2003, 38, 2987–2991 CrossRef CAS.
- T. Gruber, T. W. Zerda and M. Gerspacher, Carbon, 1994, 32, 1377–1382 CAS.
- J. Li, H. Ouyang, J. Wang, J. Li and H. Zhang, J. Electrochem. Soc., 2022, 169, 090522 CAS.
- T. Doi, K. Miyatake, Y. Iriyama, T. Abe, Z. Ogumi and T. Nishizawa, Carbon, 2004, 42, 3183–3187 CAS.
- R. Morita, K. Gotoh, M. Fukunishi, K. Kubota, S. Komaba, N. Nishimura, T. Yumura, K. Deguchi, S. Ohki, T. Shimizu and H. Ishida, J. Mater. Chem. A, 2016, 4, 13183–13193 CAS.
- J. M. Stratford, P. K. Allan, O. Pecher, P. A. Chater and C. P. Grey, Chem. Commun., 2016, 52, 12430–12433 CAS.
- S. Alvin, D. Yoon, C. Chandra, H. S. Cahyadi, J.-H. Park, W. Chang, K. Y. Chung and J. Kim, Carbon, 2019, 145, 67–81 CAS.
- R. Morita, K. Gotoh, K. Kubota, S. Komaba, K. Hashi, T. Shimizu and H. Ishida, Carbon, 2019, 145, 712–715 CAS.
- Y. Morikawa, S. Nishimura, R. Hashimoto, M. Ohnuma and A. Yamada, Adv. Energy Mater., 2020, 10, 1903176 CAS.
- H. Au, H. Alptekin, A. C. S. Jensen, E. Olsson, C. A. O'Keefe, T. Smith, M. Crespo-Ribadeneyra, T. F. Headen, C. P. Grey, Q. Cai, A. J. Drew and M.-M. Titirici, Energy Environ. Sci., 2020, 13, 3469–3479 CAS.
- J. M. Stratford, A. K. Kleppe, D. S. Keeble, P. A. Chater, S. S. Meysami, C. J. Wright, J. Barker, M.-M. Titirici, P. K. Allan and C. P. Grey, J. Am. Chem. Soc., 2021, 143, 14274–14286 CAS.
- X. Chen, J. Tian, P. Li, Y. Fang, Y. Fang, X. Liang, J. Feng, J. Dong, X. Ai, H. Yang and Y. Cao, Adv. Energy Mater., 2022, 12, 2200886 CAS.
- X. Chen, C. Liu, Y. Fang, X. Ai, F. Zhong, H. Yang and Y. Cao, Carbon Energy, 2022, 4, 1133–1150 CAS.
- X. Chen, N. Sawut, K. Chen, H. Li, J. Zhang, Z. Wang, M. Yang, G. Tang, X. Ai, H. Yang, Y. Fang and Y. Cao, Energy Environ. Sci., 2023, 16, 4041–4053 CAS.
- H. Kim, J. C. Hyun, D. Kim, J. H. Kwak, J. B. Lee, J. H. Moon, J. Choi, H. Lim, S. J. Yang, H. M. Jin, D. J. Ahn, K. Kang, H. Jin, H. Lim and Y. S. Yun, Adv. Mater., 2023, 35, e2209128 CrossRef PubMed.
Footnotes |
| † Electronic supplementary information (ESI) available. See DOI: https://doi.org/10.1039/d4ta08096c |
| ‡ Current address: Cytiva AB, Björkgatan 30, SE-753 23 Uppsala, Sweden. |
| This journal is © The Royal Society of Chemistry 2025 |