
 Open Access Article
 This Open Access Article is licensed under a
 Creative Commons Attribution 3.0 Unported Licence
Unraveling the CO2 methanation and capture ability of NiO@metal oxides†
Huldah Suharika
Chitturi‡
a,
Yalagandula
Lavanya‡
a,
Yaddanapudi
Varun
a,
Anurag
Ramesh
a,
Sri Himaja
Pamu
 a,
I.
Sreedhar
a and
Satyapaul A.
Singh
*ab
a,
I.
Sreedhar
a and
Satyapaul A.
Singh
*ab
aDepartment of Chemical Engineering, Birla Institute of Technology and Science (BITS) Pilani, Hyderabad Campus, Jawahar Nagar, Kapra Mandal, Hyderabad-500 078, India. E-mail: satyapaul@hyderabad.bits-pilani.ac.in; Tel: +91 40 66303 566
bMaterials Centre for Sustainable Energy & Environment, Birla Institute of Technology and Science (BITS) Pilani, Hyderabad Campus, Jawahar Nagar, Kapra Mandal, Hyderabad-500 078, India
First published on 29th January 2025
Abstract
The present study reports the development of different core–shell nanoparticles using Ni/NiO as the core and other active metal oxides such as SiO2, Co3O4, CeO2 and ZrO2 as shells for CO2 methanation. Among all the studied core–shell materials, NiO@SiO2 and NiO@CeO2 showed the highest catalytic activity of >62% for CO2 conversion and >99% selectivity towards CH4 with a high GHSV of 47![[thin space (1/6-em)]](https://www.rsc.org/images/entities/char_2009.gif) 760 h−1 at 325 °C. The catalysts were thoroughly tested under lean and realistic feed conditions. XRD revealed the presence of NiO as the dominant core. All these catalysts were further subjected to characterization techniques such as SEM, TEM, XPS, N2 adsorption–desorption, H2-TPR, H2 pulse, and CO2-TPD-MS to understand their morphology, ionic nature, physical properties, reduction nature, active site dispersion, adsorption of CO2 and desorption of surface intermediates. Investigation into the formation and consumption of various intermediates via DFT studies revealed that the CO2 methanation reaction proceeds via a combination of the CO and formate pathways. These findings correlate with in situ FTIR studies, unveiling structure–property relations and methanation mechanisms. At 25 °C, NiO@SiO2 exhibited a superior CO2 capture performance of 301.96 mg of CO2 per g at 50 bar, while NiO@Co3O4 adsorbed 90.40 mg of CO2 per g at 1 bar. Interestingly, H2 adsorption was nearly uniform across all these materials even at 50 bar and 25 °C. The core–shell materials show CO2 capture and hydrogenation abilities towards methane formation.
760 h−1 at 325 °C. The catalysts were thoroughly tested under lean and realistic feed conditions. XRD revealed the presence of NiO as the dominant core. All these catalysts were further subjected to characterization techniques such as SEM, TEM, XPS, N2 adsorption–desorption, H2-TPR, H2 pulse, and CO2-TPD-MS to understand their morphology, ionic nature, physical properties, reduction nature, active site dispersion, adsorption of CO2 and desorption of surface intermediates. Investigation into the formation and consumption of various intermediates via DFT studies revealed that the CO2 methanation reaction proceeds via a combination of the CO and formate pathways. These findings correlate with in situ FTIR studies, unveiling structure–property relations and methanation mechanisms. At 25 °C, NiO@SiO2 exhibited a superior CO2 capture performance of 301.96 mg of CO2 per g at 50 bar, while NiO@Co3O4 adsorbed 90.40 mg of CO2 per g at 1 bar. Interestingly, H2 adsorption was nearly uniform across all these materials even at 50 bar and 25 °C. The core–shell materials show CO2 capture and hydrogenation abilities towards methane formation.
1. Introduction
The global consumption of fossil fuels has steadily increased over time and is projected to continue rising in the coming decades.1 Industries, power plants, plastic and chemical sectors, and households are among the primary consumers of fossil fuels.2 This growing demand for energy has led to substantial growth in carbon dioxide emissions.3 To mitigate CO2 emissions, various strategies such as absorption,4,5 stripping,6,7 adsorption,8–10 and CO2 utilization are commercially proven technologies.11–14 The utilization of CO2 emission involves CO2 conversion into value-added products via hydrogenation.15 The Sabatier reaction (or CO2 methanation reaction) is a hydrogenation reaction that can produce methane at lower temperatures, below 300 °C.16 It is possible to maintain a sustainable level of carbon energy circulation if hydrogen is produced using the surplus of electrical energy generated by renewable sources.17 Photosynthesis and photocatalysis are distinct competing approaches to transform carbon dioxide into value-added products.18–20 Electrochemical CO2 reduction,21 biological CO2 conversion,22 and thermo-catalytic CO2 methanation23 are all latent pathways for reducing greenhouse gas emissions. The conceivable power-to-gas (PtG) processing technologies (thermo-catalytic CO2 methanation) for use in forthcoming energy systems have been reviewed.24,25 These technologies permit the conversion of renewable energy into methane through catalytic methanation.26 The produced methane can be stored or transported via the existing natural gas infrastructure, offering flexibility and supporting power grid stabilization with high renewable energy integration. This approach plays a crucial role in enabling long-term economic decarbonization.The hydrogenation of carbon dioxide to yield renewable methane (CH4) is thus a promising and sustainable solution.27 The Sabatier reaction can make use of the abundant CO2 to produce CH4, which has high energy density as a fuel and partly fulfils the energy demand.28,29 Additionally, CH4 as a fuel leaves a lower carbon footprint than that left by the combustion of other traditional fossil fuel liquids. The Sabatier reaction is shown in eqn (1) below:
 | (1) |
Ni is an abundantly available transition metal, having a good catalytic property towards methanation reaction. Several studies have focused on the development of Ni-based catalysts for better yields at low temperature by substitution with other groups of materials, like alkaline earth metals,30–32 lanthanides33,34 and noble metals.35 Zeolites and MOF-based materials are also helpful in developing suitable catalysts towards CO2 methanation by doping a suitable metal oxide.36–39 A catalyst must possess crucial properties of strong metal support interaction (SMSI), oxygen storage capacity (OSC) and affinity towards hydrogenation. Furthermore, morphologically tuned materials, particularly core–shell nanoparticles, are effective in achieving these properties, enabling catalytic activity at lower temperatures (below 300 °C) to prevent undesirable reverse water–gas shift reaction (RWGS). Core–shell nanoparticles, made from single or multiple metal oxides or nanocomposites, offer numerous active sites through their core or shell.40 Additionally, the shell coating improves the core's reactivity, thermal stability, and overall dispersion, making them highly stable and efficient catalysts.41,42
Core–shell nanoparticles may be produced using a variety of processes, and the Stöber approach is one of the strategies.43 These materials possess good thermal stability, high dispersion, and contributes to the confinement of active sites inside the catalytic system matrix.44 A recent study on Ni–Al@Al2O3 showed a very high CO2 conversion of almost 96% at 310 °C.45 Apart from Ni-based core–shell nanoparticles, the cobalt-based core shell nanoparticles were also synthesized and showed 56% CO2 conversion at 400 °C.46 The MOF-based core–shells with Fe as the dopant enhanced the catalytic ability. In these studies, the catalyst showed 73.2% CO2 conversion at 350 °C due to Fe–Ni alloy formation.47 Another study showed significant improvement in the catalytic activity of carbide core–shells with ruthenium as the active metal.48
In most studies, the relationship between a material's CO2 capture ability and its catalytic hydrogenation performance remains underexplored. In this work, core–shell nanoparticles were developed using the modified Stöber method, by choosing NiO as the core and four different materials as shells. NiO nanoparticles were synthesized using the precipitation method. The choice of shells is based on the reduction nature of the materials. Two shell materials, Co3O4 and CeO2, were used as an active metal oxide for providing more OSC, and the other two shells are SiO2 and ZrO2 to facilitate SMSI. All materials were well characterized by XRD, XPS, electron microscopy, TPR and N2 adsorption–desorption techniques to assess the crystallinity, chemical shift, morphology, reducibility, and nature of the isotherms. CO2 methanation studies were conducted under both lean and realistic feed conditions. DFT calculations were used to examine the reaction pathway. CO2-TPD coupled with mass spectrometry (MS) provided insights into possible intermediates, and correlated with the DFT findings. Finally, in situ FTIR studies with reaction gases and pure CO2 probing were performed to obtain insight into the reaction mechanisms and CO2 capture ability. High-pressure CO2 and H2 capture studies were performed as a proof-of-concept and further showed the applicability of the core–shell materials at the industrial scale under inevitable high-pressure conditions. To the best of our knowledge, very few studies have been reported on both capture and utilization fronts.49–55 The present study aims to showcase the possible correlation among capture and utilization.
2. Results and discussion
2.1. X-ray diffraction (XRD) studies
Fig. 1 shows the XRD patterns of the core–shell nanoparticles. The presence of NiO was observed in all catalysts. The peaks at 2θ values of 29.1° and 48.1° represent the CeO2 phase (JCPDS file number: 00-034-0394)56 with lattice planes of (111) and (220), respectively. The monoclinic ZrO2 peaks were identified at 2θ values of 31.5°, 36.3°, 51.8°, 61.4° with lattice planes of (111), (![[2 with combining macron]](https://www.rsc.org/images/entities/char_0032_0304.gif) 01), (
01), (![[1 with combining macron]](https://www.rsc.org/images/entities/char_0031_0304.gif) 22) and (331) (JCPDS file number: 00-037-1484), respectively.57 The 2θ values at 18.9°, 31.3°, 36.2°, 44.5°, 59.3° and 65.2° with the lattice planes of (111), (220), (311), (400), (511), (440) (JCPDS file number: 00-043-1003), respectively, represent Co3O4 in the cubic phase.58
22) and (331) (JCPDS file number: 00-037-1484), respectively.57 The 2θ values at 18.9°, 31.3°, 36.2°, 44.5°, 59.3° and 65.2° with the lattice planes of (111), (220), (311), (400), (511), (440) (JCPDS file number: 00-043-1003), respectively, represent Co3O4 in the cubic phase.58
 | ||
| Fig. 1 XRD patterns of the as-prepared core–shell nanoparticles. | ||
A pure phase of metal oxide NiO formation was observed. Any other impurities, like metal oxide in different crystalline phases, nitrates or metal content, were not found in the XRD patterns. It was observed that there is a slight change in the XRD pattern at 44–46° having a Bragg angle difference. This indicates the formation of defects in the crystalline system during the creation of core–shells. When the NiO@Co3O4 XRD pattern were compared with that of the Ni–Co alloy, it was observed that there was no JCPDS file available for the Ni–Co alloy.59
In order to know the defect formation, Williamson–Hall studies were performed for all catalysts considering eqn (2).
 | (2) |
cosθ vs. 4 sinθ]. The Williamson hall study is used to study the broadening of the peaks in the XRD pattern by calculating the microstrain (ε) and crystallite size (D).60–64 The Williamson–Hall relation is shown in Fig. S1,† wherein there is a linear fit with a coefficient of determination value of R2 as 0.969, 0.910, 0.970, and 0.953 for NiO@SiO2, NiO@CeO2, NiO@Co3O4, and NiO@ZrO2, respectively. The microstrains of all catalysts are listed in Table S2.†
2.2. Surface area and pore volume analysis
Fig. S2(a, b and d)† shows the type-III isotherms due to the weak interactions, facilitating multi-layer adsorption without the formation of a monolayer. Conversely, Fig. S2(c)† follows a distinctive type IV isotherm, which exhibits the formation of a monolayer at lower pressure regions, succeeded by the formation of multilayers. In this case, it is more likely that the Zr atoms might have occupied the NiO mesopores, which resulted in the decrease in the average pore volume.65 This observation suggests that the material primarily possesses mesopores with a cylindrical morphology and uniform cross-sectional area. The presence of an H2 type hysteresis loop in the NiO@ZrO2 system indicates the existence of mesopores characterized by spherical geometry, open terminations, and multiple narrowing's or constrictions. The physical properties of all materials are shown in Table 1.| Catalyst | Surface areaa, m2 g−1 | Total pore volumeb, cm3 g−1 | Mean pore diameterb, nm | Crystallite sizec, nm | Theoreticald, atom% | %Ni dispersiond,e | Ni surface areae, m2 g−1 | Number of active sitesf, μmol g−1 |
|---|---|---|---|---|---|---|---|---|
| a Calculated using BET. b Calculated using BJH. c Estimated using Debye–Scherrer equation. d Determined using ICP-OES. e Estimated from the H2 pulse titration method. f Calculated based on H2 uptake. | ||||||||
| NiO@Co3O4 | 15 | 0.23 | 16 | 60 | 20.20 | 0.19 | 0.04 | 661.29 |
| NiO@CeO2 | 28 | 0.14 | 21 | 29 | 21.87 | 0.42 | 0.21 | 1579.8 |
| NiO@ZrO2 | 21 | 0.12 | 8.0 | 30 | 13.98 | 0.52 | 0.25 | 1249.4 |
| NiO@SiO2 | 58 | 0.18 | 35 | 59 | 14.00 | 0.69 | 0.34 | 1651.3 |
2.3. Scanning electron microscopy images (SEM)
Fig. 2 depicts micrographs displaying the core–shell nanoparticles. Among the catalysts investigated, NiO@SiO2 exhibited the most favorable morphology, resulting in the formation of spherical silica particles surrounding the NiO nanoparticles. In all the catalysts, the coverage of the shells was good, except with ZrO2. The other catalysts, except for NiO@ZrO2, displayed enhanced morphology attributed to the absence of bulk aggregation. These images effectively demonstrate the intricate nature of the spherical core–shell nanoparticles. In Fig. S3,† EDX analysis confirmed the presence of oxygen in the synthesized catalysts, verifying that the sole type of material generated was metal oxide. | ||
| Fig. 2 SEM images of (a) NiO@CeO2, (b) NiO@Co3O4, (c) NiO@ZrO2 and (d) NiO@SiO2. | ||
2.4. High-resolution transmission electron microscopy images (HRTEM)
Fig. 3 shows the TEM, HRTEM and SAED pattern analysis of the NiO@metal oxide nanoparticles. The shape of the NiO@SiO2 nanocomposite is consistent with the formation of core–shell nanoparticles, and the particle size distribution is unique in the form of spheres. The agglomeration is only noticeable where other shell doping is performed in conjunction with surface modification. However, it is still possible to see the essential core–shell structures. This suggests that there is a possibility of a precursor impact being present. Co3O4 was discovered at plane (311), and ZrO2 was discovered at planes (111) and (220), respectively, as shown in Fig. 3(e), (f), (h) and (i), respectively. The NiO planes of (200), (220), and (311) were detected in Fig. 3(e) and (f). The interplanar spacing values obtained from the micrographs show the presence of all shell materials except SiO2, due to its amorphous nature. The interplanar spacing values of the NiO core found from Fig. 3(b), (e), (h) and (k) were 2.43 Å, 2.39 Å, 2.42 Å and 1.45 Å, respectively, at planes of NiO (111) and NiO (220). For the shell materials from Fig. 3(b), (e), (h) and (k), the d-spacing values for CeO2 (111) is 3.24 Å, ZrO2 (200) is 2.58 Å, Co3O4 (422) is 2.62 Å. SiO2 is not detected in any plane. However, its presence is visible around NiO. A TEM EDS mapping was performed to identify the presence of Ni, Co, Ce, Zr, and Si, and is shown in Fig. S4.†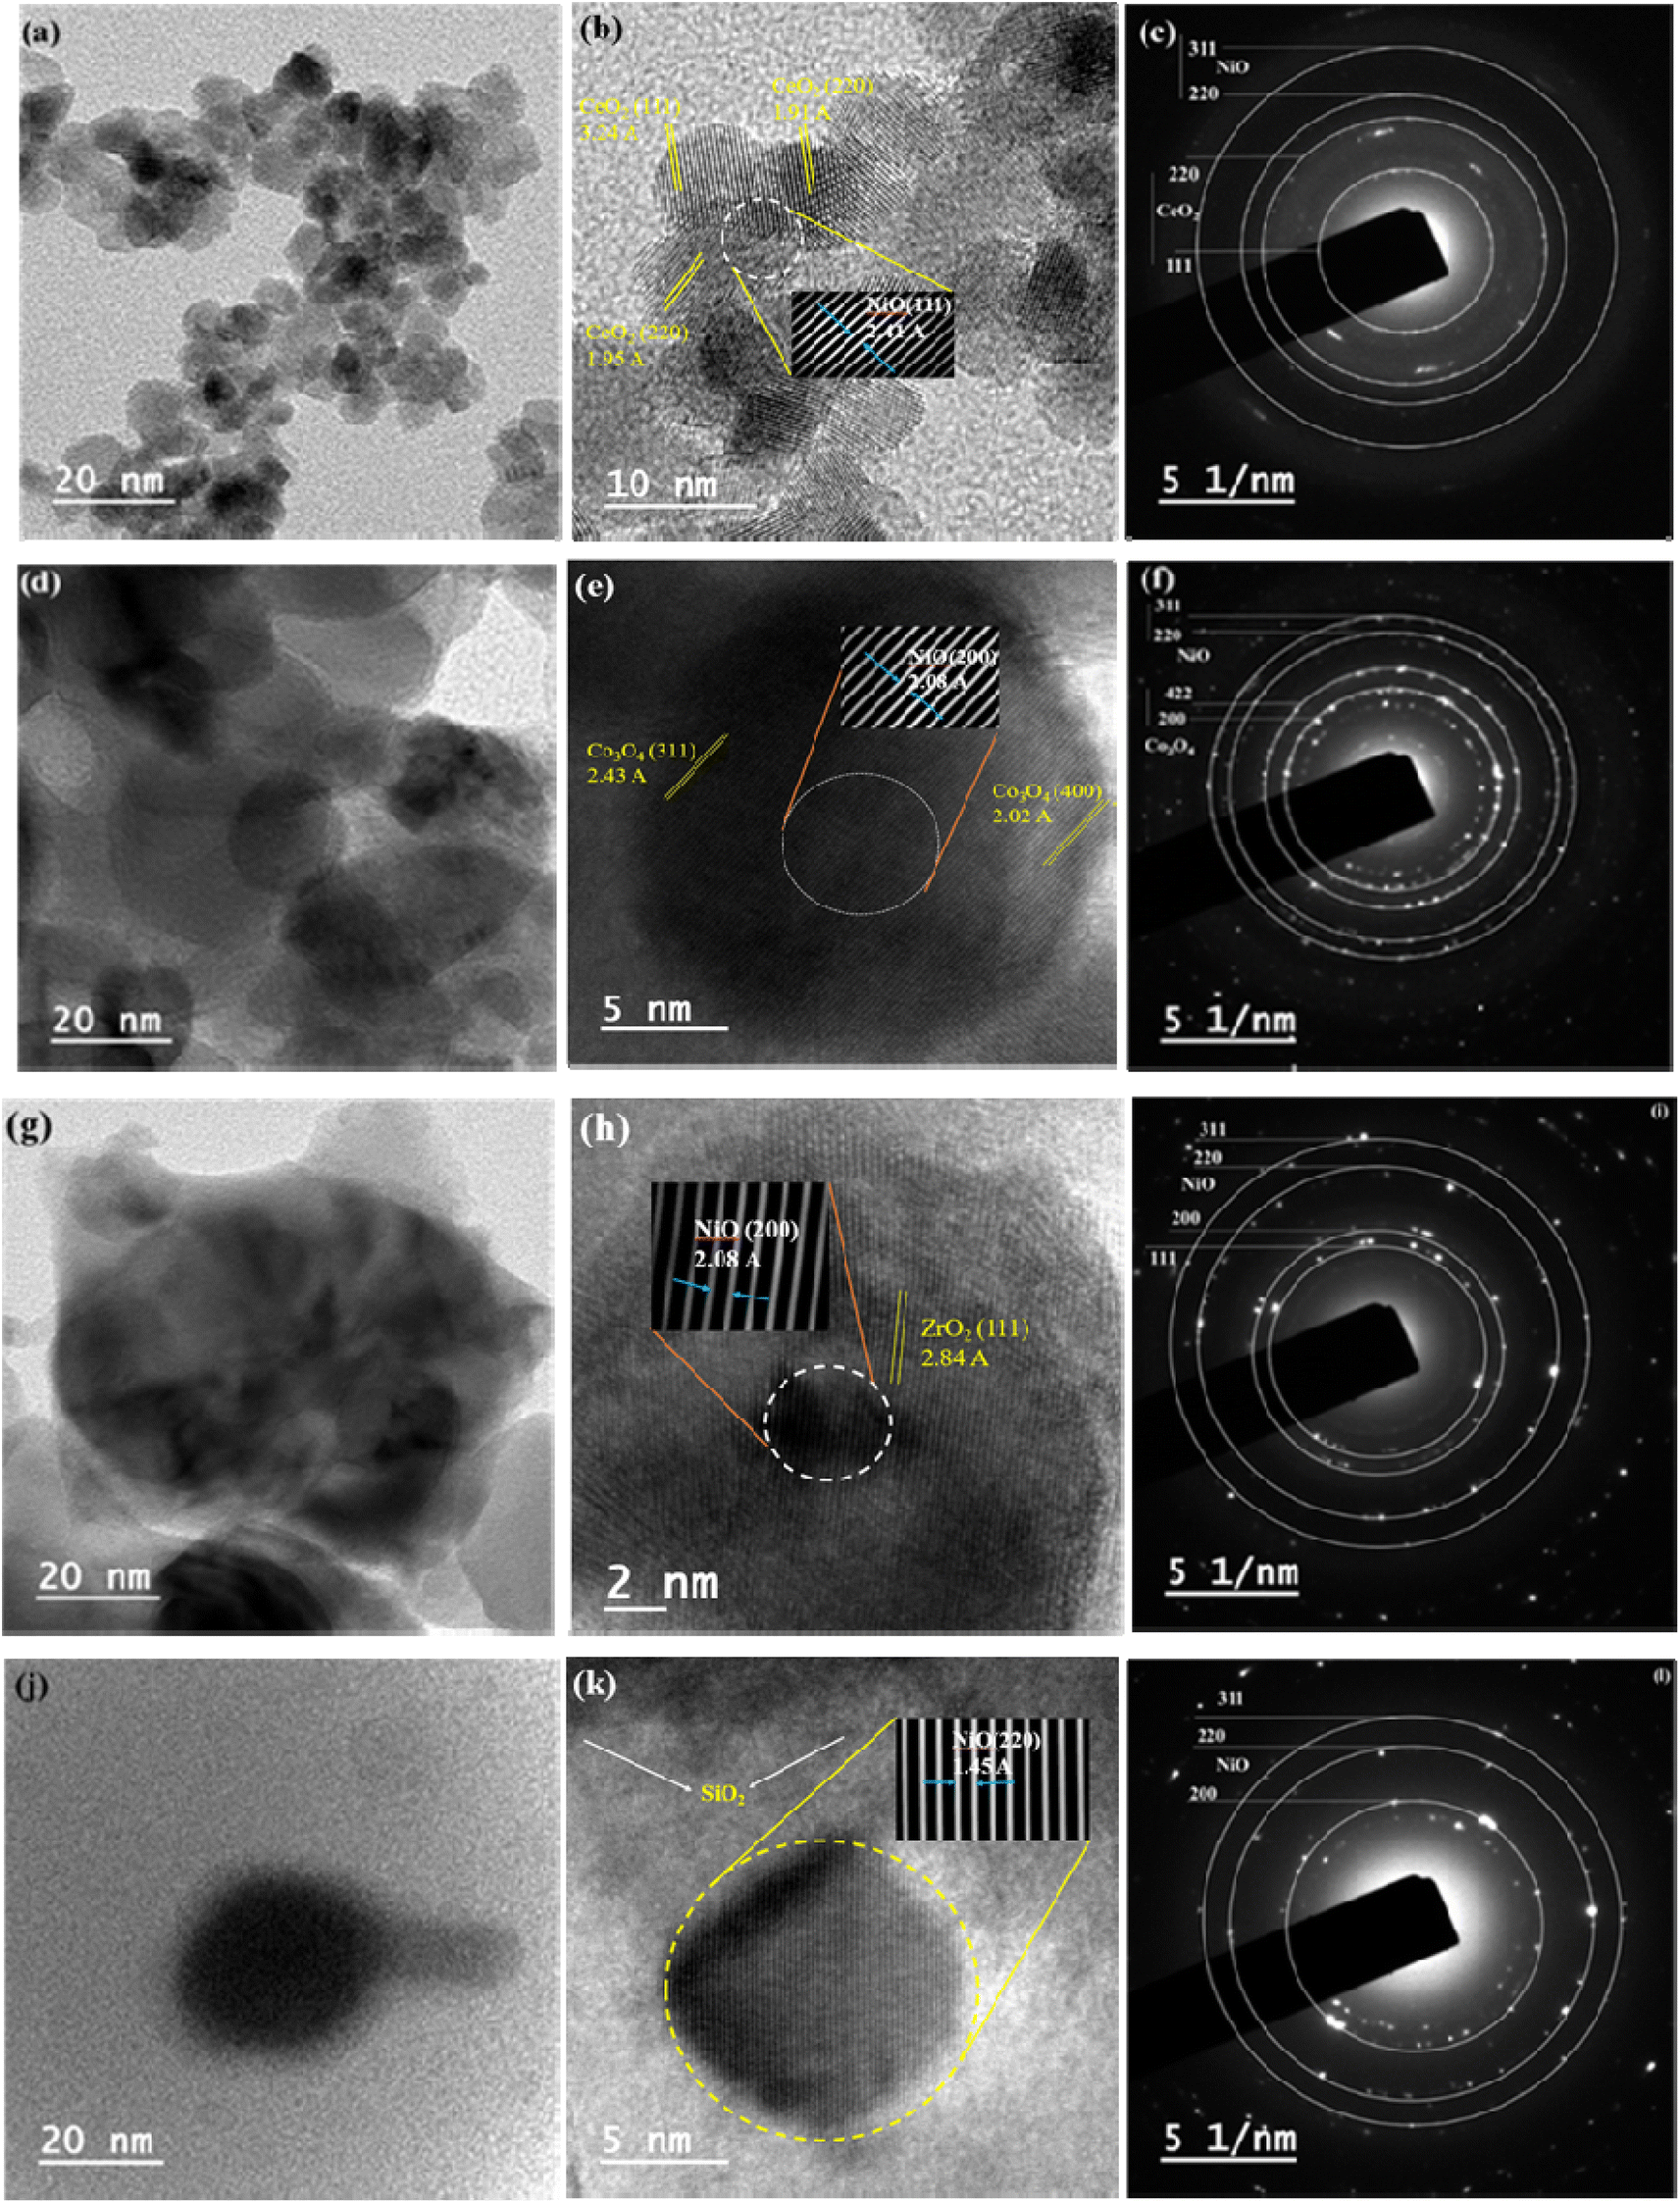 | ||
| Fig. 3 TEM, HRTEM and SAED patterns of (a–c) NiO@CeO2, (d–f) NiO@Co3O4, (g–i) NiO@ ZrO2 and (j–l) NiO@SiO2 (insets of (b), (e), (h) and (k) show fast Fourier transform (FFT) images). | ||
2.5. H2-temperature programming reduction studies
The investigations were conducted using temperature programming, and the results are shown in Fig. 4. At 348 °C, NiO@SiO2 was significantly reduced, revealing the NiO reduction peak. A shoulder between 300 and 400 °C is likely due to SMSI effects between NiO and SiO2. This interaction could lead to encapsulation effects, where the NiO interacts with SiO2 in a manner that alters the reduction profile of NiO.66 The H2-TPR study on SiO2 alone is presented in Fig. S5,† and proves that the shoulder does not correspond to SiO2 reduction. A similar interaction was observed with the cobalt oxide encapsulation. The NiO reduction was seen at 332 °C, indicating that NiO and Co3O4 were reduced at the same temperature and formed a bulk nanocomposite, leading to the greater NiO and Co3O4 interaction. All catalysts showed reduction peaks to NiO between 250 and 500 °C. Multiple reduction peaks at various temperatures in the NiO@CeO2 catalyst demonstrate the presence of various oxidation states. The NiO@ZrO2 system showed a second peak at around 445 °C, indicating a nanocomposite emergence. This peak likely corresponds to the reduction of NiO facilitated by the ZrO2 support, which can promote reducibility through oxygen mobility and the creation of active sites at the interface. The emergence of nanocomposites during this process further supports the idea that the peak is linked to structural and electronic changes, rather than the direct reduction of the ZrO2 support. For NiO@ZrO2, the attribution of the reduction peak to nanocomposite formation is reasonable, and aligns with the known properties of ZrO2. | ||
| Fig. 4 H2-TPR studies on core–shell nanoparticles NiO@S, where S = CeO2, SiO2, Co3O4 and ZrO2. | ||
NiO@ZrO2 and NiO@CeO2 show reduction peaks at 362 °C and 305 °C, respectively. This suggests that the interactions between NiO and ZrO2 are low by forming Zr4+ ions and those with CeO2 are strong by forming Ce4+ ions, indicating the low area in the peak. One of the reasons that ZrO2 interacts less effectively with other nanoparticles is its lack of a porous structure, which is commonly found in other core–shell nanoparticles. This might cause very low catalytic activity when ZrO2 is used as the shell. Consumption of H2 for core–shell nanoparticles was calculated and presented in Table 2.
| Catalyst | Total H2 consumption, μmol g−1 | Surface basicity based on CO2 desorption, μmol g−1 | |||
|---|---|---|---|---|---|
| Weak | Medium | High | Total | ||
| NiO@Co3O4 | 17632 |
26.59 (100%) | — | — | 26.59 |
| NiO@SiO2 | 10003 |
283.5 (59.3%) | 45.08 (9.43%) | 149.5 (31.3%) | 478.1 |
| NiO@ZrO2 | 15099 |
38.62 (5.70%) | — | 638.9 (94.3%) | 677.5 |
| NiO@CeO2 | 10949 |
229.0 (84.7%) | 13.11 (4.85%) | 28.18 (10.4%) | 270.3 |
H2-TPR analysis also assesses the Oxygen Storage Capacity (OSC) of materials, which is an ability of materials to store and release oxygen. The OSC of the material depends on the reducibility of the catalyst. As the reaction progresses, lattice vacancies are created due to the consumption of lattice oxygen atoms. These vacancies subsequently capture oxygen-centric molecules from the reactants, thereby enhancing the OSC of catalyst and contributing to the reaction pathway. Notably, both CeO2 and Co3O4 materials exhibit a robust oxygen storage capacity (shown in Table 2).
2.6. CO2-temperature programming desorption studies
The basicity of the synthesized core–shell nanoparticles was investigated using CO2-TPD, and is shown in Fig. 5(a). These profiles demonstrated the presence of weak, medium, and strong basic sites. The maxima temperatures for weak basic sites were observed in the temperature range of 84 °C to 189 °C for all catalysts. The reduction of the catalysts has enhanced the surface basicity of the catalysts. Except for NiO@Co3O4, all catalysts showed CO2 desorption from room temperature to 800 °C, indicating the distribution of basic sites across all temperatures. Both the weak and strong basic sites are found to be more prominent than the medium basic sites. NiO@SiO2 has a large number of weak (283.5 μmol g−1) and medium basic sites (45.08 μmol g−1) among all catalysts, hinting its ability for CO2 methanation activity. NiO@CeO2 also offered a good number of weak basic sites (229.0 μmol g−1), which contributes to 84.7% of the total basic sites. However, a total of only 4.85% of the medium and a notable 10.4% of the strong basic nature was witnessed. | ||
| Fig. 5 (a) CO2-TPD, CO2-TPD MS profiles of core–shell nanoparticles at an m/z of (b) 1 and 2, (c) 16 and 32, (d) 18, (e) 28 and (f) 44. | ||
Both NiO@Co3O4 and NiO@ZrO2 had very low weak basic sites of 26.59 and 38.62 μmol g−1, respectively. The medium basicity was not observed among these two catalysts. This hints that both catalysts may not be highly active for CO2 methanation. A peculiar outcome has been observed for the NiO@ZrO2 catalyst. It showed the presence of a large number of strong basic sites at the temperature range of 650 °C to 860 °C. A significant value of 638.9 μmol g−1, contributing to 94.3% of the total basicity, was measured as the strong basic sites. This indicates that NiO@ZrO2 may offer good catalytic activity for high-temperature reactions, such as dry reforming of methane rather than CO2 methanation.
A mass spectrometer connected to the CO2-TPD instrument enables qualitative analysis of CO2, CO, and other gases during temperature ramping, as shown in Fig. 5(b–f). This technique identifies functional groups based on their thermal decomposition with temperature being a crucial parameter. The desorbed CO2 gas is detected by the mass spectrometer in the form of CO2 (m/z = 44), CO (m/z = 28), and CH4 (m/z = 16) (as shown in Fig. 5(f), (e) and (c)). The presence of hydrogen is possible due to the H2 reduction step in the catalyst pretreatment, which is further confirmed from the detection of both atomic and molecular hydrogen (m/z = 1 and 2, as shown in Fig. 5(b)). Furthermore, as the reduction step also weakens the metal–oxygen bond and simultaneously dissociates CO2 by utilizing created oxygen vacancies, the atomic and molecular oxygen (m/z = 16 and 32) will thus be released during the TPD study (as shown in Fig. 5(c)).67 Although both CH4 and atomic oxygen are identified at the same m/z = 16, the detected m/z = 32 for molecular oxygen and the formation of water (with m/z = 18 shown in Fig. 5(d)) proves the release of oxygen. These crucial details from CO2-TPD-MS experimentally support the mechanism developed by DFT studies.
2.7. H2 pulse chemisorption
Utilizing the H2 pulse chemisorption technique, the active Ni dispersion and its surface area in all four catalysts were estimated. The metal dispersion was calculated from eqn (3). | (3) |
3. Catalytic activity studies
The catalytic activity of each core–shell catalyst is shown in Fig. 6(a and b) for the low feed concentrations and Fig. 6(c) for the high feed concentrations. The temperature range of 150 °C to 400 °C was used to investigate the catalytic activity. The NiO catalyst without reduction has shown 38% CO2 conversion at 375 °C, and 51% of CO2 conversion was attained by the NiO catalyst with reduction at 400 °C. In terms of the methane selectivity, >90% was achieved by both the reduced and the non-reduced NiO catalyst, and the graphs are presented in Fig. S7.† Apart from the ZrO2-based shell material, the catalytic activity of the synthesized core–shell nanoparticles was found to be excellent. At a temperature of 250 °C, all materials exhibited decent CO2 conversion. The initial temperature also has a significant impact on the rate of CO2 conversion. The light-off curve began at 225 °C for NiO@ZrO2 and it is almost inert, which can be proved from the low pore volume of 0.12 cm3 g−1, and low weak and medium basicity, as shown in Tables 1, 2, and in Fig. 5. Thus, it is possible that zirconia covered most of the active sites accessible in the catalyst system, which might be the reason for such poor catalytic activity. The other three shells exhibited good catalytic activity toward methanation. However, NiO@SiO2 has better performance compared to the other materials. The selectivity toward methane is excellent (100% of methane selectivity) up to 325 °C for all catalysts. In Fig. 6(c), it was observed that the light-off curves started after 200 °C for the best catalysts due to high concentrations in the feed. At the temperature of 325 °C, NiO@CeO2 and NiO@SiO2 showed 62% and 67% of CO2 conversion, respectively. After that, the NiO@CeO2 conversion was increased to 72% at 400 °C. For NiO@SiO2, there was a decline in conversion. However, in terms of %CH4 selectivity, NiO@SiO2 had 100% selectivity. For NiO@CeO2, there was a decrease in the selectivity, as there was the formation of CO as a byproduct. The oxide–NiO interaction could enhance the catalyst's ability to adsorb and activate CO2, while influencing the hydrogenation steps to improve the overall efficiency and selectivity of the methanation reaction.68 | ||
| Fig. 6 Catalytic activity studies plot of the (a) %CO2 conversion and (b) %CH4 selectivity for the core–shell catalysts NiO@S (where S = CeO2, SiO2, Co3O4 and ZrO2; CO2:H2:N2 = 2:8:90 vol%; catalyst loading = 200 mg; and GHSV = 47760 h−1), (c) %CO2 conversion and %CH4 selectivity for NiO@SiO2 and NiO@CeO2 with flowrates of (CO2:H2:N2 = 10:40:50 vol%, catalyst loading = 200 mg, GHSV = 47760 h−1), and (d) TOF of all catalysts at 350 °C. | ||
Turnover frequencies (TOF) of the catalysts were evaluated to normalize the catalytic activity of all catalysts containing different active site compositions, and is expressed as follows:
 | (4) |
In Fig. 6(b), the selectivity of methane steadily decreased with the reaction temperature, showing a weaker inclination towards the methane selectivity after 325 °C for all core–shell catalysts. This is because of CO formation as a byproduct due to the reverse water gas shift reaction at higher temperatures.69 The NiO@SiO2 catalyst exhibited excellent methane selectivity and the strongest catalytic activity, even at higher temperatures. Furthermore, SiO2 has a unique capacity to adsorb CO2 and provide H2 with time to react with it. This ability is beneficial to induce the dual role of CO2 capture and utilization.
The findings of the XRD analysis indicated that all materials were formed in the pure form of metal oxide, and the results of the EDX examination and elemental mapping supported these findings. The presence of metal oxides in its purest form confers several benefits, one of which is the enhancement of the efficiency for producing strong interactions between the metal and the active material.70–74 The crystallite size of the NiO@SiO2 material was 59 nm, and it has a high surface area that is observable among all materials. This suggests that SiO2 shells can effectively distribute over NiO. Furthermore, even better exposure of active sites is possible due to its porous nature.75 This will promote the best methane selectivity and conversion of CO2 at lower temperatures. Other than SiO2, both CeO2 and Co3O4 materials also show better catalytic activity. This may be due to the high OSC, which allows the catalyst to offer more active vacant oxygen sites for the reaction. The presence of Ni2+ and Ni3+ ions in NiO, as shown in Fig. S7(a),† plays a critical role in activating the reactants, making the catalyst highly active even at low temperatures. The pure NiO was also evaluated for CO2 methanation, and it was found to be fairly active in its pure phase. However, reduced Ni is found to be more active. In core–shell catalyst systems, the possible reoxidation of reduced NiO cannot be ignored due to the dissociation of the CO2 molecule and OSC of the supporting metal oxides. The constructive interaction with other metal oxides offers the CO2 methanation ability. In general, the ratio of lattice oxygen to vacant oxygen is another factor that contributes to the activation of a catalyst. In conclusion, the oxygen vacancies result in (i) considerable hydrogen coverage augmentation on the support71,76 and (ii) acts as adsorption sites for CO2 and its further activation, resulting in the better catalytic activity of the core–shell catalysts.58,72,77Table 3 presents a comparative analysis of various catalysts used for CO2 methanation based on the literature.
| Catalyst | Method of synthesis | Ni content (wt%) | Temperature, °C | GHSV, h−1/composition [CO2:H2:N2], vol% or ratio/flowrate, mL min−1 |
%CO2 conversion | %CH4 selectivity | Apparent activation energy, kJ mol−1 | Remarks on stability | Ref. |
|---|---|---|---|---|---|---|---|---|---|
| a Obtained from (a) ICP-OES/MS/AES, (b) H2-TPR, (c) synthesis method, and (d) EDX. | |||||||||
| Ni/ZrO2 | Impregnation | 10.4a | 350 | 30000, NA, NA |
∼85 | 100 | 71.7 | Stability study was not performed | 78 |
| Ni–CeO2 | Wet impregnation | 15.0c | 360 | 13333, 1:4 ratio [CO2:H2], 200 |
84 | 99 | — | Stability study of 8 h was conducted, in which the catalyst was stable with CO2 conversion of 76–77% and selectivity of 99% | 79 |
| Ni–CeO2 | Wet impregnation | 10.2a | 300 | 6000, 19:76:5, NA |
84 | 100 | — | 100 h of stability test was presented, and there was a decrease in conversion of 1% (84.1–83.6%), while the selectivity was 100% | 80 |
| La2−xCexNiO4 | Sol–gel | 11.2a | 350 | 10000, 1:4 ratio [CO2:H2], NA |
79 | 99 | — | The conversion and selectivity of 78.9% and 100% was obtained. The catalyst is stable throughout the stability study of 100 h | 81 |
| NixFe@C | Pyrolysis | 53.7a | 350 | NA, 23.5:70.5:6.0, NA |
72 | 99 | — | The catalyst has shown a stability at 53.3% of CO2 conversion, and a selectivity of 100% for the whole 50 h study | 47 |
| 80Ni–Zn/SiO2 | Ammonia evaporation | 20.4a | 300 | 9000, 1:4 ratio [CO2:H2], 30 |
80 | 100 | 87.9 | 73.2% of CO2 conversion was achieved, and it was stable for 40 h of the stability study | 82 |
| 4% Ru/Al2O3 | Wet incipient impregnation | 3.80b | 400 | 10000, 1:5:1.5 [CO2:H2:He], NA |
80 | — | 84.0 | Time-on-stream study of 24 h was executed, in which there was a decrease in conversion from 81.5% to 78%, while the selectivity was stable at 98% | 83 |
| Ni/Al@Al2O3 | Deposition–precipitation | 10.0a | 350 | NA, 1:50:49, 100 |
96 | — | 74.0 | There was a decrease in conversion for 10 h, but after that, there was a stable conversion of 95% for the 50 h study | 45 |
| 15%Ni@MGC | Wetness impregnation method | 15.0c | 400 | 36000, 1:4:1 ratio, 60 |
50 | 96 | 75.3 | The catalyst showed a stable value of 50% conversion and 96% selectivity for 30 h | 84 |
| Ni/ZrO2 | Wetness impregnation method | 8.68a | 350 | 60000, 8:32:10, NA |
79 | 76 | 93.6 | The conversion of 72% was stable for 10 h | 85 |
| Ni@C | Pyrolysis | 79.0d | 325 | 33000, 1.5:6 ratio, 55 |
100 | 99 | 85.3 | The stability test was carried out at 250 °C for 24 h and a stable value of 25.3% of CO2 conversion was obtained | 86 |
| Ni/CeO2/Al2O3 | Impregnation method | 15.0c | 350 | 21500, 1:4 ratio [CO2:H2], NA |
68 | 99 | 74.0 | The stability study of 90 h was performed, and there was approximately 68% of CO2 conversion and the CH4 selectivity was >99% | 87 |
| Ni/ZrO2–Al2O3 | Co-precipitation method | 18.2a | 280 | 48000, NA |
84 | 99 | 69.2 | The stability tests were not explored | 88 |
| NiO@CeO2 | Modified Stöber method | 32.37a (21.87 at%) | 325 | 47760, 10:40:50, 100 |
62 | 100 | 104 ± 1 | An ∼8% drop in CO2 conversion and 100% selectivity was observed throughout the 50 h stability study | Present study |
| NiO@SiO2 | Modified Stöber method | 43.34a (14.00 at%) | 325 | 47760, 10:40:50, 100 |
67 | 100 | 82.0 ± 2 | During the 50 h stability study, ∼10% drop in CO2 conversion and 100% selectivity was observed throughout | Present study |
| NiO@Co3O4 | Modified Stöber method | 39.08a (20.20 at%) | 375 | 47760, 2:8:90, 100 |
55 | 93 | 89.0 ± 2 | — | Present study |
3.1. Apparent activation energy studies
Apparent activation energy studies were performed on the catalysts by changing the loading of the catalyst from 0 mg to 200 mg in the interval of 50 mg. The activation energies were calculated by assuming the packed reactor as a differential flow reactor with negligible resistance towards mass transfer and heat transfer. The experimental conversions were plotted as a function of catalytic loading to validate the operation of the kinetic regime. The experimental findings were consistent with the Weisz–Prater correlation for the chosen operating conditions, and therefore validates the differential flow reactor assumption.89 Considering this, the reaction rates were determined by eqn (5), | (5) |
From Fig. S8(a), (c) and (e),† the fractional CO2 conversion varies linearly with the catalyst loading in the reactor. The reaction rates for each catalyst were determined from the slope of XCO2vs. , which was carried out at several temperatures. From the Arrhenius plots (Fig. S8(b), (d) and (f)†), the apparent activation energies of each catalyst were determined for CO2 methanation. The catalysts apparent activation energies are NiO@S (S = Co3O4, CeO2, and SiO2) are 89.0 ± 2, 104 ± 1 and 82.0 ± 2 kJ mol−1, respectively. NiO@ZrO2 was not considered due to its poor catalytic activity.
3.2. Stability studies
The influence of the time-on-stream condition over the core–shell nanoparticles is shown in Fig. 7. Based on the light-off curve plot (shown in Fig. 6), the temperature effect was investigated for the best catalysts, NiO@SiO2 and NiO@CeO2. The catalysts were subjected to 300 °C, at which the side reactions are prominent. Compared to NiO@CeO2, the conversion and selectivity of NiO@SiO2 are good, maintaining the same conversions for up to 20 h. A decreasing trend was observed in conversion and selectivity from 35% to 28% and 100% to 87%, respectively. The CO2 conversion of the NiO@SiO2 catalyst decreased at first from 51% to 41% and methane selectivity from 98% to 91%, which is minimal. The NiO@SiO2 core–shell nanoparticles are more stable than NiO@CeO2 core–shell nanoparticles. Fig. 7(c) presents the %CO2 conversion for cyclic study, in which each cycle was carried out for 10 h with the gap of 6 h for the NiO@SiO2 and NiO@CeO2 catalysts. This makes an effective 50 h time-of-stream to compare with the stability study using lean feed concentrations. The NiO@SiO2 catalyst has shown fair stability with a maximum drop of 8% in CO2 conversion for each cycle. Conversely, the drop in conversion is more than 10% using NiO@CeO2, making it less stable than NiO@SiO2. However, methane selectivities were found to be >98% for both catalysts throughout the cyclic stability study. Most often, the CO presence was not observed at different times of the cyclic stability study. The aggregation of the active species and the deposition of carbon often leads to the deactivation of this kind of catalyst when it is subjected to high temperatures.90 This unfavorable occurrence is found to be less prominent when conducted at lower reaction temperatures and is a result of the porous structure, allowing for additional interactions between the core and shell. After the stability studies, the catalysts were subjected to XPS analysis, where it was found that there is no change in the binding energies positions. However, a significant transition from Ni2+ to Ni3+ was observed with a maximum change in the binding energy of 0.1 eV. | ||
| Fig. 7 Time-on-stream studies for (a) %CO2 conversion, (b) %CH4 selectivity of the NiO@SiO2 and NiO@CeO2 catalysts (CO2:H2:N2 = 2:8:90 vol%, catalyst loading = 200 mg, GHSV = 47760 h−1, temperature = 300 °C), (c) %CO2 conversion of NiO@SiO2 and NiO@CeO2 catalysts (CO2:H2:N2 = 10:40:50 vol%, catalyst loading = 200 mg, GHSV = 47760 h−1, temperature = 300 °C). | ||
3.3. X-ray photoelectron spectroscopy studies
The core level spectra of the core–shell nanoparticles are shown in Fig. 8. Examination with XPS makes it feasible to establish whether the catalyst has an ionic structure. From the XPS findings, it is possible to accurately forecast information on the electronic structure and composition of Ni, Co and Zr. In this analysis, the fresh and reduced samples are denoted as NiO@S-F and NiO@S-R, where S = CeO2, SiO2, Co3O4 and ZrO2. Fig. 8(a and b) depicts the presence of the 2p3/2 and 2p1/2 split orbitals of Ni, corresponding to NiO@Co3O4-F and NiO@ZrO2-F, respectively. The Ni3+ ions are observed via the 2p3/2 orbital at 856.3 eV and the 2p1/2 orbital at 871.5 eV. Conversely, the Ni2+ ions are observed at 854.0 eV and 871.5 eV at 2p3/2 and 2p1/2 orbitals respectively, and the satellite shakeup peaks were detected at 861.3 eV and 879.6 eV, respectively.91–96 Meanwhile, the NiO@Co3O4-R and NiO@ZrO2-R catalysts resulted in no change in the binding energies after reduction. The O 1s spectra, shown in Fig. S9,† reveal the presence of Ni2+ and Ni3+ ions at the 2p3/2 orbital. These ions share the same energy level as all catalysts and the lattice oxygen is at 529.7 eV, vacant oxygen at 531.5 eV and hydroxyl group at 532.6 eV for the NiO@Co3O4 fresh catalyst and for the reduction catalyst. It was observed that the peak intensity was increased when compared to the fresh catalyst, and a satellite peak was identified at 534.3 eV for NiO@Co3O4-R.97 Two characteristic peaks were observed at 182.3 eV and 184.5 eV, indicating the 3d5/2 and 3d3/2 orbitals, respectively. At 186.1 eV, a satellite peak was observed.98,99 The O 1s spectra for NiO@ZrO2 is presented in Fig. S9(b),† in which the lattice oxygen was at 529.8 eV, vacant oxygen was at 531.7 eV and the hydroxyl peaks were at 532.6 eV for the fresh catalyst. For the reduced catalyst, there was a decrease in peak intensity for lattice oxygen with an increase in the vacant oxygen, as there was an oxygen vacancy due to the reduction step. In the NiO@Co3O4 sample (for both F and R), distinct peaks are observed at 779.8 eV and 794.8 eV, corresponding to the 2p3/2 and 2p1/2 orbitals of Co3+ ions, respectively. Additionally, Co2+ ions are identified by the presence of peaks at 781.7 eV and 796.9 eV, corresponding to the 2p3/2 and 2p1/2 orbitals, respectively. The other two satellite peaks are shown in Fig. S10(a).†77,100,101 The surface of NiO can capture electrons from the conduction band of other materials, giving it the ability to possess ultra-low nanoparticle size. The high electron affinity of NiO captures shell electrons, forming a type-I heterojunction, with the band alignment estimated via Tauc plots and Mulliken's theory, as presented in Table S4.† A larger conduction band offset strengthens the core–shell interactions, increasing the surface area and activity in NiO@SiO2 and NiO@CeO2. However, in NiO@ZrO2, the high offset creates an energy barrier that limits electron transfer and reduces the surface area. Similarly, in NiO@Co3O4, the weaker electron pull also lowers the surface area.76,102,103 | ||
| Fig. 8 Core level spectra of (a) Ni 2p NiO@Co3O4, (b) Ni 2p NiO@ZrO2, (c) Ni 2p NiO@CeO2, and (d) Ni 2p NiO@SiO2 for both fresh (F) and reduced (R) materials. | ||
The characteristic peaks for both Ni2+ and Ni3+ ions are observed in the 2p3/2 and 2p1/2 orbitals. These findings conclusively confirm the formation of NiO.74,104 With respect to NiO@CeO2, the possibility of finding Ni 2p1/2 orbitals is unclear due to the overlapping of binding energies in the range of 845 to 870 eV. Fig. S9(c)† presents the oxygen spectra for NiO@CeO2, in which the peak at 530.9 eV represents the lattice oxygen and 532.7 eV represents the vacant oxygen. The peaks at 532.6 eV show the hydroxyl group, and the satellite peak is observed at 534.6 eV for the fresh catalyst. Meanwhile, the reduced catalyst does not show the hydroxyl group, and the other peaks were matched with the fresh catalyst oxygen peaks. The oxygen spectra for NiO@SiO2 are depicted in Fig. S9(d),† in which the peak at 530.4 eV corresponds to lattice oxygen. Meanwhile, the peak at 532.9 eV represents vacant oxygen for both fresh and reduced catalysts, but there was no hydroxyl group peak in the reduced sample. From Fig. S10(c),† the binding energies of 882.0 eV, 889.7 eV, and 897.8 eV were assigned to Ce4+ 3d5/2, while 884.6 eV and 881.3 eV corresponds to the 3d5/2 orbital of Ce3+. The binding energies of the Ce3+ 3d3/2 orbitals were observed at 889.9 eV and 903.2 eV, and the Ce4+ 3d3/2 orbitals were observed at 900.6 eV, 906.6 eV and 916.4 eV.105–107
3.4. Density functional theory (DFT) studies for mechanism investigation
To identify the role of active sites, catalytic activity studies were performed on reduced and non-reduced NiO@S catalysts (where S = SiO2, CeO2, Co3O4, and ZrO2), as shown in Fig. 6(a–c). It clearly identifies reduced NiO (probably Ni) as the active site. However, as the reaction further proceeds, the possible re-oxidation of Ni due to atomic oxygen cannot be ignored. This aspect has been highlighted in the CO-mediated pathway, as shown later in the in situ FTIR study. Thus, the synergy between both Ni and NiO must be considered to fully understand the reaction pathways.The role of the Ni active sites has been thoroughly elucidated previously. Ren et al. investigated the reaction mechanism of the CO2 methanation on the Ni (111) surface using DFT calculations. The formation of HCOO* has a relatively low energy barrier, making it a kinetically favorable step. However, the RWGS pathway starts with the conversion of CO2 to CO, which requires overcoming a higher energy barrier, making it less favorable. The subsequent hydrogenation of CO by intermediates, such as COH*, CHO*, and CH*, to form CH4 involves a higher activation energy compared to the corresponding steps in the formate pathway. The activation energy of the rate-determining step in the formate pathway is 0.85 eV, compared to 1 eV for the RWGS pathway. This lower energy value associated with the intermediates of the formate pathway indicates its relatively higher stability, making it the preferred pathway for CO2 methanation on Ni(111) surfaces.108 Similarly, Jin Huang et al. investigated the mechanisms of carbon dioxide methanation in Ni/MgO catalysts with both CO and formate pathways. In the formate pathway, CO2 is adsorbed on the MgO support, forming carbonate species that are hydrogenated to formate (HCOO*). This formate is then hydrogenated to HCO*, H2CO*, H3CO*, and finally CH4. In the CO pathway, CO2 is first reduced to CO, which is adsorbed on the Ni surface and hydrogenated by intermediates, such as COH*, CHO*, and CH*, to form methane. The activation energy of the rate-determining step of the formate pathway in Ni/MgO is about 0.78 eV, which is smaller than the corresponding step with Ni alone. Although the Ni/MgO catalyst has an improved CO pathway, the activation energy of its intermediates is still higher, making it less efficient overall.109 Xu et al. also showcased the formate pathway on Ni. In the formate pathway, CO2 initially adsorbs on the ZrO2 surface to form carbonate species that are hydrogenated to formate (HCOO*). This intermediate is further hydrogenated with HCO*, H2CO*, H3CO*, and finally methane (CH4). The ZrO2 support, like MgO in the work by Jin Huang et al., improves the stabilization of these intermediates by lowering the energy barriers of each step. In the CO pathway, CO2 is initially converted to CO, which is then adsorbed on the Ni surface. Hydrogenation of CO occurs before methane formation through intermediates, such as COH*, CHO*, and CH*. Although ZrO2 initially aids in the activation and reduction of CO2 to CO, subsequent steps occur mostly on the Ni surface. The study finds that the formate pathway of the Ni/ZrO2 catalyst has lower activation barriers than the CO pathway. The formation of formate on ZrO2 is particularly favorable due to the energy barrier of approximately 0.65 eV. Subsequent hydrogenation steps on the Ni surface are also energetically feasible, maintaining a reasonable activation energy throughout the route. However, despite the initial facilitation of the ZrO2 support, the CO pathway involves higher energy barriers for the intermediates COH*, CHO*, and CH*, making it less efficient. The activation energy of the rate-determining step of the formate pathway of the Ni/ZrO2 catalyst is around 0.65 eV, which is lower than the activation energy of the unsupported Ni or Ni supported by other materials.110
A few control experiments were studied to assess the role of NiO at 300 °C under a mixture of CO2 and H2. As the stability studies were conducted at 300 °C, the same temperature was chosen for the CO2 and CO2–H2 mixture treatment in the control experiment on the reduced catalyst. The results are shown in Fig. S11.†
Considering the outcomes of the control experiments, simulations on NiO were performed to determine the role of the oxidized Ni. A geometric optimization was performed on the pristine NiO lattice to fully relax the system, as shown in Fig. S12.† DFT simulations were conducted to gain mechanistic insights for these reaction pathways after determining the stable locations of each species involved across the various reaction intermediate routes. Two different pathways were investigated for converting CO2 into CH4 on NiO. These can be categorized as pathway 1 and pathway 2, which involve the formation of HCOOH* and CO* as intermediate species.108,111 The two pathways start with the adsorption of one molecule of CO2 onto the O-Top site, followed by the simultaneous dissociation of one H2 molecule and the adsorption of 2H atoms on the O-Top site, as shown in Fig. S13.† At this point, the surface has two adsorbed species on it, and the total energy of this system is taken as the reference point for the relative energy calculations (refer to Table S1†).
 and H*, they react to form an intermediate species, HCOO*, in the bridge site on the surface (Fig. 9(a)). The energy difference for the formation of HCOO* is calculated to be 2.17 eV. The HCOO* further reacts with the remaining H* atom to form HCOOH* (Fig. 9(b)).
 | ||
Fig. 9 Formation of (a) HCOO*, (b) HCOOH*, (c) H2COOH*, (d) H2CO* and H2O*, (e)  and OH*, (f) and OH*, (f)  and H2O*, (g) and H2O*, (g)  and 2H*, (h) and 2H*, (h)  , and (i) , and (i)  on the NiO (200) surface. on the NiO (200) surface. | ||
Another molecule of H2 introduced to the system dissociates to form 2H atoms, which are then adsorbed onto the O-Top site of the surface. H* reacts with HCOOH* to form H2COOH* and H* with an energy difference of −0.482 eV. It should be noted that H2COOH* is now adsorbed through its oxygen atom on the Ni-Top site (Fig. 9(c)). Interestingly, a dehydration reaction occurs, and H2COOH* dissociates into H2O* and H2CO* (Fig. 9(d)). H2O* and H2CO* are adsorbed onto the Ni-Top and bridge sites. H2O can desorb, and a new H2 molecule is introduced to the system. The process repeats as H2 is dissociated, and 2H atoms are adsorbed onto the O-Top sites. H2CO* reacts with H* to form H2COH*, and the energy released to achieve this is 1.28 eV. H2COH* now dissociates into  and OH*.
  is adsorbed onto the O-Top site and OH* onto the Ni-Top site (Fig. 9(e)). The energy required to achieve this is 0.156 eV. OH* reacts with the already existing H* to form H2O*, which is later allowed to desorb (Fig. 9(f)). Following this, another H2 molecule is introduced to the system, which subsequently gets dissociated into two H atoms that are adsorbed onto the O-Top sites of the surface (Fig. 9(g)).
  and H* now react to produce
  (Fig. 9(h)). The energy required to achieve this conversion is 1.11 eV. In the end,
  and the remaining H* atom react to produce
  , and the energy required to achieve this is 2.72 eV (Fig. 9(i)). After performing the DFT calculation for each intermediate step of pathway 1, an energetics diagram (Fig. S14†) was plotted to understand how the energies of each step vary with the initial step.
After the initial adsorption of CO2 onto the O-Top site,  dissociates into CO* and O* (Fig. 10(a)). O* is adsorbed onto the Ni-Top site, while CO* resides at the same site. An H2 molecule is introduced to the system, which dissociates into two H atoms, and these are then adsorbed onto the O-Top site (Fig. 10(b)). O* and the two H* atoms combine from H2O*, which is later allowed to be desorbed from the surface (Fig. 10(c)). The only species remaining on the surface now is CO* (Fig. 10(d)), which dissociates into C* on the O-Top site and O* on the Ni-Top site. The energy required to achieve this was calculated to be 0.55 eV. This is followed by the adsorption of two H atoms on the O-Top site from the dissociation of an H2 molecule. O* combines with one of the H* atoms to form OH*, which later combines with the remaining H* atom to form H2O* (Fig. 10(e)). Yet again, H2O* can desorb away from the catalyst's surface.
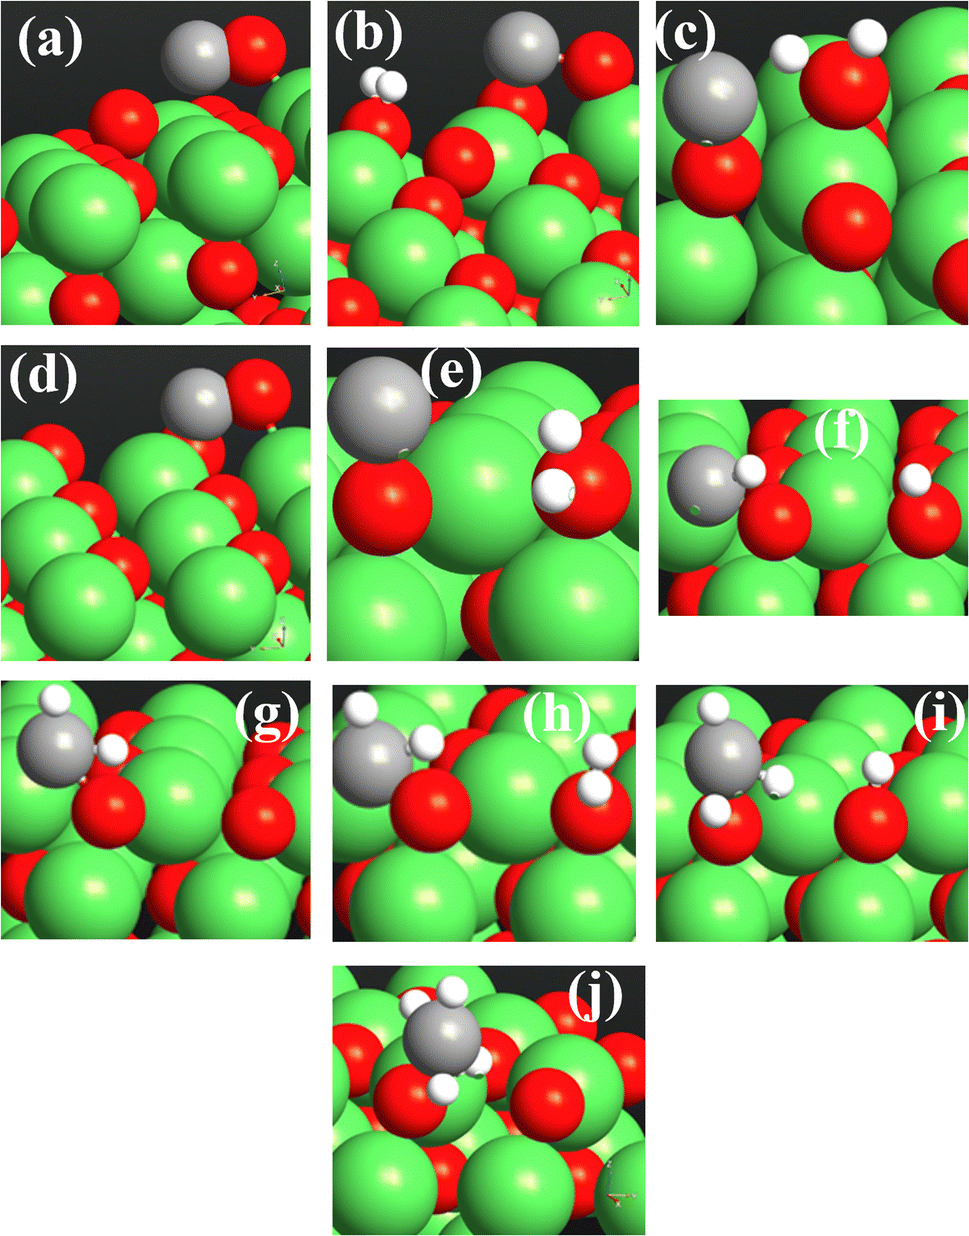 | ||
Fig. 10 Formation of (a) CO* and O*; (b) CO* and 2H*; (c) CO* and H2O*; (d) CO*; (e) C* and H2O*; (f) CH* and H*; (g)  ; (h) ; (h)  and 2H2O*; (i) and 2H2O*; (i)  and H*; (j) and H*; (j)  on the NiO (200) surface. on the NiO (200) surface. | ||
An H2 molecule dissociates, and the two H atoms are adsorbed onto the O-Top site. The surface now consists of a C* atom and two H* atoms. The C* reacts with an H* atom to form CH* (Fig. 10(f)) with the release of 2.07 eV of energy. CH* reacts with the remaining H* atom to form  (Fig. 10(g)). Finally, another molecule of H2 dissociates into two H atoms that are adsorbed onto the O-Top site (Fig. 10(h)).
  reacts with the remaining H* atoms to form
  (Fig. 10(i)), and finally
  (Fig. 10(j)).
A similar approach to construct a reaction energetics plot was applied for pathway 2 to better understand the energetics of the reaction (Fig. S15†).
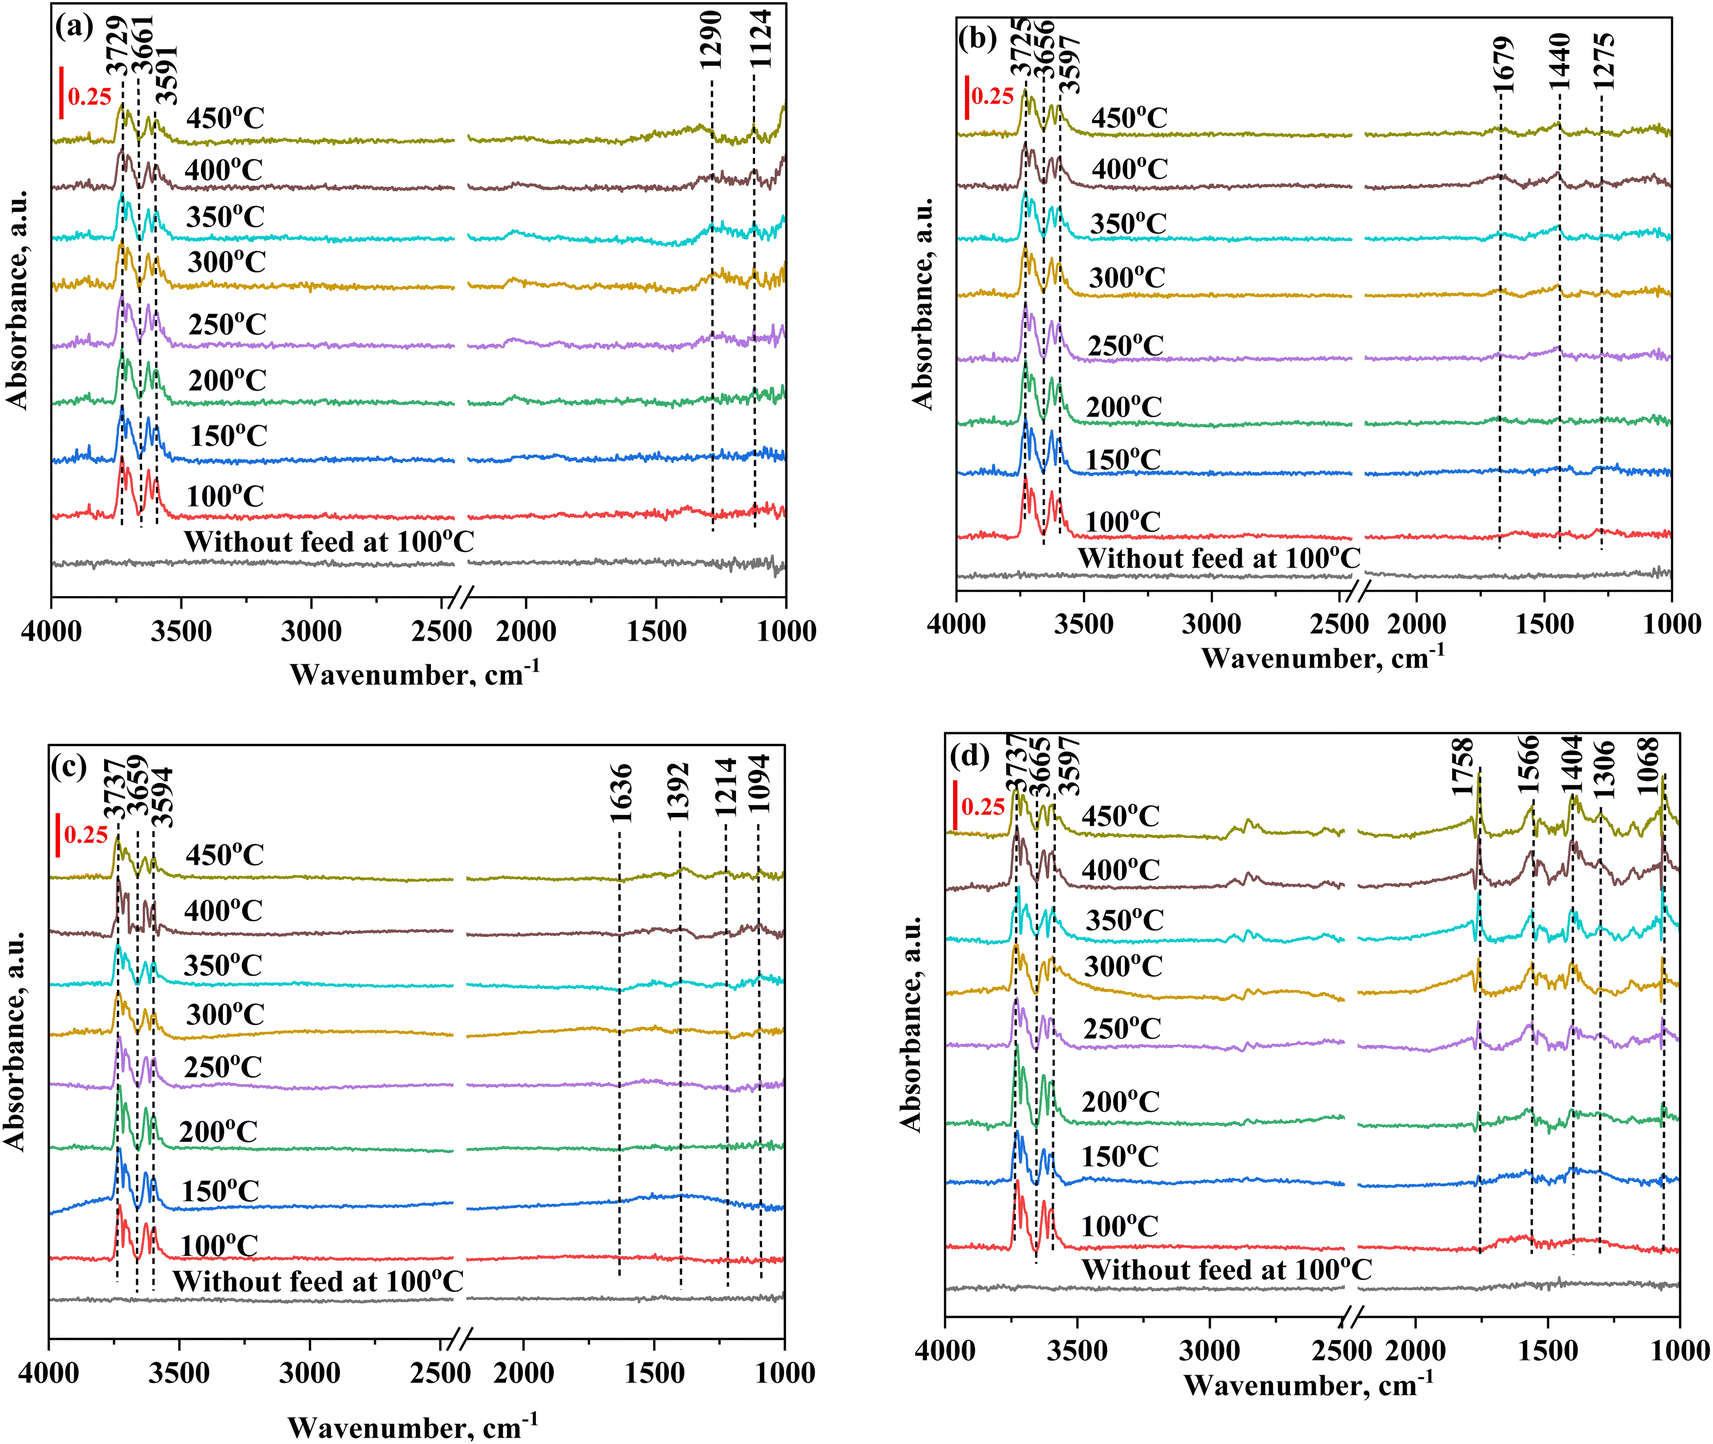
3.5. In situ FTIR study
Fig. 11 and 12 show the FTIR spectra of all core shell catalysts, where peaks ranging from 3725 cm−1 to 3591 cm−1 are identified and correlated as CO2 overtones. This correlation demonstrates an understanding of the CO2 molecular vibrational modes. In the composition of CO2:N2 (30:70 mL min−1), the NiO@SiO2 catalyst converts CO2 into monodentate, and bidentate carbonates can be observed in Fig. 11(a). These intermediates are further reacted in the presence of H2, and the formed distinct species can be seen in Fig. 12(a). The peak observed at 1560 cm−1 signifies the presence of the formate species. As the temperature was increased to 300 °C, the formate peak was diminished. Meanwhile, a subsequent increase occurred in the peak intensity at 1622 cm−1, representing the bicarbonate species. This transition indicates the decomposition of formate, releasing hydrogen and generating bicarbonate. Further hydrogenation leads to the formation of the ν-CH stretching vibration, corresponding to the methane peak, which was observed at 3013 cm−1 and 1302 cm−1. The peak intensity was found to increase as the temperature increases; this nature is implied in the formation of methane. The peak at 1872 cm−1 represents the bridged CO (ν-br-CO) on the Ni species.112,113 The carbonate peaks observed at 1132.5 cm−1 and 1008 cm−1 correspond to the presence of both bidentate carbonate and bicarbonate species.113Fig. 11(b) depicts the FTIR spectra with CO2 adsorption for the NiO@CeO2 catalyst without H2 flow, with peaks at 1679 cm−1, 1275 cm−1, and 1440 cm−1 representing bidentate carbonate and bicarbonate species. In Fig. 12(b), when CO2 and H2 were reacted, the formation of formate at 1490 cm−1 was observed as an intermediate species. Subsequent hydrogenation resulted in the appearance of ν-CH stretching signals, identified as methane, at 3015 cm−1 and 1308 cm−1. Peaks at 1655 cm−1 and 1490 cm−1 signify the asymmetric stretching vibration associated with CO adsorption (bidentate carbonate), along with the formate species, while the carbonate species were observed at 1183 cm−1.114,115 In Fig. 12(a) and (b), minor disturbances in the spectra were observed from 300 °C, which were attributed to moisture content, as water is a significant byproduct in the methanation reaction. In Fig. 11(c), the FTIR spectra of NiO@Co3O4 without H2 flow reveals distinctive peaks at 1636 cm−1 and 1214 cm−1, signifying the presence of bicarbonate species, while peaks at 1392 cm−1 and 1094 cm−1 indicate the presence of the carbonate species. Fig. 12(c) represents the FTIR spectra of NiO@Co3O4, which follows pathway 2 (CO pathway). CO2 dissociated into CO* and O*, followed by hydrogenation, resulting in the emergence of ν-CH stretching vibration peaks at 3014 cm−1 and 1307 cm−1, indicative of methane formation. Linear CO species were identified at 2182 cm−1 and 2214 cm−1. Additionally, peaks at 1390 cm−1 and 1102 cm−1 signify the symmetric vibration characteristic of bicarbonate and carbonate species, respectively.110,116 The FTIR spectra of NiO@ZrO2, presented in Fig. 12(d), exhibited distinct features. Peaks at 3015 cm−1 and 2854 cm−1 were attributed to the ν-CH stretching characteristic of methane.117,118 A notable observation was the emergence of a new peak at 1762 cm−1, identified as the antisymmetric C![[double bond, length as m-dash]](https://www.rsc.org/images/entities/char_e001.gif) O stretching vibration. This was indicative of CO2 adsorption in a COO− state at the Ni site, denoted as the
O stretching vibration. This was indicative of CO2 adsorption in a COO− state at the Ni site, denoted as the  species. This phenomenon was observed from 150 °C onwards, further facilitating the generation of CO on the NiO@ZrO2 catalyst, as evidenced by peaks at 2187 cm−1 and 2106 cm−1.118 Additionally, a peak at 1566 cm−1 indicated the formation of the formate species. The spectrum also revealed peaks at 1566/1306 cm−1, 1444 cm−1, and 1068 cm−1, corresponding to the asymmetric/symmetric stretching vibrations of carbonate, representing bidentate carbonate species, symmetric stretching vibration of monodentate carbonate, and bicarbonate species, respectively. Fig. 11(d) demonstrates a slight deviation in the carbonate species for the FTIR spectra of NiO@ZrO2 without H2 flow. Table S5† summarizes the infrared frequencies of the species observed for all catalysts from the in situ FTIR studies for CO2 methanation.
 | ||
| Fig. 11
In situ FTIR analysis of (a) NiO@SiO2, (b) NiO@CeO2, (c) NiO@Co3O4, and (d) NiO@ZrO2 without H2 flow (flow conditions: CO2:N2 = 30:70 mL min−1. The reduction conditions are maintained at 400 °C with an H2 flowrate of 50 mL min−1 for 1 h). | ||
 | ||
| Fig. 12
In situ FTIR analysis of (a) NiO@SiO2, (b) NiO@CeO2, (c) NiO@Co3O4, and (d) NiO@ZrO2 (flow conditions: CO2:H2:N2 = 10:40:50 mL min−1, and the reduction conditions are at 400 °C with an H2 flowrate of 50 mL min−1 for 1 h). | ||
In situ FTIR studies were conducted with and without H2 reduction for understanding the pivotal role of oxygen vacancies. Detailed spectra of CO2 adsorption over NiO@SiO2 and NiO@CeO2 are provided in Fig. S16,† with representative spectra at 350 °C and 400 °C. Bicarbonate (*CO3H, 1008 and 1622 cm−1) and bidentate carbonate (*CO3, 1132 cm−1) species, recognized as critical intermediates in methane formation, were observed. Samples not subjected to H2 reduction exhibited lower signal intensities for the *CO3H and *CO3 species, indicating less effective intermediate formation. The formation of the *HCO3 and *CO3 intermediates across all samples demonstrates that the oxygen vacancies, created through thermal and reduction treatments, significantly enhance CO2 adsorption.24 Notably, a greater production of *CO, resulting from the conversion of *CO3 and *HCO3, was observed over reduced NiO@SiO2, highlighting *CO as a key intermediate for methane production.78,81 During the reduction process, CO2 first adsorbs onto the surface and interacts with oxygen vacancies and *OH groups to form *CO3 and *HCO3. The *CO3 species, adsorbed on oxygen vacancies, are then hydrogenated to form *CO, which subsequently migrates to the active Ni,110 as confirmed by in situ FTIR experiments. These intermediates, particularly *HCO3 on basic sites and *CO on Ni, undergo continuous hydrogenation, leading to methane formation on the catalyst surface. The literature predominantly discusses two mechanisms for CO2 methanation: the dissociative pathway (via *CO formation) and the associative pathway (via the formation of bicarbonates, formates, and carboxyl species). Our findings suggest a novel oxygen-assisted mechanism that follows the dissociative pathway for CO2 methanation. This study confirms that oxygen vacancies significantly influence the catalytic performance of Ni-based catalysts during CO2 methanation.
From both DFT simulations and in situ FTIR findings, it was observed that NiO@S (where S = SiO2, CeO2, ZrO2) follows both pathway 1 (formate pathway) and pathway 2, while NiO@Co3O4 only follows pathway 2 (CO pathway).
3.6. Characterization of spent catalyst
 | ||
| Fig. 13 XPS spectra of (a) Ni 2p NiO@SiO2-50 h and (b) Ni 2p NiO@CeO2-50 h for spent catalysts under lean feed (LS) and realistic feed (RS) conditions. | ||
 | ||
| Fig. 14 SEM images of the (a) NiO@SiO2 and (b) NiO@CeO2 spent catalysts. | ||
3.7. CO2 and H2 capture studies
Among the four catalysts analyzed through the BET surface area, NiO@SiO2 exhibited the highest surface area. As corroborated by CO2 TPD studies, NiO@SiO2 has abundant weak basic sites, revealing its superior CO2 capture performance at 301.96 mg of CO2 per g at 25 °C and 50 bar.120–122 From Table 4, it is clear that NiO@CeO2 exhibits a significant CO2 capture ability up to 279.75 mg of CO2 per g. NiO@ZrO2 demonstrated medium and strong basic sites at high temperatures, while NiO@Co3O4 exhibited medium basic sites, contributing to their respective levels of CO2 adsorption of 259.65 and 227.66 mg of CO2 per g. However, desorption does not occur as readily as adsorption of CO2, as shown in Fig. 15. Desorption at 1 bar suggests that CO2 is still retained within the catalyst, indicating its capacity to chemisorb or capture CO2 at atmospheric pressure for CO2 capture. Interestingly, this behaviour deviates from the adsorption trend during desorption at ambient temperature. In situ FTIR analysis further supports this phenomenon, revealing CO2 adsorption at 1 bar. When monitoring the catalyst through in situ FTIR at varying temperatures under atmospheric pressure, intermediates can be observed in Fig. 12, such as carbonates, bidentate carbonate, and monodentate carbonate. NiO@Co3O4 has the highest CO2 capture ability of 90.40 mg of CO2 per g at 1 bar due to its greater pore volume of 0.23 cm3 g−1. NiO@CeO2 shows the lowest CO2 capture of 25.05 mg of CO2 per g at 1 bar. This provides insights into the mechanisms of CO2 adsorption on the catalyst surface, and the ensuing reactions occurring solely in the presence of CO2 at atmospheric pressure.| Catalyst | CO2 adsorption capacity at 298 K (mg of CO2 per g) | H2 adsorption capacity at 298 K (mg of H2 per g) | ||
|---|---|---|---|---|
| At 1 bar | At 50 bar | At 1 bar | At 50 bar | |
| (a) NiO@SiO2 | 30.33 | 301.96 | 0.06 | 0.74 |
| (b) NiO@CeO2 | 25.05 | 279.75 | 0.14 | 0.67 |
| (c) NiO@ZrO2 | 57.01 | 259.65 | 0.05 | 0.77 |
| (d) NiO@Co3O4 | 90.40 | 227.66 | 0.15 | 1.01 |
 | ||
| Fig. 15 CO2 and H2 adsorption and desorption at 298 K of (a) NiO@SiO2, (b) NiO@CeO2, (c) NiO@ZrO2, and (d) NiO@Co3O4. | ||
For H2 adsorption, low values are observed due to the low adsorption affinity of H2 gas.123 NiO@Co3O4 shows high H2 adsorption of 1.01 mg of H2 per g at 50 bar and 25 °C, while NiO@CeO2 shows the lowest H2 ability of 0.67 mg of H2 per g. While slight variations exist in the CeO2 and ZrO2 catalysts, substantial differences are not evident at both 50 and 1 bar. However, the trends for adsorption and desorption remain consistent. Notably, during desorption at 1 bar, these catalysts exhibit H2 adsorption, indicating their chemisorption capability in retaining H2 under atmospheric pressure. NiO@Co3O4 and NiO@CeO2 exhibit nearly identical H2 adsorption capacities, 0.15 and 0.14 mg of H2 per g, respectively. The similar capture ability at low pressures may be due to their equivalent mean pore diameters.
4. Conclusions
The impact of several metal oxide shell materials on the Ni/NiO core was investigated. Both NiO@SiO2 and NiO@CeO2 were found to be the most effective catalysts for CO2 methanation. After 300 °C, a diminishing trend in the conversion and selectivity was noticed in all active catalysts owing to competing side reactions. Stability studies revealed that both NiO@SiO2 and NiO@CeO2 are highly stable for 50 h under lean and rich CO2 concentration in the feed. TPR studies showed that the oxygen storage capacity and redox nature of the catalysts play a vital role in activating CO2 molecules. A moderate reducible nature of NiO@CeO2 and NiO@SiO2 (10.9 mmol g−1 and 10.0 mmol g−1) was observed when compared to NiO@Co3O4 (17.6 mmol g−1). Although the reducible nature is low, the large number of weak and medium basic sites of NiO@CeO2 and NiO@SiO2 contributed to enhancing the catalytic activity.Two mechanisms through DFT studies were observed to be prominent in dissociating CO2 to form carbonyl groups. Ni plays an active role in forming transition states at lower free energies than NiO. However, as Ni easily gets reoxidized (as proven from the control experiments), the role of lattice oxygen in reoxidized NiO was also assessed in the reaction mechanism. Furthermore, the intermediates (atomic oxygen, atomic hydrogen, CO, CH4, H2, O2 and H2O) considered in the reaction pathways of DFT are identified using CO2-TPD-MS by replicating the similar conditions of the catalyst pre-treatment. The CO2 methanation mechanism on these catalysts is elucidated through a combination of in situ FTIR spectra, CO2-TPD-MS and DFT studies, offering valuable insights into the reaction pathways. The formate pathway from DFT studies correlated with the mechanism observed in the FTIR spectra of the following catalysts NiO@S (where, S = SiO2, CeO2, ZrO2), while the NiO@Co3O4 catalyst showed the CO pathway alone. CO2 and H2 adsorption studies were conducted in the pressure range of 1–50 bar. At 50 bar, NiO@SiO2 exhibits the highest CO2 adsorption capacity of 301.96 mg of CO2 per g, whereas at 1 bar, NiO@Co3O4 captures 90.40 mg of CO2 per g. Both high OSC materials (NiO@CeO2 and NiO@Co3O4) showed higher H2 uptake than others at 1 bar. However, NiO@Co3O4 continued to outperform other materials at 50 bar. Although the H2 and CO2 capture ability of NiO@SiO2 and NiO@CeO2 is moderate, the large number of low and medium strength basic sites contributed to its superior catalytic activity. Among all catalysts, NiO@SiO2 has offered the best catalytic activity with the lowest apparent activation energy of 82.0 ± 2 kJ mol−1.
Data availability
The data supporting this article have been included as part of the ESI.†Conflicts of interest
The authors state that they have no known conflicting financial interests or personal ties that may have seemed to influence the work presented in this study.Acknowledgements
S. A. S. thanks the Science & Engineering Research Board (SERB), Department of Science and Technology (Grant No. CRG/2021/000333) for their financial support. Y. V. and L. Y. thank the BITS-Pilani Hyderabad campus for providing institute fellowships. The authors are grateful for the characterization facilities offered by the Central Analytical Laboratory, BITS-Pilani Hyderabad Campus. S. A. S. thanks DST-PURSE (Grant No. SR/PURSE/2020/20(G)) and DST-FIST (Grant No. SR/FST/ET-I/2021/918(C)) for funding the in situ FTIR and chemisorption facilities, respectively.References
- D. Gielen, F. Boshell, D. Saygin, M. D. Bazilian, N. Wagner and R. Gorini, Energy Strategy Rev., 2019, 24, 38–50 CrossRef.
- F. Perera, Int. J. Environ. Res. Public Health, 2018, 15(1), 16 CrossRef PubMed.
- W. F. Lamb, T. Wiedmann, J. Pongratz, R. Andrew, M. Crippa, J. G. J. Olivier, D. Wiedenhofer, G. Mattiolo, A. A. Khourdajie, J. House, S. Pachauri, M. Figueroa, Y. Saheb, R. Slade, K. Hubacek, L. Sun, S. K. Ribeiro, S. Khennas, S. D. L. R. D. Can, L. Chapungu, S. J. Davis, I. Bashmakov, H. Dai, S. Dhakal, X. Tan, Y. Geng, B. Gu and J. Minx, Environ. Res. Lett., 2021, 16(7), 73005 CrossRef CAS.
- J. Yuan, R. Fu, Z. Wang, X. Zheng, Y. Wang, H. Yan, Y. Liu, Y. Qu, G. Zhang, B. Sun, L. Wang, W. Xu, X. Feng, D. Chen and C. Yang, ACS Catal., 2024, 14, 11045–11050 CrossRef CAS.
- Y. Yang, Y. Li, Y. Lu, Z. Chen and R. Luo, ACS Catal., 2024, 14, 10344–10354 CrossRef CAS.
- X. Zhu, T. Ge, F. Yang, M. Lyu, C. Chen and D. O. Hare, J. Mater. Chem. A, 2020, 8, 16421–16428 RSC.
- S. Wang, C. An and Q. H. Zhang, J. Mater. Chem. A, 2013, 1, 3540–3550 RSC.
- R. Aniruddha, V. M. Shama, I. Sreedhar and C. M. Patel, J. Cleaner Prod., 2022, 350, 131478 CrossRef CAS.
- R. Aniruddha, I. Sreedhar and B. M. Reddy, J. CO2 Util., 2022, 64, 102182 CrossRef CAS.
- R. Aniruddha, I. Sreedhar and R. Parameshwaran, Mater. Today: Proc., 2023, 72, 74–80 CAS.
- B. Wang, M. Mikhail, S. Cavadias, M. Tatoulian, P. D. Costa and S. Ognier, J. CO2 Util., 2021, 46, 101471 CrossRef CAS.
- K. Sawahara, K. Yatagai, T. Boll and A. P. R. Gemma, Int. J. Hydrogen Energy, 2022, 47, 19051–19061 CrossRef CAS.
- F. Zhang and P. Sun, Int. J. Chem. Kinet., 2021, 53, 946–953 CrossRef CAS.
- W. Gac, W. Zawadzki, G. Słowik, M. Kusmierz and S. Dzwigaj, Appl. Surf. Sci., 2021, 564, 150421 CrossRef CAS.
- W. Li, K. Wang, G. Zhan, J. Huang and Q. Li, ACS Sustain. Chem. Eng., 2020, 8, 14058–14070 CrossRef CAS.
- K. Stangeland, D. Kalai, H. Li and Z. Yu, Energy Procedia, 2017, 105, 2022–2027 CrossRef CAS.
- A. Chel and G. Kaushik, Alexandria Eng. J., 2018, 57, 655–669 CrossRef.
- P. Summa, K. Swirk, D. Wierzbicki, M. Motak, I. Alxneit, M. Ronning and P. D. Costa, Molecules, 2021, 26, 6506 CrossRef CAS.
- M. Bailera, P. Lisbona, L. M. Romeo and S. Espatolero, Renewable Sustainable Energy Rev., 2017, 69, 292–312 CrossRef CAS.
- J. Wu, Y. Huang, W. Ye and Y. Li, Adv. Sci., 2017, 4, 1700194 CrossRef.
- F. Geppert, D. Liu, M. V. E. Jansen, E. Weidner, C. Buisman and A. Heijne, Trends Biotechnol., 2016, 34, 879–894 CrossRef CAS PubMed.
- N. Aryal, T. Kvist, F. Ammam, D. Pant and L. D. M. Ottosen, Bioresour. Technol., 2018, 264, 359–369 CrossRef CAS.
- M. Thema, F. Bauer and M. Sterner, Renewable Sustainable Energy Rev., 2019, 112, 775–787 CrossRef CAS.
- J. Ren, F. Zeng, C. Mebrahtu and R. Palkovits, J. Catal., 2022, 405, 385–390 CrossRef CAS.
- A. I. Tsiotsias, N. D. Charisiou, E. Harkou, S. Hafeez, G. Manos, A. Constantiou, A. G. S. Hussien, A. A. Dabbawala, V. Sebastian, S. J. Hinder, M. A. Baker, K. Polychronopoulou and M. A. Goula, Appl. Catal., B, 2022, 318, 121836 CrossRef CAS.
- K. P. Kuhl, T. Hatsukade, E. R. Cave, D. N. Abram, J. Kibsgaard and T. F. Jaramillo, J. Am. Chem. Soc., 2014, 136, 14107–14113 CrossRef CAS PubMed.
- H. Yoshida, T. Nakajima, Y. Yazawa and T. Hattori, Appl. Catal., B, 2007, 71, 70–79 CrossRef CAS.
- M. Tahir, J. CO2 Util., 2020, 37, 134–146 CrossRef CAS.
- C. Shao, W. Li, Q. Lin, Q. Huang and D. Pi, Energy Technol., 2017, 5, 604–610 CrossRef CAS.
- A. I. Tsiotsias, N. D. Charisiou, I. V. Yentekakis and M. A. Goula, Catalysts, 2020, 10, 812 CrossRef CAS.
- G. C. Mao, X. T. Kan, M. X. Xiao, W. L. Liu, B. X. Dong and Y. L. Teng, Ind. Eng. Chem. Res., 2022, 61, 10124–10132 CrossRef CAS.
- C. Liang, X. Hu, T. Wei, P. Jia, Z. Zhang, D. Dong, S. Zhang, Q. Liu and G. Hu, Int. J. Hydrogen Energy, 2019, 44, 8197–8213 CrossRef CAS.
- J. B. Branco, P. E. Brito and A. C. Ferreira, J. Chem. Eng., 2020, 380, 122465 CrossRef CAS.
- W. Ahmad, M. N. Younis, R. Shawabkeh and S. Ahmed, Catal. Commun., 2017, 100, 121–126 CrossRef CAS.
- A. I. Tsiotsias, N. D. Charisiou, I. V. Yentekakis and M. A. Goula, A review, Nanomaterials, 2021, 11, 1–34 Search PubMed.
- L. Zeng, Y. Wang, Z. Li, Y. Song, J. Zhang, J. Wang, X. He, C. Wang and W. Lin, ACS Appl. Mater. Interfaces, 2020, 12, 17436–17442 CrossRef CAS PubMed.
- W. K. Fan and M. Tahir, A Review, Ind. Eng. Chem. Res., 2021, 60, 13149–13179 CrossRef CAS.
- C. Zhou, Y. Nan, F. Zha, H. Tian, X. Tang and Y. Chang, J. Fuel Chem. Technol., 2021, 49, 1444–1457 CrossRef CAS.
- M. C. Bacariza, I. Graca, J. M. Lopes and C. Henriques, ChemCatChem, 2019, 11, 2388–2400 CrossRef CAS.
- R. G. Chaudhuri and S. Paria, Chem. Rev., 2012, 112, 2373–2433 CrossRef.
- M. C. Daniel and D. Astruc, Chem. Rev., 2004, 104, 293–346 CrossRef CAS PubMed.
- F. Caruso, Adv. Mater., 2001, 13, 11–22 CrossRef CAS.
- T. Gholami, M. S. Niasari, M. Bazarganipour and E. Noori, Superlattices Microstruct., 2013, 61, 33–41 CrossRef CAS.
- V. Chiozzi and F. Rossi, Nanoscale Adv., 2020, 2, 5090–5105 RSC.
- T. A. Le, J. Kim, J. K. Kang and E. D. Park, Catal. Today, 2020, 356, 622–630 CrossRef CAS.
- J. Ilsemann, A. S. Eifert, J. Friedland, L. Kiewidt, J. Thoming, M. Baumer and R. Guttel, ChemCatChem, 2019, 11, 4884–4893 CrossRef CAS.
- Y. T. Li, L. Zhou, W. G. Cui, Z. F. Li, W. Li and T. L. Hu, J. CO2 Util., 2022, 62, 102093 CrossRef CAS.
- J. Cored, A. G. Ortiz, S. Iborra, M. J. Climent, L. Liu, C. H. Chuang, T. S. Chan, C. Escudero, P. Concepcion and C. Avelino, J. Am. Chem. Soc., 2019, 141, 19304–19311 CrossRef CAS PubMed.
- J. P. Perdew, K. Burke and M. Ernzerh, Phys. Rev. Lett., 1996, 77, 3865–3868 CrossRef CAS PubMed.
- W. Kohn and L. J. Sham, Phys. Rev., 1965, 140, A1133–A1138 CrossRef.
- P. E. Blochl, Phys. Rev. B:Condens. Matter Mater. Phys., 1994, 50, 17953–17979 CrossRef PubMed.
- J. D. Head and M. C. A. Zerner, Chem. Phys. Lett., 1985, 122, 264–270 CrossRef CAS.
- H. J. Monkhorst and J. D. Pack, Phys. Rev. B, 1976, 13, 5188–5192 CrossRef.
- J. J. Varghese and S. H. Mushrif, J. Phys. Chem. C, 2017, 121, 17969–17981 CrossRef CAS.
- P. G. Lustemberg, Z. Mao, A. Salcedo, B. Irigoyen, M. V. G. Pirovano and C. T. Campbell, ACS Catal., 2021, 11, 10604–10613 CrossRef CAS PubMed.
- D. Parimi, V. Sundararajan, O. Sadak, S. Gunasekaran, S. S. Mohideen and A. Sundaramurthy, ACS Omega, 2019, 4, 104–113 CrossRef CAS PubMed.
- L. M. N. C. Alves, M. P. Almedia, M. Ayala, C. D. Watson, G. Jacobs, R. C. R. Neto, F. B. Noronha and L. V. Mattos, Chem. Eng. Sci., 2021, 239, 116604 CrossRef CAS.
- S. A. Singh, S. Mukherjee and G. Madras, Mol. Catal., 2019, 466, 167–180 CrossRef CAS.
- L. K. Wu, W. Y. Wu, H. Z. Cao, G. Y. Hou, Y. P. Tang and G. Q. Zheng, J. Mater. Chem. A, 2017, 5, 10669–10677 RSC.
- P. Bindu and S. Thomas, J. Theor. Appl. Phys., 2014, 8, 123–134 CrossRef.
- C. Hu, M. Yoshida, H. C. Chen, S. Tsunekawa, Y. F. Lin and J. H. Huang, Chem. Eng. Sci., 2021, 235, 116451 CrossRef CAS.
- V. Nandal, R. Sarvesha, S. S. Singh, E. W. Huang, Y. J. Chang, A. C. Yeh, S. Neelakantan and J. Jain, J. Alloys Compd., 2021, 855, 157521 CrossRef CAS.
- S. Tuti, I. Luisetto, U. P. Laverdura and E. Marconi, Reactions, 2022, 3, 333–351 CrossRef CAS.
- K. Shanmuganandam, S. Thanikaikarasan, T. Ahamad, S. Ali and V. P. Sundramurthy, Nanomaterials, 2022, 2022, 1–9 Search PubMed.
- J. Grams, R. Ryczkowski, K. Chalupka, I. Sobczak, I. Rzeznicka and K. Przybysz, Materials, 2019, 12, 3792 CrossRef CAS PubMed.
- Y. Han, B. Wen and M. Zhu, Catalysts, 2017, 7, 21 CrossRef.
- R. P. Rocha, M. F. R. Pereira and J. L. Figueiredo, Catal. Today, 2023, 418, 114136 CrossRef CAS.
- C. Dong, R. Mu, R. Li, J. Wang, T. Song, Z. Qu, Q. Fu and X. Bao, J. Am. Chem. Soc., 2023, 145(31), 17056–17065 CrossRef CAS PubMed.
- S. A. Singh, Y. Varun, P. Goyal, I. Sreedhar and G. Madras, Catalysts, 2023, 13, 838 CrossRef CAS.
- Y. Varun, I. Sreedhar and S. A. Singh, J. Environ. Chem. Eng., 2022, 10, 108384 CrossRef CAS.
- Y. Varun, I. Sreedhar and S. A. Singh, Mater. Today Proc., 2022, 72, 417–424 CrossRef.
- I. Sreedhar, Y. Varun, S. A. Singh, A. Venugopal and B. M. Reddy, Catal. Sci. Technol., 2019, 9, 4478–4504 RSC.
- X. Wang, L. Zhu, Y. Liu and S. Wang, Sci. Total Environ., 2018, 625, 686–695 CrossRef CAS PubMed.
- X. Wang, L. Zhu, Y. Zhuo, Y. Zhu and S. Wang, ACS Sustain. Chem. Eng., 2019, 7, 14647–14660 CrossRef CAS.
- B. Wang, X. Zhu, S. Li, M. Chen, H. Lu and Y. Yang, Nanomaterials, 2018, 8, 701 CrossRef PubMed.
- A. J. Graham, P. V. Nguyen, H. Park, J. Nunn, V. Kandyba, M. Cattelan, A. Giampietri, A. Barinov, X. Xu, D. H. Cobden and N. R. Wilson, 2D Mater., 2024, 11, 045021 CrossRef CAS.
- S. A. Singh, K. Vishwanath and G. Madras, ACS Appl. Mater. Interfaces, 2017, 9, 19380–19388 CrossRef CAS PubMed.
- L. Ma, R. Ye, Y. Huang, T. R. Reina, X. Wang, C. Li, X. L. Zhang, M. Fan, R. Zhang and J. Liu, Chem. Eng. J., 2022, 446, 137031 CrossRef CAS.
- M. B. Peiro, J. Guilera and T. Andreu, Chem. Eng. J., 2022, 433, 133638 CrossRef.
- Y. Du, C. Qin, Y. Xu, D. Xu, J. Bai, G. Ma and M. Ding, Chem. Eng. J., 2021, 418, 129402 CrossRef CAS.
- J. Ren, C. Mebrahtu, L. Koppen, F. Martinovic, J. P. Hofmann, E. J. M. Hensen and R. Palkovits, Chem. Eng. J., 2021, 426, 131760 CrossRef CAS.
- X. Chen, S. Ullah, R. Ye, C. Jin, H. Hu, F. Hu, Y. Peng, Z. H. Lu, G. Feng, L. Zhou and R. Zhang, Energy Fuels, 2023, 37, 3865–3874 CrossRef CAS.
- A. Quindimil, U. D. L. Torre, B. P. Ayo, A. D. Quinonero, E. B. Garcia, D. L. Castello, J. A. G. Marcos, A. B. Lopez and J. R. G. Velasco, Catal. Today, 2020, 356, 419–432 CrossRef CAS.
- J. Wu, Z. Jin, B. Wang, Y. Han, Y. Xu, Z. Liang and Z. Wang, Ind. Eng. Chem. Res., 2019, 58, 20536–20542 CrossRef CAS.
- X. Jia, X. Zhang, N. Rui, X. Hu and C. J. Liu, Appl. Catal., B, 2019, 244, 159–169 CrossRef CAS.
- X. Lin, S. Wang, W. Tu, Z. Hu, Z. Ding, Y. Hou, R. Xu and W. Dai, Catal. Sci. Technol., 2019, 9, 731–738 RSC.
- G. D. Piano, J. J. A. Gamboa, A. M. Condo and F. C. Gennari, Int. J. Hydrogen Energy, 2024, 56, 1007–1019 CrossRef.
- H. Fu, S. Sun and H. Lian, J. CO2 Util., 2023, 69, 102415 CrossRef CAS.
- P. B. Weisz and C. D. Prater, Adv. Catal., 1954, 6, 143–196 CAS.
- N. Rui, X. Zhang, F. Zhang, Z. Liu, X. Cao, Z. Xie, R. Zou, S. D. Senanayake, Y. Yang, J. A. Rodriguez and C. J. Liu, Appl. Catal., B, 2021, 282, 119581 CrossRef CAS.
- Z. Fan, K. Sun, N. Rui, B. Zhao and C. Liu, J. Energy Chem., 2015, 24, 655–659 CrossRef.
- Y. Xu, Y. Chen, J. Zhou, M. Song, X. Zhang and Y. Yin, Int. J. Hydrogen Energy, 2017, 42, 13085–13091 CrossRef CAS.
- S. A. Singh, G. Madras and I. Sreedhar, Top. Catal., 2021, 64, 243–255 CrossRef CAS.
- M. A. A. Aziz, A. A. Jalil, S. Triwahyono, R. R. Mukti, Y. H. T. Yap and M. R. Sazegar, Appl. Catal., B, 2014, 147, 359–368 CrossRef CAS.
- X. Geng, D. Lahem, C. Zhang, C. J. Li, M. G. Olivier and M. Debliquy, Ceram. Int., 2019, 45, 4253–4261 CrossRef CAS.
- V. M. Shinde and G. Madras, AIChE J., 2014, 60, 1027–1035 CrossRef CAS.
- U. Kwon, B. G. Kin, D. C. Nguyen, J. H. Park, N. Y. Ha, S. J. Kim, S. H. Ko, S. Lee, D. Lee and H. J. Park, Sci. Rep., 2016, 6, 30759 CrossRef CAS PubMed.
- K. Michalska, P. Kowalik, W. Prochniak and T. Borowiecki, Catal. Lett., 2018, 148, 972–978 CrossRef CAS.
- G. Zhi, X. Guo, Y. Wang, G. Jin and X. Guo, Catal. Commun., 2011, 16, 56–59 CrossRef CAS.
- S. A. Singh, B. Vemparala and G. Madras, J. Environ. Chem. Eng., 2015, 3, 2684–2696 CrossRef CAS.
- S. A. Singh and G. Madras, Appl. Catal., A, 2015, 504, 463–475 CrossRef CAS.
- L. Xiao, J. A. Spies, C. J. Sheehan, Z. Zeng, Y. Gao, T. Gao, A. Ehrlacher, M. W. Zuerch, G. W. Brudvig and T. E. Mallouk, J. Am. Chem. Soc., 2024, 146, 18117–18127 CrossRef CAS PubMed.
- S. H. Pamu, K. B. S. Vashist, P. S. Ganesh, P. D. Costa and S. A. Singh, Catal. Today, 2024, 441, 114841 CrossRef CAS.
- X. Wang, W. Yan, H. Li and Z. Wang, Nitrogen-Doped Ni/TiO2 Catalyst with Enhanced Activity and Improved Selectivity for CO2 Methanation, Energy Fuels, 2022, 36, 11647–11653 CrossRef CAS.
- K. I. Maslakov, Y. A. Teterin, A. J. Popel, A. Y. Teterin, K. E. Ivanov, S. N. Kalmykov, V. G. Petrov, P. K. Petrov and I. Farnan, Appl. Surf. Sci., 2018, 448, 154–162 CrossRef CAS.
- X. Chen, Q. Wu, D. H. Kuo, A. B. Abdeta, H. Zhang, P. Li, T. Huang, O. A. Zelekew and J. Lin, J. Mater. Chem. A, 2023, 11, 4126–4141 RSC.
- I. A. Ivanin, O. V. Udalova, I. Y. Kaplin and M. I. Shilina, Appl. Surf. Sci., 2024, 655, 159577 CrossRef CAS.
- J. Ren, H. Guo, J. Yang, Z. Qin, J. Lin and Z. Li, Appl. Surf. Sci., 2015, 351, 504–516 CrossRef CAS.
- J. Huang, X. Li, X. Wang, X. Fang, H. Wang and X. Xu, J. CO2 Util., 2019, 33, 55–63 CrossRef CAS.
- X. Xu, Y. Tong, J. Huang, J. Zhu, X. Fang, J. Xu and X. Wang, Fuel, 2021, 283, 118867 CrossRef CAS.
- Y. Yang, J. Liu, F. Liu and D. Wu, Fuel, 2020, 276, 118093 CrossRef CAS.
- R. P. Ye, W. Gong, Z. Sun, Q. Sheng, X. Shi, T. Wang, Y. Yao, J. J. Razink, L. Lin, Z. Zhou, H. Adidharma, J. Tang, M. Fan and Y. G. Yao, Energy, 2019, 188, 116059 CrossRef CAS.
- Y. Zhao, V. Girelli, O. Ersen and D. P. Debecker, J. Catal., 2023, 426, 283–293 CrossRef CAS.
- L. P. L. Goncalves, J. Mielby, O. S. G. P. Soares, J. P. S. Sousa, D. Y. Petrovykh, O. I. Lebedev, M. F. R. Pereira, S. Kagnaes and Y. V. Kolenko, Appl. Catal., B, 2022, 312, 121376 CrossRef CAS.
- Z. Bian, Y. M. Chan, Y. Yu and S. Kawi, Catal. Today, 2020, 347, 31–38 CrossRef CAS.
- M. Wang, G. Zhang, J. Zhu, W. Li, J. Wang, K. Bian, Y. Liu, F. Ding, C. Song and X. Guo, Chem. Eng. J., 2022, 446, 137217 CrossRef CAS.
- A. Efremova, T. Rajkumar, A. Szamosvolgyi, A. Sapi, K. Baan, I. Szenti, J. G. Perez, G. Varga, J. Kiss, G. Halasi, A. Kukuovace and Z. Konya, J. Phys. Chem. C, 2021, 125, 7130–7141 CrossRef CAS.
- L. M. N. C. Alves, M. P. Almeida, M. Ayala, C. D. Watson, G. Jacobs, R. C. R. Neto, F. B. Noronha and L. V. Mattos, Chem. Eng. Sci., 2021, 239, 116604 CrossRef CAS.
- J. Li, P. Li, J. Li, Z. Tian and F. Yu, Catalysts, 2019, 9, 506–518 CrossRef CAS.
- B. Ashourirad, P. Arab, T. Islamoglu, K. A. Cychosz, M. Thommes and H. M. E. Kaderi, J. Mater. Chem. A, 2016, 4, 14693–14702 RSC.
- T. R. Menezes, K. M. C. Santos, T. S. L. Silva, K. S. Santos, A. L. Ramos, G. R. Borges, E. Franceschi, C. Dariva, J. F. D. Conto, S. M. Egues and C. C. Santana, Gas Sci. Eng., 2023, 119, 205136 CrossRef CAS.
- A. Chowdhury, S. Bhattacharjee, R. Chatterjee and A. Bhaumik, J. CO2 Util., 2022, 65, 102236 CrossRef CAS.
- T. G. Kim, D. W. Lee, C. H. Lee, Y. S. Hong and J. K. Suh, Korean J. Chem. Eng., 2023, 40, 2463–2471 CrossRef CAS.
Footnotes |
| † Electronic supplementary information (ESI) available. See DOI: https://doi.org/10.1039/d4ta07672a |
| ‡ These authors contributed equally to this work. |
| This journal is © The Royal Society of Chemistry 2025 |