
 Open Access Article
 This Open Access Article is licensed under a
 Creative Commons Attribution 3.0 Unported Licence
An electrochemically engineered layer of γ-NiOOH with FeOOH on nickel foam for durable OER catalysis for anion exchange membrane water electrolysis†
Sreekanth
Narayanaru
 a,
Hidenori
Kuroki
a,
Takanori
Tamaki
a,
Gopinathan M.
Anilkumar
ab and
Takeo
Yamaguchi
*a
a,
Hidenori
Kuroki
a,
Takanori
Tamaki
a,
Gopinathan M.
Anilkumar
ab and
Takeo
Yamaguchi
*a
aLaboratory for Chemistry and Life Sciences, Institute of Innovative Research, Tokyo Institute of Technology, Yokohama, 226-8503, Japan. E-mail: yamag@res.titech.ac.jp
bR&D Center, Noritake Co., Ltd., 300 Higashiyama, Miyochi-cho, Aichi-ken 470-0293, Japan
First published on 19th November 2024
Abstract
An efficient and durable oxygen evolution reaction catalyst is essential for the advancement of anion exchange membrane water electrolyzers. Here we report a simple, rapid, and cost-effective two-step electrochemical synthesis of an efficient and durable oxygen evolution reaction catalyst, which can be produced on an industrial scale. In the first step of catalyst preparation, a ≈250 nm thick γ-NiOOH layer was electrochemically developed over nickel foam. Then iron was electrochemically deposited on γ-NiOOH to stabilize the NiOOH species and improve the OER activity. Various material characterization techniques confirmed the presence of a highly OER-active combination of γ-NiOOH and FeOOH at the catalyst surface. The synergism between high valent Ni3.6+ in γ-NiOOH and Fe3+ in FeOOH helps the catalyst to attain 10 mA cm−2 at 1.47 V with a very low Tafel slope value of 34 mV per decade. The catalyst attained 1 A cm−2 at 1.65 V in 1 M KOH at 80 °C under real electrolyzer operational conditions. Furthermore, the catalyst exhibits stable OER activity at high current densities under real electrolyzer testing conditions.
Sustainability spotlightRecently, the demand for hydrogen as a carbon-free fuel has been increasing. Among the various methods of hydrogen production, green hydrogen production is the most compatible for a carbon neutral society. For global acceptance, the production cost of green hydrogen must be competitive with fossil fuel and other methods of hydrogen production. Anion exchange membrane water electrolysis is a relatively inexpensive technology for green hydrogen production because non-noble metals can be used as catalysts and electrolyzer components. In this work, a simple, scalable and energy efficient new method for non-noble metal catalyst preparation for water oxidation is described. The catalyst shows durable oxygen evolution activity in anion exchange membrane water electrolysis at high current density. |
Introduction
Water electrolysis coupled with renewable energy sources is a sustainable way to produce green hydrogen. Water electrolysis consists of the hydrogen evolution reaction (HER) and oxygen evolution reaction (OER) as two half-cell reactions. Theoretically, the overall water splitting reaction requires 1.23 V at 25 °C, but in reality, another 0.2 V or above overpotential is required to initiate the water splitting process due to poor catalytic activity and ohmic resistance of the system.1–3 Fundamentally, the OER is a sluggish electrochemical reaction, involving oxygen–oxygen bond formation, that occurs via four proton-coupled electron transfers.1,4–6 Hence the contribution from the OER to the overall energy loss of the electrolyzer is the highest. Further, since the OER takes place in a highly oxidative environment, catalyst degradation and loss of catalytic activity are issues that affect the life of the electrolyzer.7 An efficient and stable OER catalyst is inevitable for a durable water electrolyzer.The first row of transition metals exhibits promising OER activity in an alkaline medium.5,8–10 A wide range of transition metal compounds like oxides,11–13 nitrides,14 sulphides,15 phosphides/phosphates,16–19 and carbides20 were reported as superior OER catalysts. Systematic analysis of the OER mechanism of transition metal-based catalysts using different spectroscopic techniques reveals that the real catalytically active species are oxides of transition metals.21–23 M–OH, M–O, M–OOH, and M–OO intermediates were formed on all transition metal catalysts during the OER, regardless of the elements present with the metal on the catalyst surface.17,21,24–27 Later, it was discovered that bi/tri-metallic compounds have augmented OER activity compared to the corresponding mono-metallic catalysts.3,28–30 Among various bimetallic oxides, Ni–Fe based catalysts are more efficient and cost-effective for the OER.31–33 Even though the exact catalytic center of the Ni–Fe catalyst is still uncertain, all findings unanimously accept that the oxyhydroxide of these metals is important in the OER catalytic cycle.22,34–36 Individually, NiOOH and FeOOH are OER active but require a higher overpotential, and FeOOH has higher OER overpotential than NiOOH. However, the addition of a small amount of Fe to the NiOOH lattice was found to reduce the OER overpotential. Different findings have been reported regarding the high OER activity of the Fe doped NiOOH catalyst and its active sites. Combined X-ray adsorption analysis and DFT + U studies suggest that the Fe3+ incorporating γ-NiOOH is the active site for the OER.37 Mössbauer spectroscopy and Spectroelectrochemical + DFT studies confirm the formation of Fe4+ facilitated by NiOOH during the OER and report that the high valent iron oxide might be an important center of OER activity.38,39 Other theoretical studies suggest that both Fe and Ni synergistically promote the oxidation state of each other to the +4 state and both high valent metals participate equally to promote the OER activity of Fe doped NiOOH.40 Further, it is also reported that Fe addition to the lattice of NiOOH promotes the electronic conductivity of NiOOH.41
Several methods have been reported for the synthesis of NiFe catalysts in either powder form or on the surface of a conducting surface. Among the various synthesis methods, electrochemical synthesis is fairly fast, highly reproducible, and produces minimal waste. Further, since this method commonly requires low temperature and pressure, it is a more energy efficient and economical than other traditional material syntheses like wet-chemical, solid-state and vapor-phase synthesis. Here, we present a modified simple and quick two-step electrochemical method for the scalable synthesis of a durable Fe incorporated γ-NiOOH (γ-NiOOH–Fe) OER catalyst with high performance. The two-step method involves the selective synthesis of a thick γ-NiOOH layer (≈250 nm) on a clean Ni foam through electrochemical oxidation followed by electrochemical deposition of a thin layer of Fe on the γ-NiOOH layer. Material characterization of γ-NiOOH–Fe confirms the formation of γ-NiOOH after oxidation of Ni foam and the presence of both γ-NiOOH and FeOOH after Fe deposition. The electrocatalytic analysis of γ-NiOOH–Fe revealed its high OER activity by attaining a current density of 10 mA cm−2 at 1.47 V with a Tafel slope value of 34 mV per decade. The OER activity of γ-NiOOH–Fe remained stable after the accelerated durability test and long term constant current electrolysis at different current densities at room temperature. Furthermore, an anion exchange water electrolyzer was assembled with γ-NiOOH–Fe as the anode catalyst, and the electrolysis was performed at 80 °C in 1 M KOH solution. The electrochemical performance of the γ-NiOOH–Fe anode was simultaneously evaluated during electrolyzer polarization. Later, the durability of the γ-NiOOH–Fe anode was tested during high current density electrolysis. We also confirm that the described method of catalyst preparation is a highly reproducible, fast, economical, and feasible technique for large-scale production.
Results and discussion
Commercially purchased nickel foam has a surface oxide layer. Acid washing with 1 M HCl followed by water and alcohol cleaning removes the surface oxide layer and grease on the Ni foam.42 In the catalyst preparation process (Scheme 1), at first, a layer of NiOOH was fabricated over a cleaned Ni foam surface by oxidizing the Ni foam at a high potential (2.5 V) in 1 M KOH solution. Electrochemical oxidation of Ni in an alkaline medium initially produces Ni(OH)2 and further oxidation leads to the formation of NiOOH. As per the Bode cycle, (Fig. S1†) when Ni(OH)2 becomes oxidized, β-NiOOH forms primarily, and further oxidation causes the formation of γ-NiOOH.43,44 Here, the formation of γ-NiOOH mainly occurred on surface of the Ni foam, as the Ni foam was oxidized at 2.0 V higher than required for the formation of NiOOH. As it is undoubtedly proved that NiOOH is an important intermediate in the oxygen evolution reaction and the addition of Fe further enhances the OER activity and stability of NiOOH, a thin layer of Fe was electrochemically deposited on γ-NiOOH to obtain γ-NiOOH–Fe. For a comparison, another catalyst with only Ni–Fe composition was also prepared on a unoxidized Ni foam surface through a similar electrochemical Fe deposition process. | ||
| Scheme 1 Electrochemical fabrication of catalysts. | ||
The Raman spectrum of the oxidised Ni foam, presented in Fig. 1a, shows two major peaks at 479 cm−1 and 560 cm−1, attributed to the eg bending vibration and the A1g stretching vibration of Ni–O in γ-NiOOH, respectively. Further, the broad peak band between 850 cm−1 and 1200 cm−1 is ascribed to the active oxygen species (NiOO−) in oxyhydroxide.22,45 Later, when γ-NiOOH–Fe was derived by electrodepositing a thin layer of Fe on γ-NiOOH, an additional peak at 684 cm−1 was observed in addition to the peaks of γ-NiOOH, which corresponds to the FeOOH.46 The presence of FeOOH indicates that the electrochemically deposited Fe was quickly oxidized by the pre-oxidized Ni foam substrate consisting of γ-NiOOH. Meanwhile, the Raman spectrum of Ni–Fe has indicated the peaks at 456 and 534 cm−1 attributed to the Ni–O stretching vibration of NiFe.47
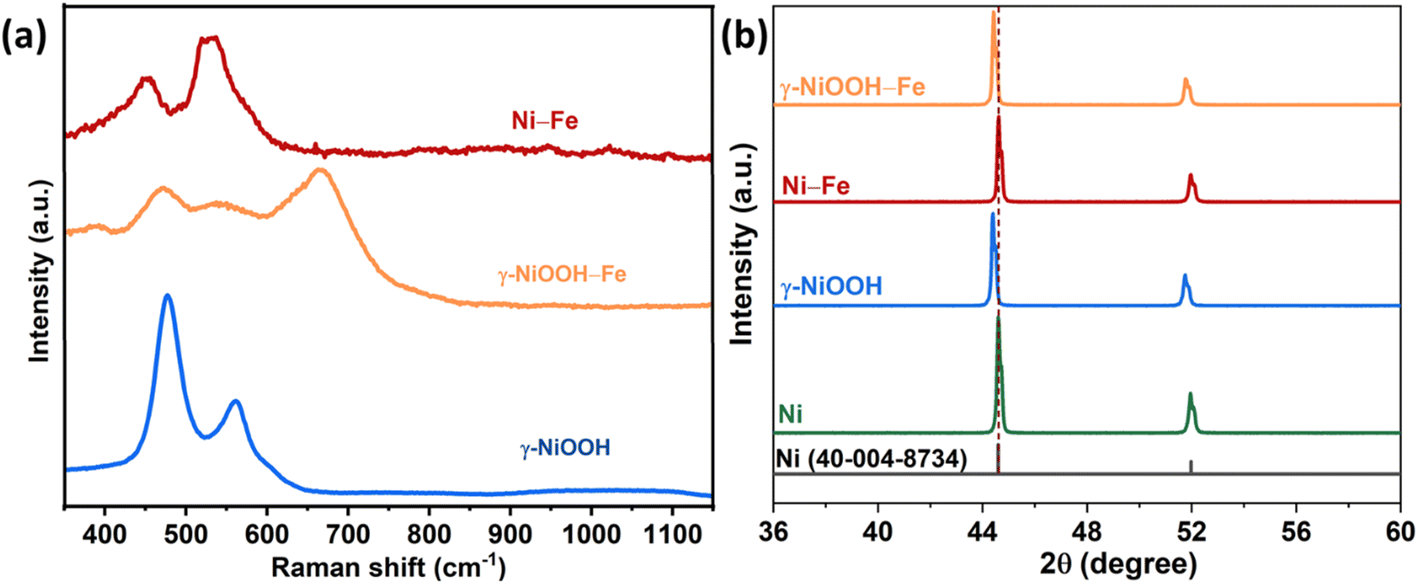 | ||
| Fig. 1 (a) Raman spectra of γ-NiOOH, γ-NiOOH–Fe and Ni–Fe catalysts; (b) XRD patterns of Ni-foam after acid washing, γ-NiOOH, Ni–Fe, and γ-NiOOH–Fe. | ||
The XRD pattern of acid washed Ni foam has two major peaks at 2θ values of 44.6 and 51.8 corresponding to the (111) and (200) planes of Ni.48 Although the Raman spectra showed the presence of γ-NiOOH on the surface of the oxidized Ni foam, the X-ray diffraction pattern showed no peaks of γ-NiOOH. But the peak position of γ-NiOOH shifted to lower angles compared to the acid washed Ni foam (Fig. 1b). The shift in peak position is attributed to lattice plane broadening due to the formation of γ-NiOOH. The crystal structure of γ-NiOOH comprises a large interlayer spacing (7 Å) and contains intercalated species such as water or ions that are absorbed between the layers. Further, the electrochemical deposition of Fe shows no characteristic change in the XRD pattern compared to that of γ-NiOOH, which is due to the thin layer deposition of Fe on γ-NiOOH. In the case of the Ni–Fe catalyst, no new peaks and no change in peak positions were observed when a thin layer of Fe was deposited on the Ni surface.
The surface oxidation states of γ-NiOOH–Fe and Ni–Fe were analyzed by X-ray photoelectron spectroscopy. The fine scan XPS spectra of Ni 2p, Fe 2p and O 1s of γ-NiOOH–Fe are presented in Fig. 2. The deconvoluted Ni 2p3/2 spectrum of γ-NiOOH–Fe consists of Ni2+ and Ni3+ peaks at 856.8 and 858.09 eV respectively with 30% of Ni2+ and 70% of Ni3+.49,50 The amount of Ni3+ in the γ-NiOOH–Fe suggests that the catalyst surface majorly consists of NiOOH. The positive shift in the binding energy values of Ni2+ and Ni3+ compared with normal values is due to the binding with the strong Lewis acid Fe3+.49 The Fe 2p3/2 and 2p1/2 peaks at 711.2 and 724.6 eV are ascribed to the Fe3+ of FeOOH and those at 713.5 and 727.7 eV correspond to the Fe2+ in γ-NiOOH–Fe.50,51 The calculated percentage of Fe3+ peaks out of the Fe 2p peak area is around 70% indicating that most of the Fe in γ-NiOOH–Fe is FeOOH. The deconvoluted O 1s spectrum of γ-NiOOH–Fe has three peaks centered at 529.6, 531.3, and 533.2 eV. The peak at 529.6 eV is referred to as the oxygen bound to the metal atom, such as from Ni–O and Fe–O bonds. The peak at 531.3 eV is from the oxygen in the OH− and that at 533.2 eV corresponds to the oxygen from the chemisorbed water molecules.42,52,53 Deconvoluted XPS spectra of Ni 2p, Fe 2p and O 1s of Ni–Fe are presented in Fig. S2.† The Ni 2p3/2 spectrum shows only the presence of Ni2+ at 854.9 eV.49 Fe 2p3/2 and Fe 2p1/2 spectra confirm the peaks of Fe at 705.6 and 721.2 eV, Fe2+ at 712.7 and 725.3 eV and Fe3+ at 710.3 and 723.5 eV.54,55 The O 1s spectrum has two peaks corresponding to the metal oxide peak at 529.4 eV and oxygen in OH− at 530.6 eV.52 Compared to the XPS spectra of Ni–Fe, peaks of Ni 2p, Fe 2p and O 1s appeared at higher binding energy because of the presence of a highly oxidized Ni surface.
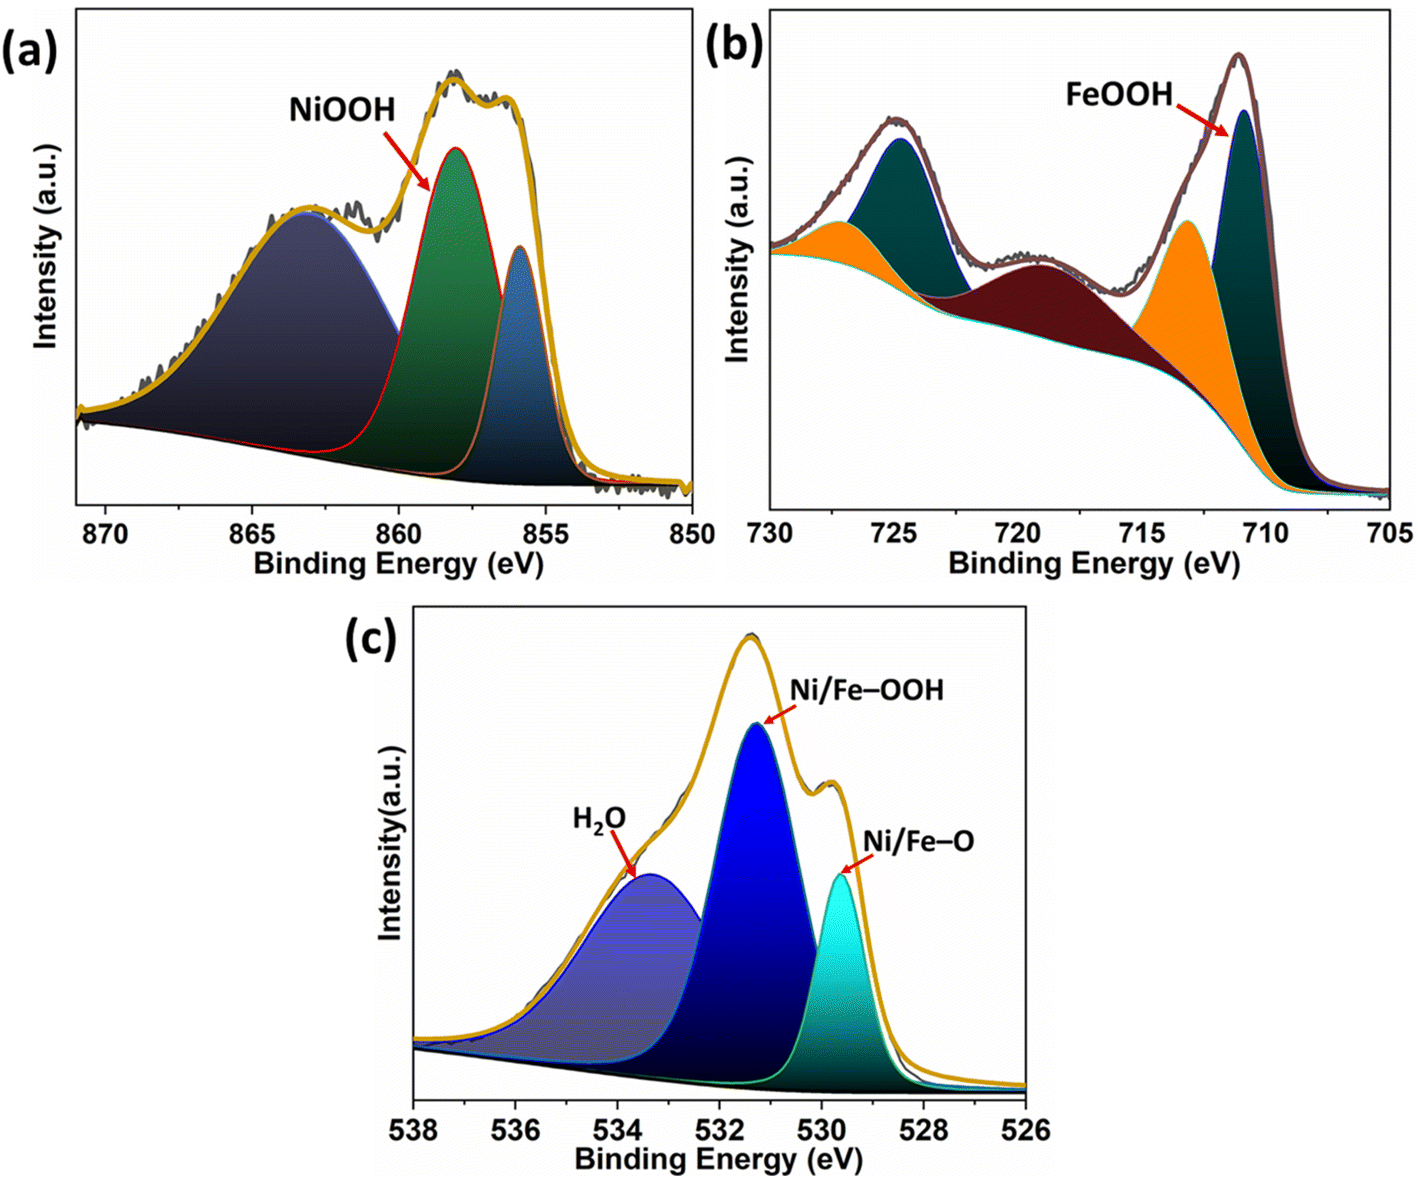 | ||
| Fig. 2 Deconvoluted XPS spectra (a) Ni 2p, (b) Fe 2p and (c) O 1s spectra of γ-NiOOH–Fe. | ||
The surface morphology of the catalysts was analysed by FE-SEM and the elemental composition (Ni, Fe and O) at the surface was measured by EDX. No characteristic surface feature was observed for the bare Ni foam (Fig. 3a); on the other hand, very fine, homogeneous nanoflake-like structures were observed for the electrochemically oxidized Ni foam due to the formation of γ-NiOOH (Fig. 3b). The nanoflakes grown vertically over the Ni substrate enhance the surface area of the material. Further, when Fe was deposited to create γ-NiOOH–Fe, the surface morphology of the oxidized Ni foam remained the same indicating that the Fe was uniformly deposited over the γ-NiOOH (Fig. 3c). Electrochemical deposition of Fe on the bare Ni foam produced a large petal-like morphology as shown in Fig. 3d. The amount of Fe present on the surface of Ni–Fe and γ-NiOOH–Fe was measured using EDX analysis, and was 17% and 10%, respectively. Cross-sectional SEM-EDX analysis of γ-NiOOH–Fe (Fig. 3e–h) and Ni–Fe (Fig. S3†) catalysts was performed to identify the oxide layer formation. In Fig. 3e, the cross-sectional SEM image of γ-NiOOH–Fe reveals that there is a layer approximately 250 nm thick on the surface, and the oxygen Kα1 map (Fig. 3g) confirms that this 250 nm thick layer is an oxide layer. The Fe Kα1 map of γ-NiOOH–Fe (Fig. 3h) confirms that 50% of the oxide layer contains Fe. In contrast, the cross-sectional SEM-EDX of Ni–Fe (Fig. S3†) shows no such thick oxide layer on the catalyst surface. Consolidating all the material characterisation results, it can be concluded that the γ-NiOOH–Fe catalyst has a γ-NiOOH and FeOOH layer that is ≈125 nm thick at the top and a ≈125 nm thick γ-NiOOH layer between the top layer and the bottom Ni substrate.
 | ||
| Fig. 3 FE-SEM images of (a) the bare Ni foam surface, (b) Ni foam surface after oxidation (γ-NiOOH), (c) γ-NiOOH–Fe and (d) Ni–Fe. (e) Cross-sectional SEM-EDX image of γ-NiOOH–Fe, and EDX mapping of (f) nickel, (g) oxygen, and (h) iron. | ||
All electrochemical analyses were performed in 1 M KOH solution to evaluate the electrochemical properties of catalysts. A stabilized voltammogram of Ni foam, Ni–Fe and γ-NiOOH–Fe was taken with a scan rate of 10 mV s−1 in a deaerated KOH solution, and the results are presented in Fig. 4a. The cyclic voltammogram of Ni-foam exhibited typical redox peaks corresponding to the conversion of Ni (OH)2 to NiOOH at 1.38 V in the forward scan and back to Ni (OH)2 at 1.27 V in the reverse scan. The Ni redox peaks of Ni–Fe and γ-NiOOH–Fe were shifted to higher potentials and the peak area and peak current were reduced compared to those of bare Ni, due to the presence of Fe on the catalyst surface.56,57 The redox peak of γ-NiOOH–Fe appeared at 1.40 and 1.34 V in the forward and reverse scans respectively. The redox peak of Ni–Fe became more anodic than that of γ-NiOOH–Fe and the oxidation and reduction peaks appeared at 1.41 V and 1.36 V, respectively. This is attributed to the higher surface concentration of Fe in Ni–Fe compared to γ-NiOOH–Fe. The double layer capacitance of the catalysts was measured to calculate the electrochemical surface area. Fig. S4† shows the cyclic voltammogram recorded at different scan rates to measure the double layer capacitance of Ni, Ni–Fe and γ-NiOOH–Fe. As a result of the high surface area, γ-NiOOH–Fe has higher double layer capacitance (1.70 mF) compared to Ni–Fe (1.32 mF) and bare Ni foam (0.6 mF). Further, the OER activity of all catalysts was evaluated by taking the voltammogram, and the current density was normalized with the electrochemical surface area. The OER activity of the catalysts is presented in Fig. 4b. Nickel foam attained 10 mA cm−2 at 1.61 V. Meanwhile, the potential required to attain the same current density for the Ni–Fe catalyst was 1.49 V. Compared to the other two catalysts, γ-NiOOH–Fe showed better OER performance by attaining 10 mA cm−2 at 1.47 V. Electrochemical Impedance spectra of the catalysts were measured at 1.5 V (Fig. 4c) to analyse the charge transfer kinetics. The low charge transfer resistance of γ-NiOOH–Fe supports its superior OER catalytic activity. Tafel plots of all catalysts were constructed to identify the intrinsic catalytic activity. The potentiostatic method was used to obtain steady state current at different overpotentials to draw the Tafel plot, and the results are presented in Fig. 4c. The γ-NiOOH–Fe has the lowest Tafel slope value of 34 mV dec−1 compared to Ni–Fe and Ni with Tafel slopes of 43 and 108 mV dec−1 respectively. The lowest Tafel slope of γ-NiOOH–Fe among the OER catalysts confirms that the high OER activity is intrinsic and not due to the surface area. In addition, the turnover frequency (TOF) of the γ-NiOOH–Fe and Ni–Fe was calculated at an overpotential of 300 mV, and the calculation method is given in the ESI.† The number of active sites of the catalysts was calculated from Ni2+/Ni3+ redox peaks (Ni is considered as the active site for the OER).58 The obtained TOF values of γ-NiOOH–Fe and Ni–Fe are 1.3 and 1.1 s−1, respectively. These results indicate that γ-NiOOH–Fe has excellent intrinsic OER activity. The OER activity of γ-NiOOH–Fe is compared with that of other recently reported NiFe based catalysts (Table S1†) to show the significance of this work.
 | ||
| Fig. 4 (a) Cyclic voltammetry responses, (b) OER activity, (c) Nyquist plot measured at 1.5 V, and (d) Tafel slope of Ni, Ni–Fe, and γ-NiOOH–Fe in 1 M KOH at 25 °C. | ||
The high intrinsic OER activity of γ-NiOOH–Fe is due to the existence of a synergistic combination of γ-NiOOH and FeOOH on the catalyst surface. In the γ-NiOOH–Fe catalyst, the layer above the Ni surface is γ-NiOOH, in which the Ni exists as Ni3.6+. The surface layer of the catalyst contains the strong Lewis acid Fe3+ as FeOOH along with γ-NiOOH. The electrophilic nature of the Fe3+ enhances the formation of Ni4+ during the polarization.40 The Ni4+ is crucial for the formation of the important O–O bond for the OER.40
The electrocatalytic durability of an OER catalyst is the most crucial parameter to be employed in a water electrolyzer. Initially, the durability of γ-NiOOH–Fe and Ni–Fe catalysts was assessed by an accelerated durability test by cycling the potential between 1.2 V and 1.6 V. Both catalysts exhibited stable OER activity after the accelerated durability test. After the constant current electrolysis, performed at 10 mA cm−2, the activity of Ni–Fe was decreased and the required potential to attain 10 mA cm−2 increased to 1.51 V, whereas no change in the activity was observed for γ-NiOOH–Fe (Fig. S5†). Later, constant current electrolysis at 150 and at 500 mA cm−2 for 12 hours was performed (Fig. 5a). Furthermore, to evaluate the catalyst stability under the real electrolyzer operational conditions, the electrolyzer was assembled with γ-NiOOH–Fe as anode and Pt32Ru16/C as cathode (Scheme S1†). Although we have inhouse made AEMs,59–61 in this work we used the commercially available PiperION® AEM, because these results are useful for comparison with other catalysts and with inhouse membranes that will be tested under similar conditions in the near future. Electrolysis was performed at 80 °C in 1 M KOH. Details of electrolyzer setup, activation of membrane electrode assembly, and the method of analysis are provided in the ESI.† During the I–V measurement, the anode potential at different current densities was monitored along with the cell voltage using a reference electrode integrated into the anodic compartment of the electrolyzer and the results are presented in Fig. 5b. Electrolyzer cell voltage (Ecell) at 1 and 2 A cm−2 current density was 1.78 and 1.95 V, respectively and the corresponding anode potential was 1.65 and 1.77 V vs. RHE. Further, the durability of the system was analyzed by constant current electrolysis performed at 0.5 A cm−2 for 12 hours, followed by 1 A cm−2 for another 12 hours, and the results are presented in Fig. 5c. Voltammetric response of the γ-NiOOH–Fe anode placed in the electrolyzer measured at 80 °C before and after constant current electrolysis is presented in Fig. 5d. The voltammogram is slightly noisy because of bubble formation. Only a 2.0 mV shift has been observed to attain 1 A cm−2 current density after the constant current electrolysis indicating the durable OER performance of the γ-NiOOH–Fe electrode.
 | ||
| Fig. 5 (a) Chronopotentiometric curves measured at 10, 150 and 500 mA cm−2 in 1 M KOH at 25 °C, (b) polarization curves of the MEA and anode, (c) chronopotentiometric results measured at 0.5 and 1 A cm−2 and (d) linear sweep voltammetry responses of γ-NiOOH–Fe before and after the stability tests in 1 M KOH at 80 °C. | ||
After electrolysis, SEM, XRD and XPS analyses of the catalyst were conducted to determine the structural and chemical changes of γ-NiOOH–Fe. SEM images show that the surface of the catalyst remains in the nanoflake shape with a difference in the spatial distance between the flakes (Fig. 6a). The XRD pattern shows no difference in the peaks and peak positions (Fig. 6b). The fine scanning XPS spectra of Ni 2p and Fe 2p of γ-NiOOH–Fe (Fig. 6C & D) reveal that all of the Ni and Fe exists in the NiOOH and FeOOH form. The analysis indicates that although minor structural changes were observed, the nanoflake shape with γ-NiOOH–Fe on the surface was retained after the stability test, suggesting that this structural stability led to the retention of the high electrolyzer performance.
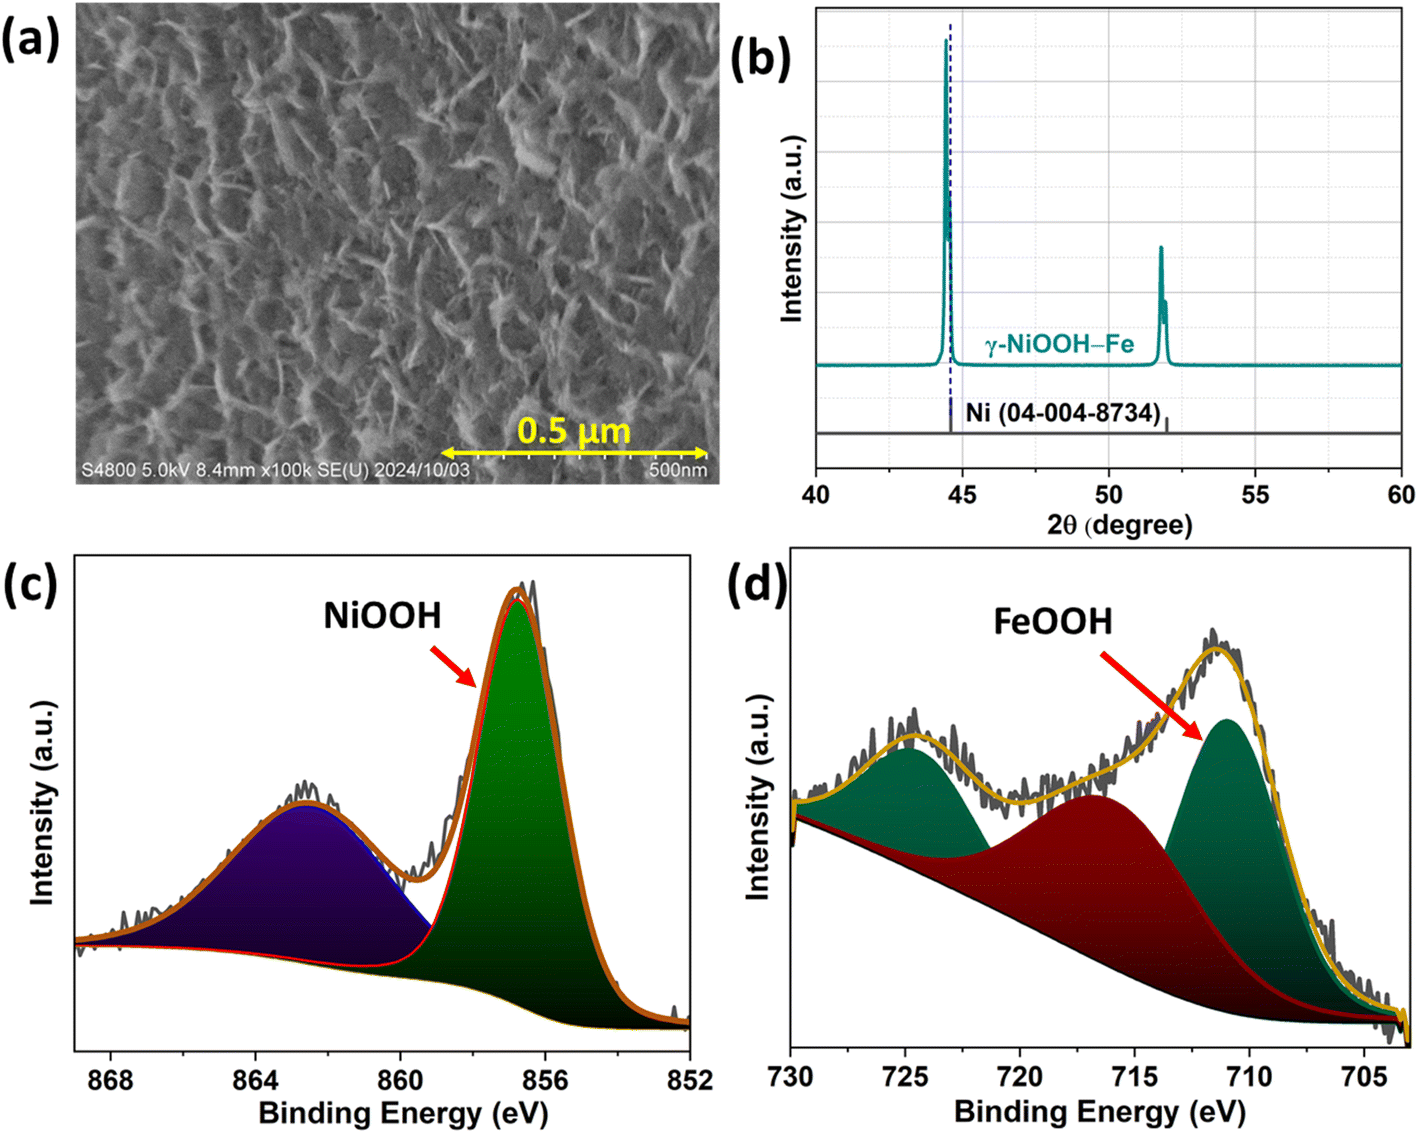 | ||
| Fig. 6 (a) FE-SEM image, (b) XRD pattern, and (c) and (d) XPS Ni 2p peaks and Fe 2p peaks of γ-NiOOH–Fe respectively, after the electrolysis at 80 °C. | ||
Further, to ensure the scalability of the synthesis of γ-NiOOH–Fe, we made a catalyst with an area of 25 cm2 (scale up from 1 cm2), under the same laboratory conditions. The photographs of the modified Ni foam catalyst at different stages are presented in Fig. S6.† Electrochemical oxidation of nickel followed by iron deposition at a controlled potential provides reproducible results. This room-temperature electrochemical route for the preparation of γ-NiOOH–Fe is an industrially viable method because the entire electrochemical process requires less than half an hour compared to the time and energy-consuming conventional heating process.
Conclusions
In summary, we developed a simple, rapid, cost-effective and scalable synthesis of a highly active and durable OER catalyst for AEMWEs. The precise engineering of a layer of γ-NiOOH–FeOOH at the surface and another layer of γ-NiOOH between the surface layer and bottom Ni foam enhances the durability and activity of the catalyst. The catalyst exhibits excellent OER activity in an alkaline medium by attaining 10 mA cm−2 at 1.47 V (η = 0.24 V). The low Tafel slope value of 34 mV dec−1 confirms the inherent catalytic activity of the catalyst. The high OER activity of the catalyst might be due to the presence of the high valent Ni (Ni3.6+) layer containing Fe3+ at the surface of the catalyst. The Lewis acidic nature of Fe3+ endorses the formation of Ni4+ during the polarization and hence catalyses the critical O–O bond formation in the OER. The catalyst also displayed excellent robustness in its OER catalytic activity under different electrochemical durability analyses including high current density operation under real electrolyzer functioning conditions. The two-step electrochemical method of catalyst preparation is highly reproducible and industrially viable.Data availability
The authors confirm that the data supporting the findings of this study are available within the article and its ESI.†Author contributions
The manuscript was written through contributions of all authors. All authors have given approval to the final version of the manuscript.Conflicts of interest
There are no conflicts of interest to declare.Acknowledgements
This paper is based on results obtained from projects JPNP14021 and JPNP20003, commissioned by the New Energy and Industrial Technology Development Organization (NEDO), Japan. We thank the Foundation for Promotion of Materials Science and Technology (MST) of Japan for the XPS analysis and cross-sectional SEM-EDX observation.References
- M. I. Jamesh and X. Sun, J. Power Sources, 2018, 400, 31–68 CAS
.
- N. T. Suen, S. F. Hung, Q. Quan, N. Zhang, Y. J. Xu and H. M. Chen, Chem. Soc. Rev., 2017, 46, 337–365 Search PubMed
- J. Jiang, X. L. Zhou, H. G. Lv, H. Q. Yu and Y. Yu, Adv. Funct. Mater., 2023, 33, 2212160 Search PubMed
- H. Dau, C. Limberg, T. Reier, M. Risch, S. Roggan and P. Strasser, ChemCatChem, 2010, 2, 724–761 CAS
- B. M. Hunter, H. B. Gray and A. M. Müller, Chem. Rev., 2016, 116, 14120–14136 CrossRef CAS PubMed
- Q. Liang, G. Brocks and A. Bieberle-Hütter, J. Phys. Energy, 2021, 3, 0260012 Search PubMed
- F. Y. Chen, Z. Y. Wu, Z. Adler and H. Wang, Joule, 2021, 5, 1704–1731 Search PubMed
- F. Song, L. Bai, A. Moysiadou, S. Lee, C. Hu, L. Liardet and X. Hu, J. Am. Chem. Soc., 2018, 140, 7748–7759 Search PubMed
- Y. Li, Y. Deng, D. Liu, Q. Ji and X. Cai, Mater. Chem. Front., 2023, 8, 880–902 RSC
- K. Zhang and R. Zou, Small, 2021, 17, 202100129 Search PubMed
- Y. Sugawara, T. Hihara, G. M. Anilkumar, K. Kamata and T. Yamaguchi, Sustain. Energy Fuels, 2021, 5, 1374–1378 RSC
- Y. Sugawara, S. Ueno, K. Kamata and T. Yamaguchi, ChemElectroChem, 2022, 9, 202101679 Search PubMed
- L. Zhang, Q. Fan, K. Li, S. Zhang and X. Ma, Sustain. Energy Fuels, 2020, 4, 5417–5432 Search PubMed
- X. Peng, C. Pi, X. Zhang, S. Li, K. Huo and P. K. Chu, Sustain. Energy Fuels, 2019, 3, 366–381 Search PubMed
- R. He, X. Huang and L. Feng, Energy Fuels, 2022, 36, 6675–6694 CrossRef CAS
- Y. Sugawara, K. Kamata, A. Matsuda and T. Yamaguchi, ACS Appl. Energy Mater., 2023, 6, 7928–7934 CrossRef CAS
- C. J. Huang, H. M. Xu, T. Y. Shuai, Q. N. Zhan, Z. J. Zhang and G. R. Li, Appl. Catal. B, 2023, 325, 122313 CrossRef CAS
- P. M. Bodhankar, P. B. Sarawade, P. Kumar, A. Vinu, A. P. Kulkarni, C. D. Lokhande and D. S. Dhawale, Small, 2022, 18, 202107572 CrossRef PubMed
- S. Sankar, S. Roby, H. Kuroki, S. Miyanishi, T. Tamaki, G. M. Anilkumar and T. Yamaguchi, ACS Sustain. Chem. Eng., 2023, 11, 854–865 CrossRef CAS
- H. Wang, S. Zhu, J. Deng, W. Zhang, Y. Feng and J. Ma, Chin. Chem. Lett., 2021, 32, 291–298 CrossRef CAS
- J. Huang, Y. Li, Y. Zhang, G. Rao, C. Wu, Y. Hu, X. Wang, R. Lu, Y. Li and J. Xiong, Angew. Chem.,
Int. Ed., 2019, 58, 17458–17464 CrossRef CAS PubMed
- B. S. Yeo and A. T. Bell, J. Phys. Chem. C, 2012, 116, 8394–8400 Search PubMed
- C. Hu, Y. Hu, C. Fan, L. Yang, Y. Zhang, H. Li and W. Xie, Angew. Chem., Int. Ed., 2021, 60, 19774–19778 Search PubMed
- X. Jiang, F. Luo, Y. Liu, P. Yu and S. Chen, Nanotechnology, 2023, 34, 325706 CrossRef CAS PubMed
- B. Wu, S. Gong, Y. Lin, T. Li, A. Chen, M. Zhao, Q. Zhang and L. Chen, Adv. Mater., 2022, 34, 2108619 CrossRef CAS PubMed
- M. S. Burke, L. J. Enman, A. S. Batchellor, S. Zou and S. W. Boettcher, Chem. Mater., 2015, 27, 7549–7558 Search PubMed
- S. Jin, ACS Energy Lett., 2017, 2, 1937–1938 CrossRef CAS
- G. B. Wang, C. S. Hsu and H. M. Chen, Dalton Trans., 2020, 49, 17505–17510 RSC
- H. Y. Jung, J. H. Park, J. C. Ro and S. J. Suh, ACS Omega, 2022, 7, 45636–45641 CrossRef CAS PubMed
- A. Abdelhafiz, M. H. Mohammed, J. Abed, D. C. Lee, M. Chen, A. S. Helal, Z. Ren, F. Alamgir, E. Sargent, P. A. Kohl, S. K. Elsaidi and J. Li, Adv. Energy Mater., 2024, 14, 202303350 Search PubMed
- L. Gong, H. Yang, A. I. Douka, Y. Yan and B. Y. Xia, Adv. Sustain. Syst., 2021, 05, 2000136 CAS
- J. Mohammed-Ibrahim, J. Power Sources, 2020, 448, 227375 CAS
- M. Gong and H. Dai, Nano Res., 2015, 8, 23–39 CAS
- B. Wu, S. Gong, Y. Lin, T. Li, A. Chen, M. Zhao, Q. Zhang and L. Chen, Adv. Mater., 2022, 34, 2108619 Search PubMed
- Y. Li, Y. Wu, M. Yuan, H. Hao, Z. Lv, L. Xu and B. Wei, Appl. Catal. B, 2022, 318, 121825 CAS
- O. Diaz-Morales, D. Ferrus-Suspedra and M. T. M. Koper, Chem. Sci., 2016, 7, 2639–2645 CAS
- D. Friebel, M. W. Louie, M. Bajdich, K. E. Sanwald, Y. Cai, A. M. Wise, M. J. Cheng, D. Sokaras, T. C. Weng, R. Alonso-Mori, R. C. Davis, J. R. Bargar, J. K. Nørskov, A. Nilsson and A. T. Bell, J. Am. Chem. Soc., 2015, 137, 1305–1313 CAS
- Z. K. Goldsmith, A. K. Harshan, J. B. Gerken, M. Vörös, G. Galli, S. S. Stahl and S. Hammes-Schiffer, Proc. Natl. Acad. Sci. U. S. A., 2017, 114, 3050–3055 CAS
- J. Y. C. Chen, L. Dang, H. Liang, W. Bi, J. B. Gerken, S. Jin, E. Ercan Alp and S. S. Stahl, J. Am. Chem. Soc., 2015, 137, 15090–15093 CAS
- N. Li, D. K. Bediako, R. G. Hadt, D. Hayes, T. J. Kempa, F. Von Cube, D. C. Bell, L. X. Chen and D. G. Nocera, Proc. Natl. Acad. Sci. U. S. A., 2017, 114, 1486–1491 CAS
- S. Zou, M. S. Burke, M. G. Kast, J. Fan, N. Danilovic and S. W. Boettcher, Chem. Mater., 2015, 27, 8011–8020 CAS
- Y. Wu, H. Wang, S. Ji, X. Tian, G. Li, X. Wang and R. Wang, Appl. Surf. Sci., 2021, 564, 150440 CAS
- Y. F. Li, J. L. Li and Z. P. Liu, J. Phy. Chem. C, 2021, 125, 27033–27045 CAS
- R. Farhat, J. Dhainy and L. I. Halaoui, ACS Catal., 2020, 10, 20–35 CAS
- O. Diaz-Morales, D. Ferrus-Suspedra and M. T. M. Koper, Chem. Sci., 2016, 7, 2639–2645 CAS
- J. Xu, B. X. Wang, D. Lyu, T. Wang and Z. Wang, Int. J. Hydrogen Energy, 2023, 48, 10724–10736 CrossRef CAS
- L. Yan, Y. Ren, J. Shen, H. Wang, J. Ning, Y. Zhong and Y. Hu, Energ. Tech., 2020, 8, 2000607 CrossRef CAS
- M. S. Burke, L. J. Enman, A. S. Batchellor, S. Zou and S. W. Boettcher, Chem. Mater., 2015, 27, 7549–7558 CrossRef CAS
- C. Mahala, M. Devi Sharma and M. Basu, ChemElectroChem, 2019, 6, 3488–3498 CrossRef CAS
- W. Guo, D. Li, D. Zhong, S. Chen, G. Hao, G. Liu, J. Li and Q. Zhao, Nanoscale, 2020, 12, 983–990 RSC
- K. Wang, H. Du, S. He, L. Liu, K. Yang, J. Sun, Y. Liu, Z. Du, L. Xie, W. Ai and W. Huang, Adv. Mater., 2021, 33, 202005587 Search PubMed
- N. Hashemi, S. Nandy, K. H. Chae and M. M. Najafpour, ACS Appl. Energy Mater., 2022, 5, 11098–11112 CrossRef CAS
- G. Wang, D. Zheng, D. Liu, J. Harris, J. Si, T. Ding and D. Qu, Electrochim. Acta, 2017, 247, 722–729 CrossRef CAS
- C. B. Mullins, Y. J. Son, K. Kawashima, B. R. Wygant, C. H. Lam, J. N. Burrow, H. Celio, A. Dolocan and J. G. Ekerdt, ACS Nano, 2021, 15, 3468–3480 CrossRef PubMed
- C. Dong, T. Kou, H. Gao, Z. Peng and Z. Zhang, Adv. Energy Mater., 2018, 8, 201701347 Search PubMed
- M. W. Louie and A. T. Bell, J. Am. Chem. Soc., 2013, 135, 12329–12337 CrossRef CAS PubMed
- D. A. Corrigan, The Catalysis of the Oxygen Evolution Reaction by Iron Impurities in Thin Film Nickel Oxide Electrodes, J. Electrochem. Soc., 1987, 134, 377 CrossRef CAS
- S. Anantharaj and S. Kundu, ACS Energy Lett., 2019, 4, 1260–1264 CrossRef CAS
- S. Miyanishi, S. Miyanishi, T. Yamaguchi and T. Yamaguchi, Polym. Chem., 2020, 11, 3812–3820 RSC
- S. Miyanishi and T. Yamaguchi, J. Mater. Chem. A, 2019, 7, 2219–2224 RSC
- R. Soni, S. Miyanishi, H. Kuroki and T. Yamaguchi, ACS Appl. Energy Mater., 2021, 4, 1053–1058 CrossRef CAS
Footnote |
| † Electronic supplementary information (ESI) available. See DOI: https://doi.org/10.1039/d4su00538d |
| This journal is © The Royal Society of Chemistry 2025 |