 Open Access Article
Creative Commons Attribution 3.0 Unported Licence
Phytic acid as a biorenewable catalyst for cellulose pyrolysis to produce levoglucosenone†
Tsinjo Nirina
Rafenomananjara
 a,
Shinji
Kudo
 *ab,
Jonathan
Sperry
 c,
Shusaku
Asano
 b and
Jun-ichiro
Hayashi
 ab
ab
aInterdisciplinary Graduate School of Engineering Sciences, Kyushu University, 6-1 Kasuga Koen, Kasuga, 816-8580, Japan. E-mail: shinji_kudo@cm.kyushu-u.ac.jp
bInstitute for Materials Chemistry and Engineering, Kyushu University, 6-1 Kasuga Koen, Kasuga, 816-8580, Japan
cCentre for Green Chemical Science, School of Chemical Sciences, University of Auckland, 23 Symonds Street, Auckland, New Zealand
First published on 25th November 2024
Abstract
Phytic acid (PA) is a cheap organophosphorus compound readily available from agricultural wastes, with the potential to serve as a biogenic source of phosphorus compounds currently derived from finite phosphate rock. Developing applications for PA is important for its industrial implementation. This study demonstrates that PA serves as an effective organocatalyst during the pyrolysis of cellulose, promoting the selective formation of the high-value platform chemical levoglucosenone (LGO). With a loading of only 0.3 wt% PA (<0.1 wt% on a phosphorus basis), the onset temperature of cellulose pyrolysis decreased by over 60 °C. A detailed analysis of the catalytic performance, mainly during slow pyrolysis, revealed that PA penetrates the cellulose particles and fibers during the heating process, forming various chemical bonds and promoting dehydration. As a result, the LGO yield, which was only 2 wt% for pure cellulose, increased to 19.6 wt% (25.0% on a carbon basis) with a loading of 0.75 wt%. Excessive loading promoted char formation. The amount of PA required to maximize the LGO yield was about two-thirds that of conventional phosphoric acid (based on phosphorus content), suggesting superior catalytic performance and lower P loadings are possible. PA also led to the selective formation of LGO in the pyrolysis of lignocellulosic biomass, though in poorer yield compared to pure cellulose. Although it was difficult to extract PA from pyrolysis char for direct reuse, this residue could, in principle, re-enter the phosphorus cycle, possibly as a fertilizer.
Sustainability spotlightNew technologies contributing to a more sustainable chemical industry primarily focus on the carbon cycle. Phosphorus, an essential element, is obtained through phosphate rock mining, followed by energy-intensive conversion into useable forms for application in fertilizers and organophosphorus compounds. Here, we report that levoglucosenone, a high-value platform chemical, is attainable upon pyrolysis of cellulose using phytic acid—a biogenic phosphorus resource available as a waste product—as the organocatalyst. This technology involves the sustainable use of both carbon and phosphorus, providing yields of levoglucosenone comparable to the process employing a conventional effective catalyst, phosphoric acid. It aligns with UN sustainable development goals related to not only sustainable technologies (SDGs 8, 9 and 12) but also environmental protection (SDGs 13–15). |
Introduction
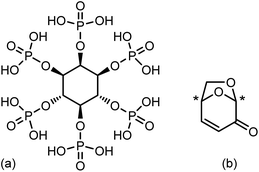
Phosphorus is an essential element in the global chemical industry, with a massive global demand primarily driven by its use in fertilizers. The majority of industrially used phosphoric acid (H3PO4), a direct feedstock for fertilizers, is derived from phosphate rock (PR), consisting mainly of fluorapatite (Ca5(PO4)3F). PR is a finite resource, yet over one hundred million tons are consumed annually, and its demand is expected to exceed supply by 2040.1 The production of phosphoric acid from PR, known as the “wet process”, is highly energy-intensive and consumes sulfuric acid with the amount corresponding to over half of the world's sulfur supply.2 Moreover, phosphorus consumption is one-way, as extracted phosphorus from PR is largely released into the environment.3 To address these problems, technologies for phosphorus recovery after the end-use and its reuse have been actively discussed and pursued.1,2,4–6 Alongside these recovery efforts, developing applications for biogenic phosphorus resources is vital for achieving a sustainable P cycle.Among biogenic phosphorus sources, phytic acid (PA: inositol-hexaphosphoric acid, Fig. 1(a)) is a potential key platform chemical in future biorefineries.3 PA satisfies criteria to be considered for an industrial implementation as a biogenic P-source; briefly, wide and stable availability, presence of scalable and economically feasible isolation method from the source, and potential applications. PA is a low- or non-toxic primary metabolite found in many plants grown on a huge scale, including cereals, legumes, and oilseeds, and around 35 million tons is generated annually as an agricultural waste product.7 PA forms strong chelates with metals, typically existing in plants as various metal phytate salts, but established methods exist to effectively extract as the acid.8 PA has a number of applications such as food preservatives, wastewater treatment agents, and corrosion inhibitors, to name a few.9–13 In relation to lignocellulosic biomass, there has been extensive research applying PA to flame retardants, particularly in cellulose-based materials doped with PA and amines.14–16 PA is a promising biogenic alternative to phosphoric acid due to its P(V) oxidation state. However, reports on its use as an organocatalyst in chemical reactions, leveraging its Brønsted or Lewis acid properties, remain limited.17,18
In the development of sustainable technologies for the chemical industry, what generally receives more attention compared to the P-cycle is the C-cycle, that is, the sustainable use of carbon resources. On one hand, the pressing issues of depleting fossil fuel reserves, and on the other hand, the imperative to tackle global warming and reduce greenhouse gas emissions, make lignocellulosic biomass a highly promising alternative feedstock, owing to the abundant reserves and renewable nature. Most biomass sources have complex structures, consisting mainly of cellulose, hemicellulose, and lignin, that must be broken down or depolymerized to be further processed and utilized as chemicals. Among routes for the biomass conversion, pyrolysis-based processes are attractive due to characteristics including their simplicity, high reaction rate, and the fact that no other feedstock is normally required.19 Organic compounds are available in bio-oils, which constitute up to 70–80% of the pyrolysis products.20 Bio-oils are mixtures of various compounds and, therefore, are generally considered for the applications as fuel. However, it is possible to control the composition of the bio-oil and selectively obtain specific compounds using catalysis. A representative example is levoglucosenone (LGO, Fig. 1(b)), a type of anhydrosugar derived from cellulose.
LGO is a functionally rich platform that will likely serve as a biogenic building block for producing diverse chemicals in future biorefinery.21–24 A half century has passed since its “discovery”.25 During the past decade, the commercial production of hydrogenation product of LGO, dihydrolevoglucosenone (Cyrene) that is an excellent alternative to petroleum-based dipolar aprotic solvents such as DMF and NMP, has also started.26,27 Various catalysts and reaction systems for effectively producing LGO have been reported as listed in review studies.26,28 When pyrolyzed alone, cellulose produces LGO as a minor product in low yield, which can be increased dramatically by the use of catalysis under regulated pyrolysis conditions. For example, the production of LGO from cellulose in ∼50% yield has been achieved by pyrolysis in an organic solvent using homogeneous catalysis.29,30 However, to this day, phosphoric acid remains one of the most effective catalysts for this transformation. The discovery of LGO stemmed from flame retardant research involving phosphoric acid and cellulosic materials.25,31 Subsequent research, such as the extensive studies by Dobele et al.,32–34 revealed that phosphoric acid loaded over cellulose catalytically promotes the dehydration of cellulose, contributing to the formation of LGO by the removal of two water molecules. Due to its low cost and acceptable catalysis, phosphoric acid has reportedly been used, or was used, in the above-mentioned commercial process of Cyrene production, where LGO is produced as an intermediate. Given that both phosphoric acid and PA have been applied as flame retardants, we hypothesized that PA would exert similar or even superior catalytic properties to phosphoric acid during cellulose pyrolysis. Herein, we report that PA does indeed serve as an effective organocatalyst to produce LGO from cellulose.
Materials and methods
Materials and sample preparation
Microcrystalline cellulose, purchased from Sigma-Aldrich, was adopted as the main feedstock for the pyrolysis experiment. Amorphous cellulose was prepared by ball-milling of microcrystalline cellulose for 24 h with a pot mill rotary table and zirconia balls. A softwood, Japanese cedar, was also used as the pyrolysis feedstock for comparison purposes. Cedar contained 50.7 wt% of C, 6.4 wt% of H, 0.2 wt% of N, and 42.8 wt% of O on a dry and ash free basis. The ash content was 1.0 wt%-dry. Although the amount of ash metals in softwood is generally small, trace amounts present, particularly alkali and alkaline earth metallic species (AAEMs), are known to inhibit the formation of anhydrosugars derived from cellulose during the pyrolysis. In this work, to analyze the inherent activity of PA toward lignocellulosic material, AAEMs were removed by acid-washing before the use in pyrolysis tests. Specifically, cedar pulverized to fine was washed overnight at room temperature with a 0.5 M oxalic acid aqueous solution, followed by filtration, thorough water-washing, and then vacuum drying at room temperature. As a result of the acid-washing, the ash content was reduced to 0.17 wt%-dry, and 91%, 61%, and 77% of K, Mg, and Ca were removed, respectively. Phytic acid (50% in water), phosphoric acid (85% in water), levoglucosan (LGA), and phosphorus standard for Inductively Coupled Plasma Atomic Emission (ICP-AE) spectroscopy were all purchased from Fujifilm Wako Pure Chemical. LGO reagent was purchased from Circa Group.Cellulose or cedar was added into the aqueous solution containing PA in the amount that resulted in a loading level of 0.3 to 3.0 wt% after drying. The solid (cellulose or cedar)-to-liquid (water) mass ratio was set to 2.5. The slurry was stirred for 4 h, frozen, and then dried in a freeze-dryer (EYELA, FDM-1000). After further drying under vacuum at a room temperature, the acid-loaded samples were stored in a desiccator until use for pyrolysis experiments. For a comparative study, cellulose loaded with phosphoric acid was also prepared by the same method.
Thermogravimetric analysis (TGA)
Pyrolysis characteristics of cellulose with or without PA were gravimetrically investigated on a thermogravimetric analyzer (Hitachi High Tech, STA 7200). 2.5 mg of sample placed on a platinum crucible in the analyzer was heated under a N2 flow (300 mL min−1) to 110 °C for drying and then to 800 °C at 5, 10, 15, or 20 °C min−1. Pyrolysis curves were obtained by calculating the change in relative mass on an initial dry mass basis. Kinetic analysis was carried out using a distributed activation energy model (DAEM)35 and briefly described in the ESI.†Pyro-GC/MS analysis
The composition of volatiles from fast pyrolysis was analyzed by pyro-GC/MS technology using a tandem μ-reactor (Frontier Lab, Rx-3050TR) equipped with a gas chromatograph/mass spectrometer (Shimadzu, GCMS-QP2020 NZ). The reactor consists of a pyrolysis zone (400 °C) and catalytic reaction zone (400 °C), connected in series. No catalyst was loaded in the second zone for the present analysis. 300 μg of the sample placed in a cup was dropped into the pyrolysis zone under a constant flow of He for fast pyrolysis. Volatiles evolved from the sample passed through the second zone to be injected into GC. The temperatures of the injection port, transfer line, and ion source were set to 280 °C, 250 °C, and 250 °C, respectively. The separation was carried out with GL Sciences TC-1701 capillary column using the temperature program; 5 min at 40 °C, 5 °C min−1 of ramp to 250 °C and holding for 20 min. Peaks in the total ion chromatogram were identified using the NIST23 library. Semi-quantification of LGO yield was performed as peak area per mg of pyrolyzed sample.Slow pyrolysis experiment
A detailed analysis of the PA-loading effect on the pyrolysis product was conducted using a horizontal tubular reactor with a fixed sample bed inside. 1 g of feedstock was placed in a quartz boat and set in the reactor. The sample temperature was monitored and controlled by a thermocouple located above the boat. The sample was heated under a N2 flow (300 mL min−1) and atmospheric pressure at 10 °C min−1 to a prescribed temperature, and the final temperature (Tf) was maintained for 20 min. The reactor wall immediately downstream of the sample bed was maintained at 20 °C by a cooling water to enhance the condensation of volatiles. The volatiles containing LGO were thoroughly collected by the cooling zone inside the reactor and downstream traps consisting of −30 °C cold trap, −70 °C cold trap, and a filter trap, which were connected in series. Condensed compounds (liquid product) were recovered by methanol for the quantification with GCs. Non-condensable volatiles were collected after the last trap with the gas bag as a gaseous product. The solid product was collected after cooling down to a room temperature as a char product.Product analysis
The liquid product was analyzed by GC/MS (PerkinElmer, Clarus 680) for compounds identification and by gas chromatograph-flame ionization detector (Shimadzu, Nexis GC-2030) for quantification. Operation conditions for GC were identical to those explained for pyro-GC/MS excepting the liquid injection using an autosampler and a temperature ramp rate of 4 °C min−1. The yield calculation was carried out for LGA and LGO using standard solutions. The composition and yield of gas product were analyzed with an Agilent 490 Micro-GC. To investigate the recovery of water-soluble phosphorus from the char of PA or phosphoric acid loaded cellulose pyrolysis, the char produced from 1 g of the sample was dispersed in 50 mL of water, sonicated, stirred at 60 °C for 3 h, and then filtrated. The phosphorus content in the aqueous solution was analyzed by ICP-AE (Shimadzu, ICPE-9800). P recovery was calculated from the ratio to the amount of P in the pyrolysis feedstock. The char from pyrolysis and aqueous filtrate were analyzed by solid-state and solution 31P nuclear magnetic resonance spectroscopy (NMR), respectively. The solution 31P spectra were recorded on a JEOL, ECA600 at 243 MHz using a pulse width of 9 μs (45°), an acquisition time of 76.0 s, a pulse delay of 3 s, and single pulse with 1H broadband decoupling. The solid-state 31P spectra were recorded on a JEOL, ECX400 at 162 MHz using a single pulse width of 4.24 μs (30°), an acquisition time of 9.03 ms, a pulse delay of 5 s, the MAS speed for a 3.2 mm rotor of 15 kHz, and dipolar decoupling magic angle spinning (DDMAS). The chemical shift was adjusted with a saturated aqueous phosphoric acid solution to determine 0 ppm. The specific surface area of char after degassing at 300 °C under vacuum was calculated from N2 adsorption isotherm, measured at −196 °C with Belsorp Mini X (Microtrac), based on the Brunauer, Emmett, Teller (BET) theory.Results and discussion
Cellulose, the main precursor for LGO among the biomass constituents, was used as the primary raw material. PA was loaded into cellulose using its aqueous solution (50%). During loading, water was removed by freeze-drying to prevent the thermal or catalytic degradation of cellulose. The obtained samples with different PA loadings were used for the following analyses.TGA
The effect of PA loading was first analyzed by TGA. To analyze the mass loss of cellulose in detail, the PA loading amount was limited to 0.3 wt%. The pyrolysis curves obtained at different heating rates were analyzed using the distributed activation energy model (DAEM).35Fig. 2 shows the pyrolysis curves and calculated kinetic parameters (activation energy and frequency factor). Detailed analytical procedure can be found in the ESI.† Despite the small amount of PA loading, the onset temperature, defined as the temperature of 5 wt% mass loss, decreased from 320 °C to 260 °C, a reduction of 60 °C. The PA loading amount of 0.3 wt% corresponded to a P content of only 0.095 wt%. The result indicated a catalytic effect of PA on cellulose pyrolysis. Reported activation energies for cellulose pyrolysis vary widely in the literature, but for example, 198 kJ mol−1 (frequency factor: 6.5 × 10¹⁴ s−1) has been reported for the pyrolysis of microcrystalline cellulose using a model based on a first-order reaction.36 In the present study, since kinetic parameters were calculated for each degree of conversion, the values ranged from 172 to 208 kJ mol−1 (average: 186 kJ mol−1). The values, particularly at the initial stage of the conversion, were close to the reported one. The high activation energy observed during the initial stage was primarily due to dehydration reactions.37 PA loading significantly altered the activation energy values. The activation energy at the initial stage of the conversion was low; however, subsequent values were generally high. This might seem contradictory to the observation that PA catalytically lowered the pyrolysis temperature, but as shown in the compensation effect relationship38 (Fig. 2(c)), both the activation energy and the pre-exponential factor increased with PA loading. Therefore, it was considered that PA loading increased the number of active sites for pyrolysis, changed the reactions occurring during cellulose pyrolysis, thus contributed to the decrease in pyrolysis temperature.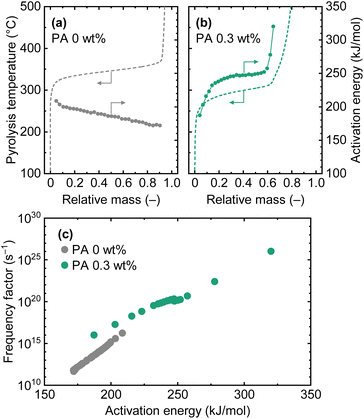 | ||
| Fig. 2 TGA of cellulose loaded with 0 and 0.3 wt% of PA. Pyrolysis curves (temperature vs. relative mass) obtained by TGA at different heating rates (5, 10, 15, and 20 °C min−1) were analyzed with DAEM model.35 Pyrolysis curves in (a) and (b) were obtained at 10 °C min−1 and shown as the representative results. | ||
Pyro-GC/MS analysis
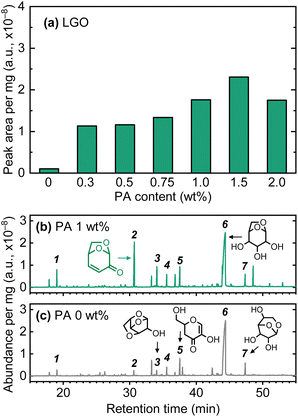
As a preliminary pyrolysis test, cellulose samples prepared with different PA loadings were analyzed using pyro-GC/MS. As shown in Fig. 3(c), in the absence of PA, levoglucosan (LGA), the main product of cellulose pyrolysis, had a significantly large peak in the chromatogram of volatiles, and several other minor anhydrosugars (LGO, DGP, ADGH, and AGF) were also detected. As indicated by the TGA, PA exhibited a catalytic effect on the dehydration of cellulose, promoting the formation of LGO, a double-dehydration product of cellulose, and LGA (Fig. 3(a)). Compared to the pyrolysis of raw cellulose (PA = 0 wt%), even with 0.3 wt% PA loading, the LGO yield increased dramatically, with the peak area increasing more than tenfold. This result revealed the catalytic effect of PA on LGO formation during cellulose pyrolysis. As the PA loading amount increased, the LGO yield showed a slight increase, but plateaued around 1.5 wt%. LGA and DGP are potential precursors to LGO in secondary reactions during pyrolysis.36,39 Despite this, as illustrated in Fig. 3(b), LGA remained the predominant product at all PA loading amounts. Among the minor anhydrosugars, including DGP, some showed an increase in peak area with PA loading. A possible explanation for this observation is that as PA loading was carried out at low temperatures (freeze-drying), it did not penetrate into the cellulose fibrils during its loading. The pyro-GC/MS employed a fast heating rate for the cellulose pyrolysis. This could cause PA-catalysis to occur mainly on the surface of cellulose particles, forming LGO and minor anhydrosugars, while non-catalytic pyrolysis occurred inside the particles, yielding LGA as the main product. As discussed later, since PA penetrates the cellulose during heating, it was expected that by pre-treatment at a temperature low enough to avoid pyrolysis (e.g., 100–200 °C), high yields of LGO could be obtained, even by fast pyrolysis.Influence of PA loading on LGO yield during slow pyrolysis
The effect of PA loading on LGO yield during slow pyrolysis of cellulose was analyzed using a fixed-bed pyrolyzer. First, the influence of final pyrolysis temperature (Tf) was investigated (Table 1). As shown by the pyro-GC/MS analysis, the LGO yield was low in the absence of PA, at most around 2 wt%. The effect of PA loading was evident, resulting in higher LGO yields across a 300–375 °C temperature range. According to the TGA result (Fig. 2), a significant mass loss occurred at 260–300 °C for the PA loaded sample. Therefore, substantial amounts of LGO were obtained even at 300 °C. This observation was also confirmed by FT-IR analysis (Fig. S2†) of the residual char, showing significant spectroscopic changes during the heating process from 250 °C to 300 °C. Notably, no characteristic absorption derived from the P-source was observed in the FT-IR spectra, likely due to its small loading amount. As the reaction temperature increased, the LGO yield gradually improved, but the increase was not significant between 325 °C and 375 °C. This trend was also indicated by the mass loss curve, where the reaction rate significantly decreased above 320 °C. Under the employed pyrolysis conditions, LGO formation was effectively completed below this temperature. Above 320 °C, condensation/repolymerization, forming char, and the accompanying formation of non-condensable volatiles are likely to dominate. A slight decrease in LGO yield was also observed when the Tf was raised from 350 °C to 375 °C. This could indicate that a part of LGO generated between these temperatures decomposed in the gas phase. Therefore, it was considered important for the analysis of the PA loading effect to perform pyrolysis at the lowest possible temperature while sufficiently releasing LGO as a volatile fraction. Based on the obtained results, 350 °C was adopted as the Tf in the following pyrolysis experiments.| PA content (wt%) | T f (°C) | Yield (wt%) | Mass balanceb (%) | ||
|---|---|---|---|---|---|
| Char | Liquid (LGO) | Gasa | |||
| a Gas consisted mainly of CO and CO2. b A low mass balance was caused mainly by deposition of heavy tar over the reactor wall. | |||||
| 0 | 350 | 26.1 | 51.3 (2.0) | 6.8 | 84.2 |
| 0 | 375 | 23.3 | 51.5 (2.0) | 7.0 | 81.9 |
| 1.0 | 300 | 37.4 | 46.1 (14.0) | 6.8 | 90.3 |
| 1.0 | 325 | 37.2 | 49.2 (15.9) | 7.0 | 93.4 |
| 1.0 | 350 | 36.5 | 53.5 (17.6) | 7.1 | 97.2 |
| 1.0 | 375 | 35.2 | 53.4 (17.3) | 7.2 | 95.8 |
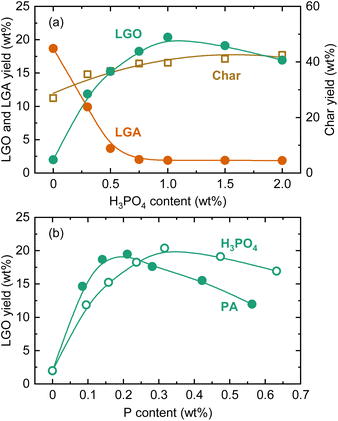
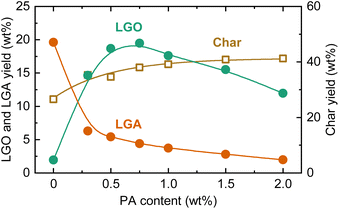
The effect of PA loading on LGO yield during pyrolysis at 350 °C are shown in Fig. 4. Similar to the fast pyrolysis experiments, LGA was the main product in the absence of PA during the pyrolysis, with a yield of 19.6 wt%. As the PA loading increased, the LGA yield decreased, and the LGO yield increased. This trend differed from the pyro-GC/MS analysis, where LGA remained the main product even with higher PA loadings, indicating that PA penetrated the cellulose particles and fibrils and exerting a catalytic effect during the course of heating in the slow pyrolysis. The LGO yield reached a maximum of 19.5 wt% at a PA loading of 0.75 wt%. The equal maximum values of LGA and LGO yields does not mean that LGA produced by non-catalytic pyrolysis was converted to LGO by the catalysis of PA. When compared on a carbon basis, the maximum LGO yield (25.0%-C) was higher than that of LGA (19.5%-C). LGA was thus insufficient in the amount to serve as the LGO precursor. Furthermore, catalytic LGO formation during cellulose pyrolysis can be explained largely by direct or indirect pathways.26 When catalysts such as phosphoric acid are used, the direct pathway predominates, where the catalyst releases LGO directly from the raw material into the gas phase. Owing to this pathway, it was possible that LGO was effectively formed under catalysis of PA more than LGA in the non-catalytic pyrolysis. The content of LGO in the liquid product, calculated by the difference (100 – carbon yields of solid and gaseous products), was 82% at the PA loading of 0.75 wt%, demonstrating a high selectivity toward LGO formation.
 | ||
| Fig. 4 LGO, LGA, and char yields during slow pyrolysis of cellulose loaded with PA at different loadings at 350 °C. | ||
The LGO yield peaked at PA = 0.75 wt% and then decreased with further increases in the loading amount. With increasing PA loading, the LGA yield monotonically decreased, while the total yield of LGO and LGA reached a maximum of 24.0 wt% at PA loadings of 0.50–0.75 wt%, dropping to 14.0 wt% at PA = 2.0 wt%. The char yield increased from 26.5 wt% to 41.3 wt% as the PA loading increased from 0 to 2.0 wt%. The increase in char yield is attributed to enhanced condensation reactions due to acid catalysis. In other words, excessive PA loading accelerated cellulose charring, hindering the formation of anhydrosugars including LGO. Thus, the optimal PA loading appears to be around 0.75 wt%.
In literature, various catalysts have been tested for LGO production via the direct route.35 For special liquid catalysts, particularly ionic liquids and deep eutectic solvents, LGO yields of around 40% on a carbon basis have been reported.40,41 These liquid catalysts can be recovered from the pyrolysis residue and reusable, but their high cost raises concerns about their practicality. As mentioned earlier, phosphoric acid is the catalyst used in the commercial production of LGO.26 Dobele et al. reported LGO yields ranging from 16.5% to 22.3% from the pyrolysis of phosphoric acid-loaded cellulose.32 Thus, pyrolysis tests using phosphoric acid were conducted to compare the catalysis with PA (Fig. 5). The trends in the yield changes of LGA, LGO, and char were very similar to those with PA, with the maximum LGO yield being comparable (20.4 wt%). However, the increase in LGO yield with PA loading was more pronounced. When compared as a function of P content (Fig. 5(b)), the amount of PA required to reach the maximum LGO yield was around two-thirds that of phosphoric acid. Therefore, PA could replace phosphoric acid as a catalyst for LGO production, while also integrating a biogenic P-source into the process. PA's more efficient catalysis can be attributed to its higher dissociation constants, with phosphoric acid having a pKa of 2.1–12.4, whereas PA ranges from 1.5 to 10. Indeed, proton transfer often plays an important role in reactions associated with pyrolysis, and phosphoric acid is an effective catalyst for protonation and deprotonation reactions.42 However, in the proposed reaction mechanisms for the phosphoric acid-catalyzed route, its Brønsted acidity is not the dominant factor, which is likely the case for PA as well. The catalytic mechanisms will be discussed further later.
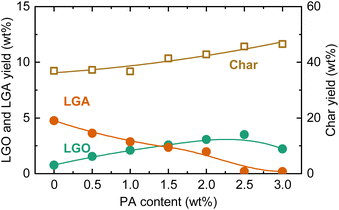
The effect of PA in pyrolysis using acid-washed cedar as the feedstock was also analyzed (Fig. 6). As with cellulose, the LGA yield decreased with increasing PA loading, while the char yield and LGO yield increased. The amount of PA required to reach the maximum LGO yield was more than twice that for cellulose. The maximum LGO yield was 3.5 wt%. When converted to yield based on the mass of cellulose in cedar (cellulose content, analyzed by a reported method,43 was 36.4 wt%), the LGO yield was 9.6 wt%-cellulose, which was still less than half of the yield when using cellulose as the feedstock. The low yield was attributed to the influence of hemicellulose and lignin, as well as the presence of remaining trace amounts of AAEMs that were reported to inhibit the formation of anhydrosugars during pyrolysis.44–46 The ratio between LGO and LGA yields at the maximum LGO yield (1.6 for cedar) was also lower compared to cellulose (4.4), suggesting that PA could not fully access cellulose particles or penetrate the fibrils. Another possible factor affecting the catalysis of PA is the crystallinity of cellulose. For clarifying the influence, amorphous cellulose was prepared from microcrystalline cellulose, loaded with 1.0 wt% PA, and pyrolyzed at 350 °C. The crystallinity of cellulose (crystallinity index: CrI47) was decreased from 85.6% to 60.0% by ball milling. As a result, the yield of LGO increased from 17.6 wt% to 18.7 wt%. The CrI of cellulose in cedar (=63.4%) was lower than that of microcrystalline cellulose, and thus, there was a possibility that lower CrI induced more extensive penetration of PA, contributing to the improvement of LGO yield. However, the increase in LGO yield with lowering CrI was not significant. It was reasonable to conclude that the difference in CrI did not have sufficient impact altering PA penetration/diffusion and LGO yield within examined conditions.
 | ||
| Fig. 6 LGO, LGA, and char yields during slow pyrolysis of acid-washed cedar loaded with PA at different loadings at 350 °C. | ||
Analysis of PA–cellulose interaction and discussion
There have been a few papers reporting the structural changes of PA during the course of heating, as summarized by Olsson et al.48 During the pyrolysis in TGA, the mass of PA continuously decreased from low-temperature regions, which was broadly divided into three regions distinguished by the occurring reactions: release of free water (<150 °C), intermolecular and intramolecular dehydration and condensation (150–350 °C), and decomposition (>350 °C). This trend was also observed in the TGA analysis conducted in the present study (Fig. S3†). It has been reported that the infrared absorption spectrum of PA is retained even when heated up to 380 °C.49 If PA is thermally stable up to high temperatures even when loaded over cellulose, there is a possibility of extracting it from the solid residue (char) after pyrolysis and reusing it. Therefore, the recovery of PA was investigated with a simple water washing method. Cellulose with 1.0 wt% PA loading was pyrolyzed up to prescribed temperatures (without holding time), and the resulting char was dispersed in water, subjected to ultrasonication, and stirred at 60 °C for 3 h. The recovery of P was analyzed by ICP (Fig. 7). Without pyrolysis, it was possible to completely recover PA from cellulose. However, the recovery sharply decreased with the pyrolysis temperature, dropping to 20% even at 200 °C, where the mass loss of cellulose and the dehydration–condensation of PA were minimal. Only 2% of P was recovered at 350 °C, where the release of LGO was nearly complete. As shown in Fig. S4,† the 31P NMR spectrum of PA showed four peaks derived from the conformation of inositol.50 The spectra of extracts from chars prepared at 200 °C and 300 °C showed only a single sharp peak centered around 0 ppm, suggesting that a part of PA was releasing phosphoric acid during pyrolysis.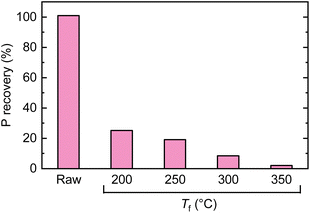 | ||
| Fig. 7 Recovery of P from chars prepared by pyrolysis of cellulose loaded with 1.0 wt% PA at different temperatures. | ||
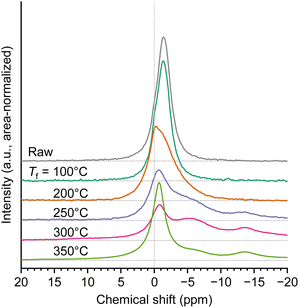
There have been also reports regarding the chemical interactions between PA and cellulose-based materials. The effect of PA as a frame retardant has been explained by condensed phase mechanism and vapour phase mechanism,51 with the former seeming to be more dominant.14 Pyrophosphates and polyphosphates, which are generated from PA and incorporated into the char, protect the material (char) from oxygen and heat during the combustion. The flame retardant effect of phosphoric acid is similarly explained, where polypyrophosphates suppress the diffusion of volatiles, in other words, promoting charring and thus imparting flame resistance to the material.52 Orzan et al.14 proposed inter-phosphate, intra-phosphate, and phosphate–cellulose linkages as pathways during the dehydration and condensation of cellulose–PA at low temperatures (<160 °C), forming covalent ester bonds. 31P solid-state NMR spectroscopy is often used to analyze the chemical form of PA and its change during heating, but since the most studies focus on low-temperature ranges, herein the analysis was carried out with extending the temperature range to the pyrolysis temperature region. The analysis results for 1.0 wt% PA loaded cellulose are shown in Fig. 8. The external standard of saturated phosphoric acid aqueous solution was used to set 0 ppm. The 31P solid-state NMR spectrum of PA generally shows a single peak around 0 ppm,53 but the peak position of the unheated PA loaded on cellulose showed an upfield shift to −1.3 ppm. This suggested that PA formed hydrogen bonds with cellulose.14 Heating up to 100 °C caused no change in the spectrum, confirming that only water removal occurred in the low-temperature region without structural changes in PA. Elevating the temperature to 200 °C broadened the peak. The peak position around 0 ppm supported the hydrolysis of small quantities of PA into phosphoric acid. As the temperature increased further, the spectrum's expansion upfield became more apparent, revealing the formation of pyrophosphate (around −5 ppm) and polyphosphate (around −14 ppm)15,50 due to dehydration–condensation. The significant drop in P recovery at 200 °C (Fig. 7) suggested that the dehydrated-condensed PA and PA ester-bonded to cellulose (−2 ppm, −3 ppm)14 were difficult to extract with water. During the heating process between 250 °C and 300 °C, where LGO formation was most prominent, the main peak position corresponding to PA was maintained, supporting its survival over pyrolyzing cellulose.
 | ||
| Fig. 8 31P solid-state NMR spectrum of chars prepared by pyrolysis of cellulose loaded with 1.0 wt% PA at different temperatures. | ||
In the case of phosphoric acid loaded on cellulose, the peak originating from phosphoric acid significantly decreased during the heating process from 200 °C to 300 °C (Fig. S5†), and the main peak became pyrophosphate. In studies using phosphoric acid as a catalyst, it has been reported that the formation of hydrogen bonds54 or phosphate ester bonds42 with cellulose is crucial for the intramolecular dehydration of cellulose, leading to LGO formation. The present experimental results clarified that similar events could occur with PA. In the spectrum at 350 °C, where pyrolysis of cellulose was nearly complete, the sharp peak of PA reappeared, suggesting that PA condensed to pyrophosphate or polyphosphate hydrolyzed back to PA. However, almost no P was recovered from the char pyrolyzed at 350 °C (Fig. 7). It is, therefore, appropriate to consider that the detected PA was only a small portion of P contained in the char, and the rest P was not detected because it was incorporated in an amorphous form within the char.
The aforementioned results demonstrated that PA could serve as a biorenewable, drop-in replacement for phosphoric acid for LGO production. Given the difficulty in recovering and reusing PA from pyrolysis products, technologies for regenerating useful forms of P in the pyrolysis char are required, which could re-enter the P-cycle, perhaps as commodity fertilizers. The char remaining after P extraction could be used as fuel or biochar. Alternatively, considering that PA has similar chemical effects to phosphoric acid, there is a possibility that the char is used as activated carbon. When analyzing the specific surface area of the char (prepared from cellulose loaded with 1.0 wt% PA), it was found to be less than 1 m2 g−1 after pyrolysis at 350 °C, but raising the temperature to 500 °C and 700 °C indeed remarkably improved the surface area to 472 m2 g−1 and 559 m2 g−1, respectively. While PA is relatively inexpensive (powdered PA: US $10–30 per kg and aqueous PA solution: <US $10 per kg),3 it is still more costly than phosphoric acid derived from PR, requiring the development of extraction procedures that isolate PA from crops in an economically competitive manner. Alternatively, it is possible to consider using materials containing PA, i.e., PA before isolation or purification, directly as catalysts. For instance, rice bran, which contains nearly 10 wt% PA, could be examined for its catalytic effect after separating from rice oil that is fractionated further into value-added compounds such as ferulic acid, wax, glucosylceramide, and tocotrienols.55,56 Although most PA in rice bran exists as phytin (mixed salt with calcium and magnesium), studies found catalytic activity for producing LGO in salts including ionic liquids, (NH4)H2PO4 (a typical component of fertilizer), and NaHSO4.26 In Japan, nearly one million tons of rice bran is generated annually during the rice polishing process, but large quantities of it are not industrially utilized.55 Assuming the PA content in rice bran is around the ∼10% mentioned prior, and the optimum 0.75 wt% loading of PA on cellulose described herein is employed, this amount corresponds to processing about 13 million tons of cellulose, potentially producing 2.6 million tons of LGO if the yield from cellulose is 20 wt%.
Conclusions
This study demonstrated that biogenic PA serves as a viable organocatalyst during cellulose pyrolysis, leading to efficient LGO production. Although PA is more expensive than phosphoric acid, it is derived from agricultural waste and is currently limited to specialized applications. In contrast, phosphoric acid is a versatile chemical, synthetically produced on a larger industrial scale through an energy- and redox-inefficient process using phosphate rock, a finite and increasingly strained resource. As large-scale applications for PA emerge, it is expected that extraction methods will improve, leading to reduced costs. The following conclusions can be drawn based on the experiments conducted: (1) thermogravimetry revealed that PA decreases the pyrolysis onset temperature by 60 °C even with the loading of 0.3 wt%, which corresponded to 0.095 wt% of P. The difference in the range of kinetic compensation effect plot between cellulose with or without PA indicated that PA altered reactions occurring during the pyrolysis. (2) PA catalyzes the generation of LGO during cellulose pyrolysis, as confirmed by pyro-GC/MS analysis. However, in the fast pyrolysis, even when the loading amount was increased to 2 wt%, PA could not penetrate the cellulose particles effectively with the main product being LGA. (3) In contrast, in the slow pyrolysis, PA penetrated the cellulose during the course of heating, selectively producing LGO. The formation of LGO started below 300 °C and was mostly completed by 350 °C. PA worked for the dehydration of cellulose, leading to the direct formation of LGO. (4) The yield of LGO was maximized at a PA loading of 0.75 wt%, reaching 19.5 wt%, which accounted for the conversion of 25.0% carbon in cellulose to LGO. The excessive dehydration caused by PA loading led to a decrease in LGO yield, a trend that was also evident from the increase in char yield. Compared to the PR-derived phosphoric acid catalyst, PA had equal or superior catalytic activity on a phosphorus basis. In the pyrolysis of lignocellulosic biomass, the loading of PA also contributed to the selective formation of LGO, but its effect was lower compared to pure cellulose. (5) PA, which penetrated the cellulose particles during the heating, forming dehydration–condensation products or ester bonds with cellulose, was difficult to recover by water washing even at pyrolysis temperatures around 200 °C, where LGO formation had not yet started. NMR spectra showed that PA, while taking forms such as pyrophosphate or polyphosphate at higher temperatures, promoted the formation of LGO by interacting with cellulose through hydrogen bonds or ester bonds.Data availability
The data supporting this article have been included as part of the ESI.†Author contributions
Tsinjo Nirina Rafenomananjara: investigation, visualization, writing – original draft. Shinji Kudo: conceptualization, funding acquisition, methodology, project administration, resources, supervision, writing – original draft. Jonathan Sperry: conceptualization, supervision, writing – review & editing. Shusaku Asano: supervision, writing – review & editing. Jun-ichiro Hayashi: supervision, writing – review & editing.Conflicts of interest
There are no conflicts to declare.Acknowledgements
This work was financially supported by a project (JPNP16002) subsidized by the New Energy and Industrial Technology Development Organization (NEDO). A part of this work was carried out under the support of MEXT/JSPS KAKENHI grant no. JP20K05210 and the Cross-Ministerial Strategic Innovation Promotion Program (SIP) “Technologies for Smart Bioindustry and Agriculture” administered by the Bio-oriented Technology Research Advancement Institution, National Agriculture and Food Research Organization (NARO). We thank Ms Keiko Ideta for her technical support with NMR analysis. This work was performed under the Cooperative Research Program of “Network Joint Research Center for Materials and Devices”. T. N. R. thanks the support from the Research and Education Grant for the University Consortium (consortium name: CES-CHEM).Notes and references
- S. P. M. Ung and C.-J. Li, RSC Sustainability, 2023, 1, 11–37 Search PubMed.
- M. B. Geeson and C. C. Cummins, ACS Cent. Sci., 2020, 6, 848–860 CrossRef CAS PubMed.
- E. K. Davison, J. C. Neville and J. Sperry, Green Chem., 2023, 25, 5390–5403 RSC.
- A. R. Jupp, S. Beijer, G. C. Narain, W. Schipper and J. C. Slootweg, Chem. Soc. Rev., 2021, 50, 87–101 RSC.
- C. Langhans, A. H. W. Beusen, J. M. Mogollón and A. F. Bouwman, Nat. Sustain., 2021, 5, 57–63 CrossRef.
- S. R. Carpenter and E. M. Bennett, Environ. Res. Lett., 2011, 6, 014009 CrossRef.
- J. N. A. Lott, I. Ockenden, V. Raboy and G. D. Batten, Seed Sci. Res., 2000, 10, 11–33 CrossRef CAS.
- A. P. M. Bloot, D. L. Kalschne, J. A. S. Amaral, I. J. Baraldi and C. Canan, Food Rev. Int., 2023, 39, 73–92 CrossRef CAS.
- P. Böhm, M. Dornbusch and J. S. Gutmann, J. Coat. Technol. Res., 2023, 21, 355–367 CrossRef.
- X. Gao, C. Zhao, H. Lu, F. Gao and H. Ma, Electrochim. Acta, 2014, 150, 188–196 CrossRef CAS.
- U. Schlemmer, W. Frolich, R. M. Prieto and F. Grases, Mol. Nutr. Food Res., 2009, 53(suppl. 2), S330–S375 Search PubMed.
- K. L. Empson, T. P. Labuza and E. Graf, J. Food Sci., 2006, 56, 560–563 CrossRef.
- M. B. Ali, F. Wang, R. Boukherroub and M. Xia, Appl. Surf. Sci., 2020, 518, 146206 CrossRef.
- E. Orzan, A. Barrio, S. Spirk and T. Nypelö, Ind. Crop. Prod., 2024, 218, 118858 CrossRef CAS.
- K. Antoun, M. Ayadi, R. El Hage, M. Nakhl, R. Sonnier, C. Gardiennet, N. Le Moigne, A. Besserer and N. Brosse, Ind. Crop. Prod., 2022, 186, 115265 CrossRef CAS.
- X.-W. Cheng, J.-P. Guan, R.-C. Tang and K.-Q. Liu, J. Clean. Prod., 2016, 124, 114–119 CrossRef CAS.
- Q. Zhang, X. Wang, Z. Li, W. Wu, J. Liu, H. Wu, S. Cui and K. Guo, RSC Adv., 2014, 4, 19710–19715 RSC.
- V. C. Pham, W. Chavasiri and L. Radtanajiravong, Org. Biomol. Chem., 2024, 22, 2307–2312 RSC.
- M. Cordella, C. Torri, A. Adamiano, D. Fabbri, F. Barontini and V. Cozzani, J. Hazard. Mater., 2012, 231–232, 26–35 CrossRef CAS PubMed.
- D. Mohan, C. U. Pittman Jr and P. H. Steele, Energy Fuels, 2006, 20, 848–889 CrossRef CAS.
- M. B. Comba, Y.-H. Tsai, A. M. Sarotti, M. I. Mangione, A. G. Suárez and R. A. Spanevello, Eur. J. Org. Chem., 2018, 590–604 CrossRef CAS.
- T. Ebata and H. Tatsushita, Yuki Gosei Kagaku Kyokaishi, 1994, 52, 1074–1082 CrossRef CAS.
- S. H. Krishna, K. Huang, K. J. Barnett, J. He, C. T. Maravelias, J. A. Dumesic, G. W. Huber, M. De bruyn and B. M. Weckhuysen, AIChE J., 2018, 64, 1910–1922 CrossRef CAS.
- I. Itabaiana Junior, M. A. Nascimento, R. O. M. A. de Souza, A. Dufour and R. Wojcieszak, Green Chem., 2020, 22, 5859–5880 RSC.
- Y. Halpern, R. Riffer and A. Broido, J. Org. Chem., 1973, 38, 204–209 CrossRef CAS.
- S. Kudo, X. Huang, S. Asano and J.-i. Hayashi, Energy Fuels, 2021, 35, 9809–9824 CrossRef CAS.
- R. A. Milescu, M. L. Segatto, A. Stahl, C. R. McElroy, T. J. Farmer, J. H. Clark and V. G. Zuin, ACS Sustain. Chem. Eng., 2020, 8, 18245–18257 CrossRef CAS.
- J. E. Camp, ChemSusChem, 2018, 11, 3048–3055 Search PubMed.
- H. Kawamoto, S. Saito, W. Hatanaka and S. Saka, J. Wood Sci., 2007, 53, 127–133 CrossRef CAS.
- F. Cao, T. J. Schwartz, D. J. McClelland, S. H. Krishna, J. A. Dumesic and G. W. Huber, Energy Environ. Sci., 2015, 8, 1808–1815 RSC.
- Y. Tsuchiya and K. Sumi, J. Appl. Polym. Sci., 1970, 14, 2003–2013 CrossRef CAS.
- G. Dobele, G. Rossinskaja, G. Telysheva, D. Meier and O. Faix, J. Anal. Appl. Pyrolysis, 1999, 49, 307–317 CrossRef CAS.
- G. Dobele, T. Dizhbite, G. Rossinskaja, G. Telysheva, D. Meier, S. Radtke and O. Faix, J. Anal. Appl. Pyrolysis, 2003, 68–69, 197–211 CrossRef CAS.
- G. Dobele, A. Zhurinsh, A. Volperts, V. Jurkjane, R. Pomilovskis and K. Meile, Wood Sci. Technol., 2020, 54, 383–400 CrossRef CAS.
- K. Miura and T. Maki, Energy Fuels, 1998, 12, 864–869 CrossRef CAS.
- Y.-C. Lin, J. Cho, G. A. Tompsett, P. R. Westmoreland and G. W. Huber, J. Phys. Chem. C, 2009, 113, 20097–20107 CrossRef CAS.
- N. Sonoyama and J.-i. Hayashi, Fuel, 2013, 114, 206–215 CrossRef CAS.
- K. Czajka, A. Kisiela, W. Moroń, W. Ferens and W. Rybak, Fuel Process. Technol., 2016, 142, 42–53 CrossRef CAS.
- A. M. Sarotti, Carbohydr. Res., 2014, 390, 76–80 CrossRef CAS PubMed.
- S. Kudo, Z. Zhou, K. Norinaga and J.-i. Hayashi, Green Chem., 2011, 13, 3306–3311 RSC.
- S. Saragai, S. Kudo, J. Sperry, U. P. M. Ashik, S. Asano and J.-i. Hayashi, Bioresour. Technol., 2022, 344, 126323 CrossRef CAS PubMed.
- B. Hu, Q. Lu, Y.-T. Wu, W.-L. Xie, M.-S. Cui, J. Liu, C.-q. Dong and Y.-p. Yang, J. Energy Chem., 2020, 43, 78–89 CrossRef.
- A. Sluiter, B. Hames, R. Ruiz, C. Scarlata, J. Sluiter, D. Templeton and D. Crocker, US National Renwable Energy Laboratory, 2011, NREL/TP-510-42618.
- F. Wei, S. Kudo, S. Asano and J.-i. Hayashi, Energy Fuels, 2022, 36, 6949–6958 CrossRef CAS.
- P. R. Patwardhan, J. A. Satrio, R. C. Brown and B. H. Shanks, Bioresour. Technol., 2010, 101, 4646–4655 CrossRef CAS PubMed.
- F. Cao, S. Xia, X. Yang, C. Wang, Q. Wang, C. Cui and A. Zheng, Chem. Eng. J., 2020, 385, 123809 CrossRef CAS.
- L. Jiang, A. Zheng, Z. Zhao, F. He, H. Li and W. Liu, Bioresour. Technol., 2015, 182, 364–367 CrossRef CAS PubMed.
- E. O. L. Olsson, P. Glarborg, K. Dam-Johansen and H. Wu, Energy Fuels, 2023, 37, 6907–6998 CrossRef.
- A. L. M. Daneluti and J. R. Matos, Braz. J. Pharm. Sci., 2013, 49, 275–283 CrossRef CAS.
- C. Samba-Fouala, J.-C. Mossoyan, M. Mossoyan-DeÂneux, D. Benlian, C. Chaneac and F. Babonneau, J. Mater. Chem., 2000, 10, 387–393 RSC.
- K. Sykam, M. Försth, G. Sas, Á. Restás and O. Das, Ind. Crop. Prod., 2021, 164, 113349 CrossRef CAS.
- G. Jiang, J. Qiao and F. Hong, Int. J. Hydrogen Energy, 2012, 37, 9182–9192 CrossRef CAS.
- F. Rol, C. Sillard, M. Bardet, J. R. Yarava, L. Emsley, C. Gablin, D. Leonard, N. Belgacem and J. Bras, Carbohydr. Polym., 2020, 229, 115294 CrossRef CAS PubMed.
- B. Wang, K. Li, C.-B. Zhang, T. Huang, T.-P. Wang and Q. Lu, Ind. Crop. Prod., 2023, 206, 117594 CrossRef CAS.
- H. Taniguchi, H. Hashimoto, A. Hosoda, T. Kometani, T. Tsuno and S. Adachi, Nippon Shokuhin Kagaku Kogaku Kaishi, 2012, 59, 301–318 CrossRef CAS.
- L. Zheng, X. Y. Zhu, J. Wang and W. Su, Chem. Biol. Technol. Agric., 2023, 10, 53 CrossRef CAS.
Footnote |
| † Electronic supplementary information (ESI) available: Additional table and figures. See DOI: https://doi.org/10.1039/d4su00502c |
| This journal is © The Royal Society of Chemistry 2025 |

