 Open Access Article
Peanut shell-derived activated carbon incorporated with nitrogen anode and cobalt cathode materials (“two-in-one” strategy) for asymmetric supercapacitor (N-PAC//PVA-KOH//Co-PAC) applications
Esakkimuthu
Shanmugasundaram
 a,
Amos
Ravi
b,
Vigneshkumar
Ganesan
 a,
Vimalasruthi
Narayanan
 a,
Kannan
Vellaisamy
 a,
Sowmiapratha
Pandikannan
a,
Suganya Bharathi
Balakrishnan
a,
Sowmiapratha
Pandikannan
a,
Suganya Bharathi
Balakrishnan
 c and
Stalin
Thambusamy
 *a
*a
aDepartment of Industrial Chemistry, Alagappa University, Karaikudi-630 003, Tamil Nadu, India. E-mail: stalin.t@alagappauniversity.ac.in; drstalin76@gmail.com
bDepartment of Materials Science, Central University of Tamil Nadu, Thiruvarur-610 005, Tamil Nadu, India
cDayananda Sagar University, Department of Chemistry, School of Engineering, Devarakaggalahalli, Harohalli, Ramanagara, Karnataka, India
First published on 19th November 2024
Abstract
Supercapacitors have received more attraction in energy storage technology owing to their low cost, high capacity, and good stability. Herein, a bio-mass-derived carbon source is prepared from peanut shells and incorporated with heteroatom boron (B-PAC), nitrogen (N-PAC), and metal oxide (cobalt oxide (Co-PAC)). The structural and surface morphology of the obtained PACs is studied using X-ray diffraction (XRD) and Raman spectroscopy, scanning electron microscopy (SEM), and Brunauer–Emmett–Teller (BET) analysis. The electrochemical behavior of PAC-coated electrodes is evaluated through cyclic voltammetry (CV), electrochemical impedance spectroscopy (EIS), and galvanostatic charge–discharge study (GCD). Compared to boron, the nitrogen heteroatom enhances electric double capacitance up to 302 F g−1 at 2 A g−1. Moreover, cobalt oxide exhibits a synergetic effect with the carbon matrix to boost electrochemical-specific capacitance behavior, and the capacitance value is 295 F g−1 at 1 A g−1 in the three-electrode system. Asymmetric supercapacitor devices were made using N-PAC as the negative electrode and Co-PAC as the positive electrode. The N-PAC//PVA-KOH//Co-PAC device delivers 45 W h kg−1 energy density and 846 W kg−1 at 1 A g−1 power density with 100% capacitance retention after 3000 cycles. The higher energy and power density and long cycle life of the N-PAC//PVA-KOH//Co-PAC device render it as a potential energy storage device for practical applications.
Sustainability spotlightUtilizing biomass derivatives can contribute to developing sustainable energy sources and environmental protection in the modern world. Various biomass carbon sources, including tea leaves, coconut shells, almond shells, poplar wood, and peanut shells, are used in energy and environmental applications. Among these, peanut shells have received much attention in energy storage applications owing to their higher surface area, sufficient pore size, and good electrochemical capacitance behavior. Our study focuses on preparing nitrogen and cobalt-doped peanut shell-derived carbon as anode and cathode materials for asymmetric supercapacitor applications. This work highlights the importance of the UN sustainable development goals, such as affordable and clean energy (SDG 7), ensuring sustainable consumption and production patterns (SDG 12), and climate action (SDG 13). |
1. Introduction
Currently, the energy shortage and environmental degeneration are serious issues caused by uncontrolled population growth and overuse of non-renewable energy sources such as coal, petroleum, and uranium.1,2 The development of new energy generation3 and storage is a crucial way to tackle the issues; therefore, researchers have focused on energy storage technology and tried to develop it in various effective ways.4,5 Supercapacitors (SCs) are promising and efficient energy storage devices because of their merits of high power-density, long life-cycle, superior thermal operating capacity, low maintenance cost, and quick charging.6–8 Based on their energy storage mechanisms, SCs are classified into two types: electrical double-layer capacitors (EDLCs)9,10 and pseudocapacitors.11–13 The EDLC energy storage mechanism is based on three models: the Gouy–Chapman, Helmholtz, and Stern models.14 According to these models, electric field is produced at the interface between the electrolyte and electrode through electrostatic adsorption, and energy is stored. In these processes, carbon materials such as activated carbon (AC), graphene oxide (GO),15,16 carbon nanotubes (CNTs),17 and carbon quantum dots18,19 are commonly used, which can easily attract more ions with the help of their high surface area and provide higher capacitance.Pseudocapacitors display a faradaic redox reaction—electrons transfer between the electrode and electrolyte during charge–discharge processes and store energy. Metal oxides, metal sulfides, metal hydroxides, and conducting polymers are used as electrode materials with valence state change properties during the charge–discharge time.20,21 The Faraday reaction can enhance the electrochemical performance of pseudocapacitors so that they deliver a higher specific capacitance and life cycle than EDLCs.22
Even though EDLCs and pseudocapacitors have significant electrochemical performance, they have some drawbacks, such as low energy density, poor electron or ion mobility, and low cycling stability. To overcome these issues, researchers have combined EDLC and pseudo-capacitor materials to form hybrid supercapacitors (HSCs).23 This type of supercapacitor has higher energy density and capacitance than others because it reaches higher voltage owing to their dual different type of storage performance (EDLCs and PCs).
Biomass-derived carbon is considered a low-cost, effective electrode material for SCs24 because of its crucial properties, such as higher surface area, superior pore size, good chemical stability, and electrical conductivity.25 Moreover, the utilization of biomass derivatives helps to protect the environment and develop sustainable energy in an efficient way. There are different types of biomass carbon sources like coconut shells, almond shells, poplar wood, tea leaves, and peanut shells (PS) that are used in various environmental and energy applications.
Peanuts are an oil-bearing crop whose production is 40 million metric tons per year across the world, whereas millions of tons of PS are disposed of every year.26,27 The peanut shell-derived activated carbon (PAC) has received much more attention in various applications, namely bio-adsorbents, waste-water treatment,28 and electro-catalyst for urea oxidation.29 Particularly, PAC has received significant attention from energy storage applications like SCs and batteries because they easily store the charges with the help of higher surface area.30 Moreover, PAC has some unique characteristic features, such as low cost, eco-friendliness, high porosity, and good electrochemical properties, enabling its use as an electrode material for energy storage applications. PAC can be subjected to an activation process by various activators such as solvents, metal oxides, and conducting polymers to improve the surface area and pore size, which helps to enhance capacitance and charge storage properties. By a solvent activation process, Xiaochen Jiang et al.31 prepared H2SO4, NH4OH and HNO3 activated PAC, which exhibited a large surface area and pore structure and delivered 266.06 F g−1 capacitance at 0.5 A g−1. Yinbo Zhan et al. activated PAC by KCl, KOH, K2CO3 and NaOH and reported that PAC-KOH has a high surface area and the capacitance value is 339 F g−1 capacitance at 1 A g−1.32 PAC electrodes doped with heteroatoms like nitrogen,33 sulfur34 and oxygen show a high specific capacitance range. Metal-based precursors, for instance, ZnCl2, are used to activate the PAC electrode, which exhibits a capacitance of 184 F g−1 at 0.05 A g−1.35 Yinbo Zhan et al. reported the CuO-PAC material with a good capacitance range of 530 F g−1 at 1 A g−1.36
The previous reports suggest that the heteroatom and metal oxides act as superior precursors for improving the surface area and capacitance range of PAC. The metal-doped PAC is used as a positive electrode and the heteroatom or carbon precursor-doped PAC is used as a negative electrode. To the best of our knowledge, there are no reports on asymmetric supercapacitors with PAC-based materials as positive and negative electrodes. The development of two kinds of materials from a single precursor is called the ‘two for one’ strategy. The method can tune the material's porosity and surface area, which can help enhance the electrochemical properties of the material. Rahul R. Salunkhe et al. reported the asymmetric supercapacitor using carbon and cobalt oxide electrodes from the single metal–organic framework and the device delivers high energy (36 W h kg−1) and power density (8000 W kg−1).37 Lin Cheng et al. prepared an asymmetric device based on the ‘two for one’ method from Fe-Co-ZIF-67, which delivered energy (37 W h kg−1) and power density (750 W kg−1).38
From the effective reports of the ‘two-for-one’ strategy, this is the first attempt to prepare heteroatom-doped PAC as a negative electrode and transition metal (cobalt) doped PAC as a positive electrode. PAC is activated by boric acid (for boron doping) and urea (for nitrogen doping) using the hydrothermal method, and the derived materials are called B-PAC and N-PAC, respectively, and the positive electrode was prepared by doping cobalt oxide (cobalt oxide as a precursor) with PAC, which is called Co-PAC. Compared to B-PAC, N-PAC has a high capacitance range, which is 302 F g−1 at 2 A g−1 due to the electronegative property of nitrogen atoms, whereas Co-PAC has superior redox behavior and capacitance property, and the capacitance value is 295 F g−1 at 1 A g−1. Benefiting from the results, we fabricated an asymmetric electrode device with N-PAC – negative electrode and Co-PAC – positive electrode. The N-PAC//PVA-KOH//Co-PAC device delivers 45 W h kg−1 energy density and 846 W kg−1 at 1 A g−1 power density. Moreover, it holds 100% capacitance retention after 3000 galvanostatic charge–discharge cycles.
2. Experimental details
2.1. Chemicals and reagents
The peanut shell waste was collected from the local market. Boric acid, urea, cobalt nitrate, potassium hydroxide, acetylene black, polyvinylidene fluoride, and N-methyl pyrrolidone were purchased from SRL chemicals. All chemicals were used without further purification.2.2. Preparation of activated carbon from peanut shell
10 g of peanut shells were washed with deionized water for removal of impurities and placed in a muffle furnace at 250 °C for 5 h. The sample was activated by 1 M KOH. Then, a carbonization process is performed in which the sample is filled in the porcelain boat in a tubular furnace and heated at 800 °C argon atmosphere (10 °C min−1). The obtained carbon powder was treated with 3 M HCl to remove the unreacted activated agent, sonicated for 12 h, and washed with water. Finally, the activated carbon powder (PAC) was filtered and dried in the oven at 200 °C for 3 h.392.3. Preparation of boron and nitrogen heteroatom doped PAC and cobalt doped PAC
100 mg of PAC was dissolved in 50 mL of water and 20 mmol of boric acid was added to the solution. The solution was transferred to a stainless autoclave and heated at 180 °C for 5 h. The resulting product was placed in a muffle furnace at 300 °C for 5 h. The obtained product is boron-doped PAC (B-PAC). The same procedure was followed to produce the nitrogen-doped PAC (N-PAC) and cobalt-doped PAC (Co-PAC), where instead of boric acid, we added urea for nitrogen and cobalt nitrate for cobalt doping in the PAC solution, respectively.2.4. Physical characterization and equipment
X-ray diffraction patterns and Raman spectra were obtained using an X-ray diffractometer (XRD, X′ Pert Pro – Panalytic equipped with a Cu Kα source (1.54 Å – wavelength, scan step size-0.0500°, scan step time-10.7950 s)) and Raman spectrometer (XploRA™ PLUS Raman Spectrometer – Confocal Raman Microscope), respectively. The elemental composition was investigated by X-ray photoelectron spectroscopy (XPS) (PHI – VERSAPROBE III instrument using Al Kα – 1486.6 eV). The surface morphology and elemental composition were evaluated by scanning electron microscope (SEM, NOVA NANO 450-accelerating voltage – from 200 eV up to 30 keV, current – 300 μA) and EDAX mapping studies. The surface area and porous nature were analyzed using Brunauer–Emmett–Teller (BET) techniques using the Nova 2200e model.2.5. Electrochemical measurement
The electrochemical behavior of the prepared electrode materials was investigated using the Metrohm Autolab workstation. In a three-electrode setup, the analyzing material (90%), activated carbon (5%), and polytetrafluoroethylene (5%) were mixed using N-methyl-2-pyrrolidone as a solvent to form a slurry. The slurry was coated on the Ni foam and dried at 80 °C for 12 h, which is used as a working electrode; silver–silver chloride (Ag/AgCl) is used as a reference electrode and platinum wire as a counter electrode. Cyclic voltammetry (CV), electrochemical impedance spectroscopy (EIS), and galvanostatic charge–discharge study (GCD) were performed, and 1 M KOH was used as the aqueous electrolyte. The CV measurement was carried out at 10 to 100 mV s−1, GCD was studied at 1 to 5 A g−1 and the EIS measurement was done in a frequency range of 100 kHz to 0.01 Hz.The specific capacitance of the electrode materials was calculated with the help of the following eqn (1)
| Cs = I × Δt/Δv × m | (1) |
In the asymmetric two-electrode setup, N-PAC is the negative electrode, Co-PAC is the positive electrode, and PVA-KOH gel acts as an electrolyte. The energy and power density are calculated by eqn (2) and (3)
| E = [C × (Δv)2]/7.2 | (2) |
| P = E × 3600/Δt | (3) |
3. Results and discussion
3.1. XRD and Raman analysis
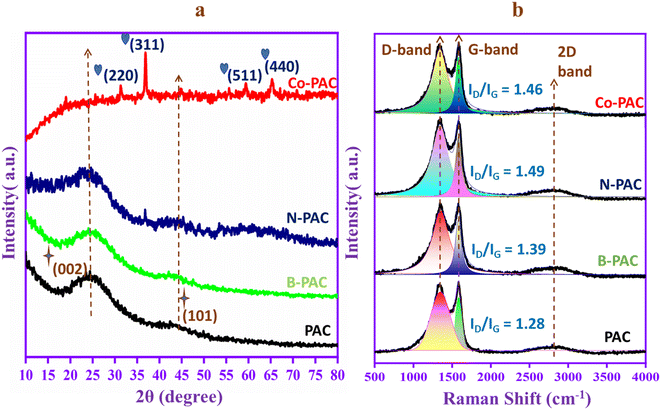
Fig. 1a exhibits the X-ray diffraction (XRD) patterns of peanut-activated carbon (PAC), boron-doped PAC (B-PAC), nitrogen-doped PAC (N-PAC), and cobalt-doped (Co-PAC). The patterns of PAC, B-PAC, and N-PAC show two types of broad diffraction peaks that correspond to amorphous carbon. The PAC has a broad peak at 2θ = 24.43° that corresponds to the (002) crystal plane. The plane indicates the interconnection and parallel stacking arrangement of graphene layers in the PAC skeleton. Moreover, another peak is located at 2θ = 41.97°, and the crystal plane is (101), which denotes that the PAC contains hexagonal honeycomb carbon. These peaks are also presented in B-PAC and N-PAC, but the position is slightly shifted to 2θ = 24.65°, 42.91° and 2θ = 23.03°,42.67°, respectively. The peak shift indicates the heteroatoms boron and nitrogen are incorporated into the carbon structure. The Co-PAC graphitic carbon peaks are broad, and the intensity is low due to the cobalt nanoparticles destroying the graphitic carbon core structure. Noteworthy, the XRD curve of Co-PAC shows sharp and narrow peaks at 2θ = 31.12° (220), 36.90° (311), 59.31° (511), and 65.09° (440), corresponding to the cobalt nanoparticles in the oxide form, JCPDS data card no. (80-1538).40,41 Cobalt oxide is reduced by carbon and forms cobalt nanoparticles that can help reduce the electrical resistance and enhance the electrochemical performance of the Co-PAC composite. The structure of carbon in the samples was further investigated by Raman spectroscopy, as shown in Fig. 1b. The samples such as PAC, B-PAC, N-PAC, and Co-PAC exhibit D-bands (1340 cm−1) and G-bands (1580 cm−1). The D-band represents the presence of surface defects and disorder in the carbon, whereas the G-band is attributed to graphene in the sp2 plane. It is a well-known fact that the degree of graphitization is measured by the intensity ratio of the D and G bands.42 The calculated ID/IG values of PAC, B-PAC, N-PAC, and Co-PAC are 1.28, 1.39, 1.49 and 1.46, respectively. The boron, nitrogen, and cobalt-doped PAC intensity ratio is higher than the undoped PAC. The result indicates the doping process generates more active sites and surface defects in the PAC carbon skeleton that can help speed up the ion/electron exchange process in the electrochemical reaction. Moreover, a weaker broad peak presented at around 2800 cm−1 indicates the occurrence of graphitization during the doping process.3.2. XPS study
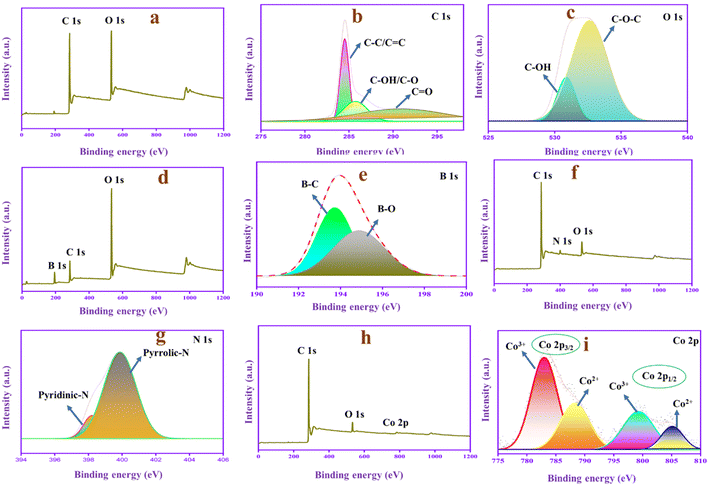
XPS analysis, as shown in Fig. 2, helps to investigate the chemical composition and functional groups of PAC, N-PAC and Co-PAC. The PAC has two peaks at 285.68 and 532.33 eV, representing the C 1s and O 1s peaks, as shown in Fig. 2a. The C 1s spectrum of PAC (Fig. 2b) is separated into three main peaks, representing different types of carbon functional groups, 284.53 (C–C/C![[double bond, length as m-dash]](https://www.rsc.org/images/entities/char_e001.gif) C), 285.78 (C–OH, C–O) and 290.95 eV (C
C), 285.78 (C–OH, C–O) and 290.95 eV (C![[double bond, length as m-dash]](https://www.rsc.org/images/entities/char_e001.gif) O). The O 1s spectrum (Fig. 2c) is separated into two peaks located at 530.86 and 532.61 eV, denoting the C–OH and C–O–C functional groups. Moreover, the B-PAC composite (Fig. 2d) has three peaks located at 197.26, 285.63 and 534.61 eV, corresponding to B 1s, C 1s, and O 1s, respectively. The B 1s spectrum (Fig. 2e) shows the B–C and B–O peaks at 193.73 eV and 194.40 eV. The result confirms that the boric acid produces the boron atom that can be doped with PAC. Moreover, the N-PAC composite consists of three peaks at 284.24, 400.13 and 528.7 eV corresponding to the C 1s, N 1s, and O 1s, respectively, as displayed in Fig. 2f. The N 1s spectrum in Fig. 2g exhibits the pyridine N and pyrrolic N at 398.15 and 399.83, respectively.43 The above results confirm that the reaction of PAC with urea generates nitrogen functional groups on the surface of the PAC carbon skeleton. The Co-PAC (Fig. 2h) survey spectrum has three major peaks at 285.63, 532.42 and 781.39 eV, corresponding to C 1s, O 1s and Co 2p, respectively. Moreover, the XPS spectrum of the Co 2p orbital is displayed in Fig. 2i. The spectrum consists of four peaks at 779.93, 781.21 and 794.94 and 796.68 eV, corresponding to Co3+(2p3/2), Co2+(2p3/2) and Co3+(2p1/2), Co2+(2p1/2), respectively.44 The XPS results overall confirm that the boron and nitrogen are doped in B-PAC and N-PAC, respectively, and the cobalt is doped in the Co-PAC composite. Typically, the pyridine N and pyrrolic N are considered electroactive sites when presented in the carbon source because they help improve the conductivity and speed up the charge transfer process, and the introduction of cobalt into the carbon skeleton can improve the pseudocapacitive nature of the material.
O). The O 1s spectrum (Fig. 2c) is separated into two peaks located at 530.86 and 532.61 eV, denoting the C–OH and C–O–C functional groups. Moreover, the B-PAC composite (Fig. 2d) has three peaks located at 197.26, 285.63 and 534.61 eV, corresponding to B 1s, C 1s, and O 1s, respectively. The B 1s spectrum (Fig. 2e) shows the B–C and B–O peaks at 193.73 eV and 194.40 eV. The result confirms that the boric acid produces the boron atom that can be doped with PAC. Moreover, the N-PAC composite consists of three peaks at 284.24, 400.13 and 528.7 eV corresponding to the C 1s, N 1s, and O 1s, respectively, as displayed in Fig. 2f. The N 1s spectrum in Fig. 2g exhibits the pyridine N and pyrrolic N at 398.15 and 399.83, respectively.43 The above results confirm that the reaction of PAC with urea generates nitrogen functional groups on the surface of the PAC carbon skeleton. The Co-PAC (Fig. 2h) survey spectrum has three major peaks at 285.63, 532.42 and 781.39 eV, corresponding to C 1s, O 1s and Co 2p, respectively. Moreover, the XPS spectrum of the Co 2p orbital is displayed in Fig. 2i. The spectrum consists of four peaks at 779.93, 781.21 and 794.94 and 796.68 eV, corresponding to Co3+(2p3/2), Co2+(2p3/2) and Co3+(2p1/2), Co2+(2p1/2), respectively.44 The XPS results overall confirm that the boron and nitrogen are doped in B-PAC and N-PAC, respectively, and the cobalt is doped in the Co-PAC composite. Typically, the pyridine N and pyrrolic N are considered electroactive sites when presented in the carbon source because they help improve the conductivity and speed up the charge transfer process, and the introduction of cobalt into the carbon skeleton can improve the pseudocapacitive nature of the material.
3.3. Surface morphology study
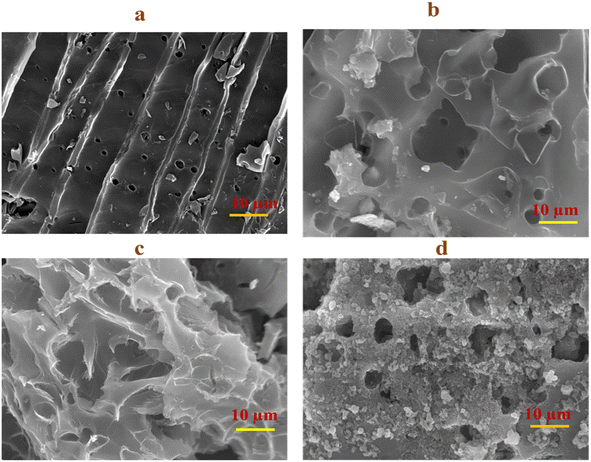
To investigate the surface morphology of the PACs, scanning electron microscopy (SEM) was performed. Fig. 3a demonstrates that the PAC has a blocky sheet-like structure with pores, in which the carbon sheets are randomly arranged.34 After doping the PAC with heteroatoms and metal oxide, the roughness increased. It is a known fact that the higher roughness increases the specific surface area of the material and thus contributes to the capacitance performance. In Fig. 3b, boron was impregnated into the PAC and formed the cloudy layer on the blocky sheet without changing the porous nature of the carbon sheet. N-PAC (Fig. 3c) also has the same morphology change but the accumulation of the cloudy layer is higher than that of B-PAC. Interestingly, Co-PAC has a structure different from other materials, as shown in Fig. 3d. The cobalt nanoparticles agglomerated on the PAC surface and the morphology looks like a large porous structure; hence, the electrolyte ions easily interact with the material, which should improve the electrochemical performance.3.4. Elemental composition analysis
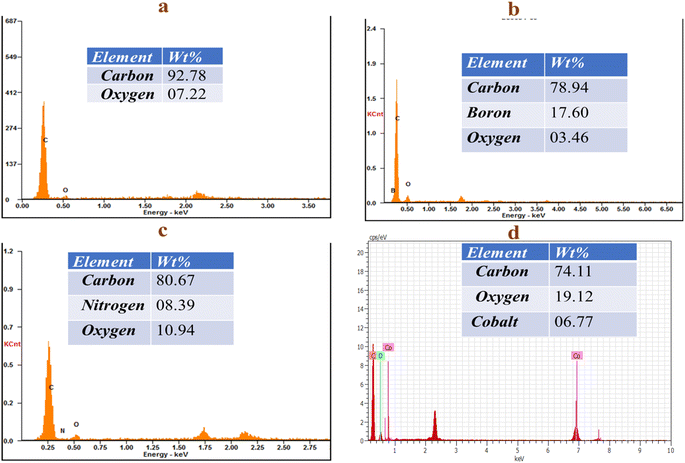
Energy dispersive X-ray (EDX) analysis helps to determine the elemental distribution of the PAC, B-PAC, N-PAC, and Co-PAC composites, as shown in (Fig. 4a–d). In Fig. 4a, it is observed that carbon (92.78%) and oxygen (07.22%) elements are present in the PAC materials. Fig. 4b shows the carbon (78.94%), boron (17.60%), and oxygen (03.46%) in B-PAC. Fig. 4c shows the carbon (80.67%), nitrogen (08.39%), and oxygen (10.94%) in N-PAC. These results confirmed that the boron and nitrogen are embedded into the carbon matrix. The carbon (74.11%), cobalt (06.77%), and oxygen (19.12%) are present in the Co-PAC composite (Fig. 4d), in which the cobalt nanoparticles are agglomerated on the porous carbon surface.3.5. Brunauer–Emmett–Teller (BET) analysis
Generally, the specific surface area and pore size play a vital role in the electrochemical performance of EDLC-based supercapacitors.45Fig. 5a shows the N2 adsorption–desorption isotherms of PAC, B-PAC, N-PAC, and Co-PAC materials, while Fig. 5b exhibits their pore size distributions. The surface area curves exhibited a type I/IV adsorption isotherm,46 confirming the coexistence of macro, meso, and micropores in the prepared materials. The specific surface areas of PAC, B-PAC, N-PAC and Co-PAC are 713 m2 g−1, 905 m2 g−1, 1403 m2 g−1 and 685 m2 g−1, respectively. Among these, N-PAC has the highest specific surface area, which suggests the nitrogen heteroatom enhances the surface area and pore size nature of PAC.33 The higher surface area of N-PAC can promote the contact region between the electrolyte and electrode so the ions easily accumulate on the electrode surface. The accumulation of ions can enhance the capacitance performance of the electrode. The pore sizes of PAC, B-PAC, N-PAC, and Co-PAC are 2.26, 1.03, 4.03 and 2.89 nm, respectively. N-PAC has a larger pore size than others, which can speed up the electron and ion transport between the electrode and electrolyte. The rapid ion and electron transport can enhance the capacitance and reduce the resistance behavior of the electrode during the electrochemical reaction.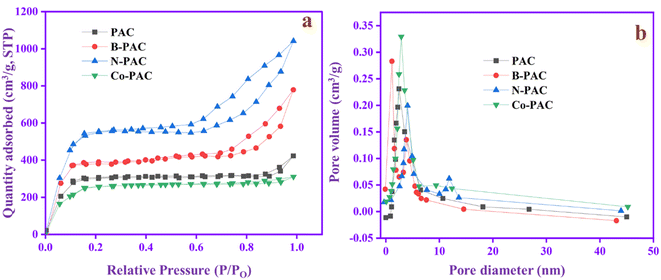 | ||
| Fig. 5 (a). N2 adsorption–desorption isotherms and (b) pore size distribution of PAC, B-PAC, N-PAC, and Co-PAC. | ||
3.6. Electrochemical studies-three electrode system
| Ip(v) = k1v + k2v0.5 | (4) |
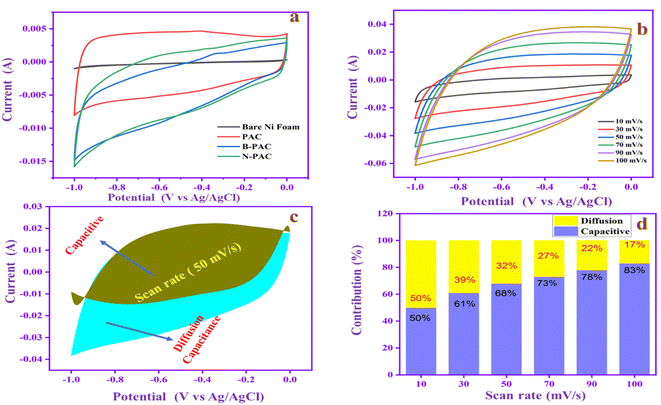
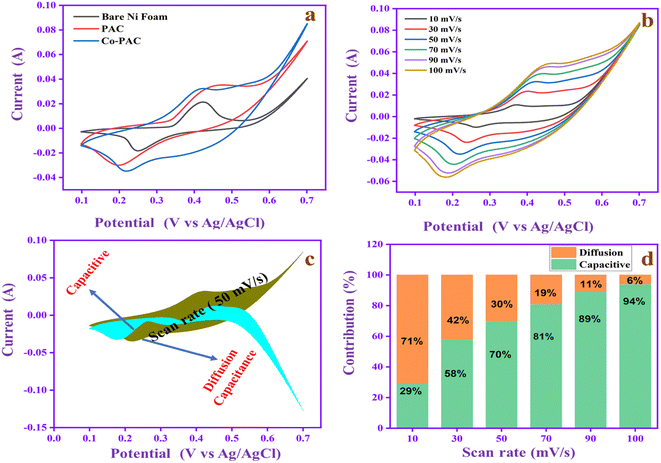
Fig. 6c exhibits the proportion of diffusion capacitance and capacitive (shaded region) for charge storage contributions at 50 mV s−1. The graphs show that the contribution rate of surface capacitance is 68% and the diffusion capacitance is 32%. The contribution rates of N-PAC at different scan rates are shown in Fig. 6d. At a low scan rate (10 mV s−1), the capacitive and diffusion contributions are equal. When the scan rate is improved, the capacitive contribution (surface capacitance) gradually increases and reaches 83% at 100 mV s−1. The result suggests that the N-PAC has higher capacitive contribution at higher scan rates owing to their rapid electron/ion migration between the electrode/electrolyte interface. The behavior is a key factor for achieving cyclic stability performance and good rate capability during charge–discharge processes in the higher current range.
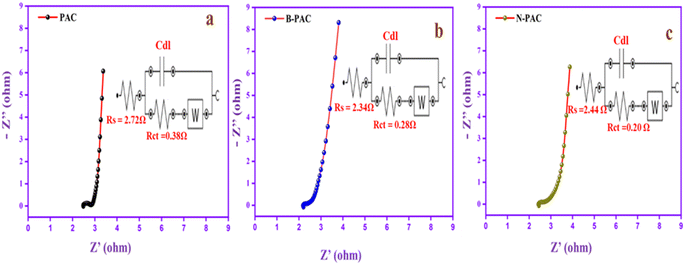
The EIS was recorded to further analyze the electrochemical performance of the materials, as depicted in Fig. 7. Basically, the EIS diagram contains two regions: the high-frequency region represents the charge transfer resistance (Rct), and the low-frequency region expresses the electrolyte solution resistance (Rs).50 The straight line in the low-frequency range indicates the ion diffusion resistance of the material. The Rs and Rct of PAC (Fig. 7a) are 2.72 Ω and 0.38 Ω, respectively. Meanwhile, for B-PAC and N-PAC, Rs and Rct are lower than those of PAC. For B-PAC (Fig. 7b), Rs is 2.34 Ω and Rct is 0.28 Ω, whereas for N-PAC (Fig. 7c), Rs is 2.44 Ω and Rct is 0.20 Ω. In addition, N-PAC has a small vertical line, which confirms that the material ion diffusion resistance is low. The heteroatom (boron and nitrogen) in the carbon matrix can modify the interaction dynamics with the electrolyte, which increases the speed of the charge carrier's movement, thus reducing the solution and charge transfer resistance. As a consequence, B-PAC and N-PAC display high current and capacitance performance in electrochemical tests.
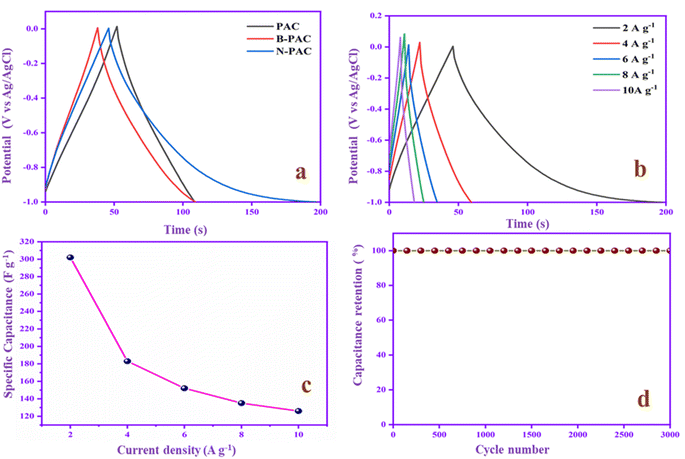
The potential range and charge–discharge capacity behavior of PAC, B-PAC, and N-PAC were evaluated by GCD experiments at a constant current of 2 A g−1, as shown in Fig. 8a. The specific capacitance of PAC, B-PAC and N-PAC are 114, 144 and 302 F g−1, respectively. Fig. 8b shows the isosceles triangle symmetrical shaped GCD curves that suggest the electrodes have an ideal capacitor and reversibility behavior.51 Among these, N-PAC has the longest discharge time and higher specific cap (Csp) range due to the nitrogen functional group on the surface of the electrode material, which reduces the ohmic resistance of the electrode and improves the electrode–electrolyte interaction. Moreover, Fig. 8c demonstrates the N-PAC GCD at different current densities (2 to 10 A g−1); Cs decreases from 302 to 126 F g−1 based on an increase in the current density. The discharge time is reduced when the current range is increased because the ions quickly accumulate on the electrode surface at a higher current range, thus decreasing the Cs. Cyclic stability is considered an essential parameter in SC applications. N-PAC has no capacitance loss and is stable at 100% capacitance retention after 3000 cycles, demonstrating its superior electrochemical stability performance, as shown in Fig. 8d. From the results, we conclude the N-PAC is a promising negative electrode in asymmetric SCs applications.
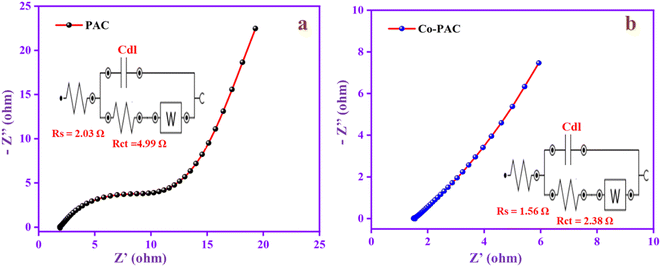
The resistance behavior of the electrode materials PAC and Co-PAC was evaluated by EIS analysis. In Fig. 10a, the EIS spectrum shows the semicircular portion, which is the charge transfer resistance (Rct), z′ represents the solution resistance (Rs) and the 45° oblique line represents the Warburg impedance, indicating the diffusion of electrolyte into these active materials. The Rs and Rct values of PAC are 2.03 and 4.99 Ω. The Rs and Rct values of Co-PAC (Fig. 10b) are 1.56 and 2.38 Ω and the straight line is closer to vertical, which means it has low ion diffusion resistance. Moreover, the Rs and Rct range of Co-PAC is lower than that of PAC, suggesting the synergistic effects can enhance the electron movement in the electrode–electrolyte interfaces and increase conductivity.
To evaluate the capacitance behavior, the electrodes are used in the GCD study, as depicted in Fig. 11a. The bare nickel foam capacitance range is 75 F g−1 and the PAC capacitance is 157 F g−1 whereas that of Co-PAC is 295 F g−1, suggesting that the cobalt ions can improve the capacitance of PAC with the help of the Faraday process. The PAC GCD is a triangle shape that indicates its EDLC behavior and superior electrochemical reversibility. The Co-PAC GCD divides the symmetrical rectangle, and the discharge time is higher than that of PAC. The result confirms that Co-PAC possesses better electrochemical performance than PAC due to the addition of cobalt ions in the carbon composite, which has pseudo-capacitor properties.36Fig. 11b and c exhibit the Co-PAC specific capacitance at different current densities. The capacitance of Co-PAC is retained at 295, 270, 247, 240 and 225 F g−1 at a current density of 1–5 A g−1. The capacitance value gradually decreases when the current density is increased due to the synergistic combination of the EDLC of carbon and the pseudo-capacitance behavior of cobalt. Fig. 11d shows the stability behavior of Co-PAC at 10 A g−1. The electrode gives 88.8% capacitance retention after 3000 cycles, with good stability due to the porous carbon and good pore size distribution in the composite. The excellent cyclic stability behavior demonstrates that the Co-PAC is a promising electrode material for high-performance SCs applications. The electrochemical performance of N-PAC and Co-PAC in comparison with the reported peanut shell-based materials are tabulated in Table 1.
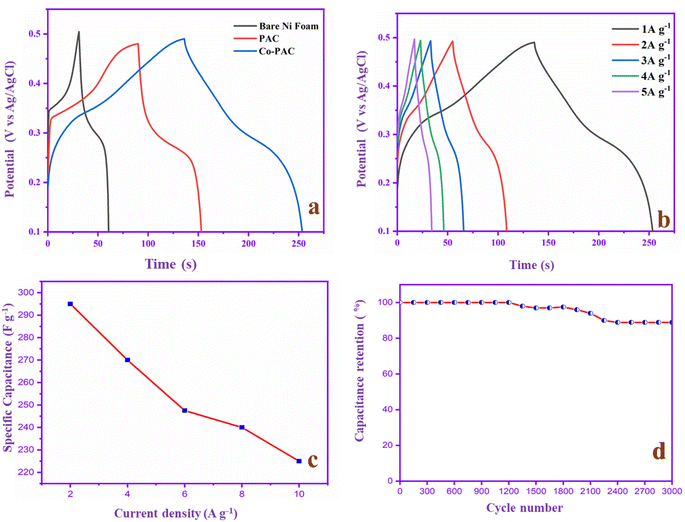 | ||
| Fig. 11 (a) GCD study of bare Ni foam, PAC and Co-PAC at 1 A g−1. (b) GCD at different current densities, (c) specific capacitance value, and (d) cycling stability study of Co-PAC. | ||
| S. no | Peanut shell based composite | Potential window (V) | Electrolyte | Current density | Capacitance | Ref. |
|---|---|---|---|---|---|---|
| 1 | PS-FLG | −0.4–1.1 V | 1 M H2SO4 | 0.5 A g−1 | 186 F g−1 | 52 |
| 2 | ZN-AC-2 | −1–0 V | 1 M Na2SO4 | 0.5 A g−1 | 239.88 F g−1 | 53 |
| 3 | FE/MG-AC-800 | −1–0 V | 1 M Na2SO4 | 1 A g−1 | 247.28 F g−1 | 54 |
| 4 | PSW | −0.9–0 V | 2.5 M KNO3 | 1 A g−1 | 224.30 F g−1 | 55 |
| 5 | NHAC-800 | −1–0 V | 6 M KOH | 0.5 A g−1 | 266.06 F g−1 | 56 |
| 6 | PSC-AC | −0.9–0.1 V | 6 M KOH | 1 A g−1 | 228 F g−1 | 57 |
| 7 | HSAC-Ni | −0.5–0.5 V | 2 M KOH | 1 A g−1 | 242.84 F g−1 | 58 |
| 8 | N-AC | 0–1 V | 6 M KOH | 0.2 A g−1 | 290 F g−1 | 59 |
| 9 | AP-800-imp-5-1.5 | 0–0.8 V | 1 M H2SO4 | 0.4 A g−1 | 289.4 F g−1 | 60 |
| 10 | N-PAC & Co-PAC | −1–0 V & 0.1–0.5 V | 1 M KOH | 2 A g−1 & 1 A g−1 | 302 F g−1 & 295 F g−1 | This work |
3.7. Electrochemical studies-two electrode system (N-PAC//PVA-KOH//Co-PAC)
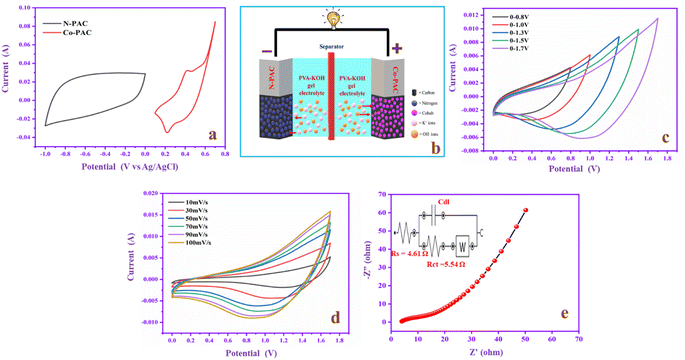
To evaluate the commercial application of the prepared negative and positive electrodes in practical devices, a two-electrode system (N-PAC//PVA-KOH//Co-PAC) was fabricated. The two electrodes involve CV studies in negative and positive voltage windows at 50 mV s−1 in 1 M KOH, as shown in Fig. 12a. The negative and positive electrodes give a rectangular shape for EDLC and redox peak for pseudocapacitance. The dual property reveals that the hybrid SCs device could run at a high potential of up to 1.7 V with the help of the synergetic effect of the two electrodes and the neutral electrolyte behavior. Fig. 12b shows the schematic model diagram of the construction of an asymmetric supercapacitor device (N-PAC//PVA-KOH//Co-PAC). In this device, N-PAC acts as an anode and Co-PAC as a cathode owing to their EDLC and pseudocapacitive nature, respectively. PVA-KOH is used as an electrolyte, which contains potassium (K+) and hydroxide (OH−) ions. During charging, the applied voltage creates the potential difference between the two electrodes, which drives the ion migration in the electrolyte. In this process, N-PAC accumulates the K+ ions and Co-PAC collects the OH− ions with the help of their double layer and surface redox reaction properties. The energy is stored in the N-PAC//PVA-KOH//Co-PAC device, which generates current during the discharge process. The ions then move back to the electrolyte solution. Fig. 12c exhibits the CV patterns of the device with a gradual increment of the voltage from 0.8 to 1.7 V. The CV curve current range is uniformly increased based on the voltage improvement. The CV curve (Fig. 12d) of the device is studied at different scan rates from 10 to 100 mV s−1, in which the CV curve current range is gradually enhanced without deformation of the redox peak, indicating the device has excellent electrochemical performance.61 Moreover, the EIS study helps to evaluate the electrical resistivity of the device as depicted in Fig. 12e. The EIS curve exhibits semicircle portions in the high-frequency region, which denotes the charge transfer resistance (Rct) and the straight line in the low-frequency region indicates the ion diffusion resistance of the device. The EIS plot of the device clearly shows that it is Warburg impedance, which confirms the electrolyte ions are diffusing into the active materials.34 The Rs and Rct values of the device are 4.61 and 5.54 Ω, respectively. This result proves that the device exhibits good conductivity and ion diffusion properties.To optimize the voltage range, the device was subjected to a charge–discharge study in the different potential windows from 0.8 up to 1.7 V at constant current 1 A g−1, as shown in Fig. 13a. From the above analysis, the efficient potential window for the charge–discharge process is found to be 0–1.7 V. All curves are almost triangular, suggesting the device involves a proper charge storage process during charge–discharge. Moreover, different current densities (1 to 5 A g−1) were applied to the device in the 0–1.7 V potential range, which is depicted in Fig. 13b. There is no change in the GCD curve symmetrical shape even with a high current density, which indicates the device has superior electrochemical reversibility and high coulombic efficiency. The Csp of the device is 193, 88, 50, 36, and 26 F g−1 at current densities from 1 to 5 A g−1. Fig. 13c exhibits the Ragone plot, which explains the relationship between energy and power density. The device delivers an energy of 45 W h kg−1 and power 846 W kg−1 at 1 A g−1. Moreover, the energy density still maintained 30 W h kg−1 in the higher current range (5 A g−1). The cyclic stability is one of the crucial factors for SCs in commercial applications. The cyclic stability of the device is investigated and reported in Fig. 13d, and the capacitance retention is 100% after 3000 cycles of the charge–discharging process. The result suggests that the device has good stability and sufficient potential in practical long-term cycle SC applications.
4. Conclusions
The bio-mass-derived porous carbon incorporated with heteroatoms (boron and nitrogen) and cobalt nanoparticles has been successfully prepared using peanut shells as the carbon precursor. A combination of a double-layer capacitance and pseudo-capacitance nature can improve the capacitance value of the electrode materials. The prepared N-PAC and Co-PAC exhibit high specific capacitance values of 302 F g−1 at 2 A g−1 and 295 F g−1 at 1 A g−1, respectively, in three-electrode systems. The Co-PAC electrode was used as a cathode, and the N-PAC electrode was used as an anode to produce the asymmetric supercapacitor device (N-PAC//PVA-KOH//Co-PAC). It exhibits a high energy density of 45 W h kg−1 and power density of 846 W kg−1 at 1 A g−1, and the capacitance retention is 100% after 3000 cycles. The results demonstrated that N-PAC//PVA-KOH//Co-PAC is a feasible and low-cost promising supercapacitor device for real-life applications.Ethical statement
No humans or animals have been used in this research.Data availability
Data for this article, including the results of this study, are available from the corresponding author upon reasonable request.Conflicts of interest
The authors declare no competing financial interest.Acknowledgements
Dr Stalin Thambusamy thank the RUSA Phase 2.0 grant no. F. 24-51/2014-U, Policy (TNMulti-Gen), Dept. of Edn., Govt. of India, Dt.09.10.2018, TNRUSA, Chennai, TAMIL NADU, and ALU, Dt.16.12.2022.References
- F. Ferrè, A. Via, G. Ausiello, B. Brannetti, A. Zanzoni and M. Helmer-Citterich, Int. J. Earth Sci., 2020, 10, 334–345 Search PubMed.
- R. B. Finkelman, A. Wolfe and M. S. Hendryx, Energy Geosci., 2021, 2, 99–112 CrossRef.
- E. Shanmugasundaram, V. Ganesan, V. Narayanan, K. Vellaisamy, R. Rajamohan, Y. R. Lee, S. Kaliyamoorthy and S. Thambusamy, New J. Chem., 2023, 28, 13127–13137 RSC.
- S. Koohi-Fayegh and M. A. Rosen, J. Energy Storage, 2020, 27, 101047 CrossRef.
- T. M. Gür, Energy Environ. Sci., 2018, 11, 2696–2767 RSC.
- Z. M. Riyas, C. Priya, R. Premila, G. Maheshwaran, S. Sudhahar and M. R. Prabhu, J. Energy Storage, 2022, 53, 104988 CrossRef.
- N. Poonam, K. Sharma, A. Arora and S. K. Tripathi, J. Energy Storage, 2019, 21, 801–825 CrossRef.
- A. Borenstein, O. Hanna, R. Attias, S. Luski, T. Brousse and D. Aurbach, J. Mater. Chem. A, 2017, 5, 12653–12672 RSC.
- P. Sharma and T. S. Bhatti, Energy Convers. Manage., 2010, 51, 2901–2912 CrossRef CAS.
- E. Lim, C. Jo and J. Lee, Nanoscale, 2016, 8, 7827–7833 RSC.
- Z. M. Riyas, C. Priya, S. Ponmani and M. R. Prabhu, J. Alloys Compd., 2023, 965, 171350 CrossRef CAS.
- J. Wang, S. Dong, B. Ding, Y. Wang, X. Hao, H. Dou, Y. Xia and X. Zhang, Natl. Sci. Rev., 2017, 4, 71–90 CrossRef CAS.
- A. Shaikh, B. K. Singh, K. Prnendu, P. Kumari, P. R. Sankar, G. Mundra and S. Bohm, RSC Sustainability, 2023, 2, 294–302 RSC.
- M. A. Brown, G. V. Bossa and S. May, Langmuir, 2023, 35, 11550–11565 Search PubMed.
- A. S. Lemine, M. M. Zagho, T. M. Altahtamouni and N. Bensalah, Int. J. Energy Res., 2018, 42, 4284–4300 CrossRef CAS.
- C. Li, X. Zhang, K. Wang, H. T. Zhang, X. Z. Sun and Y. W. Ma, New Carbon Mater., 2015, 30, 1085 CrossRef.
- R. A. Fisher, M. R. Watt and W. Jud Ready, ECS J. Solid State Sci. Technol., 2013, 2, 3170–3177 CrossRef.
- E. Shanmugasundaram, V. Ganesan, V. Narayanan, K. Vellaisamy, N. Saleh and S. Thambusamy, Nanoscale Adv., 2024, 6, 1765–1780 RSC.
- E. Shanmugasundaram, K. Vellaisamy, V. Ganesan, V. Narayanan, N. Saleh and S. Thambusamy, ACS Omega, 2023, 9, 14101–14117 CrossRef PubMed.
- R. Liu, A. Zhou, X. Zhang, J. Mu, H. Che, Y. Wang, T. T. Wang, Z. Zhang and Z. Kou, Chem. Eng. J., 2021, 412, 128611 CrossRef CAS.
- Q. Guo, P. Fan, Y. Zhang, L. Guan, H. Wang, A. Croft and G. Z. Chen, RSC Sustainability, 2024, 2, 101–124 RSC.
- S. Fleischmann, J. B. Mitchell, R. Wang, C. Zhan, D. E. Jiang, V. Presser and V. Augustyn, Chem. Rev., 2020, 120, 6738–6782 CrossRef CAS PubMed.
- M. Sajjad, Y. Khan and W. Lu, J. Energy Storage, 2021, 35, 102336 CrossRef.
- S. Unknown, P. Chand and A. Joshi, J. Energy Storage, 2021, 39, 100885 Search PubMed.
- R. Patil, N. Kumar, B. Matsagar, K. C. W. Wu, R. R. Salunkhe and S. Dutta, RSC Sustainability, 2020, 143, 105848 Search PubMed.
- F. Guo, X. Jiang, X. Li, K. Peng, C. Guo and Z. Rao, J. Mater. Sci.:Mater. Electron., 2019, 30, 914–925 CrossRef CAS.
- X. Zhao, J. Chen and F. Du, J. Food Sci. Technol., 2012, 49, 521–529 CrossRef CAS PubMed.
- H. Wu, R. Chen, H. Du, J. Zhang, L. Shi, Y. Qin, L. Yue and J. Wang, Adsorpt. Sci. Technol., 2019, 37, 1–15 Search PubMed.
- M. Yang, Q. Bai and C. Ding, Colloids Surf., A, 2020, 604, 125276 CrossRef CAS.
- P. Z. Guo, Q. Q. Ji, L. L. Zhang, S. Y. Zhao and X. S. Zhao, Acta Phys.-Chim. Sin., 2011, 27, 836–2840 Search PubMed.
- X. Jiang, F. Guo, X. Jia, S. Liang, K. Peng and L. Qian, Ionics, 2020, 26, 3655–3668 CrossRef CAS.
- Y. Zhan, H. Zhou, F. Guo, B. Tian, S. Du, Y. Dong and L. Qian, J. Energy Storage, 2021, 34, 102180 CrossRef.
- N. F. Sylla, N. M. Ndiaye, B. D. Ngom, B. K. Mutuma, D. Momodu, M. Chaker and N. Manyala, J. Colloid Interface Sci., 2020, 569, 332–345 CrossRef CAS PubMed.
- D. J. Tarimo, K. O. Oyedotun, A. A. Mirghni, N. F. Sylla and N. Manyala, Electrochim. Acta, 2020, 353, 136498 CrossRef CAS.
- X. He, R. Li, J. Han, M. Yu and M. Wu, Mater. Lett., 2013, 94, 158–160 CrossRef CAS.
- Y. Zhan, J. Bai, F. Guo, H. Zhou, R. Shu, Y. Yu and L. Qian, J. Alloys Compd., 2021, 885, 161014 CrossRef CAS.
- R. R. Salunkhe, J. Tang, Y. Kamachi, T. Nakato, J. H. Kim and Y. Yamauchi, ACS Nano, 2015, 9, 6288–6296 CrossRef CAS PubMed.
- L. Cheng, Q. Zhang, M. Xu, Q. Zhai and C. Zhang, J. Colloid Interface Sci., 2021, 583, 299–309 CrossRef CAS PubMed.
- N. T. Nguyen, P. A. Le and V. B. T. Phung, Chem. Eng. Sci., 2021, 229, 116053 CrossRef CAS.
- M. Pang, G. Long, S. Jiang, Y. Ji, W. Han, B. Wang, X. Liu, Y. Xi, D. Wang and F. Xu, Chem. Eng. J., 2015, 280, 377–384 CrossRef CAS.
- C. H. Jadhav, K. B. Pisal, A. R. Chavan, S. M. Patil, P. B. Patil and P. K. Pagare, in Materials Today: Proceedings., 2017, vol. 43, pp. 2742–2746 Search PubMed.
- T. Purkait, G. Singh, M. Singh, D. Kumar and R. S. Dey, Sci. Rep., 2017, 7, 15239 CrossRef.
- H. Sun, Y. Zhu, B. Yang, Y. Wang, Y. Wu and J. Du, J. Mater. Chem. A, 2016, 4, 12088–12097 RSC.
- S. Li, S. Peng, L. Huang, X. Cui, A. M. Al-Enizi and G. Zheng, ACS Appl. Mater. Interfaces, 2016, 8, 20534–20539 CrossRef CAS PubMed.
- S. Sahoo, G. Sahoo, S. M. Jeong and C. S. Rout, J. Energy Storage, 2022, 53, 105212 CrossRef.
- A. Kumar and H. M. Jena, Results Phys., 2016, 6, 651–658 CrossRef.
- Y. Wen, L. Chi, X. Wen, X. Chen and E. Mijowska, Adv. Electron. Mater., 2020, 6, 2000450 CrossRef CAS.
- Z. Xiao, W. Chen, K. Liu, P. Cui and D. Zhan, Int. J. Electrochem. Sci., 2018, 13, 5370–5381 CrossRef CAS.
- X. Wang, Y. Wang, Y. Jiang, X. Li, Y. Liu, H. Xiao, Y. Ma, Y. Yuan Huang and G. Yuan, Adv. Funct. Mater., 2021, 31, 2103210 CrossRef CAS.
- X. Jiang, F. Guo, X. Jia, Y. Zhan, H. Zhou and L. Qian, J. Energy Storage, 2020, 30, 101451 CrossRef.
- L. Pandey, S. Sarkar, A. Arya, A. L. Sharma, A. Panwar, R. K. Kotnala and A. Gaur, Biomass Convers. Biorefin., 2021, 13, 6737–6746 CrossRef.
- T. Purkait, G. Singh, M. Singh, D. Kumar and R. S. Dey, Sci. Rep., 2017, 7, 15239 CrossRef PubMed.
- F. Guo, X. Jiang, X. Li, K. Peng, C. Guo and Z. Rao, J. Mater. Sci.: Mater. Electron., 2019, 30, 914–925 CrossRef CAS.
- F. Guo, X. Jiang, X. Jia, S. Liang, L. Qian and Z. Rao, J. Electroanal. Chem., 2019, 844, 105–115 CrossRef CAS.
- N. F. Sylla, N. M. Ndiaye, B. D. Ngom, D. Momodu, M. J. Madito, B. K. Mutuma and N. Manyala, Sci. Rep., 2019, 9, 13673 CrossRef CAS PubMed.
- X. Jiang, F. Guo, X. Jia, S. Liang, K. Peng and L. Qian, Ionics, 2020, 26, 3655–3668 CrossRef CAS.
- Z. Hu, X. Li, Z. Tu, Y. Wang, O. D. Dacres, Y. Sun, M. Sun and H. Yao, Fuel Process. Technol., 2020, 205, 106430 CrossRef CAS.
- N. T. Nguyen, P. A. Le and V. B. T. Phung, Chem. Eng. Sci., 2021, 229, 116053 CrossRef CAS.
- L. Pandey, S. Sarkar, A. Arya, A. L. Sharma, A. Panwar, R. K. Kotnala and A. Gaur, Biomass Convers. Biorefin., 2023, 13, 6737–6746 CrossRef CAS.
- M. F. Wu, C. H. Hsiao, C. Y. Lee and N. H. Tai, ACS Omega, 2020, 5, 14417–14426 CrossRef CAS PubMed.
- N. Yadav, M. K. Singh, N. Yadav and S. A. Hashmi, J. Power Sources, 2018, 402, 133–146 CrossRef CAS.
| This journal is © The Royal Society of Chemistry 2025 |

