
 Open Access Article
 This Open Access Article is licensed under a
 Creative Commons Attribution 3.0 Unported Licence
Multi-dimensional memory in low-friction granular materials†
Chloe W.
Lindeman

Department of Physics and The James Franck and Enrico Fermi Institutes, The University of Chicago, Chicago, IL 60637, USA. E-mail: cwlindeman@jhu.edu
First published on 30th May 2025
Abstract
To explore what features of multi-dimensional training can be remembered in granular materials, the response of a small, two-dimensional packing of hydrogel spheres to two independent types of shear is measured. Packings are trained via the application of several identical shear cycles, either of a single shear type or combinations of the two types. The memory is then read out using a standard protocol capable of revealing memories as a cusp at the point where readout reaches the training strain. The ability to read out a memory is sensitive not only to the type of deformation applied but also to the order in which different types of training are performed, underscoring the importance of thinking of memories not as single remembered amplitude but as a learned path through phase space. Moreover, while memory capacity (one or multiple) and type of memory (direction, amplitude, duration) have become standard ways of classifying memories, the non-abelian nature of the readout process suggests an additional axis to consider.
Introduction
Despite their complex and disordered nature, granular materials are capable of remembering information about past deformations. On the one hand, their sensitivity to history is not surprising: any system with a plastic component to its response will by definition not return to its initial condition after a perturbation is removed. On the other hand, the lack of an ordered configuration to compare against might suggest difficulty reading out such a memory. Yet clear signatures have been demonstrated experimentally not only for the memory of a direction of driving1,2 but also for the memory of a single shear amplitude3 and of multiple shear amplitudes.4 It was also shown in simulations that the memory of a waveform can be recovered.5The origin of amplitude memory in particular is the subject of a great many studies,6,7 ranging from comparisons of granular systems with toy models4,8–13 to direct molecular dynamics simulations8,14–16 to experiments across a variety of systems.3,4,16–19 It is generally understood that the formation of memory arises from plastic events (particle rearrangements) that occur as the material is strained. Strikingly, these plastic events become more repeatable over time, often reaching a periodic orbit after just a few cycles of driving. Clearly, this transition to a “stroboscopic steady state,” where particles return to the same positions at the end of every cycle, is closely linked to the formation of a memory of driving.
Although a great deal of work has been done to identify,20,21 characterize,22,23 and predict24–26 these rearrangement events, there exist relatively few studies on the effect of the type of driving.17,27–31 Moreover, the experimental studies of this type of granular memory are limited to a handful of realizations. Here I explore the effect of driving an experimental two-dimensional granular material with two distinct shear degrees of freedom: one in which the walls of the bounding box remain perpendicular but the relative lengths change, and one in which the lengths of all four walls remain equal to one another while the angles between the walls change. I adopt the notation of ref. 32 and refer to these as S1 and S2 shear, respectively. (In three dimensions there are five shear degrees of freedom, complicating the picture substantially.)
While the response of a granular system to multiple applied cycles of one type of shear—the ability to remember not just one but two or more shear amplitudes—is already surprising, the effect of training in a higher-dimensional phase space remains untested. In this work, packings of roughly 35 hydrogel spheres like the one shown in Fig. 1 are trained with cycles of shear and the strength of memory is measured directly via a standard sequential readout protocol.4,33,34 Training and readout are accomplished using the custom-built setup shown schematically in Fig. 2(a)–(c), which can apply two independent strain types SA and SB as defined in Fig. 2(d). The results indicate that memories can be easily encoded in this system for one-dimensional driving but that the picture becomes more complicated when a two-dimensional phase space is explored, revealing a dependence on the full history of past deformations.
 | ||
| Fig. 1 Photograph of a two-dimensional packing of hydrogel spheres constrained by acrylic walls. | ||
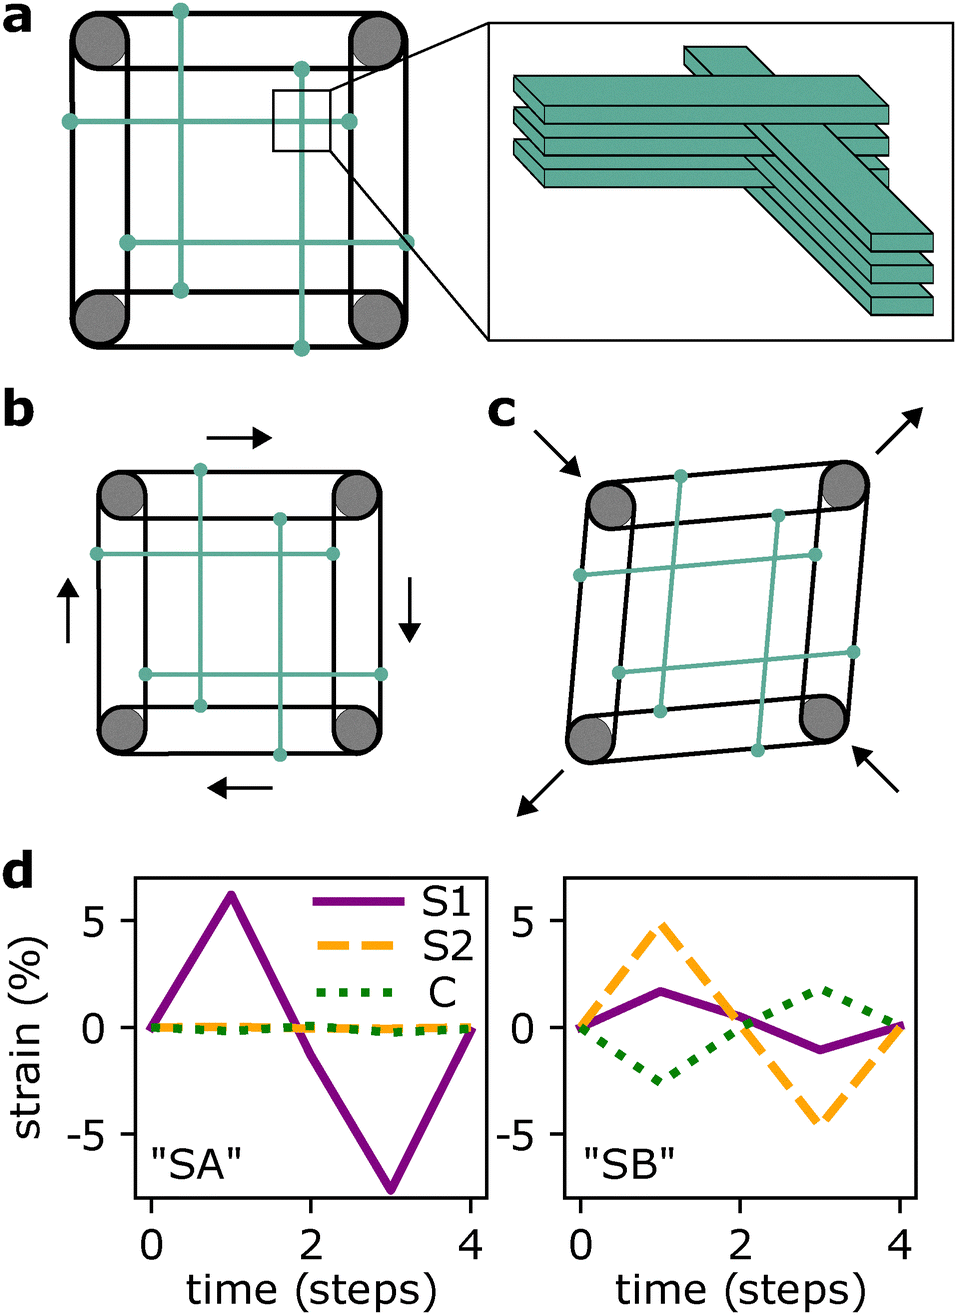 | ||
| Fig. 2 (a) Schematic of shear cell. Cell walls (green) are layered as shown on right, allowing intersecting walls to move through one another. Circles at the corners (grey) are pulleys and black ovals are belts; walls are secured to belts only where dots are shown. Particles are constrained to the inner square region. (b) Shear type SA is applied by rotating the pulleys so that walls move in and out as shown. (c) Shear type SB is applied by moving the whole pulley system as shown. Pulley axles are constrained to move along the diagonals. (d) Definition of shear types SA and SB in terms of S1, S2, and compression C. | ||
The results shown here highlight the effect of specific strain types on a specific experimental realization, but they also add new experimental evidence to bigger question: what features can a disordered, far-from-equilibrium system learn? The ability to encode amplitude memory has been seen in disordered materials from crumpled paper35 to magnetic domains36,37 to jammed packings,8 allowing insight into the statistical behavior of these systems independent of the detailed mechanism. Although certain types of amplitude memory are already known to be non-abelian (depending, for example, on the order of training cycles of different amplitudes38), this manuscript describes a distinct case in which order matters. The results open the door to future studies on the non-commutative capacity of materials with memory and the mechanisms behind their high-dimensional history dependence.
Protocol
A custom setup is designed to enable arbitrary application of S1 and S2. Application of S1, which requires the walls to change length, is accommodated by confining the particles with stacked acrylic slats, interleaved as shown in the inset to Fig. 2(a) so that the walls are capable of passing through one another at their corners. This allows for arbitrary box shape, not even providing the constraint that opposite walls remain parallel. The rest of the apparatus shown in Fig. 2(a) is therefore dedicated to constraining the walls to a parallelogram shape.Though they provide two independent shear types, the driving modes shown in Fig. 3(b) and (c) are not orthogonal. The mode in Fig. 3(b) is is almost exclusively S1 with only small contributions from S2 and compression; this is strain type A or SA. The mode in Fig. 3(c) is primarily S2 and compression; this is defined as strain type B or SB. The exact S1, S2, and compression values for these two strain types are shown in Fig. 2(d) and the mechanism for the couplings between different orthogonal strains in SB is described in Section IA, ESI.† When SA or SB values (γA and γB, respectively) are reported, the magnitude of deformation for each type is taken to be the total shear strain  and is taken to be negative when S2 is negative.
 | ||
| Fig. 3 (a) Training protocol: repeated shear cycles with a fixed shear type (here, SB) and amplitude. (b) Readout protocol: repeated shear cycles beginning with very small amplitude and ramping up. Particle positions are measured at the end of each cycle (dots) and compared with the trained configuration (black star). Dark to light color transition shows progression of steps, redundant here but consistent with phase-space pictures in which time is not explicitly shown. (c) Readout after the training shown in (b). Signal exhibits characteristic cusp (change in slope) at the training strain; data shown is an average of five replicates. | ||
In general, experiments are composed of two parts: training, in which five cycles of the same amplitude and type are applied, and readout, in which five cycles of increasing amplitude are applied. Protocols for training and readout are depicted in Fig. 3(a) and (b), respectively. During readout, particle positions are measured so that an effective distance Δmin can be calculated between any two configurations as described in the Methods section. This distance Δmin is computed at the end of each cycle relative to the trained configuration measured at the beginning of the readout process (the trained configuration is shown schematically as a star in Fig. 3(b)). Values of Δmin thus provide a stroboscopic, or once-per-cycle, measure of the distance between the trained configuration and the configuration during readout, a quantity shown in both experimental and computational works to highlight a memory via a sudden increase in slope just after the training strain.
For the two-dimensional phase space of both S1 and S2 (or SA and SB), the number of possible ways of training and reading out increases substantially. Rather than showing the training and readout as a function of time for both SA and SB, it is convenient to represent them as a path through the two-dimensional phase space illustrated in Fig. 4(a). To provide some intuition for this space, Fig. 4(b) and (c) show the same training and readout described in Fig. 3(a) and (b), keeping the convention that training cycles are shown in black and readout is shown in color with a transition from dark to light over the course of readout.
 | ||
Fig. 4 (a) Phase space of possible box shapes. The horizontal axis corresponds to strain of type S2 and the vertical axis corresponds to strain of type S1. The origin represents the original box shape, the total magnitude of strain is given by the distance from the origin  , and the polar angle describes the type of deformation applied. (b) Measured box shape in phase space during the same SB training shown in Fig. 3(a). (c) Measured box shape during the same SB readout shown in Fig. 3(b). In (c), color indicates early (dark blue) and late (light yellow) readout steps. Because the system traces back over the same box shapes several times, not all readout cycles are visible; dots have been added at the turning points to highlight the increasing cycle size shown explicitly in Fig. 3(c). , and the polar angle describes the type of deformation applied. (b) Measured box shape in phase space during the same SB training shown in Fig. 3(a). (c) Measured box shape during the same SB readout shown in Fig. 3(b). In (c), color indicates early (dark blue) and late (light yellow) readout steps. Because the system traces back over the same box shapes several times, not all readout cycles are visible; dots have been added at the turning points to highlight the increasing cycle size shown explicitly in Fig. 3(c). | ||
Results
When training and readout are performed along the same axis, the system exhibits a characteristic cusp in readout at the training amplitude as shown in Fig. 3(c) for SB. This cusp is a clear signature of a stored memory and is consistent both with other experimental realizations as well as with simulation results.4,8,16 A similar memory can be shown for different training amplitudes; for an untrained packing, readout produces no such cusp. Examples of both, as well as similar plots for packings trained and read out with SA, are provided in the Fig. S3, ESI.†![[thin space (1/6-em)]](https://www.rsc.org/images/entities/char_2009.gif) 39
39
To explore combinations of both shear degrees of freedom, the scenario shown in Fig. 3 is first modified only slightly, with training performed along SA and readout performed along SB as shown in Fig. 5(a) and (b). Fig. 5(c) shows the readout in this case: a curve that increases monotonically with no clear cusp. Perhaps unsurprisingly, the memory of an amplitude also contains information about the direction in which training was applied, so that although a memory has formed it may not be evident in orthogonal readout performed along a different direction.
 | ||
| Fig. 5 Phase space diagrams of (a) training, performed with SA, and (b) readout, performed with SB. (c) The corresponding Δmin curve during readout, with no clear cusp at the training amplitude. | ||
Second, two cases with different training but identical readout are compared. In Fig. 6(a), cycles of SA and SB are mixed during training so that the path traced out in phase space encloses some area and the system does not return to its original (square box) configuration until the end of a full training cycle. Readout is commensurate, with cycles of the same type but starting with a small amplitude and increasing. Fig. 6(b) shows a variant in which training is performed as a series of alternating cycles of type SA and SB; readout is as before. Hence the only difference between these two cases is the order in which training deformations are applied. The readout curves for both protocols are shown in Fig. 6(c). When training and readout are of the same type (solid points), a cusp appears at the training strain as in Fig. 3(c). Although one full cycle each of SA and SB are still applied over the course of a single “alternating” training cycle, the readout curve contains no signature of memory. This shows that the order in which deformations are applied matters.
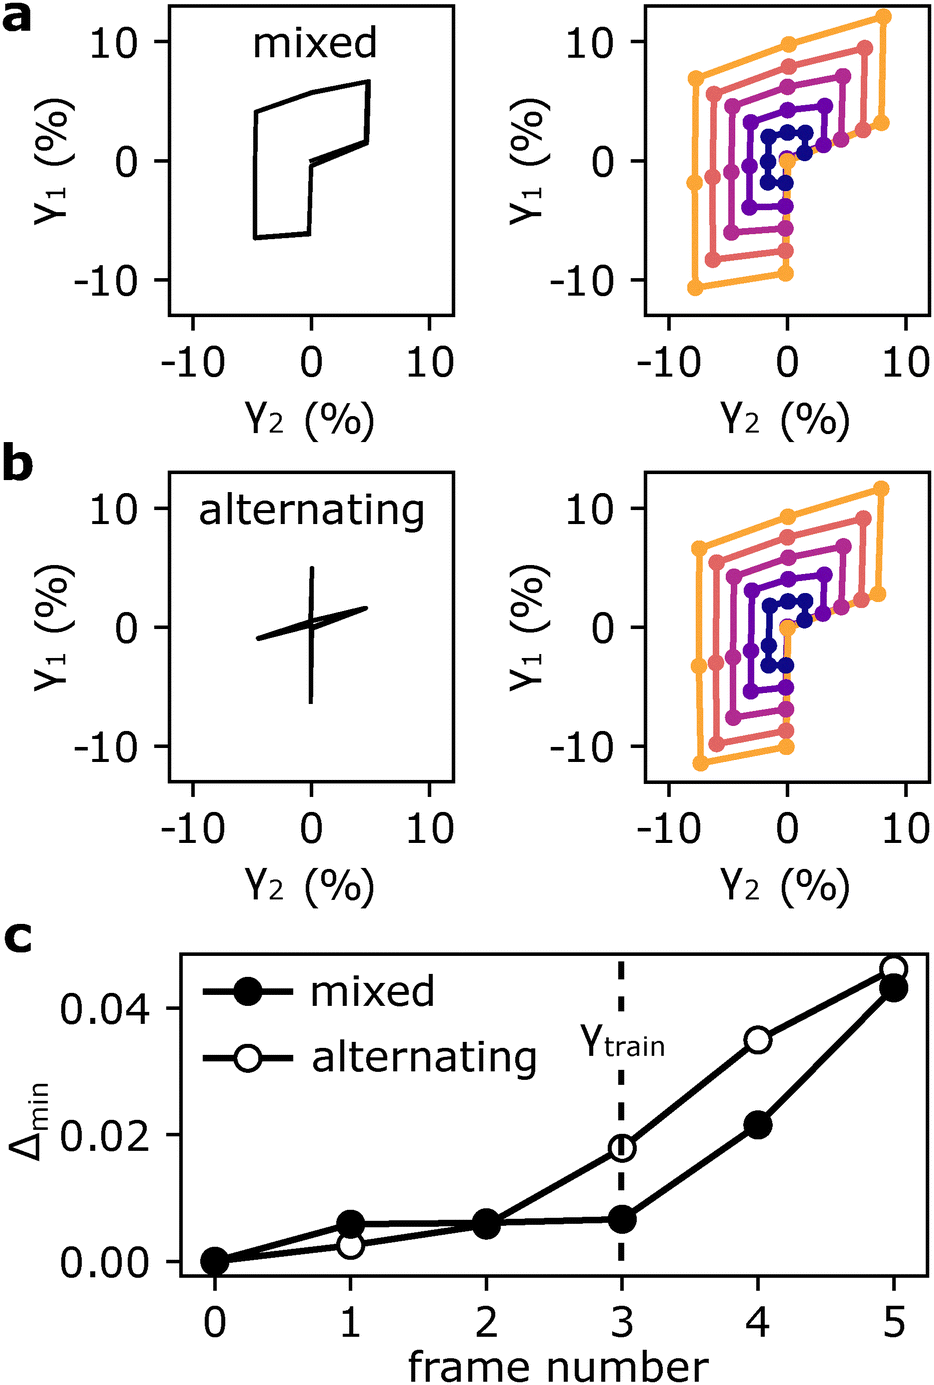 | ||
| Fig. 6 Phase space diagrams of the training (black) and readout (colorful) protocols used in each case. (a) Training and readout of of the same type, with mixed cycles of SA and SB. (b) Training modified by changing the order of deformations to be alternating cycles of SA and SB. (c) Δmin during readout for both (a) and (b); results are an average of five to seven replicates. | ||
Box effects
Because of friction and hysteresis in the mechanism that applies shear, the box itself does not come back to exactly the same shape after each cycle. In particular, the box itself appears to be trainable: after training, it returns to its original shape (γ1 = γ2 = 0) most closely at the point when the readout amplitude equals the training amplitude, as shown in Fig. 7. This is highlighted by showing only stroboscopic measurements, or measurements taken just once per cycle, as in Fig. 7(b). At each stroboscopic point, the box shape is nominally its original shape, yet these measurements reveal a small residual strain (∼50 times smaller than the applied training cycles). Residual stroboscopic γ2 shows no particular form, yet γ1 returns closest to its original value when the readout amplitude reaches the training amplitude. This is seen more clearly when the absolute value of γ1 is plotted, revealing a minimum at the training amplitude; such a plot is included in the Fig. S4, ESI.† | ||
| Fig. 7 Measured strain values (a) throughout readout with applied shear type SB (from the experiments reported in the main text Fig. 3(c)). (b) Same data as in (a), but only the stroboscopic values included (note the different y-axis scale: γ1 and γ2 vary only on the order of 0.1%). The strain γ1 in particular returns closest to its initial strain value at the training amplitude. | ||
Because this box memory takes on a form similar to that of the particle memory shown in Fig. 3 and 6, one can ask whether the apparent particle memory is actually due to the box memory. It is unclear how to estimate the relative strengths of the two effects, making a quantitative analysis difficult, yet there are cases where box memory disappears and the corresponding particle memory remains; this occurs in particular when training and readout are performed using shear type SA, as shown in the Fig. S4, ESI.† While the box memory may account for some of the memory seen during readout, evidently much of the memory is also encoded in the particle configurations.
Conclusions
In most simulations, particles are taken to be perfect disks or spheres so that the only degrees of freedom in which memory can be stored are the particle positions. In the experiments reported here, there exist a number of additional degrees of freedom per particle, both macroscopic (as in the out-of-plane rotations of individual hydrogel spheres) and microscopic (frictional contacts and sliding). Despite these apparently substantial differences, as well as the small scale of these experiments, the memories formed when a single shear direction is tested (as in Fig. 3(c)) are consistent with memories observed in simulations.The additional presence of memory in the box shape highlights the pervasiveness of history dependence in a much wider range of physical systems, raising the question of what features lead to a system that is not trainable. Even systems with substantial friction, which might be expected to degrade a memory, have been shown both experimentally and in simulation to exhibit trainability,5,16 albeit with additional complexity due to particle rotations. In microscopically jammed systems, thermal fluctuations become relevant—yet shear amplitude can still be learned.19 Taken together, this paints an extraordinarily robust picture of amplitude memory in jammed materials.
Though the effect of driving timescale on memory is outside the scope of this work, the system studied here includes several features of interest in terms of dynamics. Hydrogel spheres are relatively low-friction particles compared with, for example, rough spheres or disks. However, detailed work has shown that hydrogels exhibit complex time-dependent frictional interactions even with smooth surfaces, with relaxation occurring on minutes or even hours-long timescales.40 Combined with an easily modified actuation speed, this makes it possible to explore the interplay between inherent relaxation timescales and driving frequency. In particular, it would be interesting to see an experimental study of how this affects trainability, a question so far primarily considered in model systems.41
Given that the particles are open to air, the particle radii will shrink over hours- or days-long timescales as water evaporates. With a clever experimental design, it may be possible to exhibit some control over these radii, for example by restoring enough fluid to conserve the total volume over time. If these radii change preferentially depending on (for example) local pressure or exposed surface area, they may become additional degrees of freedom, a feature which can allow for the formation of extremely stable configurations.42
The focus of this work has been on the response of the system during readout with a fixed training time (five cycles). However, there is also the question of training: how long does it take to train in steady-state behavior as a function of the complexity of the cycle? Can more complex memories be trained in, for example different shear amplitudes in S1 and S2 or even adding compression as an independent axis? Do new kinds of limit cycles emerge, as was shown in a simple model system under periodic, two-dimensional driving?43
In the hydrogel system described here, using nearly orthogonal shear directions, readout must be matched to the training performed to see a signature of training. Yet this may not be the case in every system and with every type of training. Certainly, one would expect a material to distinguish less clearly between two similar strain types that are independent yet similar (for example, γA = S1 and γB = S1 + δS2 with δ ≪ 1). It is also worth asking what features of the system reported here allow it to distinguish different shear directions—attractive interactions between particles, for example, may change the response so that the system is less discriminating of strain direction as was reported for a colloidal gel.17
Even a single shear degree of freedom offers a large space of possible driving in the sense that training can be done at any amplitude, or for multiple amplitudes in different orders. In this case, the question is often one of the memory capacity of a system.34 A single readout protocol is expected to reveal all of the stored memories. Here, the data show that when training can be performed along more than one axis, the choice of readout protocol becomes a crucial one. In particular, it becomes important to distinguish between forming a memory (as evidenced, for example, by the arrival at a steady state during driving) and observing that memory through a particular choice of readout protocol. Most readout protocols are destructive: the act of reading out a memory erases it because the large-amplitude cycles wipe out most information about the previous training.38,44 Further experimental and theoretical studies are necessary to determine whether there exist more general protocols capable of revealing the memory of a full path through phase space.
Methods
Hydrogel spheres (Crystal Accents Deco Beads from JRM Chemical, Inc.), swelled for at least 12 hours with tap water, are used as particles. Packings of hydrogels are sheared by a custom-built setup, shown in detail in the Fig. S1, ESI,†39 that allows SA and SB to be independently controlled using two feedback rod linear actuators (Firgelli Automations FA-PO-35-12-2), two motor drivers (Hiletego BTS7960 43A), and an Arduino Uno.
Before each experiment, between 34 and 37 particles are loaded into the shear cell by hand, with an effort made to ensure some polydispersity to suppress crystallization. The number of particles is in a range intended to keep the system jammed throughout the shear cycle but avoid three-dimensional buckling (escape to the third dimension). Experiments with buckling events are not excluded as long as bucklers come back into the plane at the end of each cycle.
Particles are imaged throughout the shear cycle using a Nikon D90 and the resulting videos are analyzed in ImageJ. This allows for simultaneous tracking of the boundary conditions and the particle positions as detailed below.
Boundary conditions
Any bounding parallelogram can be defined by two vectors![[a with combining right harpoon above (vector)]](https://www.rsc.org/images/entities/i_char_0061_20d1.gif) and
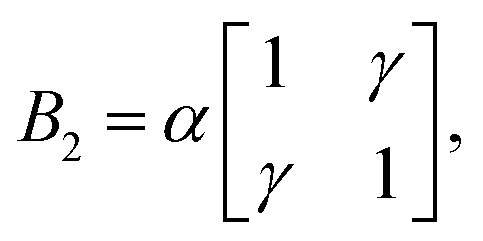
and ![[b with combining right harpoon above (vector)]](https://www.rsc.org/images/entities/i_char_0062_20d1.gif) , which can be put into a matrix B = [ ]. In this notation, for example, B corresponding to shear type S2 is given by
, which can be put into a matrix B = [ ]. In this notation, for example, B corresponding to shear type S2 is given bywhere α = (1 − γ2)−1/2 enforces constant area. The direction of extension (in this case, along the horizontal) can be rotated by an angle θ by applying the rotation matrix R(θ):

In the case that θ = π/4, this becomes exactly
 sin2θ and γ2 = γ
![[thin space (1/6-em)]](https://www.rsc.org/images/entities/i_char_2009.gif) cos2θ, respectively. Any box deformation is then describable as a linear combination of S1 and S2, with total strain given by
cos2θ, respectively. Any box deformation is then describable as a linear combination of S1 and S2, with total strain given by  and type of strain given by the signs and relative magnitudes of γ1 and γ2. This equivalence is shown schematically in Fig. 4(a).
Tracking
Boundaries of the shear cell are marked with red and blue dots (on the top/bottom and left/right walls, respectively). Dots are fit to ellipses using the built-in ImageJ “analyze particles” function and the ellipse centroid positions are fit to a parallelogram in python. This parallelogram provides full information about the amplitudes of S1 and S2 as well as any compression relative to the initial frame of a given experiment.To extract the particle positions, the image is thresholded and a watershed algorithm applied, followed by two iterations of “erosion” (removing the outer layer of each particle) to separate out individual particles. Particles are again fit to ellipses with ImageJ's built-in “analyze particles” function and the positions of each ellipse's center are exported for analysis in python.
Analysis
Particles are linked from frame to frame using a simple distance limit, linking any given particle in frame i to the nearest particle in frame i + 1 to get a per-particle distance δmin. The “distance” between configurations Δmin is then given by the average of this minimum change in position:
In the case that particles do not travel farther than the typical radius from one cycle to the next, this corresponds to exactly the average particle displacement; if particles move much farther than one radius this measure becomes a lower bound on the actual distance travelled (typically still quite large as particles are unlikely to exactly swap positions). Particles are linked from frame-to-frame with nearly 100% fidelity, allowing for the calculation of system-wide displacement and hence the Δmin values reported in Fig. 3, 5 and 6.
To mitigate small changes in boundary conditions from cycle to cycle, positions are mapped from pixel space into a 1 × 1 box using the inverse of the boundary conditions B as described below. The mean particle motion is subtracted before Δmin is calculated.
Given the best-fit box shape Bfit, arbitrary coordinates (x,y) in a square box transform via affine deformation to their corresponding coordinates (x′,y′) in a sheared box as

It follows that affine motion can be removed from measured particle positions (xm,ym) by instead using the position mapped back into a one-by-one square box

For a generic parallelogram boundary condition, B can be written in the “cartesian” strain coordinates γ1 and γ2 as


Because only changes in strain are relevant, reported values of γ1 and γ2 are relative to the first frame of the experiment (for training) or the first frame of readout (for readout). Additionally, rotations of the entire system are irrelevant; the fitted parallelogram Bfit is rotated so that it is symmetric (to match the form of B given above) before fitting for γ1, γ2, and γc.
Data availability
Data for this article, including measured strain values and distance Δmin from trained configuration during readout, is available at https://zenodo.org/doi/10.5281/zenodo.12788664.Conflicts of interest
There are no conflicts to declare.Acknowledgements
I thank Samar Alqatari, Severine Atis, Justin Burton, Savannah Gowen, Varda Hagh, Nathan Keim, Zhaoning Liu, Ayanna Matthews, Nidhi Pashine, Baudouin Saintyves, and Khá-Î Tô. Sidney Nagel in particular was central not only to the development of ideas presented here but to my own development as a scientist. This work was supported by the NSF MRSEC program NSF-DMR 2011854. C. W. L. was supported in part by NSF Graduate Research Fellowship Grant DGE-1746045.Notes and references
- M. Toiya, J. Stambaugh and W. Losert, Phys. Rev. Lett., 2004, 93, 088001 CrossRef PubMed.
- F. Gadala-Maria and A. Acrivos, J. Rheol., 1980, 24, 799–814 CrossRef CAS.
- S. Mukherji, N. Kandula, A. Sood and R. Ganapathy, Phys. Rev. Lett., 2019, 122, 158001 CrossRef CAS PubMed.
- N. C. Keim, J. Hass, B. Kroger and D. Wieker, Phys. Rev. Res., 2020, 2, 012004 CrossRef CAS.
- D. Candela, Phys. Rev. Lett., 2023, 130, 268202 CrossRef CAS PubMed.
- N. C. Keim, J. D. Paulsen, Z. Zeravcic, S. Sastry and S. R. Nagel, Rev. Mod. Phys., 2019, 91, 035002 CrossRef CAS.
- J. D. Paulsen and N. C. Keim, Annu. Rev. Condens. Matter Phys., 2025, 16, 61–81 CrossRef.
- D. Fiocco, G. Foffi and S. Sastry, Phys. Rev. Lett., 2014, 112, 025702 CrossRef PubMed.
- M. Mungan and T. A. Witten, Phys. Rev. E, 2019, 99, 052132 CrossRef CAS PubMed.
- N. C. Keim and J. D. Paulsen, Sci. Adv., 2021, 7, eabg7685 CrossRef PubMed.
- A. Szulc, M. Mungan and I. Regev, J. Chem. Phys., 2022, 156, 16 CrossRef PubMed.
- D. Kumar, S. Patinet, C. E. Maloney, I. Regev, D. Vandembroucq and M. Mungan, J. Chem. Phys., 2022, 157, 17 CrossRef.
- A. Movsheva and T. A. Witten, Eur. Phys. J. E:Soft Matter Biol. Phys., 2023, 46, 84 CrossRef CAS.
- J. R. Royer and P. M. Chaikin, Proc. Natl. Acad. Sci. U. S. A., 2015, 112, 49–53 CrossRef CAS PubMed.
- M. Mungan, S. Sastry, K. Dahmen and I. Regev, Phys. Rev. Lett., 2019, 123, 178002 CrossRef CAS PubMed.
- Z. A. Benson, A. Peshkov, D. C. Richardson and W. Losert, Phys. Rev. E, 2021, 103, 062906 CrossRef CAS.
- E. M. Schwen, M. Ramaswamy, C.-M. Cheng, L. Jan and I. Cohen, Soft Matter, 2020, 16, 3746–3752 RSC.
- K. Galloway, E. Teich, X. Ma, C. Kammer, I. Graham, N. Keim, C. Reina, D. Jerolmack, A. Yodh and P. Arratia, Nat. Phys., 2022, 18, 565–570 Search PubMed.
- Y. Chen, S. A. Rogers, S. Narayanan, J. L. Harden and R. L. Leheny, Phys. Rev. Mater., 2025, 9, 025601 Search PubMed.
- P. Morse, S. Wijtmans, M. Van Deen, M. Van Hecke and M. L. Manning, Phys. Rev. Res., 2020, 2, 023179 Search PubMed.
- C. W. Lindeman and S. R. Nagel, arXiv, 2024, preprint, arXiv:2403.01679 DOI:10.48550/arXiv.2403.01679.
- N. Xu, A. J. Liu and S. R. Nagel, Phys. Rev. Lett., 2017, 119, 215502 CrossRef.
- D. Xu, S. Zhang, A. J. Liu, S. R. Nagel and N. Xu, Proc. Natl. Acad. Sci. U. S. A., 2023, 120, e2304974120 CrossRef CAS PubMed.
- D. Richard, M. Ozawa, S. Patinet, E. Stanifer, B. Shang, S. Ridout, B. Xu, G. Zhang, P. Morse and J.-L. Barrat, et al. , Phys. Rev. Mater., 2020, 4, 113609 CrossRef CAS.
- M. L. Manning and A. J. Liu, Phys. Rev. Lett., 2011, 107, 108302 CrossRef CAS PubMed.
- E. D. Cubuk, S. S. Schoenholz, J. M. Rieser, B. D. Malone, J. Rottler, D. J. Durian, E. Kaxiras and A. J. Liu, Phys. Rev. Lett., 2015, 114, 108001 CrossRef CAS PubMed.
- O. Gendelman, P. K. Jaiswal, I. Procaccia, B. S. Gupta and J. Zylberg, Europhys. Lett., 2015, 109, 16002 CrossRef.
- S. Patinet, D. Vandembroucq and M. L. Falk, Phys. Rev. Lett., 2016, 117, 045501 CrossRef.
- A. Barbot, M. Lerbinger, A. Hernandez-Garcia, R. Garca-Garca, M. L. Falk, D. Vandembroucq and S. Patinet, Phys. Rev. E, 2018, 97, 033001 CrossRef CAS.
- B. Xu, M. L. Falk, S. Patinet and P. Guan, Phys. Rev. Mater., 2021, 5, 025603 CrossRef CAS.
- M. Adhikari, R. Sharma and S. Karmakar, Phys. Rev. Lett., 2025, 134, 018202 CrossRef CAS.
- C. Scheibner, A. Souslov, D. Banerjee, P. Surówka, W. T. Irvine and V. Vitelli, Nat. Phys., 2020, 16, 475–480 Search PubMed.
- M. Adhikari and S. Sastry, Eur. Phys. J. E:Soft Matter Biol. Phys., 2018, 41, 1–17 Search PubMed.
- N. C. Keim and D. Medina, Sci. Adv., 2022, 8, eabo1614 Search PubMed.
- D. Shohat, D. Hexner and Y. Lahini, Proc. Natl. Acad. Sci. U. S. A., 2022, 119, e2200028119 CrossRef CAS.
- J. A. Barker, D. Schreiber, B. Huth and D. H. Everett, Proc. R. Soc. London, Ser. A, 1983, 386, 251–261 CAS.
- D. C. Jiles and D. L. Atherton, J. Appl. Phys., 1984, 55, 2115–2120 CrossRef CAS.
- C. W. Lindeman, T. R. Jalowiec and N. C. Keim, Sci. Adv., 2025, 11, eadr5933 CrossRef PubMed.
- See ESI† at [URL] for details of the experimental setup and coupling between shear types, results of readout under different training conditions, and evidence of a box-shape memory effect.
- N. L. Cuccia, S. Pothineni, B. Wu, J. Méndez Harper and J. C. Burton, Proc. Natl. Acad. Sci. U. S. A., 2020, 117, 11247–11256 CrossRef CAS.
- C. W. Lindeman, V. F. Hagh, C. I. Ip and S. R. Nagel, Phys. Rev. Lett., 2023, 130, 197201 CrossRef CAS PubMed.
- V. F. Hagh, S. R. Nagel, A. J. Liu, M. L. Manning and E. I. Corwin, Proc. Natl. Acad. Sci. U. S. A., 2022, 119, e2117622119 CrossRef CAS PubMed.
- D. Hexner and D. Levine, Europhys. Lett., 2015, 109, 30004 CrossRef CAS.
- C. W. Lindeman and S. R. Nagel, Sci. Adv., 2021, 7, eabg7133 CrossRef PubMed.
Footnote |
| † Electronic supplementary information (ESI) available. See DOI: https://doi.org/10.1039/d5sm00470e |
| This journal is © The Royal Society of Chemistry 2025 |