
Tuning evaporation driven deposition in sessile drops via electrostatic hetero-aggregation†
Sankar
Hariharan
 ,
Md
Fariduddin
,
Salil S.
Vaidya
,
Sumesh P.
Thampi
* and
Madivala G.
Basavaraj
*
,
Md
Fariduddin
,
Salil S.
Vaidya
,
Sumesh P.
Thampi
* and
Madivala G.
Basavaraj
*
Polymer Engineering and Colloid Science (PECS) Lab, Department of Chemical Engineering, Indian Institute of Technology Madras, Chennai 600036, Tamil Nadu, India. E-mail: sumesh@iitm.ac.in; basa@iitm.ac.in
First published on 26th May 2025
Abstract
The desiccation of microliter drops containing colloidal particles often results in the coffee-ring effect, where non-volatile particles deposit at the drop periphery. Such deposits form primarily due to a radially outward flow generated within the drop during the drying process. In this work, we consider drying drops containing mixtures of oppositely charged species as a universal method to tune the morphology of dried deposits, including a complete suppression of the coffee-ring effect. We show how a variety of dried deposit patterns can be engineered by manipulating the mixing fraction (ωf) – the ratio of the mass of positively charged species to the total particle mass of the dispersed phase, and the total concentration of particles in the drop (CT). Using video microscopy, electrophoretic measurements, particle tracking microrheology, and bulk rheology, we elucidate how the interplay between sedimentation, capillary flow, and gelation in the evaporating colloidal drop governs the drying patterns formed in the systems containing oppositely charged species. The fundamental insights gained through this study were further applied to achieve uniform deposition of micronutrients on the surface of leaves for efficient surface deposition.
1 Introduction
When a drop of colloidal dispersion dries on a solid surface, the dispersed particles generally accumulate along the three-phase contact line, forming a ring commonly referred to as the coffee ring.1 This phenomenon occurs as a result of the radial flow of the solvent directed from the centre to the edge of the drop and this flow transports the dispersed particles to the periphery. Drying of drops containing particles, polymers, surfactants, and biological matter, such as bacteria, blood, etc., has been an area of intense research for several years.2–4 The analysis of the patterns resulting from drying drops has found significant applications in both industrial and medical fields.5–7There is an increasing interest in developing effective strategies to control the distribution of dispersed species in the dried deposits. Various approaches have been extensively studied to tailor evaporation-driven patterns, including the use of surface acoustic waves,8 electric fields,9 magnetic fields,10 and manipulation of interactions between the dispersed material, solvent, and substrate.11,12 Drying of drops on a hydrophobic substrate leads to uniform deposition of particles due to flocculation of larger particles and gravity settling of the flocs.13 Additionally, Marangoni flows14 arising due to the incorporation of additives, such as surfactants,15 and hydrosoluble polymers16 or due to thermal effects17,18 also alter the deposition patterns. To this end, drying of colloidal dispersion drops on substrates inclined at different angles has also been explored.19–21 These strategies have produced diverse patterns in the dried drop, such as deposits with a uniform distribution of dispersed species, asymmetric coffee rings, and enhanced central deposition,22 to name a few. Such patterns hold significant potential for applications in coatings, material science, and nanofabrication technologies.23
Research on colloidal dispersions having different types of dispersed particles has also gained attention. For example, in the context of particle sorting and size-based separation,24,25 it is established that the smaller particles are transported closer to the drop edge compared to the larger ones leading to size-based segregation. The drying of drops containing gold nanospheres and nanorods has been shown to result in the formation of distinct phases: a smectic phase characterized by the side-by-side assembly of nanorods and a close-packed assembly of nanospheres.26 These studies have primarily focused on the drying of drops containing charge or sterically stabilized binary/ternary systems.
In this article, we consider evaporation of sessile drops containing oppositely charged particle–particle, particle–polyelectrolyte and polyelectrolyte–polyelectrolyte binary mixtures. Although binary dispersions of oppositely charged particles (OCPs) have been extensively studied in the bulk27–31 and have been utilized in the preparation of Pickering emulsions32 and in the making of porous materials,33,34 there are no studies of sessile drop evaporation-driven pattern formation in these systems. In general, the stability of colloidal dispersions containing OCPs depends on charge ratio, number ratio, size ratio, and concentration of the dispersed species. Therefore, these parameters are expected to influence the deposition of oppositely charged species in the dried patterns. Here, we vary the mixing fraction (ωf), defined as the ratio of the mass of positively charged species to the total mass of particles and the initial concentration of the dispersed material (CT), to modulate the evaporative patterns. With the help of static and dynamic light scattering experiments, optical microscopy, rheology, and particle tracking, we elaborate on the interplay between various physical phenomena, such as sedimentation, gelation, and capillary flow, on the formation of the different types of dried patterns. Using a large number of oppositely charged binary mixtures, we have demonstrated a general strategy to tailor the deposit patterns resulting from sessile drop evaporation. This work offers a robust method for controlling the distribution of particles in the dried patterns, which can have implications in applications such as medical diagnostics, efficient delivery of agricultural formulations, and industrial processes requiring precise particle deposition.
2 Materials and methods
2.1 Materials
The positively charged species used in this study include – surfactant-free amidine-functionalized polystyrene latex beads of 190 nm diameter – PS+ (Merck India), mono-dispersed alumina-coated silica particles of 15 nm diameter – CL+ (Ludox CL-30, Merck India), and poly allylamine hydrochloride – PAH+ (Mw = 50![[thin space (1/6-em)]](https://www.rsc.org/images/entities/char_2009.gif) 000 g mol−1, Merck India). Surfactant-free sulfate-functionalized polystyrene latex beads of 210 nm diameter – PS− (Merck India), mono-dispersed silica particles of 15 nm diameter – HS− (Ludox HS-30, Merck India), and poly sodium 4-styrene sulfonate – PSS− (Mw = 70000 g mol−1, Merck India) were the negatively charged particles. In addition to this, amidine-functionalized, monodispersed polystyrene particles 1 μm PS+ (Merck, India) having zeta potential, ζ = +58.4 ± 2.4 mV and amine-functionalized monodispersed fluorescent polystyrene particles 1 μm PS− (Merck, India) with ζ = −86.4 ± 4.2 mV were used for fluorescence microscopy. In addition, uncharged polystyrene fluospheres of 1 μm diameter (F13083, Thermofisher Scientific, USA) were used as tracers for particle tracking microrheology.
000 g mol−1, Merck India). Surfactant-free sulfate-functionalized polystyrene latex beads of 210 nm diameter – PS− (Merck India), mono-dispersed silica particles of 15 nm diameter – HS− (Ludox HS-30, Merck India), and poly sodium 4-styrene sulfonate – PSS− (Mw = 70000 g mol−1, Merck India) were the negatively charged particles. In addition to this, amidine-functionalized, monodispersed polystyrene particles 1 μm PS+ (Merck, India) having zeta potential, ζ = +58.4 ± 2.4 mV and amine-functionalized monodispersed fluorescent polystyrene particles 1 μm PS− (Merck, India) with ζ = −86.4 ± 4.2 mV were used for fluorescence microscopy. In addition, uncharged polystyrene fluospheres of 1 μm diameter (F13083, Thermofisher Scientific, USA) were used as tracers for particle tracking microrheology.
2.2 Sample preparation
The drop drying experiments were performed by considering five oppositely-charged binary systems: (i) PS+–PS− (ii) CL+–HS− (iii) CL+–PSS− (iv) PAH+–HS−, and (v) PAH+–PSS−. Additionally, the system containing 1 μm PS+–PS− was used for fluorescence microscopy. Prior to the preparation of binary mixtures, the parent dispersions were diluted with deionized doubly distilled water (resistivity ≈ 18 MΩ cm) to obtain dispersions of desired particle concentration. The experiments were conducted by fixing the total concentration of dispersed species in the binary mixtures, CT, at 0.01 w/v%, 0.1 w/v%, and 1 w/v%, while the mixing fraction was varied from 0 to 1. For example, to prepare 200 μL of PS+–PS− binary mixture at CT = 1 w/v%, and ωf = 0.25, 50 μL of 1% aqueous PS+ dispersion and 150 μL of 1% aqueous PS− dispersion were taken in a 0.5 mL micro-centrifuge tube and vortex mixed (Remi CM-101 PLUS Cyclomixer) at 2500 rpm for 10 seconds. A similar procedure was used to make 200 μL of oppositely charged species at other mixing fractions and concentrations. All concentrations are expressed in weight by volume percentage (w/v%) unless mentioned otherwise.2.3 Drying experiments
The microscopy glass slides (75 × 25 × 1 mm, Riviera) cut into smaller pieces of 25 × 25 × 1 mm dimension were used as solid substrates for the drying drop experiments. The glass slides were thoroughly cleaned and immersed in piranha solution, prepared by mixing sulphuric acid and hydrogen peroxide (Merck India) in a 3:1 volume ratio until further use. Piranha solution is highly corrosive and reactive, posing serious hazards due to potentially violent exothermic reactions and the release of toxic fumes; it must be handled under a fume hood with appropriate personal protective equipment. Before the start of each experiment, these glass slides were washed with double distilled water to remove impurities, if any, followed by rinsing with ethanol and, finally, cleaned with compressed dry N2 gas. This procedure ensured that the glass substrate was homogeneously clean and hydrophilic. The binary dispersion of 1 μL volume was cast onto a cleaned glass substrate and allowed to evaporate at a temperature of 25 ± 1 °C and a relative humidity of 60 ± 2%. During the course of drying, the temperature and humidity were monitored and measured using a hygrometer (HTC-1, Humidity Thermometer, India). Each drying experiment was repeated at least thrice.
The patterns formed after the complete evaporation of the solvent from the sessile drop of PS+–PS−, CL+–HS−, CL+–PSS−, PAH+–HS−, and PAH+–PSS− binary mixtures were captured using an optical microscope (Nikon, ECLIPSE LV100ND, Japan). The evaporation of a drop containing PS+–PS− particles (1 μm diameter) at CT = 0.01%, 0.1%, and 1% was recorded using an inverted fluorescence microscope (DMI3000B, Leica Microsystems, Germany). Time-lapse imaging of fluorescent tracer particles in the particle tracking experiments was also captured using the same fluorescence microscopy setup. The images were captured every 0.5 seconds and then processed using Trackpy, a Python package for particle tracking that identifies the coordinates of the particles in each frame. Using this data, the mean square displacement (MSD) and trajectories of the tracer particles were obtained.
2.4 Characterization of size and mobility of the particles
The diameter of the particles in the parent dispersions, as well as the binary mixtures, were measured using the static light scattering (SLS) technique (Horiba LA950, Japan). The electrophoretic mobility of the particles was measured from the electrophoretic dynamic light scattering technique (Horiba SZ-100, Japan), and the zeta potential was calculated using Smoluchowski's equation. For these measurements, 0.05 w/v% aqueous dispersions containing 1 mM NaCl were used. All the measurements were carried out at 25 °C.2.5 Rheological measurements
The binary mixtures of CL+–HS− and CL+–PSS− (CT = 10% at mixing fraction corresponding to maximum hetero-aggregation) were subjected to oscillatory rheology experiments, namely, frequency and amplitude sweep measurements using a controlled stress rheometer (Anton Paar Physica, MCR 301, Austria) using the published protocol.27 A 25 mm diameter parallel plate geometry at a gap of 0.5 mm was used. A few drops of silicone oil were placed around the edge of the plates, over the sample to minimize the evaporation of water. The solutions were pre-sheared at 1% strain and 1 rad s−1 frequency, followed by a rest period of 5 minutes to erase the previous shear history. The amplitude sweep was performed starting from 0.01 strain% to 1000 strain% at a constant frequency of 1 rad s−1. The samples were also subjected to a constant strain% of 0.1% across the frequency ranging from 0.1 to 100 rad s−1.2.6 Analysis and characterization of the dried deposit
The height or surface profile of the dried pattern was measured using an optical surface profiler (Bruker, Countour GT-1, Germany). This data was further used to quantify the morphology of the evaporative patterns into various categories, such as coffee rings, domes, uniform deposits, central deposits, and coffee eye deposits, more details of which can be found in our earlier work.22 This method uses h(x,y), where h represents the height of the deposit at location (x,y), as an input to quantify the spatial distribution of particles in the dried deposit. The height profile data in the Cartesian coordinate system is transformed into the polar coordinate system to obtain h(![[r with combining circumflex]](https://www.rsc.org/images/entities/i_char_0072_0302.gif) ,θ), where and θ denote the radial and azimuthal coordinates, respectively.
,θ), where and θ denote the radial and azimuthal coordinates, respectively.
A height–height correlation function 〈hh〉,
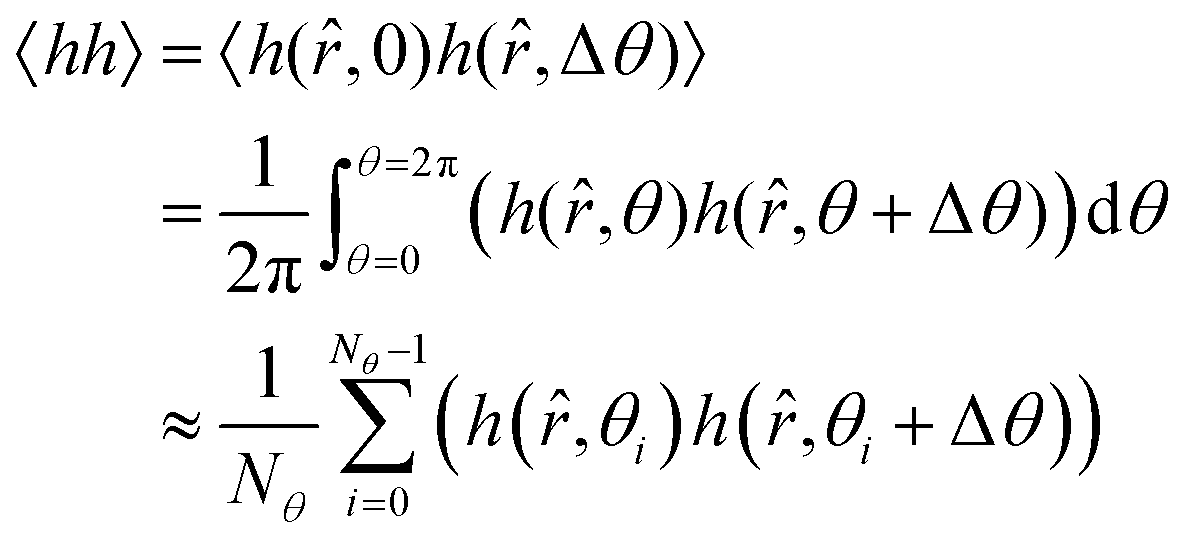 | (1) |
. In eqn (1), Nθ is the number of azimuthal segments and θi denotes the coordinate of the ith segment. Exploiting the symmetry, an average of the height–height correlation in the intervals (0,π) and (π,2π) is calculated, which is then normalized with its maximum value to obtain 〈hh〉corr. When plotted against Δθ, 〈hh〉corr decreases from 1 which corresponds to the perfectly correlated case to a minimum value. The value of Δθ at which the correlation function decays to the minimum, denoted by ![[d with combining circumflex]](https://www.rsc.org/images/entities/i_char_0064_0302.gif) corr provides an estimate of the size of the particle clusters.
corr provides an estimate of the size of the particle clusters.
Next, we also calculate the root mean square of the correlation function in the azimuthal direction for each radial location, by substituting Δθ = 0 in eqn (1) and is given by:
 | (2) |
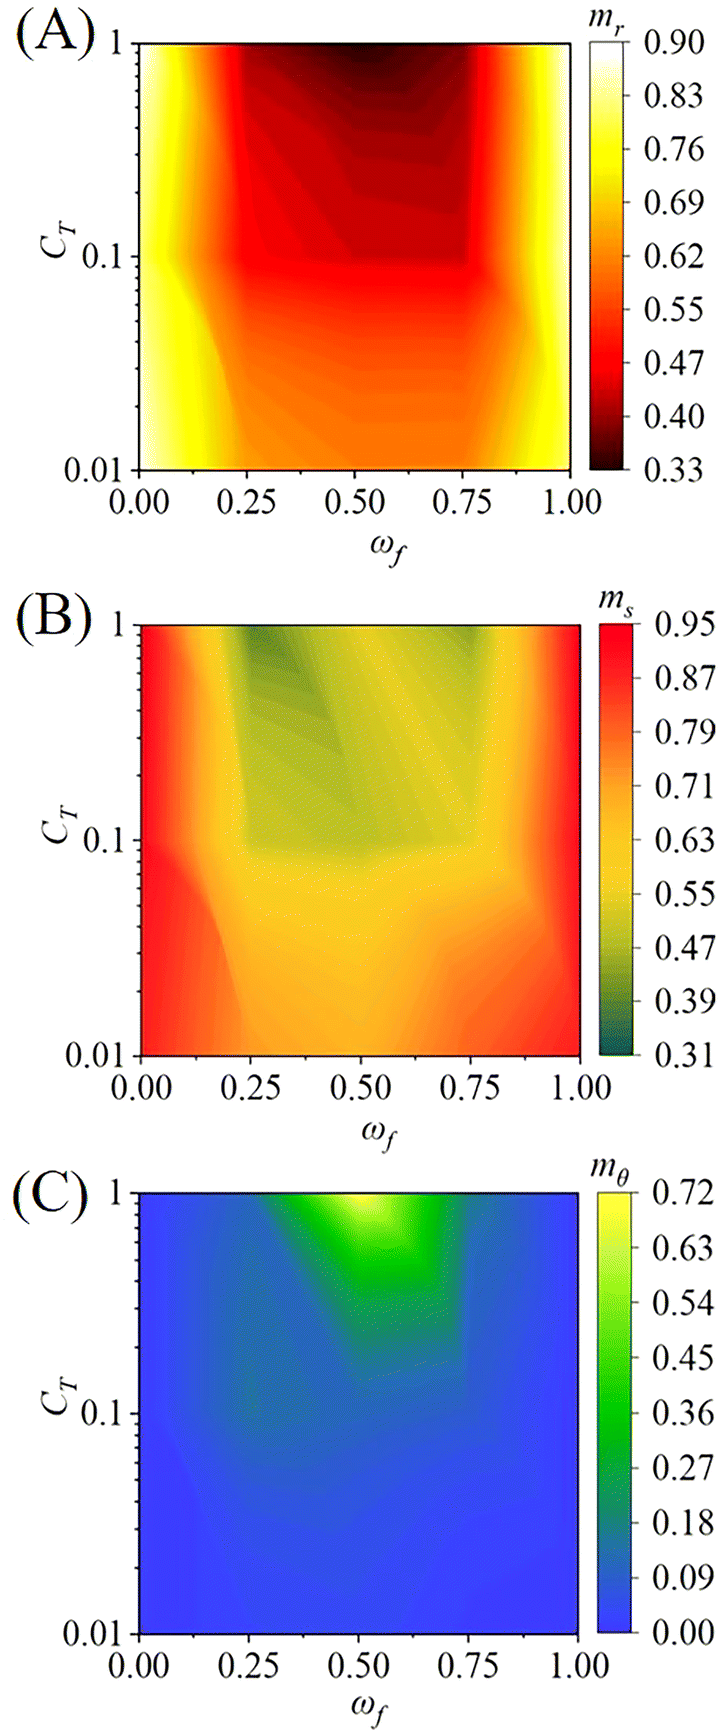
The variation of the deposit height in the radial and azimuthal direction is further quantified using three parameters – mr, ms, and mθ. These parameters determined from hRMS and corr take values ranging from 0 to 1 facilitating the pattern classification, and are defined as follows.22
• The parameter mr, the ratio of the first moment of hRMS with respect to to the zeroth moment of hRMS, is given by:
 | (3) |
j is the jth radial segment. An mr value close to 0 indicates that most of the particles are deposited at the centre of the deposit, while an mr value near 1 signifies a coffee-ring-like pattern. Intermediate mr values suggest that particles are present in the interiors of the dried pattern.
• The parameter ms, which characterizes the radial spread of the particle distribution in the deposit, is given by:
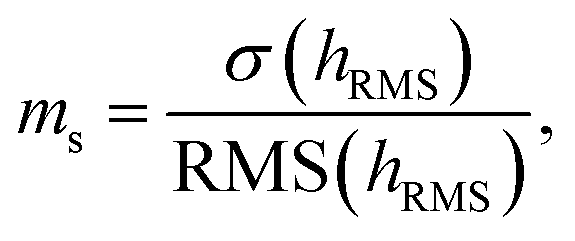 | (4) |
• The parameter mθ, which provides an estimate of the size of the deposit in the azimuthal direction, is defined as:
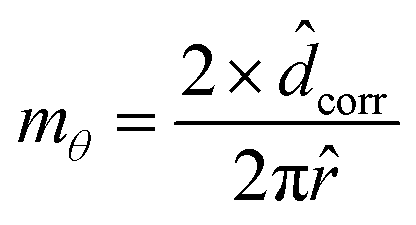 | (5) |
corr to the perimeter of the radial segment over which the analysis is performed. The prefactor 2 accounts for the averaging performed in the θ direction. Note that mθ is defined at each radial location. We report mθ, evaluated at = 0.5 in this work. An mθ value close to 0 indicates no variation in the height of the deposits in the radial segment considered, and a value close to 1 implies particle deposition across the entire azimuthal direction.
Based on the values of mr and ms the dried deposits can be classified into various patterns. An estimate of the size of the clusters in the dried deposit formed can be obtained from mθ. We refer readers to our earlier work for additional details.22
3 Results and discussion
3.1 Patterns from dried drops of oppositely charged colloids
The optical microscopy images of the patterns formed after drying a sessile drop consisting of a mixture of positively charged polystyrene, PS+ and negatively charged polystyrene, PS− particles (each of approximately 200 nm diameter) at different mixing fractions (ωf = 0, 0.25, 0.5, 0.75, and 1) and total initial particle concentrations (CT = 0.01%, 0.1%, and 1%) are presented in Fig. 1. The height profiles corresponding to these samples are shown in Fig. S1 in the ESI.† The diameter of the contact line and the initial contact angle of the sessile drops of 1 μL volume used in these experiments were measured to be ≈2.2 ± 0.3 mm and θc ≈ 35 ± 3°, respectively. The drying of the sessile drop followed a constant contact radius (CCR) mode, with the complete evaporation of water occurring in approximately 10 minutes. The parameters mr, ms, and mθ that quantify the spatial distribution of particles in the dried deposits shown in Fig. 1 calculated from the height profiles of these patterns have been shown in Fig. 2 as contour plots.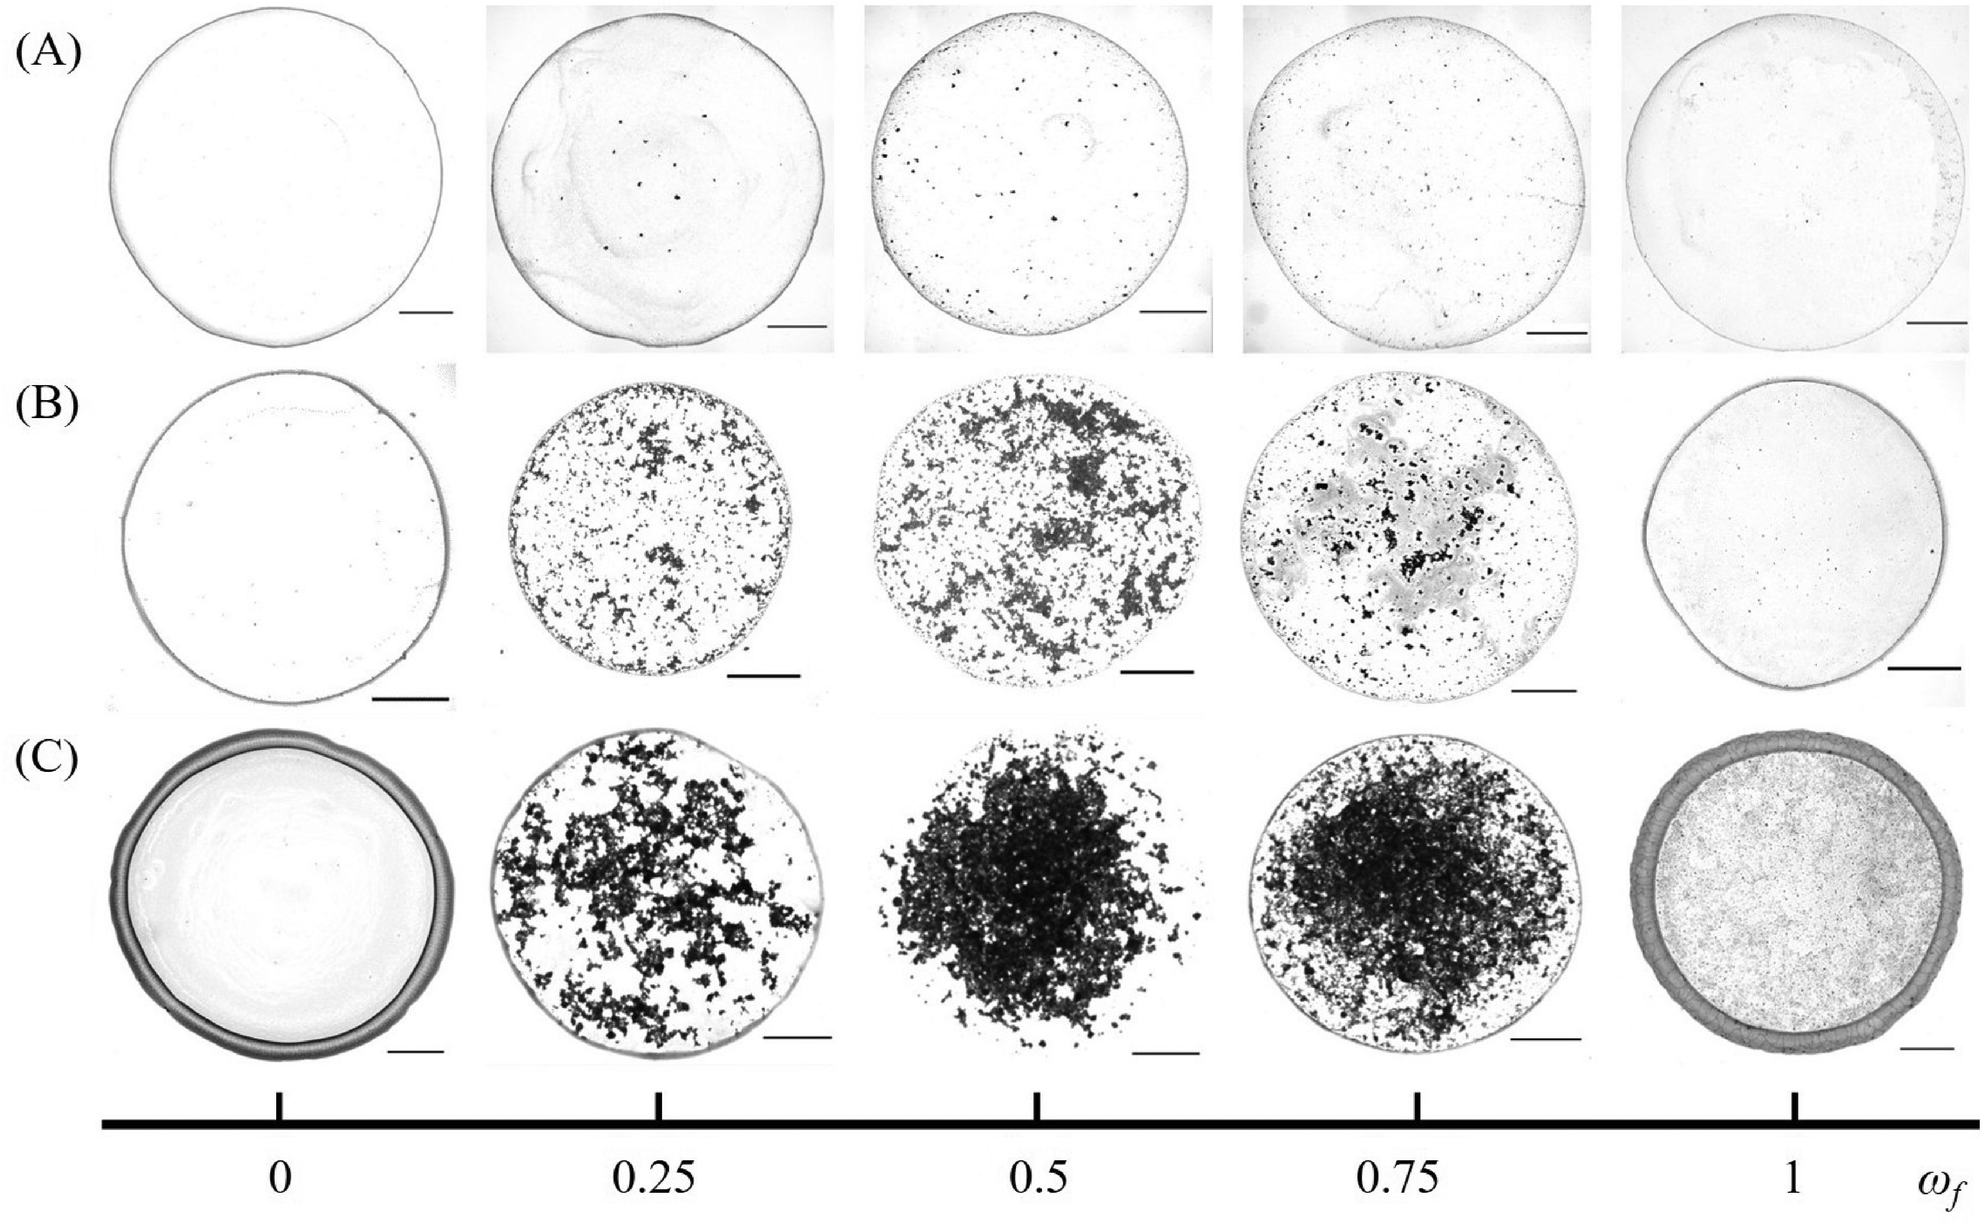 | ||
| Fig. 1 Optical microscopy images of the dried deposit patterns formed by drying binary dispersions drops containing PS+–PS− (≈200 nm diameter) at (A) CT = 0.01%, (B) CT = 0.1%, and (C) CT = 1% for various mixing fractions (ωf). The microscopy images shown have been recorded soon after complete evaporation of the liquid from the sessile drops, which had a typical lifetime of about 10 min. Scale bar = 500 μm. | ||
 | ||
| Fig. 2 The contour plots showing the variation of (A) mr, (B) ms, and (C) mθ for the dried deposit patterns formed by drying binary dispersion drops containing PS+–PS− (≈200 nm diameter) as a function of concentration (CT) and mixing fraction (ωf). | ||
The evaporation of drops containing either PS+ (ωf = 1) or PS− (ωf = 0) produced coffee-ring patterns irrespective of CT, as expected. Correspondingly, mr and ms exceeded a value of 0.8, indicating the predominantly ring-like deposition. Due to the absence of any particle in the interior of the deposit, mθ evaluated at a radial position = 0.5, for these patterns, was found to be 0.
At CT = 0.01%, for the intermediate mixing fractions ωf = 0.25, 0.5, and 0.75, small clusters of particles were present in the inner region of the dried deposit, alongside the persistent coffee ring at the periphery (Fig. 1(A)). Consequently, the parameters mr and ms decreased slightly compared to the limiting cases ωf = 0 and 1. Furthermore, mθ, evaluated at = 0.5, showed a slight increase. When the concentration was increased to CT = 0.1%, the patterns at ωf = 0.25, 0.5, and 0.75 showed a significant increase in the size and number of clusters in the interior region (Fig. 1(B)) along with a weak coffee ring deposit at the peripheral region. The considerable increase in the presence of particles in the interior of the pattern at ωf = 0.5 suggests enhanced hetero-aggregation at this composition (increase in both size and number of clusters). Correspondingly, the magnitude of mr and ms decreases considerably (≈0.45 at ωf = 0.5), indicating suppressed coffee-ring formation. The parameter mθ also increases, reaching a value of ≈0.21 at ωf = 0.5, suggesting the presence of larger clusters at radial location = 0.5.
At the highest initial concentration considered, CT = 1%, the patterns at intermediate mixing fractions ωf = 0.25, 0.5, and 0.75 have most particles deposited in the interior region, as evident from the optical microscopy images in Fig. 1(C) and the height profiles shown in Fig. S1(C) in the ESI.† The mr and ms for these patterns were lower than 0.4 due to the accumulation of more particles in the interior region. A marginal increase in the value of ms at ωf = 0.5 suggested that the pattern was close to being dome-like. The mθ was approximately 0.2 at ωf = 0.25 and 0.75, indicating the deposition of larger clusters in the central region compared to the case of lower CT. At ωf = 0.5, mθ at = 0.5 was calculated to be the highest, 0.72, reflecting the presence of large clusters spanning this radial location. Similar to the case of CT = 0.01%, faint peripheral rings were observed at ωf = 0.25 and ωf = 0.75.
The modification of the dried patterns in the deposit is a direct consequence of the hetero aggregation of the oppositely charged particles dispersed in the drop. While the evaporation driven radial flow of the solvent convects both the individual particles that do not participate in the hetero aggregation and the smaller hetero aggregates to the peripheral region of the patterns, the larger aggregates result in an enhanced deposition in the interior of the dried deposit. Since the size and size distribution of the aggregates formed by the hetero aggregation process depends upon the mixing fraction ωf and the total concentration CT, we focus on the hetero-aggregation process of oppositely charged colloids in the next section.
3.2 Hetero-aggregation of oppositely charged colloids
We study the hetero-aggregation of oppositely charged colloids in the aqueous dispersion prior to drying. To this end, static and dynamic light scattering analyses were used respectively to measure the mean diameter, Dp, and electrophoretic mobility, u, of the dispersed species in the binary dispersions. The electrophoretic mobility (u) of the dispersed species in a binary aqueous dispersion of 190 nm diameter positively charged polystyrene, PS+ and 220 nm diameter negatively charged polystyrene, PS− particles as a function of mixing fraction at CT = 0.05% is presented in Fig. 3. For dispersions of PS− particles (ωf = 0), the measured electrophoretic mobility was −0.046 ± 0.001 mm2 V−1 s−1, and the corresponding zeta potential was −59.4 ± 1.39 mV. As PS+ particles were introduced, the overall mobility of the dispersed species decreased. At a mixing fraction in the vicinity of 0.5, the mobility was reduced to 0. A black dashed line corresponding to u = 0 has been shown in Fig. 3. Beyond this point, the mobility shifted to a positive value as more PS+ particles were added. At ωf = 1, where only PS+ particles are present in the dispersion, u = +0.052 ± 0.001 mm2 V−1 s−1 and the zeta potential was +68.1 ± 1.86 mV. | ||
| Fig. 3 Electrophoretic mobility u and diameter Dp of the dispersed species as a function of mixing fraction. The black dashed line represents the zero mobility line. The red dotted line represents the critical diameter above which the dispersed species will settle over the lifetime of the drop. | ||
The Dp of the dispersed species in the binary mixture measured at different mixing fractions plotted in Fig. 3 shows a non-monotonic trend with a peak at ωf = 0.5. The average diameter of the dispersed particles at ωf = 0 and ωf = 1 was 187.3 ± 1.7 nm and 223.3 ± 5.1 nm, respectively, consistent with the diameter of individual particles provided by the manufacturer.
The average diameter at intermediate ωf was considerably larger (by an order of magnitude) due to the formation of hetero-aggregates. Note that as u = 0 at ωf = 0.5, the average diameter of the hetero-aggregates was the highest. The larger clusters or particles in the drying drop are expected to settle during the course of drying.21,35 Therefore, the maximum particle size above which the dispersed species would settle during the lifetime of the drying drop was calculated. For this purpose, we considered a typical drop with a diameter of 2.2 mm, apex height of 1 mm, and initial contact angle of 35°. By substituting the total drying time and the drop height at the apex in Stokes’ settling equation, we estimated the critical diameter, Dp,c, of the cluster in the PS+–PS− system that would settle during the drying process to be approximately 7.8 μm. The horizontal dotted line has been drawn in Fig. 3 to mark this critical diameter.
The dried patterns, when the electrophoretic mobility of the dispersed species in the drop is considerably high and when the particles did not form aggregates i.e., at ωf = 0 and 1, were coffee rings. The large-sized hetero-aggregates formed in the drops at ωf = 0.25, 0.5, and 0.75 were weakly charged (low u). Therefore, the particle clusters started to appear in the inner regions of the deposits and the patterns were not typical coffee-rings anymore. We point out that SLS measurements were performed for the binary mixtures at CT = 0.05%; however, the microscopy images in Fig. 1 show deposits at CT = 0.01%, 0.1%, and 1%. The average diameter of the clusters in the latter cases would be much larger. Therefore, the concentration of particles deposited in the interior regions of the deposits for ωf = 0.25, 0.5, and 0.75 increases progressively as the concentration increases from CT = 0.01% to 1%.
3.3 Drying drop of oppositely charged colloids – generalization of pattern formation
We now extend our study to analyze evaporative patterns resulting from the drying of aqueous drops having different oppositely charged species, namely, particle–particle (CL+–HS−), particle–polyelectrolyte (CL+–PSS− and PAH+–HS−), and polyelectrolyte–polyelectrolyte, (PAH+–PSS−). In order to reduce the parameter space of analysis, here, we took a different approach; the hetero-aggregation behaviour was investigated to identify the ωf at which u = 0, and drying drop experiments were conducted at this ωf. Fig. 4(A) shows the variation of u with ωf. A black dashed line corresponding to u = 0 has been shown in Fig. 4 for the ease of identifying the isoelectric mixing fraction, that is, ωf for which u = 0. The intersection of the u vs. ωf curve with the dashed line gives a specific mixing fraction at which the electrophoretic mobility of the oppositely charged binary mixture becomes 0. In general, ωf corresponding to u = 0 will depend on size ratio, charge ratio, surface chemistry, and solution conditions (such as pH). At this isoelectric mixing fraction, the size of the clusters attains a peak, which is general to all the binary systems as illustrated in Fig. 4(B), where the ratio of the diameter of the dispersed species scaled with critical size above which the particles will settle (calculated from Stokes’ settling equation) has been plotted as a function of ωf. | ||
| Fig. 4 (A) Electrophoretic mobility and (B) ratio of the diameter of dispersed species (Dp) to the critical diameter of the dispersed species which settle over the lifetime of the drop (Dp,c) for the CL+–HS−, CL+–PSS−, PAH+–HS−, and PAH+–PSS− binary mixtures as a function of mixing fraction (ωf). | ||
Fig. 5–7 show the optical microscopy images of the deposits obtained after evaporation of water from drops of different binary mixtures at CT = 0.01%, 0.1%, and 1%, respectively. The binary mixture system, along with the corresponding isoelectric mixing fraction, has been inscribed on the top of each dried pattern. The first row in Fig. 5–7 shows the microstructure of the entire deposit. The particle depositions near the contact line (square with solid lines) and in an interior region (square with dotted lines) at higher magnification have been shown in the next two rows.
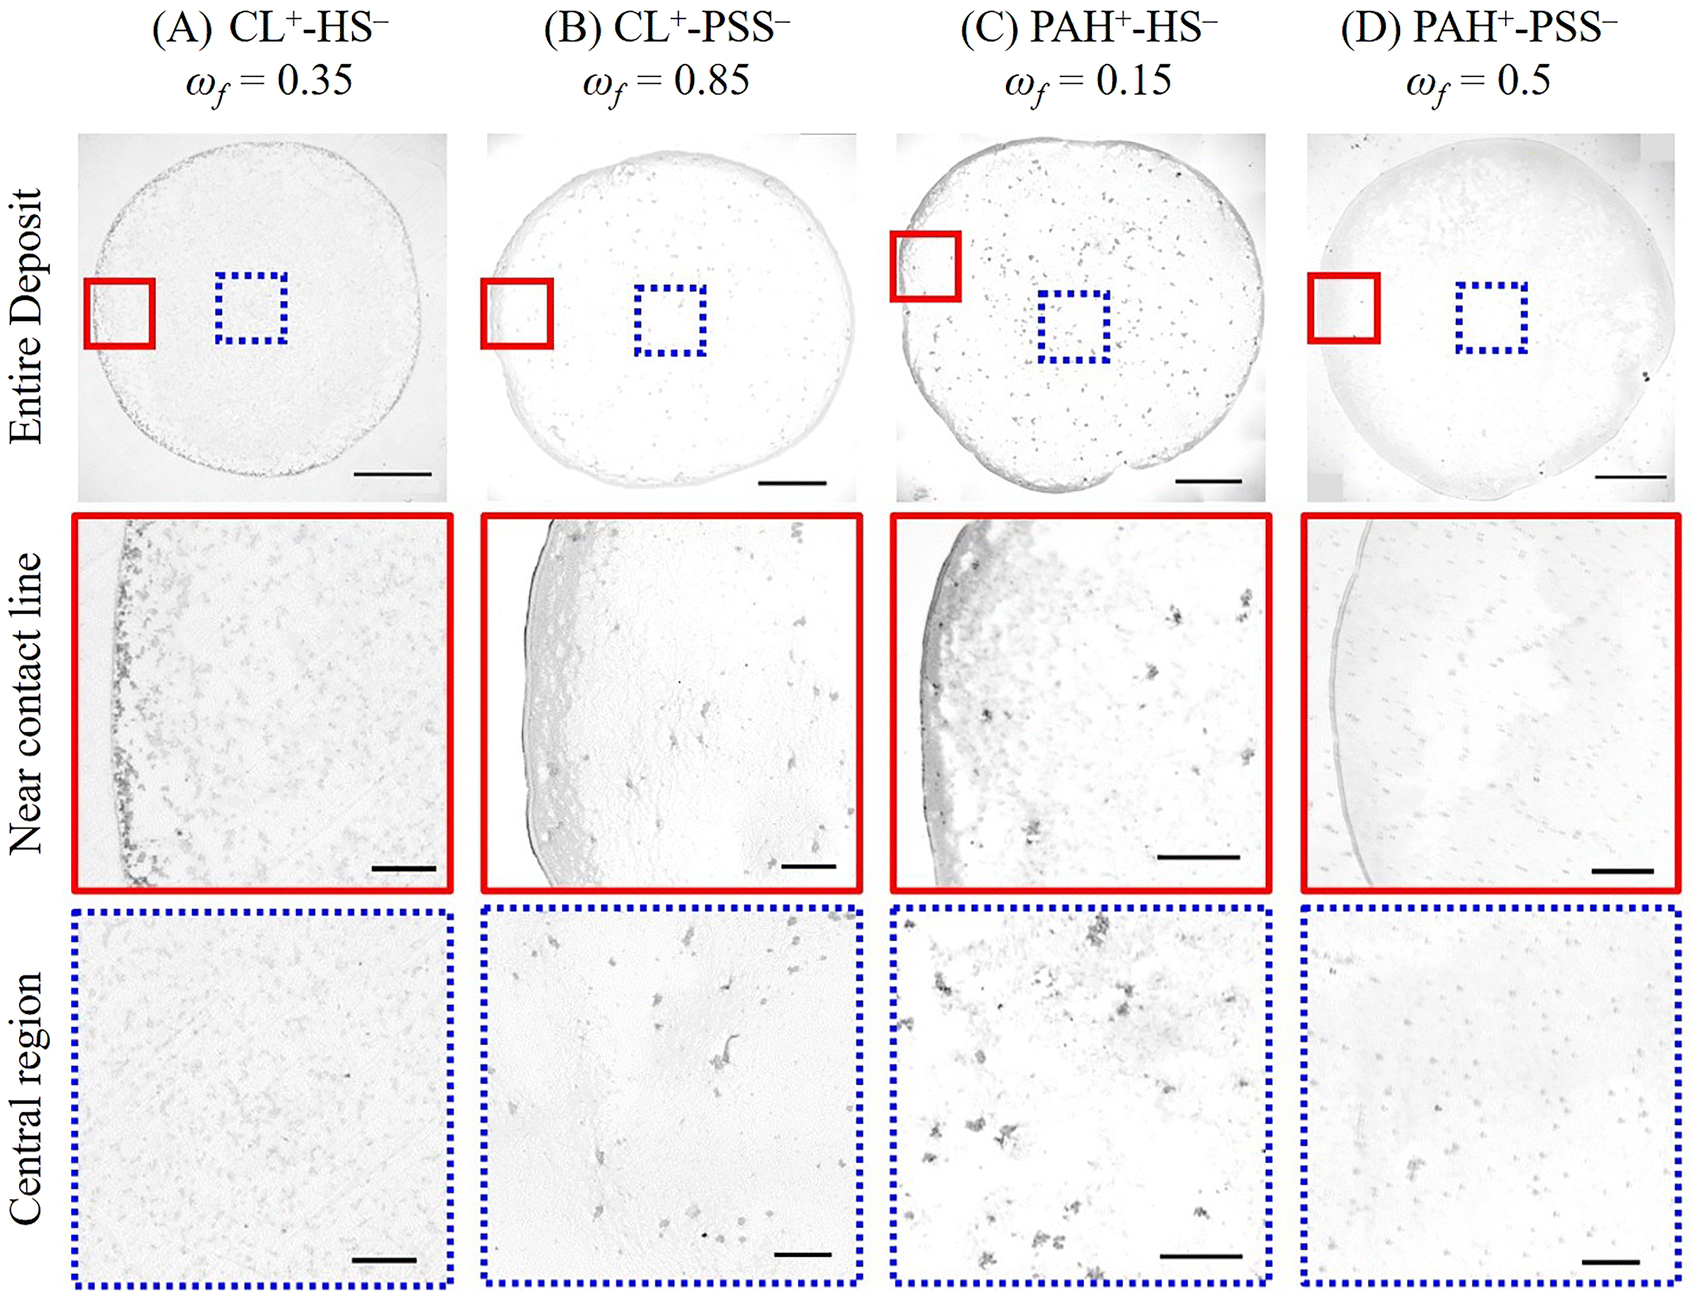 | ||
| Fig. 5 Optical microscopy images show the entire dried deposit (top panel), a region near the contact line (middle panel), and the central region (bottom panel). These patterns are formed by drying sessile drops containing (A) CL+–HS−, (B) CL+–PSS− (C) PAH+–HS−, and (D) PAH+–PSS− binary mixtures prepared at isoelectric mixing fraction and at a total concentration, CT = 0.01%. The scale bar in the top panel represents 500 μm. The scale bar in the other two panels corresponds to 100 μm. | ||
 | ||
| Fig. 6 Optical microscopy images showing the entire dried deposit (top panel), a region near the contact line (middle panel), and the central region (bottom panel). These patterns are formed by drying sessile drops containing (A) CL+–HS−, (B) CL+–PSS− (C) PAH+–HS−, and (D) PAH+–PSS− binary mixtures prepared at isoelectric mixing fractions and a total concentration, CT = 0.1%. The scale bar in the top panel represents 500 μm. The scale bar in the other two panels corresponds to 100 μm. | ||
 | ||
| Fig. 7 Optical microscopy images show the entire dried deposit (top panel), a region near the contact line (middle panel), and the central region (bottom panel). These patterns are formed by drying sessile drops containing (A) CL+–HS−, (B) CL+–PSS−, (C) PAH+–HS−, and (D) PAH+–PSS− binary mixtures prepared at isoelectric mixing fraction and a total concentration, CT = 1%. The scale bar in the top panel represents 500 μm. The scale bar in the other two panels corresponds to 100 μm. | ||
At CT = 0.01%, much like the case of PS+–PS−, a considerable quantity of the dispersed material has been convected to the boundary, as illustrated in Fig. 5. As seen in the second row and the third row of Fig. 5, there was deposition at the contact line as well as in the interior region at the isoelectric mixing fraction.
The coffee-ring suppression is evident in the deposits formed by drying of different oppositely charged binary mixtures at CT = 0.1%, see Fig. 6. However, the spatial distributions of hetero-aggregates in the deposits of (i) CL+–HS− and CL+–PSS− and (ii) PAH+–HS− and PAH+–PSS−, are strikingly different. These differences are clearly visible in the microscopy images of the entire deposit, as well as the magnified views of the boundary and central regions, as shown in Fig. 6. In the CL+–HS− and CL+–PSS− systems, the hetero-aggregates were distributed uniformly across the entire area of the deposit. In PAH+–HS− and PAH+–PSS− binary mixtures, the deposits have voids or particle deficit regions co-existing with hetero-aggregates. Further analysis of the mechanism underlying the formation of these distinct patterns in the binary mixtures of CL+–HS− and CL+–PSS− have been presented in the next section.
At CT = 1%, the images shown in Fig. 7 reveal more particles in the interior region as compared to the edge. This is similar to the case for the PS+–PS−; however, in the systems shown in Fig. 7, cracks form in the inner regions with higher particle deposition. The presence of cracks in these systems is due to stress release developed during drying.36 This phenomenon is significant when the size of individual particles is small and the particle concentration is sufficiently high.
3.4 Mechanism of pattern formation
As discussed in the previous sections, evaporation of aqueous sessile drops containing oppositely charged binary mixtures resulted in a variety of patterns, such as (I) a coffee ring, (II) a coffee ring with small clusters in the interior region, (III) deposits with uniform distribution of (a) hetero-aggregates, and (b) hetero-aggregates with voids, and (IV) dome-like deposits – without and with cracks in the interior region. To unravel the mechanism of pattern formation, we performed evaporation experiments containing 1 μm PS+–PS− particle system. Here, the negatively charged amine-coated polystyrene particles are fluorescently labelled. We show that the formation of different patterns is dictated by the interplay of three competing phenomena that contribute to the transport of individual particles and hetero-aggregates as the solvent evaporates from the sessile drop, namely: (i) evaporation-driven flows, (ii) gravity-aided sedimentation, and (iii) gelation, which are further discussed in detail in this section.In addition to transport towards the contact line, the deposition of aggregates in the interior region of the dried deposit can also be seen in Movie M1 (ESI†). These are the larger-sized hetero-aggregates that sediment over the base area of the drop due to the action of gravity. The extent of deposition of hetero-aggregates in the interior is much larger for the case of binary drops of 1 μm diameter particles even when CT = 0.01%, unlike the patterns presented in Fig. 5 where the size of the individual species (and hence that of hetero-aggregates) is smaller by at least one order.
At higher CT (= 0.1%, 1.0%) and when ωf is in the vicinity of the isoelectric mixing fraction, the deposition of large-sized clusters onto the solid substrate occurs immediately after the drop was cast on the solid substrate. These clusters, being large in size, are not convected to the drop edge. This is evident in the fluorescence microscopy videos for CT = 0.1% (Movie M2, ESI†) and CT = 1% (Movie M3, ESI†). The patterns presented in Fig. 6 and 7 also correspond to the cases where the settling of hetero-aggregates in the interior region is dominant. Based on the particle sizes obtained from dynamic light scattering (DLS), the time scale of settling, i.e., the ratio of the time of settling (based on Stokes’ settling) to the total drying time for each system is calculated and tabulated in Table 1 for a total particle concentration of CT = 0.05%. This indicates that the larger clusters formed at higher concentrations are expected to settle during the initial stages of drop drying.
| System | ρ p (kg m−3) | t s/tf |
|---|---|---|
| CL+HS− | 2170 | 0.03 |
| CL+PSS− | 2030 | 0.03 |
| PAH+HS− | 2070 | 0.03 |
| PAH+PSS− | 1100 | 0.17 |
Thus, depending on initial concentration and mixing fraction, a competition between capillary flow-driven transport and gravity-driven sedimentation dictates the formation of coffee stains, coffee rings with small clusters in the interior region, deposits with uniform distribution of hetero-aggregates with voids, and dome-like deposits across a wide range of binary mixtures of oppositely charged species considered in this study.
The x and y coordinates of a single tracer particle recorded during 0 to 30 seconds, 180 to 210 seconds, 420 to 450 seconds, and 570 to 600 seconds, which respectively correspond to 0 < t/tf < 0.05, 0.3 < t/tf < 0.35, 0.7 < t/tf < 0.75, and t/tf > 0.95 have been plotted in Fig. 8(A), (B), (C), and (D), respectively. Initially i.e., when t/tf < 0.05, the particle exhibits considerable motion as evident from the trajectory shown in Fig. 8(A). However, as evaporation progresses, the mobility of the particles decreases, as can be seen in Fig. 8(B). During the final stages of drying (t/tf > 0.95), the particle exhibits minimal movement, as seen in Fig. 8(C) and (D). The ensemble mean square displacement (MSD), Δr2, obtained from the trajectories of more than 100 tracers has been plotted as a function of the lag time Δt in Fig. 8(E) for every 30-second time interval starting from t/tf = 0. The reduction in MSD with time clearly indicates the slow down of the tracer particles. Moreover, the slope of the MSD vs. Δt curves changes with time, indicating that the tracer particle dynamics also change as evaporation proceeds. When t/tf < 0.15, Δr2 scales proportionately with Δt, indicating a diffusive motion in the sample. The slope of MSD vs. Δt decreases monotonically as the drying continues, and the tracer particles exhibit a sub-diffusive behaviour when t/tf > 0.15. The slope in the final stages is about 0.15, indicating that the tracer particles are now embedded in a solid or gel-like material.39 Thus, the particle-tracking microrheology experiments clearly illustrate a transition in the state of the drying droplet from viscous to gel-like as the solvent evaporates. From the temporal evolution of the drop shape profile recorded using a goniometer (Attension theta PD200, Biolin Scientific, Sweden), the concentration of OCPs in the drop at the point of gelation is estimated to be approximately 10%. The time at the CL+–HS− and CL+–PSS− binary mixture gel depends on the initial particle concentration and can be calculated assuming a linear rate of evaporation.40 The characteristic time scale of the onset of gelation scaled with the total time of evaporation, tg/tf is estimated to be 0.99 for CT = 0.1% and 0.9 for CT = 1%, i.e. gelation occurs towards the far end of the drying process.
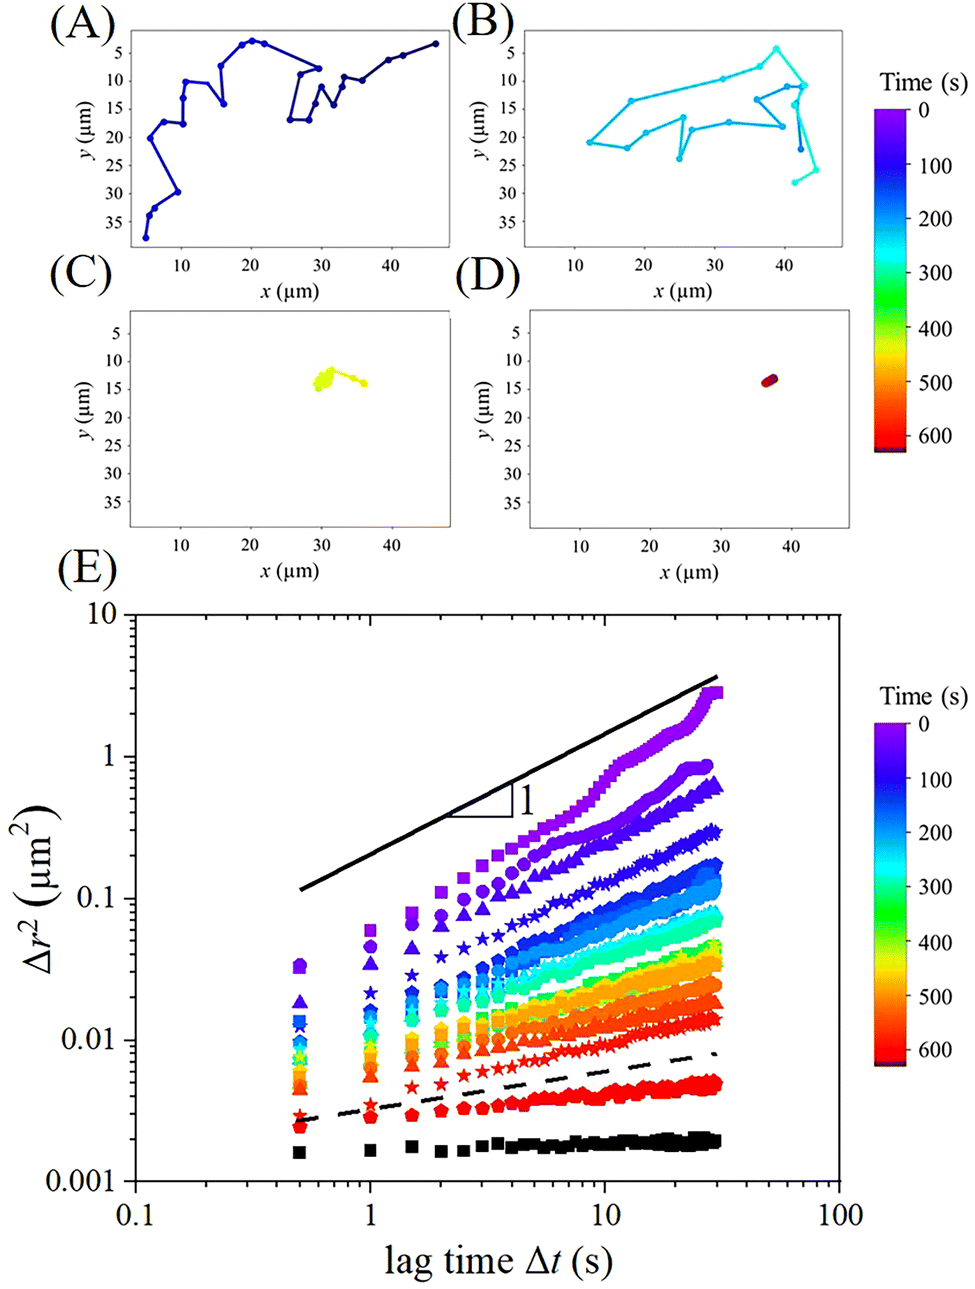 | ||
| Fig. 8 Trajectories of a tracer particle in a 0.1% CL+HS− (ωf = 0.35) binary mixture in a region near the centre at different time intervals: (A) 0 < t/tf < 0.05, (B) 0.3 < t/tf < 0.35, (C) 0.7 < t/tf < 0.75, and (D) t/tf > 0.95. (E) Mean square displacement Δr2 of the tracer particles in the centre of the evaporating sessile drop plotted as a function of lag time Δt at 30 s intervals during the course of drying. The solid line in (E) represents a slope of 1, while the dashed line corresponds to a slope of 0.2. | ||
We further confirm gelation in an aqueous binary OCP mixture (10 w/v%) prepared at the isoelectric mixing fraction by ex situ experiments. The storage modulus G′ and loss modulus G′′ for the CL+–HS− and CL+–PSS− mixtures corresponding to these conditions, obtained from frequency and amplitude sweep measurements, are shown in Fig. 9(A) and (B), respectively. A linear viscoelastic regime where the moduli are independent of strain percentage, wherein G′ is higher than G′′, a cross-over characteristic of yielding, and negligible change in G′ and G′′ in the frequency window considered, provide conclusive evidence of gelation in these systems. Supplementary experiments confirmed that the rheology data presented are not influenced by the gap height and the wall slip, see Fig. S2 in the ESI† where data for the CL+–HS− system is shown. The formation of gels in both CL+–HS− and CL+–PSS− aqueous binary systems at 10 w/v% and at isoelectric mixing fraction is further confirmed by the vial inversion test shown in Fig. S2(A) and (B) in the ESI.† The mechanism described here for CT = 0.1%, that is, settling of hetero-aggregates followed by gelation, also holds for the case of CT = 1%, except that gelation occurs much earlier due to higher initial concentration, which leads to patterns shown in Fig. 7(A) and (B).
 | ||
| Fig. 9 Rheology of binary mixtures of CL+–HS− and CL+–PSS− systems at CT = 10% prepared at the isoelectric mixing fraction: (A) amplitude and (B) frequency sweep. | ||
On the other hand, the patterns shown in Fig. 6(C), (D) and 7(C), (D) are solely driven by the gravity aided settling of hetero-aggregates, as the PAH+–HS− and PAH+–PSS− binary mixtures prepared at CT = 0.1% and CT = 1% do not gel during the course of drying experiments. This is further confirmed by the vial inversion test for the 10 w/v% PAH+–HS− and PAH+–PSS− binary mixtures prepared at the isoelectric mixing fraction shown in Fig. S3(C) and (D) (ESI†) and the rheology experiments, which showed that G′ and G′′ are frequency dependent (see Fig. S4 in the ESI†).
There have been reports of coffee-ring suppression when an aqueous drop containing oppositely charged particles and surfactants is dried, which has been attributed to electrostatic hetero-aggregation. While this mechanism parallels manipulating DLVO (Derjaguin, Landau, Verwey, and Overbeek) interactions observed in our system, the underlying physical processes governing the final deposit morphology differ significantly. In the particle–surfactant system, association between oppositely charged species leads to surfactant-coated particles, which, being hydrophobic, eventually adsorb at the liquid–vapour interface. This leads to the formation of particle–surfactant “skin”, resulting in a disk-like deposit upon drying. In contrast, our studies on binary mixtures of oppositely charged particles or particle–polymer binary mixtures clearly demonstrate that coffee-ring suppression arises primarily due to either gravity-driven sedimentation or gelation, depending on the initial concentration of dispersed species in the drying drop.41 Our results also demonstrate that gelation due to a combination of hetero-aggregation and evaporation is another effective strategy to suppress coffee-ring formation. The gelation process immobilises the suspended particles and effectively suppresses the radial capillary flow, leading to uniform deposits. It is also possible to induce gelation by adding an additive that creates a crosslinked network within the droplet.42
4 Uniform deposition of agrochemicals on leaf surfaces
In this section, we show how hetero-aggregation can be exploited to tailor the deposition of agrochemicals on the surface of glass and banana leaves. To this end, we consider the deposition and drying of an aqueous dispersion of negatively charged (ζ = −55 ± 2.6 mV) seaweed extract, which is a water-soluble alginic acid compound containing organic matter (50.0%), nitrates (14.0–15%), phosphorus (2.5–4%), and potassium (18–22%). Seaweed extract is commonly used as a bio-stimulant in agriculture. Dynamic light scattering measurements show that the seaweed extract, when dispersed in water, is in the form of nanoparticles of 22 nm average hydrodynamic diameter. The equilibrium surface tension of the aqueous dispersion at 0.1 wt% concentration is measured to be 70 mN m−1, comparable to that of pure water, indicating the absence of any surface-active components in the seaweed extract. Steady shear viscosity measurements reveal that the seaweed dispersion at 0.1 wt% concentration behaves as a Newtonian fluid, with a viscosity of 0.9 mPa s.A 2 μL aqueous dispersion of seaweed extract, when dried on the two substrates (soft leaf and hard glass) in a controlled environment, maintaining a relative humidity of 60%, is found to follow a constant contact radius (CCR) mode. The seaweed extract is found to deposit only at the edge, forming a clear coffee ring deposit, as shown in the optical microscopy images in Fig. 10(A). Due to the inhomogeneous distribution of seaweed in the coffee-ring pattern, the performance of the formulation can reduce significantly.43 To overcome this problem, we introduced positively charged alumina particles (ζ = +57.3 ± 1.8 mV) as an adjuvant into the dispersion of seaweed extract. The positively charged alumina particles are attracted to the negatively charged seaweed extract owing to electrostatic hetero-aggregation, leading to the formation of large clusters, which can significantly alter the distribution of seaweed extract on the substrates. The sessile drops consisting of a mixture of seaweed extract (0.1 wt%) and adjuvant alumina particles (0.1 wt% and 0.5 wt%) on the surface glass and banana leaf are shown in Fig. 10(B) and (C), respectively. It can be observed in Fig. 10(B) that, at 0.1 wt%, small clusters of alumina particles are present in the inner region of the dried deposit alongside a persistent coffee ring consisting of seaweed extract. When the concentration of alumina is increased to 0.5 wt%, as shown in Fig. 10(C), a considerable quantity of seaweed extract is seen across the entire area of the deposit pattern. The enhanced hetero-aggregation at this composition leads to complete suppression of coffee-ring formation. This method serves as a simple yet effective tool to tailor the uniform deposition of seaweed extract for enhanced performance.
 | ||
| Fig. 10 Optical microscopy images of the dried deposit formed after the evaporation of water from (A) an aqueous drop of 0.1 wt% seaweed extract, (B) an aqueous drop containing 0.1 wt% seaweed extract and 0.1 wt% alumina microparticles and (C) an aqueous drop containing 0.1 wt% seaweed extract and 0.5 wt% alumina microparticles. The image in the first column corresponds to the dried deposit formed on a glass slide, and the images in the second and third columns represent the deposit microstructure on the adaxial surface of a banana leaf. The scale bar in the first two columns is 500 μm, and in the third column is 100 μm. | ||
5 Conclusion
This study presents a versatile strategy for tailoring evaporative deposition patterns using OCPs. By tuning the total particle concentration and mixing fraction, a diverse range of microstructures is achieved, including classic coffee rings, coffee rings with interior deposits, uniformly distributed patterns (with or without voids), and dome-like structures. The maximum suppression of the coffee-ring patterns was observed near the isoelectric mixing fraction, i.e. the mixing fraction at which the net electrophoretic mobility of the dispersed species is zero. At low concentrations near this isoelectric mixing fraction, patterns resemble coffee rings with small clusters deposited in the interior. As the concentration increases, cluster size grows, undergoes gravitational settling, and thus progressively covers a larger area within the drop. At the intermediate particle concentration considered in this study, when the particle mixture forms a gel during evaporation, uniform, space-spanning deposits emerge. In contrast, systems that do not gel upon drying produce hetero-aggregated clusters with voids in between at this concentration. At the highest concentrations, a network of clusters forms a dome-like microstructure in the central region. This study highlights the critical role of settling, gelation, and capillary flow in dictating deposit morphology, offering a robust approach for engineering self-assembled patterns through controlled hetero-aggregation of OCPs with implications in the agriculture sector.Author contributions
Sankar Hariharan: methodology, investigation, analysis, writing – first draft. Md Fariduddin: investigation of micronutrient deposition on leaf. Salil S. Vaidya: fluorescence microscopy and development of particle tracking algorithm. Sumesh P. Thampi: supervision, resources, project administration, funding acquisition, conceptualization, writing – review and editing. Madivala G. Basavaraj: supervision, resources, project administration, funding acquisition, conceptualization, writing – review and editing.Data availability
The data supporting this article have been included as part of the ESI.† Any additional data, if required are available from the corresponding author upon request.Conflicts of interest
The authors declare that there are no conflicts of interest.Acknowledgements
We acknowledge the financial support from the Ministry of Education (MOE)-Scheme for Transformational and Advanced Research in Sciences (STARS) (Sanction order ref: MoE-STARS/STARS-2/2023-0346). We are grateful for the financial support from IIT Madras through the Institutions of Eminence (IoE) Scheme, the Ministry of Education, Government of India, and the Prime Minister's Research Fellowship (PMRF).References
- R. D. Deegan, O. Bakajin, T. F. Dupont, G. Huber, S. R. Nagel and T. A. Witten, Nature, 1997, 389, 827–829 CrossRef CAS.
- K. Sefiane, Adv. Colloid Interface Sci., 2014, 206, 372–381 CrossRef PubMed.
- S. P. Thampi and M. G. Basavaraj, Annu. Rev. Chem. Biomol. Eng., 2023, 14, 53–83 CrossRef PubMed.
- A. Pal, A. Gope and A. Sengupta, Adv. Colloid Interface Sci., 2023, 314, 102870 CrossRef PubMed.
- D. Brutin, B. Sobac, B. Loquet and J. Sampol, J. Fluid Mech., 2011, 667, 85–95 CrossRef.
- K. Sefiane, G. Duursma and A. Arif, Adv. Colloid Interface Sci., 2021, 298, 102546 CrossRef.
- L. Zhang, H. Liu, Y. Zhao, X. Sun, Y. Wen, Y. Guo, X. Gao, C.-A. Di, G. Yu and Y. Liu, Adv. Mater., 2012, 24, 436–440 CrossRef PubMed.
- D. Mampallil, J. Reboud, R. Wilson, D. Wylie, D. Klug and J. Cooper, Soft Matter, 2015, 11(36), 7207–7213 RSC.
- A. W. Wray, D. T. Papageorgiou, R. V. Craster, K. Sefiane and O. K. Matar, Langmuir, 2014, 30, 5849–5858 Search PubMed.
- S. K. Saroj and P. K. Panigrahi, J. Magn. Magn. Mater., 2020, 513, 167199 CrossRef.
- M. Anyfantakis and D. Baigl, ChemPhysChem, 2015, 16, 2726–2734 Search PubMed.
- V. R. Dugyala and M. G. Basavaraj, Langmuir, 2014, 30, 8680–8686 CrossRef.
- L. Bansal, P. Seth, B. Murugappan and S. Basu, Appl. Phys. Lett., 2018, 112(21), 211605 Search PubMed.
- H. Hu and R. G. Larson, J. Phys. Chem. B, 2006, 110, 7090–7094 Search PubMed.
- T. Still, P. J. Yunker and A. G. Yodh, Langmuir, 2012, 28, 4984–4988 CrossRef.
- L. Cui, J. Zhang, X. Zhang, L. Huang, Z. Wang, Y. Li, H. Gao, S. Zhu, T. Wang and B. Yang, ACS Appl. Mater. Interfaces, 2012, 4(5), 2775–2780 CrossRef.
- N. D. Patil, P. G. Bange, R. Bhardwaj and A. Sharma, Langmuir, 2016, 32, 11958–11972 CrossRef.
- H. Lama, D. K. Satapathy and M. G. Basavaraj, Langmuir, 2020, 36, 4737–4744 CrossRef PubMed.
- R. Mondal, S. Semwal, P. L. Kumar, S. P. Thampi and M. G. Basavaraj, Langmuir, 2018, 34, 11473–11483 CrossRef.
- P. L. Kumar, S. P. Thampi and M. G. Basavaraj, Soft Matter, 2021, 17, 7670–7681 RSC.
- S. Hariharan, S. P. Thampi and M. G. Basavaraj, Soft Matter, 2023, 19, 6213–6223 RSC.
- S. Hariharan, S. P. Thampi and M. G. Basavaraj, Langmuir, 2024, 40(22), 11650–11660 Search PubMed.
- D. Mampallil and H. B. Eral, Adv. Colloid Interface Sci., 2018, 252, 38–54 CrossRef.
- C. Monteux and F. Lequeux, Langmuir, 2011, 27, 2917–2922 Search PubMed.
- R. Iqbal, B. Majhy, A. Q. Shen and A. Sen, Soft Matter, 2018, 14, 9901–9909 RSC.
- I. Ahmad, H. J. Zandvliet and E. S. Kooij, Langmuir, 2014, 30, 7953–7961 Search PubMed.
- P. Bansal, A. P. Deshpande and M. G. Basavaraj, J. Colloid Interface Sci., 2017, 492, 92–100 CrossRef PubMed.
- M. A. Piechowiak, A. Videcoq, F. Rossignol, C. Pagnoux, C. Carrion, M. Cerbelaud and R. Ferrando, Langmuir, 2010, 26, 12540–12547 CrossRef CAS PubMed.
- A. Aimable, A. Delomenie, M. Cerbelaud, A. Videcoq, T. Chartier, F. Boutenel, T. Cutard and G. Dusserre, Colloids Surf., A, 2020, 605, 125350 CrossRef CAS.
- A. Puertas, A. Fernandez-Barbero and F. De Las Nieves, J. Chem. Phys., 2001, 114, 591–595 CrossRef CAS.
- A. M. Puertas, A. Fernandez-Barbero and F. De Las Nieves, J. Colloid Interface Sci., 2003, 265, 36–43 CrossRef CAS PubMed.
- B. P. Binks, W. Liu and J. A. Rodrigues, Langmuir, 2008, 24, 4443–4446 CrossRef CAS PubMed.
- N. Madhavan, M. Mukherjee and M. G. Basavaraj, Appl. Clay Sci., 2023, 236, 106881 CrossRef CAS.
- N. B. Alsharif, S. Muráth, B. Katana and I. Szilagyi, Adv. Colloid Interface Sci., 2021, 294, 102456 CrossRef CAS.
- D. Parthasarathy, S. P. Thampi, P. Ravindran and M. G. Basavaraj, Langmuir, 2021, 37, 4395–4402 CrossRef CAS.
- J. Y. Kim, K. Cho, S.-A. Ryu, S. Y. Kim and B. M. Weon, Sci. Rep., 2015, 5, 13166 CrossRef CAS.
- A. G. Marin, H. Gelderblom, D. Lohse and J. H. Snoeijer, Phys. Rev. Lett., 2011, 107, 085502 CrossRef.
- D. Parthasarathy, S. Chandragiri, S. P. Thampi, P. Ravindran and M. G. Basavaraj, Soft Matter, 2022, 18, 2414–2421 Search PubMed.
- T. H. Larsen and E. M. Furst, Phys. Rev. Lett., 2008, 100, 146001 CrossRef PubMed.
- R. G. Larson, AIChE J., 2014, 60, 1538–1571 Search PubMed.
- M. Anyfantakis, Z. Geng, M. Morel, S. Rudiuk and D. Baigl, Langmuir, 2015, 31, 4113–4120 CrossRef PubMed.
- H. Li, D. Buesen, R. Williams, J. Henig, S. Stapf, K. Mukherjee, E. Freier, W. Lubitz, M. Winkler and T. Happe, et al. , Chem. Sci., 2018, 9, 7596–7605 Search PubMed.
- K. Zhao, G. Xu, L. Wang, T. Wu, X. Zhang, C. Zhang, Y. Zhao, Z. Li, Y. Gao and F. Du, ACS Appl. Mater. Interfaces, 2023, 15, 37093–37106 CrossRef PubMed.
Footnote |
| † Electronic supplementary information (ESI) available. See DOI: https://doi.org/10.1039/d5sm00226e |
| This journal is © The Royal Society of Chemistry 2025 |