DOI:
10.1039/D5SM00145E
(Review Article)
Soft Matter, 2025,
21, 3670-3687
Interface morphodynamics in living tissues
Received
11th February 2025
, Accepted 2nd April 2025
First published on 8th April 2025
Abstract
Interfaces between distinct tissues or between tissues and environments are common in multicellular organisms. The evolution and stability of these interfaces are essential for tissue development, and their dysfunction can lead to diseases such as cancer. Mounting efforts, either theoretical or experimental, have been devoted to uncovering the morphodynamics of tissue interfaces. Here, we review the recent progress of studies on interface morphodynamics. The regulatory mechanisms governing interface evolution are dissected, with a focus on adhesion, cortical tension, cell activity, extracellular matrix, and microenvironment. We examine the methodologies used to study morphodynamics, emphasizing the characteristics of experimental techniques and theoretical models. Finally, we explore the broader implications of interface morphodynamics in tissue morphogenesis and diseases, offering a comprehensive perspective on this rapidly developing field.

Cheng-Lin Lv
| Cheng-Lin Lv is currently a PhD candidate at Tsinghua University. He received his BS degree (2020) in Engineering Mechanics at Tsinghua University. His current research interests are focused on the collective cell dynamics and tissue interface morphodynamics. |
Bo Li
| Bo Li is a professor at the Department of Engineering Mechanics, Tsinghua University. He earned a PhD degree in Solid Mechanics in 2011 at Tsinghua University. From 2011 to 2014, he worked as a postdoctoral fellow at The Johns Hopkins University. He rejoined Tsinghua University as an associate professor in 2015 and was promoted to a full professor in 2024. His current research interests include cell and tissue mechanics, mechanics of soft materials, and active matter physics. He has co-authored more than 150 journal papers. |
1 Introduction
Tissue interfaces define the boundaries between different tissue types or between a tissue and its external environment. They are present throughout all stages of life, including in vertebrate embryos,1–3 skin layers,4 and blood vessels5 (Fig. 1). These interfaces play critical roles in signal transmission,6 material transport,7 structural support,8,9 and responses to external stimuli.10 Their fundamental importance makes them highly relevant for applications in biomedicine and bioengineering.
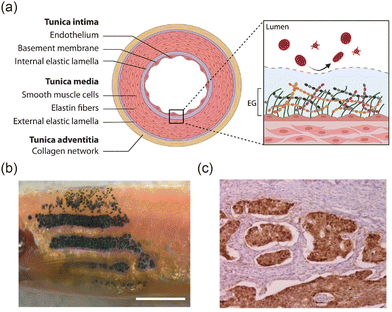 |
| | Fig. 1 Interfaces in living organisms. (a) Interfaces in the cross-section of blood vessels. Reprinted from ref. 5 with permission. Copyright 2022, Elsevier. (b) The interfaces between different pigment cells in zebrafish skin. Reprinted from ref. 11 with permission. Copyright 2016, Springer Nature. (c) Cancer-normal tissue interfaces in an invasive colorectal adenocarcinoma. The tissue section was stained with immunofluorescence using anti-β-catenin antibodies. Brown color indicated cancer tissue, and pink color indicated normal tissue. Reprinted from ref. 12 with permission. Copyright 2005, Springer Nature. | |
The study of tissue interfaces focuses on their topological and physical properties, as well as their evolution over time. This field, known as interface morphodynamics, examines the continuous remodeling and adaptation of tissue interfaces in response to both internal and external factors. The morphodynamics of tissue interfaces plays a crucial role in various biological processes, such as development,13,14 tumor invasion,12,15 and wound healing.16,17 For instance, coordinated cell movements and interface morphology are fundamental in the formation of tissue layers and organ structures,13 while tumor progression depends on the evolving interface between tumors and adjacent healthy tissues.18 In recent years, significant research has focused on understanding the regulatory mechanisms driving interface evolution, with particular attention to factors such as adhesion,19–21 tension,22,23 cell activity,24,25 and the extracellular matrix.15
The study of tissue evolution faces several challenges due to its complex, multifactorial, and multiscale nature. However, advancements in experimental techniques and theoretical models have helped address these challenges. State-of-the-art experimental equipment allows for the dynamic tracking of interface evolution across multiple scales.26,27 Additionally, the application of models such as the vertex model,28,29 deformable polygons (DP) model,30 and active liquid crystal model,31,32 along with other theoretical frameworks, have shed light on the multifactorial interactions governing interface dynamics.
In this review, we examine recent experimental and theoretical advancements in the morphodynamics of tissue interfaces. We begin by classifying tissue interfaces and then explore the key regulators of interface morphodynamics, including adhesion, cortical tension, cell migration, cell activity, extracellular matrix (ECM) composition, and the surrounding microenvironments. We also summarize the experimental approaches and theoretical models used to study these interfaces. Additionally, we discuss the biological significance and potential applications of interface morphodynamics. Finally, we offer perspectives on future research directions in this field.
2 Classification of tissue interfaces
To study the morphology and dynamics of tissue interfaces, it is essential to choose suitable experimental and theoretical models based on the interface characteristics, as well as appropriate parameters for describing the interface. We classify interfaces according to their dimensions and components, and provide an overview of the common parameters used to characterize interface morphology and dynamics.
2.1 Classification by interface dimensions
2.1.1 Two-dimensional interfaces.
The two-dimensional (2D) interfaces, typically studied in 2D systems, are among the most extensively researched in both experiments and simulations.10 Topologically, a 2D interface can be viewed as a line on a plane or surface. Since 2D cell culture has been developed for over a century,33 experimental models for 2D interfaces are well-established, with various preparation methods available. These include creating interfaces through mechanical scratches34,35 or generating tissue encounter interfaces using topological constraints36 (Fig. 2(a)). Compared to three-dimensional (3D) interfaces, 2D interfaces allow for simpler imaging and higher-resolution acquisition without transparency processing. These advantages make 2D interface experiments an effective tool for studying interface morphodynamics.
 |
| | Fig. 2 2D interfaces and 3D interfaces. (a) Experiments of 2D epithelial–cancer interface and its evolution over time. Reprinted from ref. 36 with permission. Copyright 2023, American Chemical Society. (b) Experiments of 3D epithelial interface. Reprinted from ref. 37 with permission. Copyright 2013, The Company of Biologists. | |
Recently, a wealth of theories and simulation models have been developed to explore the evolution of 2D interfaces.32,38–40 These models simplify the analysis by confining both endogenous factors (such as cellular interactions, migration, proliferation, and signaling) and exogenous factors (such as biochemical molecules and substrates) to two dimensions, while still retaining key biological relevance. When solving a 3D problem, discretizing the governing equation in space results in a computational complexity of S(n3). By introducing a reasonable simplification and employing a 2D model, the complexity is reduced to S(n2), significantly enhancing computational efficiency. Additionally, in theories such as vertex models, 2D simplifications streamline the handling of topological transformations. While 2D models provide a coarse-grained representation of real systems, these advantages make them a valuable analytical tool. For example, the evolution of tissue interfaces during wound healing16,17 can be conceptualized as a 2D interface problem, providing in vivo examples that can be tested against in vitro models of interface dynamics.
2.1.2 Three-dimensional interfaces.
In 2D systems, the presence of a substrate significantly influences various properties of collective cell behavior, including deformation, topology, and dynamics, which are affected by factors such as substrate stiffness and surface structure.41,42 However, substrates of this kind are rarely found in real environments, limiting the consistency between results from 2D systems and in vivo conditions. To overcome these limitations, researchers have developed a range of 3D cellular systems that more accurately replicate the in vivo environment. As shown in Fig. 2(b), materials such as matrix gels,43,44 hydrogels,45,46 microfluidic chips,47,48 and biopolymer scaffolds49 are used to construct 3D cell systems. Over the past decade, there has been increasing interest in developing 3D multicellular interfaces, both between tissues and between tissues and their extracellular matrix (Fig. 2(b)), to better mimic in vivo conditions.33 Compared to 2D interfaces, 3D interface experiments and simulations more accurately represent interface evolution in living organisms. Notably, 3D interfaces enable the investigation of local curvature effects and topological properties, whereas 2D interfaces are restricted to analyzing average curvature and cannot fully capture the complexity of curvature-driven dynamics in 3D biological systems. For example, 3D interfaces and their morphological and dynamic properties have been extensively studied in areas such as mouse neural tube development,50 epithelial cell invasion,51 and tumor invasion.52–54 Despite challenges in imaging accuracy, quantitative analysis, and model complexity, these studies demonstrate the potential of 3D interface systems in revealing interface evolution and its mechanisms in vivo.
2.2 Classification by components
2.2.1 Single-tissue interfaces.
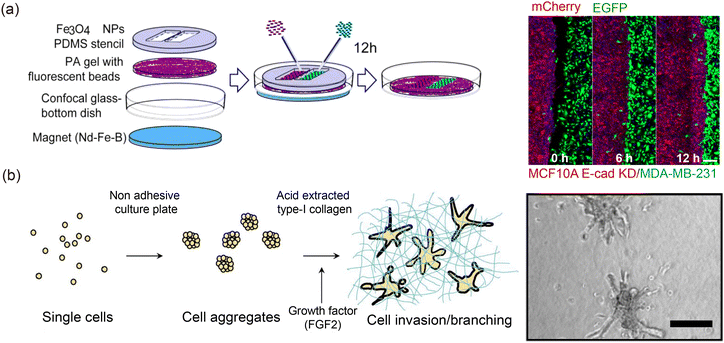
Tissues and the ECM, which represents the external environment, are the primary components of tissue interfaces. Based on the number of tissue components on both sides of the interface, they can be classified into single-tissue and double-tissue interfaces. Single-tissue interfaces are formed between a tissue and the external environment, such as the advancing front of spreading cell monolayers55,56 and the outer boundary of 3D tumor spheroids.15,52,57In vitro, the formation of single-tissue interfaces can result from spontaneous tissue growth58 or controlled destructive methods like barrier removal59,60 and laser ablation.61 In simulations, the evolution of single-tissue interfaces is often studied using single-phase theory.62 However, since both tissue properties63,64 and external environmental factors15 jointly govern the morphological dynamics of single-tissue interfaces, some models incorporate viscoelastic or similar characteristics of the external environment, effectively describing single-tissue interfaces using a quasi-biphasic model.65 Single-tissue interfaces provide a valuable platform for studying tissue responses to changes in the external environment, advancing our understanding of tissue integrity58 (Fig. 3(a)) and lumen formation66 (Fig. 3(b)).
 |
| | Fig. 3 Single-tissue interface and double-tissue interface. Wound healing (a) and hole nucleation (b) are typical models of single-tissue interface evolution. (a) Reprinted from ref. 58 with permission. Copyright 2015, Springer Nature. (c) Double-tissue interface between normal tissue (MCF 10A) and cancer tissue (MDA-MB-231). Reprinted from ref. 67 with permission. Copyright 2021, IOP Publishing Ltd. (d) Double-tissue interface in a multilayered sphere formed in cell sorting process. Reprinted from ref. 68 with permission. Copyright 2018, The American Association for the Advancement of Science. | |
2.2.2 Double-tissue interface.
The double-tissue interface forms between two distinct types of tissues, such as the interlayer interface between different germ layers1–3 or the interface between tumor and normal tissue12,18,69 (Fig. 3(c)). Cell sorting is a key mechanism in the formation of double-tissue interfaces.70–72 This process often involves differences in characteristic properties, such as adhesion73–75 and cortical tension,22 which contribute to the interface formation (Fig. 3(d)). Additionally, specific topological constraints can promote the free spreading of tissues, leading to the development of double-tissue interfaces.76–78 Theories like the differential adhesion hypothesis (DAH),19,71 differential surface contraction hypothesis (DSCH),79,80 and differential interfacial tension hypothesis (DITH)81,82 have been pivotal in explaining the mechanisms behind double-tissue interface formation and evolution. For instance, Guan et al. constructed an epithelial–cancerous interface and demonstrated that the competition between cancerous and epithelial tissues governed the evolution of the double-tissue interface, highlighting the critical role of DAH.36
2.3 Quantification of interface morphodynamics
Following the classification of tissue interfaces, it is essential to quantify their topography and dynamics in order to accurately capture their properties. As shown in Table 1, this subsection reviews the commonly used parameters for quantifying interface morphodynamics, focusing on geometric, dynamic, and mechanical aspects.
Table 1 Parameters of morphodynamics
| Parameters |
Description |
Formula |
| Curvature |
The degree of a surface or a curve deviating from a flat one |
2D, κ = 1/R |
| 3D principal curvature, κ1 = 1/R1, κ2 = 1/R2 |
| 3D mean curvature, κH = (κ1 + κ2)/2 |
| 3D Gaussian curvature, κK = κ1κ2 |
| Roundness |
The degree to which the shape deviates from the perfect circle |
Roundness = 4πA/P2 |
| Fractal dimension |
The degree of self-similarity of the interface |
D = log![[thin space (1/6-em)]](https://www.rsc.org/images/entities/char_2009.gif) N/log(1/ε) N/log(1/ε) |
| Displacement |
The evolution of interface position with time |
u(X,t) = x(X,t) − X |
| Velocity |
The degree of interface evolution |
v
|
| Anchoring angle |
Cell orientation at the interface |

|
| Stress tensor |
Stress at the interface |
σ
|
| Modulus |
The ability of the tissue near the interface to resist deformation |
E = E′ + iE′′ |
2.3.1 Curvature, roundness and fractal dimension.
Geometrical parameters, including curvature, roundness, and fractal dimension, are essential for quantifying the morphology of interfaces. Curvature intuitively measures the deviation of an interface from being a straight line or a plane.83 For a 2D interface, the curvature (κ) at a point B is the reciprocal of the radius (R) of the osculating circle:with the sign determined by the circle's position relative to the interface. For 3D interfaces, curvature is defined by the curvature of the common curve of any plane containing a normal vector at point B. The principal curvature, κ1 and κ2, represent the maximum and minimum values, respectively, while the mean curvature
and the Gaussian curvature
are also commonly used. Experimental and computational studies of embryonic development have shown a correlation between interface curvature and the emergence of branching morphologies.
84,85
While curvature characterizes local topological features, roundness quantifies how closely the shape of a 2D interface approximates a perfect circle, capturing its global topological properties.25,86 Roundness is typically defined as
where
A is the area enclosed by the interface and
P is its perimeter. In three dimensions, this concept is extended by introducing sphericity. In contrast to curvature and roundness, the fractal dimension offers a more comprehensive measure of the complexity and self-similarity of the interface.
87 The fractal dimension is defined as
| | | D = logN/log(1/ε) | (5) |
where
N is the number of self-similar pieces and
ε is the scaling factor. As illustrated in
Fig. 4(a),
32 fractal dimension values are obtained by box-counting method. The stable interface presents the lowest fractal dimension values, while the finger-like interface displays a larger dimension value and the largest one corresponds to the mixing interface. In addition to the aforementioned ones, other parameters, such as roughness,
88 local characteristic length, angle,
51 and genus,
50 are also used to describe the morphology of interfaces.
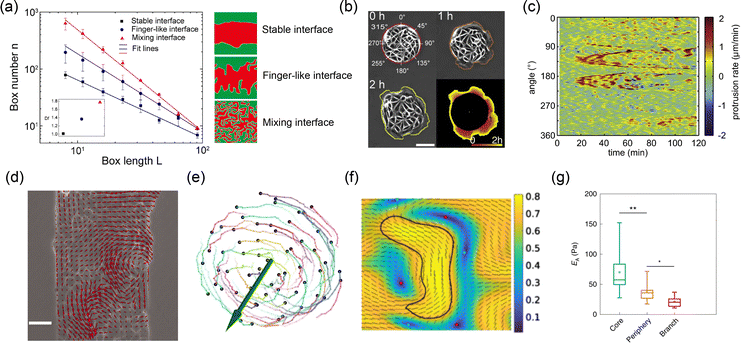 |
| | Fig. 4 Various parameters describing the morphology and dynamics of the interface. (a) Fractal dimension of different tissue–tissue interfaces. Reprinted from ref. 32 with permission. Copyright 2022, National Academy of Sciences. (b) Trajectory of interface evolution over time. (c) Kymograph of interface protrusion rates. (b) and (c) Reprinted from ref. 89 with permission. Copyright 2012, Elsevier. (d) Velocity field at the interface and inside the tissue in wound healing model of epithelial tissue. Reprinted from ref. 55 with permission. Copyright 2007, National Academy of Sciences. (e) Time series of cell trajectories in a cell spheroid. Reprinted from ref. 54 with permission. Copyright 2023, Springer Nature. (f) Orientation field at the interface and inside the phase in a phase separation simulation. Reprinted from ref. 90 with permission. Copyright 2023, American Physical Society. (g) Modulus of cells near the interface and inside the tumor sphere. Reprinted from ref. 52 with permission. Copyright 2020, Springer Nature. | |
2.3.2 Displacement, trajectory and velocity.
Dynamic parameters such as displacement, trajectory, and velocity are essential for describing the temporal evolution of interfaces. Displacement, one of the most fundamental quantities in dynamics, characterizes the movement of an interface over time.25,89,91 The displacement of an interface u at a point X and time t is defined aswhere X is the initial position of the interface, x is the current position. For clearer representation, the interface morphology at different time points can be plotted on a single diagram to generate an interface trajectory diagram36,66,89 (Fig. 4(b)). By analyzing this trajectory, the dynamic nature of the interface can be revealed.25
The intensity of the interface's evolution is further characterized by the velocity v and trajectory of the cells near the interface.55,64,66,89,92 As illustrated in Fig. 4(d), velocity can be obtained through particle image velocimetry analysis of phase-difference time-lapse images.55,93 In this method, the system is treated as a continuous fluid, and the instantaneous velocity of each point is calculated via cross-correlation.94,95 The cell trajectories are determined using a tracking algorithm that iteratively screens distances to establish the correspondence of cells at different time points.36,54 Quantitative analysis of the velocity field and cell trajectories near the interface has revealed phenomena such as coherent flow25 and global rotation44,54 (Fig. 4(e)), highlighting the distinctive collective behaviors of cells near the interface. The fluctuating nature of the interface can also be captured by plotting the kymograph of displacement or velocity.89,91 As shown in Fig. 4(c), the band structure in the kymograph reflects deformation waves propagating along the interface.89 These fluctuations can be quantitatively described using parameters such as dynamic structure factors.91
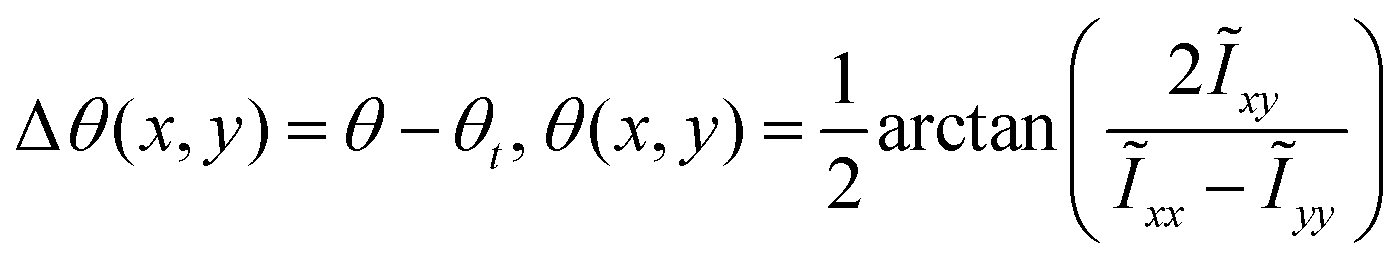
2.3.3 Orientation and interfacial anchoring.
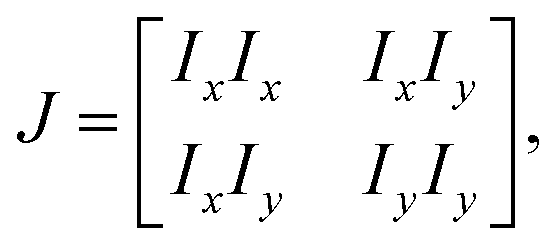
In certain situations, cells or cytoskeletons adopt elongated shapes, similar to the configuration of liquid crystal molecules.31,96 The orientation field of cells and cytoskeletons near the interfaces can be analyzed using principles from liquid crystal theory.32,97,98 For the phase contrast image matrix I of the cells near the interfaces, the local structure tensor J is formulated by99,100| |  | (7) |
where Ix and Iy are the gradient of I along x and y-directions. A smoother structure tensor ![[J with combining tilde]](https://www.rsc.org/images/entities/i_char_004a_0303.gif) is obtained by Gaussian filtering:
is obtained by Gaussian filtering:| |  | (8) |
The orientation angle θ(x,y) is computed by:
| |  | (9) |
As shown in
Fig. 4(f), the color map represents the distribution of organizational order, with short line segments indicating local tissue orientation and the closed curve delineating the interface between two phases. To quantify cellular arrangement at the interface, the interfacial anchoring angle is introduced as
where
θt represents the angle of the tangent vector.
101 This parameter defines the relative angle between the orientation of the cells near the interface and the tangential direction of the interface. Interfacial anchoring has a profound effect on the movement of cells near the interface and in the generation of interfacial tension.
90,102 Tangential anchoring, where Δ
θ = 0, is the most common configuration in interface problems.
32 In some scenarios, normal anchoring (Δ
θ = π/2) can emerge over time, especially as the system transitions from two-dimensional to three-dimensional structures.
103,104 Due to the effects of adhesion, anisotropy in cell shape, and dynamic interactions, chiral anchoring may also arise, with angles between 0 and π/2,
105–107 which can mediate global rotation
108 or local fluctuations at the interface.
106
2.3.4 Force, stress and elasticity.
The mechanical properties of interfaces are characterized by the distribution of forces, stress, and elasticity near the interface. Traction force T describes the interaction between the tissue and the substrate near the interface.66,109 By measuring the force exerted by the tissue on the soft substrate and applying Newton's third law, the external force on the interface can be inferred. Interface tension Fσ is an internal force that represents the macroscopic effect of cytoskeletal contraction forces in cells near the interface.
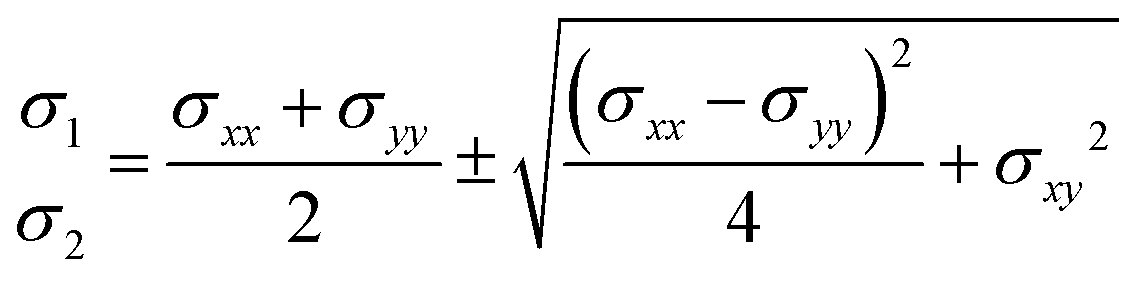
In 2D situation, stress tensor σ can be simplified as:
| |  | (11) |
where
σxx,
σyy and
σxy are the components of the stress tensor. Under reasonable assumptions, the stress at the interface can be derived using equilibrium equations and the Cauchy formula.
76 The stress tensor contains both the extreme values of stress and directional information, expressed as:
| |  | (12) |
| |  | (13) |
where
σ1 and
σ2 represent the principal stresses.
36 The forces and stress at the interface can directly drive its evolution
110,111 or interact with biochemical signals, resulting in wave-like signal propagation tangentially or normally to the interface.
112
The modulus E quantifies the tissue's resistance to deformation near the interface. Since biological tissue is generally viscoelastic, the complex modulus is introduced for a more accurate description,113 given by E = E′ + iE′′, where E′ is the elastic modulus, E′′ is the loss modulus. The measurement and study of interface and tissue moduli provide valuable insights into the formation of spatial heterogeneity during development52 (Fig. 4(g)).
3 Regulatory mechanisms of interface morphodynamics
The morphological evolution of interfaces is influenced by a variety of factors, such as adhesion, cortical tension, cell migration, cellular activity, ECM interactions, and microenvironmental conditions. In the following sections, we will explore how these factors, both individually and in combination, shape the dynamics of the interface, affecting its stability, adaptability, and overall morphology.
3.1 Adhesion
Adhesion plays a pivotal role in the interactions between cells and between cells and ECM.114 Intercellular adhesion is primarily mediated by cadherins115 and nectins,116 while cell–ECM adhesion is largely driven by integrins.117 These adhesion mechanisms are crucial in the formation and evolution of tissue interfaces.118 According to the DAH,71,119,120 in hybrid systems, cells with weaker intercellular adhesion tend to form a shell around cells with stronger adhesion. Based on this concept, the self-organization of complex structures and interfaces can be realized by designing synthetic adhesion molecules118 (Fig. 5(a)). Changes in adhesion significantly impact the morphodynamic properties of interfaces. For instance, during the epithelial-to-mesenchymal transition (EMT), epithelial cells transition into mesenchymal cells with reduced adhesion and increased motility, which in turn intensifies the dynamics of interface evolution.121,122 In cancer–normal tissue interface models (Fig. 5(b)), the downregulation of E-cadherin in normal cells smooths the interface, while the downregulation of P-cadherin enhances the invasive potential of cancerous tissues.36 This differential regulation provides valuable insights for developing strategies to prevent cancer metastasis. Furthermore, adhesion plays a critical role in regulating in vivo interface development. For example, in mouse embryonic salivary glands, strong cell–matrix and weak intercellular adhesion synergize to drive epithelial budding, initiating branching morphogenesis123 (Fig. 5(c)). Similarly, in C. elegans gonadal morphogenesis, asymmetric adhesion regulates interface elongation and directional turning.124
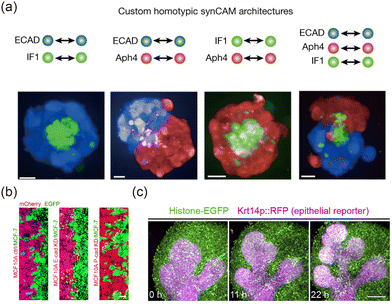 |
| | Fig. 5 Effects of cell adhesion on tissue interfaces. (a) By designing synthetic cell adhesion molecules, various 3D structures and interfaces can be induced. Reprinted from ref. 118 with permission. Copyright 2023, Springer Nature. (b) Down-regulating the expression of specific E-cadherin molecules can change the morphology of the epithelial–cancer interface. Reprinted from ref. 36 with permission. Copyright 2023, American Chemical Society. (c) Morphogenesis of a mouse salivary gland. Reprinted from ref. 123 with permission. Copyright 2021, Elsevier. | |
3.2 Cortical tension
Cortical tension, which is the contractile force generated by the cell cortex,125 plays a critical role in maintaining the stability of tissue interfaces.110 As shown in Fig. 6(a), an increase in cortical tension reduces the roughness of the interface between the dorsal and ventral compartments in the Drosophila wing.88 In wound healing, one of the driving force behind interfacial evolution arises from the formation of purse-string structures composed of actomyosin in cells near the interface126 (Fig. 6(b)). Theoretical studies also show that when neighbor exchange occurs at double-tissue interfaces, differences in cortical tension cause resilience and help maintain the interface's integrity.29 Given the structural linkage between the cytoskeleton and adhesion proteins, cortical tension and adhesion can synergistically regulate interface morphology in certain contexts.115 Studies have shown that cadherins interact with actomyosin under the regulation of extracellular biochemical signals, resulting in changes in contractility, skeletal rearrangement, and cortical tension.127,128 This process is considered a form of mechanical polarization, which shapes both tissue–tissue and tissue–ECM interfaces.129 For example, during zebrafish gastrulation, cortical tension controls the expansion of cell–cell contacts, while cell adhesion provides a scaffold for cortical tension, driving cell sorting.22
 |
| | Fig. 6 Effects of cortical tension on tissue interfaces. (a) Increased cortical tension smooths the tissue interface. Reprinted from ref. 88 with permission. Copyright 2012, Elsevier. (b) Characterization of purse-strings at the leading edge of epithelial cell sheets. Reprinted from ref. 126 with permission. Copyright 2012, National Academy of Sciences. | |
3.3 Cell migration
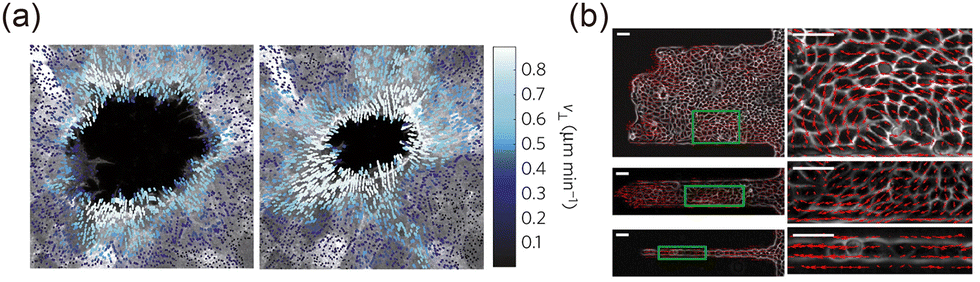
Cell migration underpins the self-organization of cellular populations and plays a crucial role in interface evolution. At tissue interfaces, migration occurs in both collective and individual modes. Collective migration, prevalent in epithelial tissues, enables large-scale movement while preserving tissue integrity and is a key driver of interface evolution in wound healing.34 Some studies indicate that collective migration and the purse-string mechanism mentioned above interact dynamically during wound healing. Brugués et al.130 demonstrated that collective migration dominates the early healing phase (Fig. 7(a)), while the purse-string mechanism becomes prominent once stable intercellular connections form. Curvature further modulates their interplay: negative curvature aligns migration with contractile forces, enhancing healing efficiency, whereas positive curvature creates antagonism, reducing efficiency.58 In contrast, individual migration, typical of cancer and mesenchymal cells, contributes to interface instability.15 EMT facilitates the shift from collective to individual migration, accelerating interface evolution.131 Moreover, variations in migration rates and specific collective movement patterns (Fig. 7(b)) can induce interfacial instabilities, such as the fingering instability observed in both developmental and cancerous tissues.132
 |
| | Fig. 7 Effects of cell migration on tissue interfaces. (a) Cell velocity field near the wound healing interface. Reprinted from ref. 130 with permission. Copyright 2014, Springer Nature. (b) Different collective cell migration modes and corresponding interface morphologies. Reprinted from ref. 132 with permission. Copyright 2012, National Academy of Sciences. | |
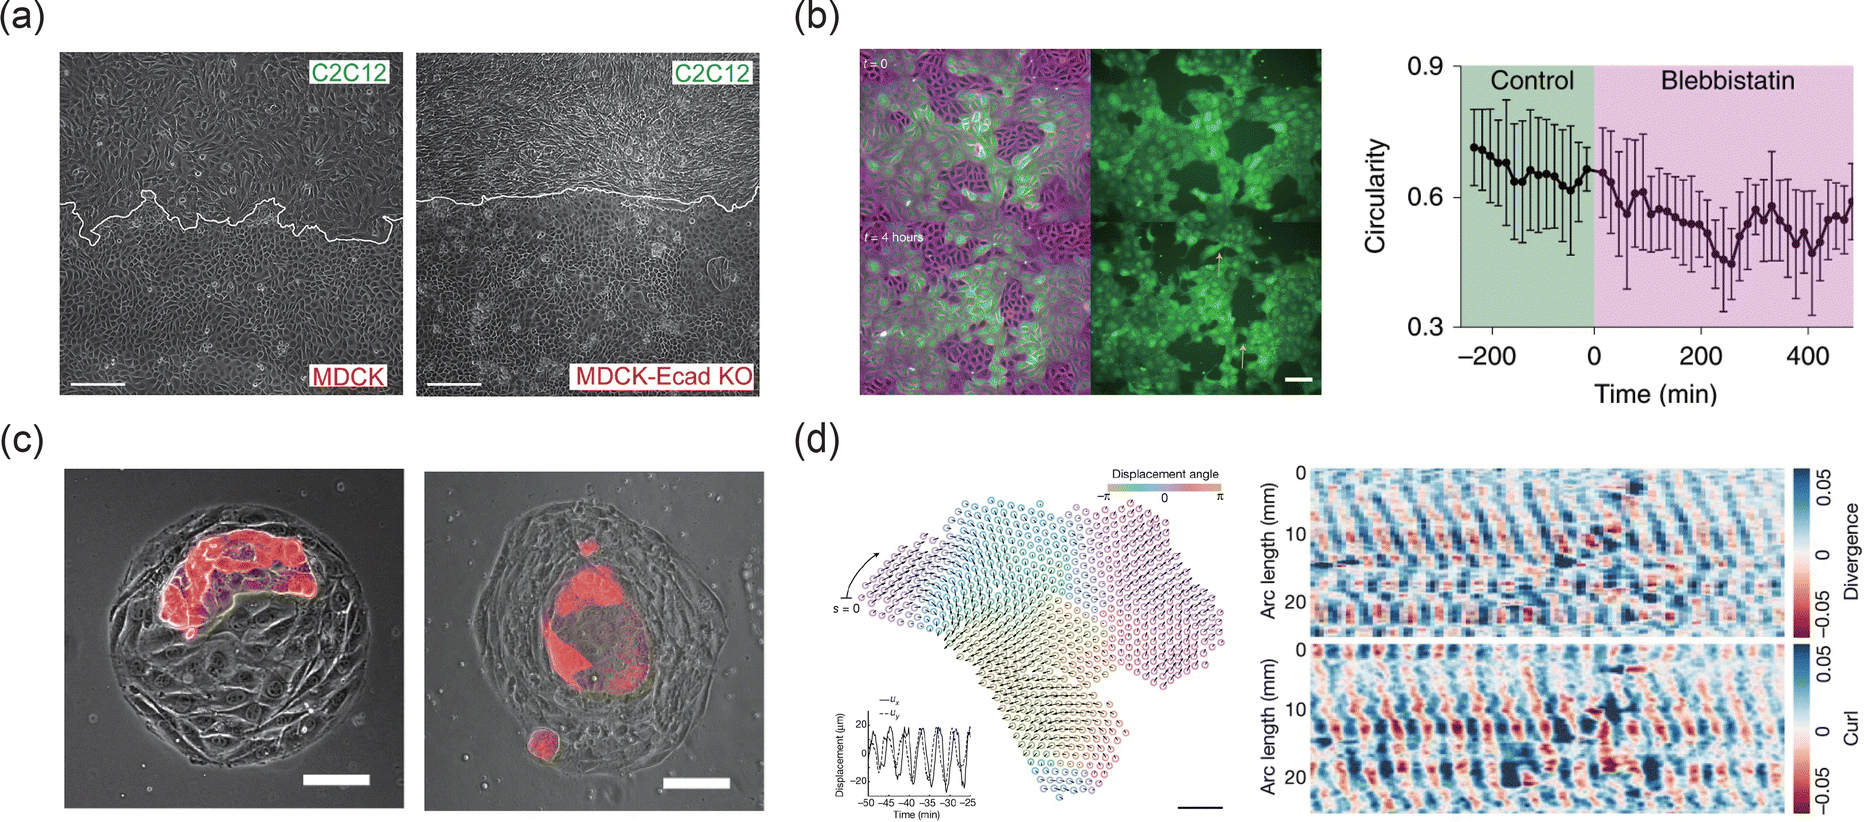
3.4 Cell activity
Living tissues can be considered as active matter, undergoing continuous movement and deformation driven by cellular activity.31,133,134 Due to the contraction of actomyosin, individual cells behave as contractile force dipoles.135 In cellular monolayers, active behaviors vary: contractile cells (e.g. C2C12, NIH 3T3) exhibit contractile activity,136,137 while MDCK and neural progenitor cell monolayers display extensile activity, with net forces elongating cells along their long axis.97,98 In recent years, cellular activity has garnered increasing attention in explaining the evolution of tissue interfaces. Zhang et al.32 investigated how activity differences between two tissues influence interface stability, finding that the movement of topological defects excited by cellular activity can drive morphological changes at the interface (Fig. 8(a)). Balasubramaniam et al.24 revealed how MDCK monolayers transition from extensile to contractile activity, uncovering the mechanisms behind interface formation and stability during morphogenesis (Fig. 8(b)). Beyond the nature of cellular activity, the strength of activity can also drive the transition of an interface from static to dynamic25 (Fig. 8(c)), influencing its topological complexity and dynamic properties.38,138 In some cases, specialized forms of activity can lead to intriguing morphological evolution at the interface. A notable example is chiral activity, which involves spontaneous symmetry breaking in cell–cell interactions.139 As shown in Fig. 8(d), chiral activity induces oscillatory patterns that propagate along the interface within tissues, such as those found in starfish embryos.140 When chiral activity is present on both sides of the interface, traveling waves can emerge, and topological defects may form in a sandwich-like arrangement.141
 |
| | Fig. 8 Effect of activity on the morphology and dynamics of interfaces. (a) and (b) The distinct active natures can affect the roughness (a) and circularity (b) of the tissue–tissue interfaces. (a) Reprinted from ref. 32 with permission. Copyright 2022, National Academy of Sciences. (b) Reprinted from ref. 24 with permission. Copyright 2021, Springer Nature. (c) The intensity of activity can affect the evolution of interface morphology with time. Reprinted from ref. 25 with permission. Copyright 2024, Springer Nature. (d) Fluctuations of strain components divergence and curl along the single-phase interface. Reprinted from ref. 140 with permission. Copyright 2022, Springer Nature. | |
3.5 Extracellular matrix
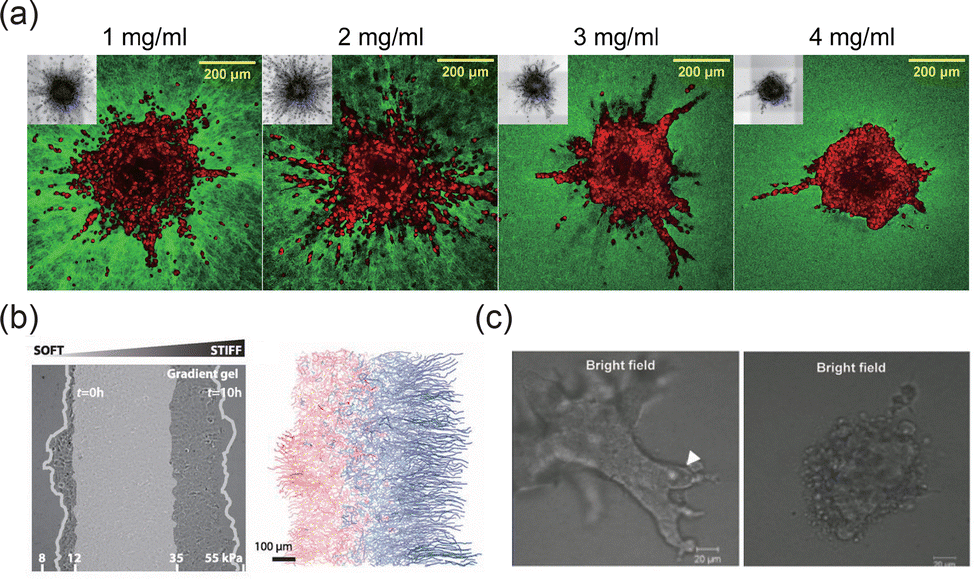
The ECM is composed of a complex network of components, such as collagen, elastin, and laminins, which provide structural support and mediate biochemical signaling.142,143 The concentration and composition of ECM components can significantly influence the morphology of tissue interfaces. For instance, increased structural protein concentration can mediate the transition to an invasive phenotype in tumor spheroids, resulting in smoother 3D interfaces (Fig. 9(a)).15 The mechanical properties of the ECM, such as stiffness, also play a crucial role in shaping interface morphology and its adaptability.114 Cancer cells, for example, exhibit more aggressive metastasis on stiffer ECM substrates,144 which may lead to rougher interfaces that facilitate cancer cell invasion and migration. Additionally, ECM stiffness gradients can induce cell durotaxis, promoting asymmetric evolution of the interface morphology (Fig. 9(b)).42,145 In these processes, integrins mediate cellular force perception of the ECM by linking ECM ligands to the cytoskeleton.146 Through integrin signaling, extracellular mechanical cues activate proteins such as focal adhesion kinase (FAK), Rho, and Rho-associated protein kinase (ROCK), facilitating adhesion plaque maturation and stress fiber formation.143 This mechanotransduction extends to the nucleus, where intracellular forces alter nuclear membrane tension, open nuclear pores, and enable YAP nuclear translocation, driving phenotypic changes. This coupling mechanism underlies the diverse morphologies and evolution of tissue interfaces in different ECM environments. Tissue cells remodel the ECM during interface evolution, with matrix metalloproteinases (MMPs) and other enzymes degrading ECM components to facilitate cell migration and interface rearrangement.37 As shown in Fig. 9(c), the regulation of tissue interface morphology can be modulated by promoting or inhibiting MMP activity.51
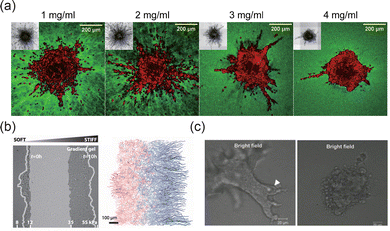 |
| | Fig. 9 Effects of ECM on the morphodynamics of interfaces. (a) Collagen fiber density induced the switch in MDA-MB-231 invasive phenotype. Reprinted from ref. 15 with permission. Copyright 2021, Elsevier. (b) Asymmetric evolution of the human mammary epithelial tissue interface (MCF 10A) on a substrate with stiffness gradient. Reprinted from ref. 42 with permission. Copyright 2016, The American Association for the Advancement of Science. (c) MMP inhibitor inhibits the collective invasion of epithelial cells (EpH4 cells). Reprinted from ref. 51 with permission. Copyright 2011, Oxford University Press. | |
3.6 Microenvironment
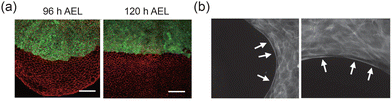
The tissue microenvironment comprises a variety of chemical, physical, and biological factors that influence cellular behavior.110,147 Gradients of morphogens and growth factors play a crucial role in directing the organization of tissue boundaries. For instance, under hypoxic conditions, the upregulation of vascular endothelial growth factor stimulates endothelial cells in existing blood vessels to become active, promoting sprouting of new vessels and the formation of dynamic interfaces.148,149 As illustrated in Fig. 10(a), hepatocyte growth factor (HGF) can drive the evolution of 3D epithelial–ECM interfaces into branching structures.150–152 Similarly, retinoic acid (RA) supports the formation of neural tubes153 and enhances the topological complexity of neuroepithelial organoid interfaces in mice50 (Fig. 10(b)). Tumor tissues can also stimulate the formation of vascular networks and tissue–tissue interfaces, depending on nutrient availability within the microenvironment.154–156
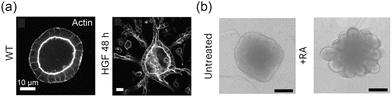 |
| | Fig. 10 Growth factors in the microenvironment complicate tissue interfaces to perform specific functions. (a) HGF promotes the bifurcation structure of MDCK cell spheres. Reprinted from ref. 152 with permission. Copyright 2018, Rockefeller University Press. (b) Neuroepithelial organoids with different morphologies were generated in the presence or absence of RA. Reprinted from ref. 50 with permission. Copyright 2023, Springer Nature. | |
4 Methods for studying interface evolution
Experimental techniques and theoretical simulations are the two main approaches used to investigate tissue interface dynamics. Experimental methods enable direct observation and manipulation of tissue interfaces, while theoretical models provide predictive insights and a deeper understanding of the underlying principles governing interface behaviors. In the following, we review the key experimental methodologies and techniques, along with theoretical modeling approaches.
4.1 Experimental approaches
4.1.1 Live cell imaging and immunofluorescence staining imaging.
Experimental techniques for studying tissue interface dynamics include live imaging, biochemical assays, and biophysical measurements. As early as the 1980s, light and transmission electron microscopy were employed to investigate interface morphology,157 highlighting the long history of interface research. Optical imaging remains a key method for studying the evolution of interface morphodynamics, encompassing live cell imaging and immunofluorescence staining. Live cell imaging, utilizing advanced microscopy techniques such as confocal and light sheet microscopy, captures high-resolution images of cell movements and interface changes over time.36,66 Immunofluorescence employs antigen–antibody interactions to identify subcellular structures, with fluorescent markers for specific proteins (e.g. actin for cytoskeletal dynamics and cadherins for adhesion sites) enabling precise tracking of cellular factors158 (Fig. 11(a)). Coupled with image recognition and processing techniques, morphodynamic parameters such as curvature, displacement fields, velocity fields, and orientation fields can be extracted.
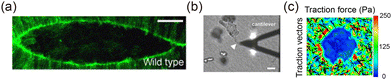 |
| | Fig. 11 Experimental methods of interface morphodynamics. (a) Actin labeling during embryonic dorsal closure. Reprinted from ref. 159 with permission. Copyright 2005, Elsevier. (b) The ECM stiffness near the 3D interface is measured by AFM. Reprinted from ref. 51 with permission. Copyright 2011, Oxford University Press. (c) The traction force near the hole interface is characterized by TFM. | |
4.1.2 Atomic force microscopy and traction force microscopy.
Measurement techniques such as atomic force microscopy (AFM) and traction force microscopy (TFM) are widely utilized to assess interface mechanics. AFM operates by pressing a probe into the cell surface and extracting the Young's modulus of cells and tissues based on the relationship between pressing depth and applied load160 (Fig. 11(b)). The pressing depth is defined as the displacement of the cantilever minus its deformation, while the load is determined from the cantilever's deformation.161,162 Data processing methods, such as those based on Hertz theory, are commonly applied to AFM data to calculate the Young's modulus.163–165 More recently, techniques like optical tweezers166 and magnetic tweezers167 have been developed and applied. For instance, optical tweezers enable the characterization of the Young's modulus at or near the interface of 3D tumor spheroids, bridging a gap in 3D mechanical measurements.52
TFM is a powerful technique for characterizing the traction forces at tissue interfaces.168 This method involves using a light microscope to directly capture the position of fluorescent particles embedded in a substrate, computing the displacement field following the application of traction forces. By applying elasticity theory, the traction field can then be reconstructed168–171 (Fig. 11(c)). Building on this, advanced technologies such as ultra-high-resolution traction microscopy, which offers enhanced spatial resolution,172,173 3D traction microscopy, capable of measuring forces in three dimensions,174,175 and cell monolayer stress microscopy, which enables the calculation of interfacial stress, have been developed.36,176
4.1.3 Pharmacological manipulation.
While the experimental techniques and measurement methods discussed above can effectively describe the topological and dynamic properties of tissue interfaces, they do not capture the biochemical factors that influence interface dynamics. In particular, biochemical signaling pathways, which regulate cellular processes such as adhesion, motility, and force generation, play a critical role in modulating interface stability and dynamics. Pharmacological manipulation enables researchers to selectively modify cellular behaviors with specific agents, providing insights into how biochemical signals influence tissue interface morphodynamics. As an illustration, Y27632 can inhibit ROCK and thus disrupts actomyosin contractility.24 Similarly, Blebbistatin is a myosin II inhibitor that also specifically blocks actomyosin contractility.24 These agents are frequently employed in studies exploring the impact of cortical tension or cellular activity on the evolution of tissue interfaces. Additionally, GM6001, an MMP inhibitor that interferes with extracellular matrix remodeling,51 can modify the interaction between cell tissue and ECM. These targeted modulations of cellular behavior allow researchers to investigate the underlying biochemical regulation of tissue interface dynamics more comprehensively, providing a valuable approach to better understanding the cellular and molecular mechanisms that govern tissue organization and adaptation during development, homeostasis, and disease.
4.2 Theoretical approaches
Theoretical approaches, such as discrete and continuum models, provide a framework for modeling tissue morphodynamics under various conditions, allowing for predictions of interface behavior based on physical and biochemical principles. Discrete models represent individual cells or boundaries as finite elements, while continuum models treat tissue interfaces as continuous entities, influenced by the underlying field properties.
4.2.1 Discrete models.
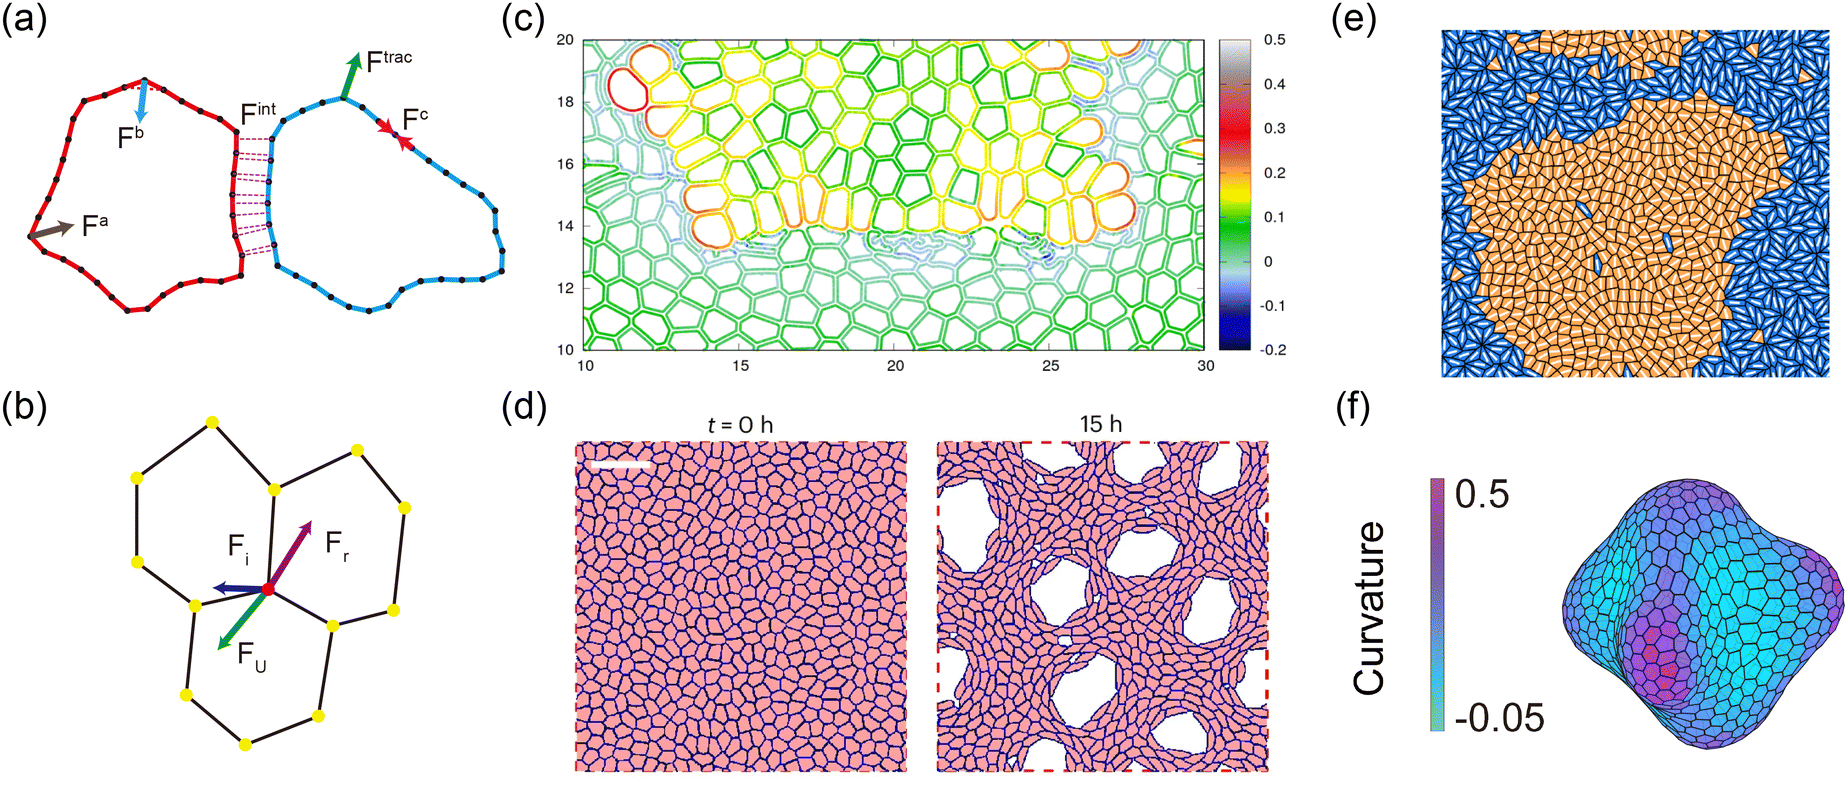
Discrete models, such as the deformable polygon (DP) model30 and the vertex model,29 are crucial for simulating interface dynamics. Unlike continuum models, discrete models emphasize the role of individual cell properties in shaping interface behavior, enabling the exploration of how factors such as adhesion strength, shape constraints, and other cell characteristics affect interface stability and evolution. The DP model, a lattice-based approach, simulates cell shape and interactions by assigning energy to each cell based on adhesion, area, and other factors. In the DP model, cells are represented as deformable polygons composed of Nv vertices177,178 (Fig. 12(a)). The total shape energy of the system Ushape can be expressed as:66,179| |  | (14) |
where lm,i = |rm,i − rm,i+1| is the length of the i section of the cell numbered m. l0 = p0/Nv is the equilibrium length of the cell side length, and p0 is the cell perimeter. kc is the modulus resisting length changes. am and a0 are the current and reference areas of the cell, respectively. ka is the areal modulus. kb is the bending modulus of the cell boundary. θ〈i−1,i+1〉 stands for the angle between adjacent edges. The motion of the vertexes is governed by the overdamped Langevin equation:| | 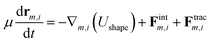 | (15) |
where μ is the damping coefficient, ∇m,i is the gradient operator, and Fintm,i and Ftracm,i denote the force created by the cell–cell interaction and the traction, respectively. Intercellular forces and traction require a flexible choice of models depending on the problem being studied.180–183 Using the DP model, the evolution of double-tissue interfaces between soft and hard tissues30 (Fig. 12(c)) and matrix stiffness-regulated holes formation have been investigated66 (Fig. 12(d)).
 |
| | Fig. 12 Examples of discrete models in the study of interface morphodynamics. (a) Sketch of DP model. (b) Sketch of vertex model. (c) DP model simulation results of interface between soft and hard tissues. Reprinted from ref. 30 with permission. Copyright 2021, American Physical Society. (d) Time-lapse of hole expansion in DP model simulation. Reprinted from ref. 66 with permission. Copyright 2024, Springer Nature. (e) Tissue–tissue interfaces mediated by cell sorting in the vertex model. Reprinted from ref. 38 with permission. Copyright 2024, American Physical Society. (f) Morphological evolution of 3D multicellular spherical shells. | |
The vertex model, another widely used discrete modeling approach for simulating tissue interfaces, represents cells as polygons, with each vertex serving as a connection point between neighboring cells. This model allows for the control of cell shape and tissue structure, providing insights into the mechanics of interface dynamics184,185 (Fig. 12(b)). The mechanical energy of vertex model can be described as186–188
| | 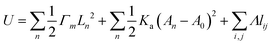 | (16) |
where
Ln and
An are the perimeter and area of the cell, respectively.
Γm is the perimeter coefficient,
Ka is the areal modulus and
Λ is the interfacial tension coefficient.
A0 is the preferred area and
lij is the edge length between vertices
i and
j. The motion of the vertex is governed by
| |  | (17) |
where
ri is the coordinate of the vertex
i,
η is the friction coefficient, and
Fi represents other non-potential force.
Recently, biochemical signaling pathways have been incorporated into discrete models to better understand tissue dynamics.189–191 Typically, a reaction–diffusion equation is introduced to describe the spatiotemporal evolution of biochemical factors within the system,192 as shown in the equation below:
where
c(
x,
t) represents the concentration of biochemical factors, which can be simplified to a scalar for a single factor.
D is the diagonal matrix of the diffusion coefficient, and
R denotes the biochemical reaction. These equations are further integrated into the energy formulation to correlate biochemical concentrations with various system properties.
The vertex model has proven effective in elucidating mechanisms underlying interface evolution in processes such as cell sorting29 (Fig. 12(e)), epithelial folding,193 and wound healing.16 Additionally, recent advancements have led to the development of 3D discrete models, offering a robust method to study the evolution of 3D interfaces in vivo28,194–196 (Fig. 12(f)).
The key distinction between the DP model and the vertex model lies in their treatment of intercellular adhesion. In the DP model, intercellular adhesion is simplified as the interaction between the vertices of neighboring cells, with forces including both tangential and normal components along the boundary.66,197 In contrast, the vertex model simplifies intercellular adhesion as boundary tension, as adjacent cells share a common boundary, and the tension is directed along the boundary.125,186
4.2.2 Continuum models.
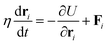
Continuum models treat tissue interfaces as smooth entities influenced by force or concentration fields, making them ideal for studying large-scale tissue deformation or complex flow dynamics. In the context of multicellular interfaces, active liquid crystal theory has been developed to simulate interface behavior. In this approach, a scalar parameter, φ, is introduced to characterize both the bulk and the interface.198 For single-tissue interface simulations, φ = 1 represents the phase region, while φ = 0 represents the interface.86 For double-tissue interface simulations, φ = ±1 represents the two phase regions, with φ = 0 denoting the interface199 (Fig. 13(a)). The free energy of the system is written as32,200| |  | (19) |
where Aφ and kφ are the model parameters that maintain phase ordering and surface tension. The evolution of φ obeys32,198,200where v is the velocity field, M is the mobility coefficient and μ = δF/δφ is the effective chemical potential. The unit vector n = (cosθ,sinθ) is introduced to describe the local orientation, where θ indicates the local direction.86 For monolayer systems, n = −n is generally satisfied. To describe the orientation of the system, a second-order tensor| |  | (21) |
is introduced, where d denotes the dimensions of the system, q represents the order parameter of the system, and I is the identity matrix.96 The order parameter Q satisfies the following evolution equation96,201where S represents the coupling field of orientation and velocity, Γ represents the relaxation rate, and H represents the molecular field, indicating the energy minimization of the system. The velocity field is governed by| | | ρ(∂t + v·∇)v = −∇p + ηΔv + ∇·(σp + σact) + fcap − βv | (23) |
where ρ is the density, p is the pressure, η is the viscosity coefficient and β is the damping coefficient. The active stress is expressed aswhere ς denotes the activity coefficient.202 Typically, these equations are solved using the hybrid lattice Boltzmann method.203
 |
| | Fig. 13 Application of continuum model in interface morphodynamics. (a) Formation and evolution of double-tissue interface. (b) 3D interface morphological diagram as a function of achiral and chiral activity. Reprinted from ref. 204 with permission. Copyright 2024, American Physical Society. | |
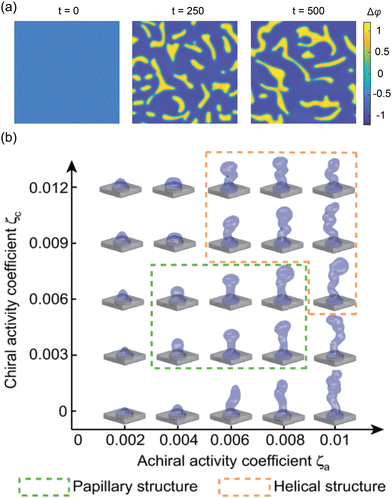
The above introduction is based on single-φ model. While this model can simulate the morphological evolution of double-tissue interfaces, it cannot capture interphase interactions. This limitation is addressed by the double-φ model, which introduces two scalar fields, φ1 and φ2. Here, Δφ = φ1 − φ2 = ±1 represents the two phase regions, while Δφ = 0 denotes the interface.25 Interphase interactions are incorporated through a free energy formulation. Additionally, the development of 3D active liquid crystal theory provides a theoretical framework to model the expansion and twisting of interfaces during 3D tissue morphogenesis.205 As shown in Fig. 13(b), Li et al.204 used a 3D model to investigate the regulation of chiral and achiral active stresses on the 3D morphologies of organoids. In summary, active liquid crystal theory offers a means of understanding interface evolution as an active matter system with liquid crystal properties, making it particularly useful for tissues with elongated cells.32
In addition to discrete and continuous models, recent efforts have focused on developing hybrid models that integrate both approaches. For instance, to investigate cellular orientation and active stress, the orientation field from active liquid crystal theory was incorporated into the vertex model, leading to the development of the active nematic vertex model.206,207 This hybrid model processes continuous parameters, such as orientation fields, by referencing the positions of individual cell vertices, making it an extension of the vertex model. Similar approaches have advanced other active matter studies. Mou et al.208 developed a hybrid model to simulate bacterial movement in a 3D passive liquid crystal. In this framework, bacterial motion is governed by a self-propelled active particle model, while the systems flow and orientation fields are described using active liquid crystal theory. This approach offers inspiration for modeling single-tissue interface evolution, where discrete models could represent cellular assemblies, while the surrounding environment is captured through a continuum framework.
5 Applications and biological implications of interface morphodynamics
Understanding the morphodynamics of tissue interfaces holds transformative potential across diverse biological contexts, including developmental biology, regenerative medicine, and cancer research. By gaining insights into interface behavior, we can decipher how cellular and tissue architecture adapt, repair, and malfunction, offering valuable knowledge applicable to various health and disease-related fields.
5.1 Morphogenesis
Morphogenesis, the intricate process by which tissues and organs acquire their complex structures and shapes, is inherently and profoundly dependent on the dynamic interactions and behaviors of tissue interfaces.209 During the process of organogenesis, tissue interfaces undergo a series of complex and highly regulated phenomena, including folding, bending, and branching. A clear example of this can be seen during the formation of the neural tube, where the folding of the epithelial sheet marks a critical step in central nervous system development.50 Similarly, the branching of mammary glands involves a similar series of processes that rely on the proper functioning and evolution of tissue interfaces to establish the distinct cellular architectures necessary for breast tissue formation.210
Compartmentalization is also deeply intertwined with the process of interface formation and evolution. As tissues develop and grow, cells are required to self-organize into distinct compartments or functional domains that allow for the specialization of tissues, as exemplified by the boundary formation between different sections of the Drosophila wing.211 A key mechanism driving the creation of these compartmentalized interfaces is cell sorting.129 As cells sort into their respective domains, interfaces between these cell groups are established, contributing to the overall structure of the developing tissue.
At the later stage of morphogenesis, the evolution of these interfaces gradually stabilizes, ensuring that tissue architecture remains intact as the organism matures. The continued maintenance and flexibility of these interfaces are paramount for preserving the integrity of the tissue compartments. Such as the heart, where the precise arrangement of cardiac cells in different atria and ventricles is necessary for proper cardiac function.212 Similarly, the blood–brain barrier, an interface that controls the movement of substances between the blood and the brain, relies on the dynamic regulation of tissue interfaces.213 The formation of skin as an organized tissue structure also highlights the importance of interface stability, where epidermal and dermal layers must remain segregated while allowing for communication across the boundary to ensure proper skin function and repair.214 Thus, the role of tissue interfaces in morphogenesis is foundational not only for the proper development of individual organs but also for the functional integrity of the entire organism.
5.2 Tissue repair
Tissue repair refers to the biological process by which an organism replaces damaged or destroyed tissue with newly generated tissue, a crucial mechanism for maintaining the organism's integrity and functionality following injury.215 One of the most common forms of tissue repair is wound healing, during which tissue interfaces undergo adaptive changes in response to the injury.16 During this process, tissue interfaces evolve through active morphological changes, allowing cells to migrate, proliferate, and differentiate as needed to close the wound and repair the damaged tissue.58,216 The evolution and morphological dynamics of tissue interfaces in wound healing are tightly regulated by a complex interplay of factors such as cortical tension, cellular adhesion, and growth factors.
However, deficiencies or imbalances in tissue repair processes can lead to significant pathological outcomes. For example, excessive tissue repair can result in the formation of epidermal keloids, characterized by the overproduction of extracellular matrix and the formation of fibrous scars.217 In the heart, excessive tissue repair can lead to myocardial fibrosis, a condition where the normal cardiac tissue is replaced by fibrous tissue, impairing heart function and leading to complications such as heart failure.218 Thrombosis is another condition that can arise due to improper tissue repair, where dysfunctional tissue interfaces in blood vessels contribute to the formation of clots and the disruption of blood flow.219 In each of these conditions, misregulated tissue interface evolution plays a key role in the pathological remodeling process. Therefore, understanding the mechanisms that govern tissue interface morphodynamics is essential for developing therapeutic strategies aimed at minimizing the destructive consequences of abnormal interface remodeling and promoting optimal tissue repair.
5.3 Cancer progression and metastasis
Cancer remains one of the most significant threats to human health today.220 The progression of cancer is intricately linked to the continuous evolution of the interface between malignant and adjacent healthy tissues.221 During the early stages of cancer, this interface evolves relatively slowly, maintaining a distinct and regular boundary between cancerous and normal tissues.52 However, as the disease progresses into intermediate and advanced stages, cancer cells begin to exhibit a range of alterations. These include the increased expression of MMPs, which, in conjunction with the EMT, facilitate the acquisition of a more mesenchymal phenotype.222 As a result, the cancer cells undergo significant changes in adhesion properties, enabling them to degrade the ECM and enhance cellular motility. These modifications allow them to breach the original interfaces, invade surrounding tissues and metastasize to distant sites.122,158 During this period, the interface between cancer tissue and normal tissue exhibits active morphology and dynamics, exhibiting significant morphological changes as the tumor continues to invade and spread.
Tumor heterogeneity also complicates interface evolution. On the one hand, the mechanical properties of tumors exhibit spatial heterogeneity, with higher hydrostatic pressure and stiffness in the core than in peripheral regions. The elevated internal pressure can lead to the collapse of blood vessels and lymphatic vessels in tumors, distorting or eliminating their interfaces and impairing vascular function, which hinders drug delivery while promoting cancer invasion.223–225 On the other hand, heterogeneity also exists at the cellular level. Within tumors, cancer cells display genetic, phenotypic, and functional diversity, stabilizing interfaces through interactions among multiple cell types. Beyond intrinsic heterogeneity, stromal cells, particularly cancer-associated fibroblasts (CAFs), actively modulate tumor interfaces.226 CAFs secreted a large number of inflammation-related molecules, such as TGF-β, IL-6 and CXCL12, which not only stimulate the rapid proliferation and invasion of cancer cells, but also change the structure around the tumor, thus promoting the continuous evolution of the tumor interface.227 Overall, tumor interface dynamics involve multi-stage, multi-factor, and multi-cell interactions. Understanding these processes is crucial for predicting tumor progression and developing targeted therapies.
6 Challenges and future directions
Despite significant progress in the study of tissue interface morphodynamics in recent years, several critical issues remain that warrant further investigation. Firstly, the evolution of tissue interfaces is driven by mechanical, chemical, and biological factors. Current theories focus on molecular and cell biology, focusing on the analysis of molecular or biochemical signaling pathways, and lack systematic exploration of mechanical factors and their coupling with biochemical factors. There is a pressing need to develop unified models that integrate mechanochemical coupling and feedback mechanisms, particularly for capturing emergent behaviors in complex biological systems.
Moreover, tissue morphodynamics involves changes across molecular, cellular, and tissue scales, which require diverse observational and analytical techniques. However, current experimental approaches face limitations in capturing accurate data of complex dynamics interfaces. While 2D experiments allow for precise control of biochemical and mechanical conditions, they often lack physiological relevance, whereas 3D experiments face challenges such as imaging resolution and tracking of dynamic evolution. Theoretical models, including discrete models and continuum methods, have limitations in considering cross-scale interactions. Hybrid modeling approaches that integrate discrete and continuum frameworks offer a promising direction, and factors such as tissue heterogeneity and non-equilibrium dynamics should also be taken into account.
Furthermore, the vigorous development of artificial intelligence (AI) provides a solution for the quantification of key information in the process of complex interface evolution. By constructing AI models, it is expected to extract mechanical, chemical, topological and other features in the process of interface evolution, guide the development of theoretical models, and finally realize the prediction of interface evolution.
Finally, translating in vitro findings into clinically relevant insights remains a major challenge. Future efforts should focus on developing physiologically relevant models that better recapitulate in vivo conditions and leveraging computational approaches to predict interface behaviors in disease contexts. Bridging the gap between fundamental research and biomedical applications will be crucial for advancing the diagnosis and treatment of interface-related pathologies.
7 Conclusion
The morphodynamics of tissue interfaces is fundamental to understanding complex biological processes, ranging from development and tissue repair to disease progression. This review aims to offer a comprehensive exploration of tissue interface morphodynamics, focusing on interface classification, regulatory mechanisms, and the methodologies used to study interface evolution. These aspects have significant practical implications, from elucidating mechanisms of tumor progression and metastasis to developing innovative strategies in regenerative medicine and tissue engineering. By advancing our understanding of tissue interface morphodynamics, we could uncover new pathways for studying and manipulating biological systems, ultimately leading to breakthroughs in biomedical science and therapy.
Data availability
No primary research results, software or code have been included and no new data were generated or analysed as part of this review.
Conflicts of interest
There are no conflicts to declare.
Acknowledgements
Support from National Natural Science Foundation of China (Grants No. 12325209, 12272202, and 12361161604) is acknowledged. We also wish to thank Dr Liu-Yuan Guan, Dr Jian-Qing Lv, Mr Zhong-Yi Li and Mr Pengyu Yu for their helpful suggestions and for providing experiment or simulation data.
References
- V. Franklin, P. L. Khoo, H. Bildsoe, N. Wong, S. Lewis and P. P. Tam, Mech. Dev., 2008, 125, 587–600 Search PubMed.
- K. D. Tremblay and K. S. Zaret, Dev. Biol., 2005, 280, 87–99 Search PubMed.
- P. M. Kulesa and S. E. Fraser, Science, 2002, 298, 991–995 CrossRef CAS PubMed.
- H. Honda, S. Imayama and M. Tanemura, Fractals, 1996, 4, 139–147 CrossRef.
- M. J. Moore, R. P. Tan, N. Yang, J. Rnjak-Kovacina and S. G. Wise, Trends Biotechnol., 2022, 40, 693–707 CrossRef CAS PubMed.
- T. A. Harris-Tryon and E. A. Grice, Science, 2022, 376, 940–945 CrossRef CAS PubMed.
- N. M. Doll and G. C. Ingram, Annu. Rev. Plant Biol., 2022, 73, 293–321 CrossRef CAS PubMed.
- J. P. Spalazzi, A. L. Boskey, N. Pleshko and H. H. Lu, PLoS One, 2013, 8, e74349 Search PubMed.
- I.-N. E. Wang, S. Mitroo, F. H. Chen, H. H. Lu and S. B. Doty, J. Orthop. Res., 2006, 24, 1745–1755 CrossRef CAS PubMed.
- W. Xi, T. B. Saw, D. Delacour, C. T. Lim and B. Ladoux, Nat. Rev. Mater., 2019, 4, 23–44 CrossRef.
- B. Walderich, A. P. Singh, P. Mahalwar and C. Nüsslein-Volhard, Nat. Commun., 2016, 7, 11462 CrossRef CAS PubMed.
- E. Batlle, J. Bacani, H. Begthel, S. Jonkeer, A. Gregorieff, M. van de Born, N. Malats, E. Sancho, E. Boon and T. Pawson,
et al.
, Nature, 2005, 435, 1126–1130 CrossRef CAS PubMed.
- C. Dahmann, A. C. Oates and M. Brand, Nat. Rev. Genet., 2011, 12, 43–55 Search PubMed.
- M. Jalil Razavi, T. Zhang, T. Liu and X. Wang, Sci. Rep., 2015, 5, 14477 CrossRef CAS PubMed.
- W. Kang, J. Ferruzzi, C.-P. Spatarelu, Y. L. Han, Y. Sharma, S. A. Koehler, J. A. Mitchel, A. Khan, J. P. Butler and D. Roblyer,
et al.
, iScience, 2021, 24, 103252 CrossRef PubMed.
- R. J. Tetley, M. F. Staddon, D. Heller, A. Hoppe, S. Banerjee and Y. Mao, Nat. Phys., 2019, 15, 1195–1203 Search PubMed.
- M. S. Brugger, K. Baumgartner, S. C. Mauritz, S. C. Gerlach, F. Röder, C. Schlosser, R. Fluhrer, A. Wixforth and C. Westerhausen, Proc. Natl. Acad. Sci. U. S. A., 2020, 117, 31603–31613 CrossRef CAS PubMed.
- P. Friedl, J. Locker, E. Sahai and J. E. Segall, Nat. Cell Biol., 2012, 14, 777–783 CrossRef PubMed.
- R. A. Foty and M. S. Steinberg, Dev. Biol., 2005, 278, 255–263 CrossRef CAS PubMed.
- Y. Yang and H. Jiang, Phys. Rev. Lett., 2017, 118, 208102 CrossRef PubMed.
- P.-F. Lenne, J.-F. Rupprecht and V. Viasnoff, Dev. Cell, 2021, 56, 202–212 CrossRef CAS PubMed.
- J.-L. Maître, H. Berthoumieux, S. F. G. Krens, G. Salbreux, F. Jülicher, E. Paluch and C.-P. Heisenberg, Science, 2012, 338, 253–256 CrossRef PubMed.
- X. Trepat, M. R. Wasserman, T. E. Angelini, E. Millet, D. A. Weitz, J. P. Butler and J. J. Fredberg, Nat. Phys., 2009, 5, 426–430 Search PubMed.
- L. Balasubramaniam, A. Doostmohammadi, T. B. Saw, G. H. N. S. Narayana, R. Mueller, T. Dang, M. Thomas, S. Gupta, S. Sonam and A. S. Yap,
et al.
, Nat. Mater., 2021, 20, 1156–1166 CrossRef CAS PubMed.
- C.-L. Lv, Z.-Y. Li, S.-D. Wang and B. Li, Commun. Phys., 2024, 7, 351 CrossRef.
- T. Lecuit and P.-F. Lenne, Nat. Rev. Mol. Cell Biol., 2007, 8, 633–644 CrossRef CAS PubMed.
- A. R. Harris, A. Daeden and G. T. Charras, J. Cell Sci., 2014, 127, 2507–2517 CAS.
- H. Honda, M. Tanemura and T. Nagai, J. Theor. Biol., 2004, 226, 439–453 CrossRef PubMed.
- D. M. Sussman, J. Schwarz, M. C. Marchetti and M. L. Manning, Phys. Rev. Lett., 2018, 120, 058001 CrossRef CAS PubMed.
- P. Madhikar, J. Åström, B. Baumeier and M. Karttunen, Phys. Rev. Res., 2021, 3, 023129 CrossRef CAS.
- M. C. Marchetti, J.-F. Joanny, S. Ramaswamy, T. B. Liverpool, J. Prost, M. Rao and R. A. Simha, Rev. Mod. Phys., 2013, 85, 1143–1189 CrossRef CAS.
- D.-Q. Zhang, P.-C. Chen, Z.-Y. Li, R. Zhang and B. Li, Proc. Natl. Acad. Sci. U. S. A., 2022, 119, e2122494119 CrossRef CAS PubMed.
- K. Duval, H. Grover, L.-H. Han, Y. Mou, A. F. Pegoraro, J. Fredberg and Z. Chen, Physiology, 2017, 32, 266–277 CrossRef CAS PubMed.
- T. Omelchenko, J. M. Vasiliev, I. Gelfand, H. Feder and E. Bonder, Proc. Natl. Acad. Sci. U. S. A., 2003, 100, 10788–10793 CrossRef CAS PubMed.
- G. Fenteany, P. A. Janmey and T. P. Stossel, Curr. Biol., 2000, 10, 831–838 Search PubMed.
- L.-Y. Guan, S.-Z. Lin, P.-C. Chen, J.-Q. Lv, B. Li and X.-Q. Feng, ACS Nano, 2023, 17, 24668–24684 CrossRef CAS PubMed.
- H. Mori, A. T. Lo, J. L. Inman, J. Alcaraz, C. M. Ghajar, J. D. Mott, C. M. Nelson, C. S. Chen, H. Zhang and J. L. Bascom,
et al.
, Development, 2013, 140, 343–352 CrossRef CAS PubMed.
- J. Rozman and J. M. Yeomans, Phys. Rev. Lett., 2024, 133, 248401 CrossRef CAS PubMed.
- X. Xu, J. Xu, J. Liu, C. Jiang, L. Tian, Y. Xu, D. Li and B. Ji, J. Appl. Mech., 2024, 91, 021002 CrossRef CAS.
- X. Xu, J. Xu, X. Li, J. Song, D. Li and B. Ji, J. Appl. Mech., 2022, 89, 051005 CrossRef.
- T. E. Angelini, E. Hannezo, X. Trepat, J. J. Fredberg and D. A. Weitz, Phys. Rev. Lett., 2010, 104, 168104 CrossRef PubMed.
- R. Sunyer, V. Conte, J. Escribano, A. Elosegui-Artola, A. Labernadie, L. Valon, D. Navajas, J. M. García-Aznar, J. J. Muñoz and P. Roca-Cusachs,
et al.
, Science, 2016, 353, 1157–1161 Search PubMed.
- E. T. Pineda, R. M. Nerem and T. Ahsan, Cells Tissues Organs, 2013, 197, 399–410 CrossRef CAS PubMed.
- A. S. Chin, K. E. Worley, P. Ray, G. Kaur, J. Fan and L. Q. Wan, Proc. Natl. Acad. Sci. U. S. A., 2018, 115, 12188–12193 CrossRef CAS PubMed.
- C. A. DeForest, E. A. Sims and K. S. Anseth, Chem. Mater., 2010, 22, 4783–4790 Search PubMed.
- M. Nii, J. H. Lai, M. Keeney, L.-H. Han, A. Behn, G. Imanbayev and F. Yang, Acta Biomater., 2013, 9, 5475–5483 Search PubMed.
- Y.-S. Torisawa, A. Takagi, Y. Nashimoto, T. Yasukawa, H. Shiku and T. Matsue, Biomaterials, 2007, 28, 559–566 CrossRef CAS PubMed.
- E. Fennema, N. Rivron, J. Rouwkema, C. van Blitterswijk and J. de Boer, Trends Biotechnol., 2013, 31, 108–115 CrossRef CAS PubMed.
- B. K. Sun, Z. Siprashvili and P. A. Khavari, Science, 2014, 346, 941–945 CrossRef CAS PubMed.
- K. Ishihara, A. Mukherjee, E. Gromberg, J. Brugués, E. M. Tanaka and F. Jülicher, Nat. Phys., 2023, 19, 177–183 Search PubMed.
- J. Alcaraz, H. Mori, C. M. Ghajar, D. Brownfield, R. Galgoczy and M. J. Bissell, Integr. Biol., 2011, 3, 1153–1166 CrossRef CAS PubMed.
- Y. L. Han, A. F. Pegoraro, H. Li, K. Li, Y. Yuan, G. Xu, Z. Gu, J. Sun, Y. Hao and S. K. Gupta,
et al.
, Nat. Phys., 2020, 16, 101–108 Search PubMed.
- S. Grosser, J. Lippoldt, L. Oswald, M. Merkel, D. M. Sussman, F. Renner, P. Gottheil, E. W. Morawetz, T. Fuhs and X. Xie,
et al.
, Phys. Rev. X, 2021, 11, 011033 Search PubMed.
- T. Brandstätter, D. B. Brückner, Y. L. Han, R. Alert, M. Guo and C. P. Broedersz, Nat. Commun., 2023, 14, 1643 Search PubMed.
- M. Poujade, E. Grasland-Mongrain, A. Hertzog, J. Jouanneau, P. Chavrier, B. Ladoux, A. Buguin and P. Silberzan, Proc. Natl. Acad. Sci. U. S. A., 2007, 104, 15988–15993 Search PubMed.
- J.-Q. Lv, P.-C. Chen, W. T. Góźdź and B. Li, J. Biomech., 2020, 104, 109763 CrossRef PubMed.
- T. D. McKee, P. Grandi, W. Mok, G. Alexandrakis, N. Insin, J. P. Zimmer, M. G. Bawendi, Y. Boucher, X. O. Breakefield and R. K. Jain, Cancer Res., 2006, 66, 2509–2513 CrossRef CAS PubMed.
- A. Ravasio, I. Cheddadi, T. Chen, T. Pereira, H. T. Ong, C. Bertocchi, A. Brugues, A. Jacinto, A. J. Kabla and Y. Toyama,
et al.
, Nat. Commun., 2015, 6, 7683 CrossRef PubMed.
- D. L. Nikolic, A. N. Boettiger, D. Bar-Sagi, J. D. Carbeck and S. Y. Shvartsman, Am. J. Physiol.: Cell Physiol., 2006, 291, C68–C75 CrossRef CAS PubMed.
- E. Fong, S. Tzlil and D. A. Tirrell, Proc. Natl. Acad. Sci. U. S. A., 2010, 107, 19302–19307 CrossRef CAS PubMed.
- M. Tamada, T. D. Perez, W. J. Nelson and M. P. Sheetz, J. Cell Biol., 2007, 176, 27–33 CrossRef CAS PubMed.
- Y. Ye and J. Lin, Phys. Rev. Lett., 2024, 132, 018402 CrossRef CAS PubMed.
- X. Serra-Picamal, V. Conte, R. Vincent, E. Anon, D. T. Tambe, E. Bazellieres, J. P. Butler, J. J. Fredberg and X. Trepat, Nat. Phys., 2012, 8, 628–634 Search PubMed.
- R. Alert, C. Blanch-Mercader and J. Casademunt, Phys. Rev. Lett., 2019, 122, 088104 CrossRef CAS PubMed.
- E. L. V. M. Plan, J. M. Yeomans and A. Doostmohammadi, Phys. Rev. Fluids, 2020, 5, 023102 CrossRef.
- J.-Q. Lv, P.-C. Chen, Y.-P. Chen, H.-Y. Liu, S.-D. Wang, J. Bai, C.-L. Lv, Y. Li, Y. Shao and X.-Q. Feng,
et al.
, Nat. Phys., 2024, 1313–1323 Search PubMed.
- P. Heine, J. Lippoldt, G. A. Reddy, P. Katira and J. A. Käs, New J. Phys., 2021, 23, 043034 CrossRef.
- S. Toda, L. R. Blauch, S. K. Tang, L. Morsut and W. A. Lim, Science, 2018, 361, 156–162 CrossRef CAS PubMed.
- H.-Y. Chen, Y.-T. Hsiao, S.-C. Liu, T. Hsu, W.-Y. Woon and I. Lin, Phys. Rev. Lett., 2018, 121, 018101 CrossRef CAS PubMed.
- P. L. Townes and J. Holtfreter, J. Exp. Zool., 1955, 128, 53–120 CrossRef.
- S. G. Krens and C.-P. Heisenberg, Curr. Top. Dev. Biol., 2011, 95, 189–213 Search PubMed.
- S. Suzuki, I. Omori, R. Kuraishi and H. Kaneko, Dev., Growth Differ., 2021, 63, 343–353 CrossRef CAS PubMed.
- K. Heintzelman, H. Phillips and G. Davis, Development, 1978, 47, 1–15 CrossRef CAS.
- R. A. Foty, G. Forgacs, C. M. Pfleger and M. S. Steinberg, Phys. Rev. Lett., 1994, 72, 2298 CrossRef PubMed.
- R. A. Foty, C. M. Pfleger, G. Forgacs and M. S. Steinberg, Development, 1996, 122, 1611–1620 CrossRef CAS PubMed.
- P. Rodríguez-Franco, A. Brugués, A. Marín-Llauradó, V. Conte, G. Solanas, E. Batlle, J. J. Fredberg, P. Roca-Cusachs, R. Sunyer and X. Trepat, Nat. Mater., 2017, 16, 1029–1037 CrossRef PubMed.
- S. Moitrier, C. Blanch-Mercader, S. Garcia, K. Sliogeryte, T. Martin, J. Camonis, P. Marcq, P. Silberzan and I. Bonnet, Soft Matter, 2019, 15, 537–545 RSC.
- S. Porazinski, J. de Navascues, Y. Yako, W. Hill, M. R. Jones, R. Maddison, Y. Fujita and C. Hogan, Curr. Biol., 2016, 26, 3220–3229 CrossRef CAS PubMed.
- A. K. Harris, J. Theor. Biol., 1976, 61, 267–285 CrossRef CAS PubMed.
- M. Krieg, Y. Arboleda-Estudillo, P.-H. Puech, J. Käfer, F. Graner, D. Müller and C.-P. Heisenberg, Nat. Cell Biol., 2008, 10, 429–436 CrossRef CAS PubMed.
- G. W. Brodland and H. H. Chen, J. Biomech., 2000, 33, 845–851 CrossRef PubMed.
- G. W. Brodland, J. Biomech. Eng., 2002, 124, 188–197 CrossRef PubMed.
- B. Schamberger, R. Ziege, K. Anselme, M. Ben Amar, M. Bykowski, A. P. Castro, A. Cipitria, R. A. Coles, R. Dimova and M. Eder,
et al.
, Adv. Mater., 2023, 35, 2206110 CrossRef CAS PubMed.
- L. A. Hoffmann, L. N. Carenza and L. Giomi, Soft Matter, 2023, 19, 3423–3435 RSC.
- T. Hirashima and M. Matsuda, Curr. Biol., 2024, 34, 683–696 CrossRef CAS PubMed.
- A. Doostmohammadi, S. P. Thampi and J. M. Yeomans, Phys. Rev. Lett., 2016, 117, 048102 CrossRef PubMed.
- A. K. Bisoi and J. Mishra, Pattern Recognit. Lett., 2001, 22, 631–637 CrossRef.
- M. Aliee, J.-C. Röper, K. P. Landsberg, C. Pentzold, T. J. Widmann, F. Jülicher and C. Dahmann, Curr. Biol., 2012, 22, 967–976 CrossRef CAS PubMed.
- C. G. Rolli, H. Nakayama, K. Yamaguchi, J. P. Spatz, R. Kemkemer and J. Nakanishi, Biomaterials, 2012, 33, 2409–2418 CrossRef CAS PubMed.
- S. Bhattacharyya and J. M. Yeomans, Phys. Rev. Lett., 2023, 130, 238201 CrossRef CAS PubMed.
- R. Adkins, I. Kolvin, Z. You, S. Witthaus, M. C. Marchetti and Z. Dogic, Science, 2022, 377, 768–772 CrossRef CAS PubMed.
- C. Trenado, L. L. Bonilla and A. Martínez-Calvo, Soft Matter, 2021, 17, 8276–8290 RSC.
- S.-Z. Lin, S. Ye, G.-K. Xu, B. Li and X.-Q. Feng, Biophys. J., 2018, 115, 1826–1835 CrossRef CAS PubMed.
- S.-Z. Lin, W.-Y. Zhang, D. Bi, B. Li and X.-Q. Feng, Commun. Phys., 2021, 4, 21 CrossRef.
- H. H. Wensink, J. Dunkel, S. Heidenreich, K. Drescher, R. E. Goldstein, H. Löwen and J. M. Yeomans, Proc. Natl. Acad. Sci. U. S. A., 2012, 109, 14308–14313 CrossRef CAS PubMed.
- A. Doostmohammadi, J. Ignés-Mullol, J. M. Yeomans and F. Sagués, Nat. Commun., 2018, 9, 3246 CrossRef PubMed.
- T. B. Saw, A. Doostmohammadi, V. Nier, L. Kocgozlu, S. Thampi, Y. Toyama, P. Marcq, C. T. Lim, J. M. Yeomans and B. Ladoux, Nature, 2017, 544, 212–216 CrossRef CAS PubMed.
- K. Kawaguchi, R. Kageyama and M. Sano, Nature, 2017, 545, 327–331 CrossRef CAS PubMed.
- R. Rezakhaniha, A. Agianniotis, J. T. C. Schrauwen, A. Griffa, D. Sage, C. V. C. Bouten, F. N. van de Vosse, M. Unser and N. Stergiopulos, Biomech. Model. Mechanobiol., 2012, 11, 461–473 CrossRef CAS PubMed.
-
B. Jähne, Spatio-temporal Image Processing: Theory and Scientific Applications, Springer, 1993 Search PubMed.
-
P. de Gennes and J. Prost, The Physics of Liquid Crystals, Clarendon Press, 1993 Search PubMed.
- K. Chaithanya, A. Ardaševa, O. J. Meacock, W. M. Durham, S. P. Thampi and A. Doostmohammadi, Commun. Phys., 2024, 7, 302 CrossRef.
- P. Guillamat, C. Blanch-Mercader, G. Pernollet, K. Kruse and A. Roux, Nat. Mater., 2022, 21, 588–597 CrossRef CAS PubMed.
- C. Blanch-Mercader, P. Guillamat, A. Roux and K. Kruse, Phys. Rev. E, 2021, 103, 012405 CrossRef CAS PubMed.
- C. Bechinger, R. Di Leonardo, H. Löwen, C. Reichhardt, G. Volpe and G. Volpe, Rev. Mod. Phys., 2016, 88, 045006 CrossRef.
-
L. Yamauchi, T. Hayata, M. Uwamichi, T. Ozawa and K. Kawaguchi, arXiv, 2020, arXiv:2008.10852 DOI:10.48550/arXiv.2008.10852.
- Z.-Y. Li, D.-Q. Zhang and B. Li, Phys. Rev. Res., 2021, 3, 023253 CrossRef CAS.
- A. R. Fialho, M. L. Blow and D. Marenduzzo, Soft Matter, 2017, 13, 5933–5941 RSC.
- S. Begnaud, T. Chen, D. Delacour, R.-M. Mège and B. Ladoux, Curr. Opin. Cell Biol., 2016, 42, 52–62 CrossRef CAS PubMed.
- J. Cayuso, Q. Xu and D. G. Wilkinson, Dev. Biol., 2015, 401, 122–131 CrossRef CAS PubMed.
- M. J. Razavi and X. Wang, RSC Adv., 2015, 5, 7440–7449 RSC.
- N. Hino, L. Rossetti, A. Marín-Llauradó, K. Aoki, X. Trepat, M. Matsuda and T. Hirashima, Dev. Cell, 2020, 53, 646–660 CrossRef CAS PubMed.
- S. K. Gupta and M. Guo, J. Mech. Phys. Solids, 2017, 107, 284–293 CrossRef.
- B. Ladoux and R.-M. Mège, Nat. Rev. Mol. Cell Biol., 2017, 18, 743–757 CrossRef CAS PubMed.
- M. Takeichi, Nat. Rev. Mol. Cell Biol., 2014, 15, 397–410 CrossRef CAS PubMed.
- Y. Takai, J. Miyoshi, W. Ikeda and H. Ogita, Nat. Rev. Mol. Cell Biol., 2008, 9, 603–615 CrossRef CAS PubMed.
- P. Kanchanawong, G. Shtengel, A. M. Pasapera, E. B. Ramko, M. W. Davidson, H. F. Hess and C. M. Waterman, Nature, 2010, 468, 580–584 CrossRef CAS PubMed.
- A. J. Stevens, A. R. Harris, J. Gerdts, K. H. Kim, C. Trentesaux, J. T. Ramirez, W. L. McKeithan, F. Fattahi, O. D. Klein and D. A. Fletcher,
et al.
, Nature, 2023, 614, 144–152 CrossRef CAS PubMed.
- P. Gross, K. V. Kumar and S. W. Grill, Annu. Rev. Biophys., 2017, 46, 337–356 CrossRef CAS PubMed.
- M. S. Steinberg, Curr. Opin. Genet. Dev., 2007, 17, 281–286 CrossRef CAS PubMed.
- J. J. Christiansen and A. K. Rajasekaran, Cancer Res., 2006, 66, 8319–8326 CrossRef CAS PubMed.
- M. Yilmaz and G. Christofori, Cancer Metastasis Rev., 2009, 28, 15–33 CrossRef PubMed.
- S. Wang, K. Matsumoto, S. R. Lish, A. X. Cartagena-Rivera and K. M. Yamada, Cell, 2021, 184, 3702–3716 CrossRef CAS PubMed.
- P. Agarwal, T. Shemesh and R. Zaidel-Bar, Dev. Cell, 2022, 57, 2111–2126 CrossRef CAS PubMed.
- M. L. Manning, R. A. Foty, M. S. Steinberg and E.-M. Schoetz, Proc. Natl. Acad. Sci. U. S. A., 2010, 107, 12517–12522 CrossRef CAS PubMed.
- J. K. Klarlund, Proc. Natl. Acad. Sci. U. S. A., 2012, 109, 15799–15804 CrossRef CAS PubMed.
- V. Maruthamuthu, B. Sabass, U. S. Schwarz and M. L. Gardel, Proc. Natl. Acad. Sci. U. S. A., 2011, 108, 4708–4713 CrossRef CAS PubMed.
- A. F. Mertz, S. Banerjee, Y. Che, G. K. German, Y. Xu, C. Hyland, M. C. Marchetti, V. Horsley and E. R. Dufresne, Phys. Rev. Lett., 2012, 108, 198101 CrossRef PubMed.
- J. D. Amack and M. L. Manning, Science, 2012, 338, 212–215 CrossRef CAS PubMed.
- A. Brugués, E. Anon, V. Conte, J. H. Veldhuis, M. Gupta, J. Colombelli, J. J. Muñoz, G. W. Brodland, B. Ladoux and X. Trepat, Nat. Phys., 2014, 10, 683–690 Search PubMed.
- I. Y. Wong, S. Javaid, E. A. Wong, S. Perk, D. A. Haber, M. Toner and D. Irimia, Nat. Mater., 2014, 13, 1063–1071 CrossRef CAS PubMed.
- S. R. K. Vedula, M. C. Leong, T. L. Lai, P. Hersen, A. J. Kabla, C. T. Lim and B. Ladoux, Proc. Natl. Acad. Sci. U. S. A., 2012, 109, 12974–12979 CrossRef CAS PubMed.
- J. Prost, F. Jülicher and J.-F. Joanny, Nat. Phys., 2015, 11, 111–117 Search PubMed.
- A. Doostmohammadi and B. Ladoux, Trends Cell Biol., 2022, 32, 140–150 CrossRef CAS PubMed.
- U. Schwarz and S. Safran, Phys. Rev. Lett., 2002, 88, 048102 CrossRef CAS PubMed.
- G. Duclos, C. Erlenkämper, J.-F. Joanny and P. Silberzan, Nat. Phys., 2017, 13, 58–62 Search PubMed.
- C. Blanch-Mercader, P. Guillamat, A. Roux and K. Kruse, Phys. Rev. Lett., 2021, 126, 028101 CrossRef CAS PubMed.
- F. Caballero and M. C. Marchetti, Phys. Rev. Lett., 2022, 129, 268002 CrossRef CAS PubMed.
- Z.-Y. Li, D.-Q. Zhang, S.-Z. Lin and B. Li, Phys. Rev. Lett., 2020, 125, 098002 CrossRef CAS PubMed.
- T. H. Tan, A. Mietke, J. Li, Y. Chen, H. Higinbotham, P. J. Foster, S. Gokhale, J. Dunkel and N. Fakhri, Nature, 2022, 607, 287–293 Search PubMed.
- D.-Q. Zhang, Z.-Y. Li and B. Li, Phys. Rev. E, 2022, 105, 064607 Search PubMed.
- E. J. Y. Kim, L. Sorokin and T. Hiiragi, Development, 2022, 149, dev200140 Search PubMed.
- A. Saraswathibhatla, D. Indana and O. Chaudhuri, Nat. Rev. Mol. Cell Biol., 2023, 24, 495–516 CrossRef CAS PubMed.
- A. Mogilner and B. Rubinstein, Biophys. J., 2005, 89, 782–795 CrossRef CAS PubMed.
- X. Trepat and E. Sahai, Nat. Phys., 2018, 14, 671–682 Search PubMed.
- J. Z. Kechagia, J. Ivaska and P. Roca-Cusachs, Nat. Rev. Mol. Cell Biol., 2019, 20, 457–473 CrossRef CAS PubMed.
- D. Huh, G. A. Hamilton and D. E. Ingber, Trends Cell Biol., 2011, 21, 745–754 CrossRef CAS PubMed.
- S. Karaman, V.-M. Leppänen and K. Alitalo, Development, 2018, 145, dev151019 CrossRef PubMed.
- L. Pérez-Gutiérrez and N. Ferrara, Nat. Rev. Mol. Cell Biol., 2023, 24, 816–834 CrossRef PubMed.
- A. L. Pollack, R. B. Runyan and K. E. Mostov, Dev. Biol., 1998, 204, 64–79 CrossRef CAS PubMed.
- M. Williams and P. Clark, J. Anat., 2003, 203, 483–503 CrossRef CAS PubMed.
- T. B. Fessenden, Y. Beckham, M. Perez-Neut, G. Ramirez-San Juan, A. H. Chourasia, K. F. Macleod, P. W. Oakes and M. L. Gardel, J. Cell Biol., 2018, 217, 1485–1502 CrossRef CAS PubMed.
- G. Duester, Cell, 2008, 134, 921–931 Search PubMed.
- J. Folkman, Cancer Res., 1986, 46, 467–473 CAS.
- P. Carmeliet and R. K. Jain, Nature, 2000, 407, 249–257 CrossRef CAS PubMed.
- J. Folkman, Nat. Rev. Drug Discovery, 2007, 6, 273–286 CrossRef CAS PubMed.
- P. Thomsen and L. Ericson, Biomaterials, 1985, 6, 421–424 CrossRef CAS PubMed.
- P. Bronsert, K. Enderle-Ammour, M. Bader, S. Timme, M. Kuehs, A. Csanadi, G. Kayser, I. Kohler, D. Bausch and J. Hoeppner,
et al.
, J. Pathol., 2014, 234, 410–422 CrossRef CAS PubMed.
- S. Woolner, A. Jacinto and P. Martin, Dev. Biol., 2005, 282, 163–173 CrossRef CAS PubMed.
- D. Kirmizis and S. Logothetidis, Int. J. Nanomed., 2010, 137–145 CrossRef PubMed.
- B. Cappella and G. Dietler, Surf. Sci. Rep., 1999, 34, 1–104 CrossRef CAS.
- H.-J. Butt, B. Cappella and M. Kappl, Surf. Sci. Rep., 2005, 59, 1–152 Search PubMed.
- H. Hertz, J. Reine Angew. Math., 1882, 92, 156–171 Search PubMed.
- A. B. Mathur, A. M. Collinsworth, W. M. Reichert, W. E. Kraus and G. A. Truskey, J. Biomech., 2001, 34, 1545–1553 CrossRef CAS PubMed.
- M. McElfresh, E. Baesu, R. Balhorn, J. Belak, M. J. Allen and R. E. Rudd, Proc. Natl. Acad. Sci. U. S. A., 2002, 99, 6493–6497 CrossRef CAS PubMed.
- M. Guo, A. J. Ehrlicher, S. Mahammad, H. Fabich, M. H. Jensen, J. R. Moore, J. J. Fredberg, R. D. Goldman and D. A. Weitz, Biophys. J., 2013, 105, 1562–1568 CrossRef CAS PubMed.
- A. R. Bausch, W. Möller and E. Sackmann, Biophys. J., 1999, 76, 573–579 CrossRef CAS PubMed.
- M. Dembo and Y.-L. Wang, Biophys. J., 1999, 76, 2307–2316 CrossRef CAS PubMed.
- N. Q. Balaban, U. S. Schwarz, D. Riveline, P. Goichberg, G. Tzur, I. Sabanay, D. Mahalu, S. Safran, A. Bershadsky and L. Addadi,
et al.
, Nat. Cell Biol., 2001, 3, 466–472 Search PubMed.
- U. S. Schwarz, N. Q. Balaban, D. Riveline, A. Bershadsky, B. Geiger and S. A. Safran, Biophys. J., 2002, 83, 1380–1394 CrossRef CAS PubMed.
- J. P. Butler, I. M. Tolic-Nørrelykke, B. Fabry and J. J. Fredberg, Am. J. Physiol.: Cell Physiol., 2002, 282, C595–C605 CrossRef CAS PubMed.
- H. Colin-York, C. Eggeling and M. Fritzsche, Nat. Protoc., 2017, 12, 783–796 CrossRef CAS PubMed.
- A. Stubb, R. F. Laine, M. Miihkinen, H. Hamidi, C. Guzmán, R. Henriques, G. Jacquemet and J. Ivaska, Nano Lett., 2020, 20, 2230–2245 CrossRef CAS PubMed.
- J. Steinwachs, C. Metzner, K. Skodzek, N. Lang, I. Thievessen, C. Mark, S. Münster, K. E. Aifantis and B. Fabry, Nat. Methods, 2016, 13, 171–176 CrossRef CAS PubMed.
- H. Colin-York, Y. Javanmardi, L. Barbieri, D. Li, K. Korobchevskaya, Y. Guo, C. Hall, A. Taylor, S. Khuon and G. K. Sheridan,
et al.
, Nano Lett., 2019, 19, 4427–4434 CrossRef CAS PubMed.
- D. T. Tambe, C. Corey Hardin, T. E. Angelini, K. Rajendran, C. Y. Park, X. Serra-Picamal, E. H. Zhou, M. H. Zaman, J. P. Butler and D. A. Weitz,
et al.
, Nat. Mater., 2011, 10, 469–475 CrossRef CAS PubMed.
- A. Boromand, A. Signoriello, F. Ye, C. S. O’Hern and M. D. Shattuck, Phys. Rev. Lett., 2018, 121, 248003 CrossRef PubMed.
- J. Xu, X. Xu, X. Li, S. He, D. Li and B. Ji, Biophys. J., 2022, 121, 288–299 Search PubMed.
- P.-C. Chen, X.-Q. Feng and B. Li, Biophys. J., 2022, 121, 3474–3485 CrossRef CAS PubMed.
- C. E. Chan and D. J. Odde, Science, 2008, 322, 1687–1691 CrossRef CAS PubMed.
- B. L. Bangasser, S. S. Rosenfeld and D. J. Odde, Biophys. J., 2013, 105, 581–592 CrossRef CAS PubMed.
- B. L. Bangasser, G. A. Shamsan, C. E. Chan, K. N. Opoku, E. Tüzel, B. W. Schlichtmann, J. A. Kasim, B. J. Fuller, B. R. McCullough and S. S. Rosenfeld,
et al.
, Nat. Commun., 2017, 8, 15313 CrossRef CAS PubMed.
- V. Ajeti, A. P. Tabatabai, A. J. Fleszar, M. F. Staddon, D. S. Seara, C. Suarez, M. S. Yousafzai, D. Bi, D. R. Kovar and S. Banerjee,
et al.
, Nat. Phys., 2019, 15, 696–705 Search PubMed.
- R. Farhadifar, J.-C. Röper, B. Aigouy, S. Eaton and F. Jülicher, Curr. Biol., 2007, 17, 2095–2104 Search PubMed.
- A. G. Fletcher, M. Osterfield, R. E. Baker and S. Y. Shvartsman, Biophys. J., 2014, 106, 2291–2304 CrossRef CAS PubMed.
- D. Bi, J. Lopez, J. M. Schwarz and M. L. Manning, Nat. Phys., 2015, 11, 1074–1079 Search PubMed.
- G.-K. Xu, Y. Liu and Z. Zheng, J. Biomech., 2016, 49, 401–407 CrossRef PubMed.
- Y. Chen, Q. Gao, J. Li, F. Mao, R. Tang and H. Jiang, Phys. Rev. Lett., 2022, 128, 018101 CrossRef CAS PubMed.
- S.-Z. Lin, B. Li, G. Lan and X.-Q. Feng, Proc. Natl. Acad. Sci. U. S. A., 2017, 114, 8157–8162 CrossRef CAS PubMed.
- S.-Z. Lin, S.-L. Xue, B. Li and X.-Q. Feng, J. Mech. Phys. Solids, 2018, 112, 650–666 CrossRef CAS.
- C. Fang, J. Yao, Y. Zhang and Y. Lin, Biophys. J., 2022, 121, 1266–1275 CrossRef CAS PubMed.
- A. Turing, Philos. Trans. R. Soc. London, 1952, 237, 37–72 Search PubMed.
- F.-L. Wen, Phys. Rev. E, 2022, 106, 064403 CrossRef CAS PubMed.
- M. Merkel and M. L. Manning, New J. Phys., 2018, 20, 022002 CrossRef.
- P. Yu, Y. Li, W. Fang, X.-Q. Feng and B. Li, Sci. Adv., 2024, 10, eadn0172 CrossRef CAS PubMed.
- P. Yu and B. Li, J. Mech. Phys. Solids, 2024, 192, 105801 CrossRef CAS.
- S. Garcia, E. Hannezo, J. Elgeti, J.-F. Joanny, P. Silberzan and N. S. Gov, Proc. Natl. Acad. Sci. U. S. A., 2015, 112, 15314–15319 CrossRef CAS PubMed.
- M. L. Blow, S. P. Thampi and J. M. Yeomans, Phys. Rev. Lett., 2014, 113, 248303 CrossRef PubMed.
- L. Giomi and A. DeSimone, Phys. Rev. Lett., 2014, 112, 147802 CrossRef PubMed.
- P. Yue, J. J. Feng, C. Liu and J. Shen, J. Fluid Mech., 2004, 515, 293–317 CrossRef CAS.
-
A. N. Beris and B. J. Edwards, Thermodynamics of flowing systems: with internal microstructure, Oxford University Press, USA, 1994 Search PubMed.
- S. Thampi and J. Yeomans, Eur. Phys. J.:Spec. Top., 2016, 225, 651–662 Search PubMed.
- D. Marenduzzo, E. Orlandini, M. Cates and J. Yeomans, Phys. Rev. E:Stat., Nonlinear, Soft Matter Phys., 2007, 76, 031921 CrossRef CAS PubMed.
- Z.-Y. Li, Y.-P. Chen, H.-Y. Liu and B. Li, Phys. Rev. Lett., 2024, 132, 138401 CrossRef CAS PubMed.
- L. N. Carenza, G. Gonnella, D. Marenduzzo and G. Negro, Proc. Natl. Acad. Sci. U. S. A., 2019, 116, 22065–22070 CrossRef CAS PubMed.
- J. Rozman, J. M. Yeomans and R. Sknepnek, Phys. Rev. Lett., 2023, 131, 228301 CrossRef CAS PubMed.
- S.-Z. Lin, M. Merkel and J.-F. Rupprecht, Phys. Rev. Lett., 2023, 130, 058202 CrossRef CAS PubMed.
-
Z. Mou, Y. Li, Z. You and R. Zhang, arXiv, 2025, arXiv:2501.07816 DOI:10.48550/arXiv.2501.07816.
- Y. Maroudas-Sacks, L. Garion, L. Shani-Zerbib, A. Livshits, E. Braun and K. Keren, Nat. Phys., 2021, 17, 251–259 Search PubMed.
- P. A. Fernández, B. Buchmann, A. Goychuk, L. K. Engelbrecht, M. K. Raich, C. H. Scheel, E. Frey and A. R. Bausch, Nat. Phys., 2021, 17, 1130–1136 Search PubMed.
- A. García-Bellido, P. Ripoll and G. Morata, Nat. New Biol., 1973, 245, 251–253 Search PubMed.
- H. Kokubo, S. Tomita-Miyagawa, Y. Hamada and Y. Saga, Development, 2007, 134, 747–755 CrossRef CAS PubMed.
- W. A. Banks, M. J. Reed, A. F. Logsdon, E. M. Rhea and M. A. Erickson, Nat. Aging, 2021, 1, 243–254 CrossRef PubMed.
- A. Dąbrowska, F. Spano, S. Derler, C. Adlhart, N. D. Spencer and R. M. Rossi, Sking Res. Technol., 2018, 24, 165–174 CrossRef PubMed.
- K. K. Youssef and M. A. Nieto, Nat. Rev. Mol. Cell Biol., 2024, 1–20 Search PubMed.
- R. M. Sarate, J. Hochstetter, M. Valet, A. Hallou, Y. Song, N. Bansaccal, M. Ligare, M. Aragona, D. Engelman and A. Bauduin,
et al.
, Cell, 2024, 187, 5298–5315 CrossRef CAS PubMed.
- B. Berman, A. Maderal and B. Raphael, Dermatol. Surg., 2017, 43, S3–S18 CrossRef CAS PubMed.
- V. Talman and H. Ruskoaho, Cell Tissue Res., 2016, 365, 563–581 CrossRef CAS PubMed.
- J. W. Yau, H. Teoh and S. Verma, BMC Cardiovasc. Disord., 2015, 15, 1–11 CrossRef PubMed.
- F. Bray, M. Laversanne, H. Sung, J. Ferlay, R. L. Siegel, I. Soerjomataram and A. Jemal, Ca-Cancer J. Clin., 2024, 74, 229–263 CrossRef PubMed.
- P. Friedl and S. Alexander, Cell, 2011, 147, 992–1009 CrossRef CAS PubMed.
- R. G. Rowe and S. J. Weiss, Annu. Rev. Cell Dev., 2009, 25, 567–595 CrossRef CAS.
- T. P. Padera, B. R. Stoll, J. B. Tooredman, D. Capen, E. D. Tomaso and R. K. Jain, Nature, 2004, 427, 695 CrossRef CAS PubMed.
- K. Alitalo, Nat. Med., 2011, 17, 1371–1380 Search PubMed.
- S.-L. Xue, S.-F. Yin, B. Li and X.-Q. Feng, J. Mech. Phys. Solids, 2018, 121, 463–479 CrossRef CAS.
- L. Cords, N. de Souza and B. Bodenmiller, Cancer Cell, 2024, 42, 1480–1485 CrossRef CAS PubMed.
- Z. Xiao and E. Puré, Nat. Rev. Cancer, 2025, 1–27 Search PubMed.
|
| This journal is © The Royal Society of Chemistry 2025 |
Click here to see how this site uses Cookies. View our privacy policy here. 
 *abc
*abc