
 Open Access Article
 This Open Access Article is licensed under a Creative Commons Attribution-Non Commercial 3.0 Unported Licence
Fabrication of COC micromodels with wettability heterogeneities: method and influence on fluid transport†
Camille
Brigodiot‡
 *a,
Elliot
Speirs‡
a,
Cédric
Guyon
b,
Michaël
Tatoulian
b and
Nicolas
Pannacci
a
*a,
Elliot
Speirs‡
a,
Cédric
Guyon
b,
Michaël
Tatoulian
b and
Nicolas
Pannacci
a
aIFP Energies nouvelles, 1 et 4 avenue de Bois-Préau, 92852 Rueil-Malmaison, France. E-mail: camille.brigodiot@ifpen.fr
bChimie ParisTech, PSL University, Institut de Recherche de Chimie Paris, UMR 8247, 11 rue Pierre et Marie Curie, 75005 Paris, France
First published on 3rd March 2025
Abstract
Wettability plays a key role in multiphase fluid flow through porous media, significantly influencing geological processes such as CO2 sequestration, groundwater remediation, or oil recovery. Micromodels, i.e. microfluidic porous media, have advanced the study of fluid flows in porous media by enabling direct visualisation of these processes. However, the influence of wettability heterogeneities on fluid flows in porous media remains underexplored in the literature, with studies focusing primarily on homogeneous wettabilities. In this study, we propose a complete method to manufacture micromodels with controllable, heterogeneous wettabilities. This work is at the crossroads of three different fields: microfabrication, surface treatment and fluid transport in porous media. The micromodels are made from a transparent polymer, cyclic olefin copolymer (COC), using hot-embossing. A plasma enhanced chemical vapor deposition (PECVD) process with a tetraethyl orthosilicate (TEOS) precursor is then used locally to reduce the COC's wettability. The durability, degree, and localisation of the deposition are quantitatively assessed with scanning electron microscopy (SEM) coupled with energy-dispersive X-ray spectroscopy (EDS), IR spectroscopy, and contact angle measurements. Our fabrication method successfully produced mixed-wet micromodels with easily controllable wettability patterns. Additionally, our study also presents a qualitative analysis of the impact of wettability heterogeneities on multiphase flows for oil, water, and water-in-oil emulsion injections. The location of the treated surface areas is shown to strongly impact emulsion stability and transport.
1 Introduction
Fluid–fluid displacement in porous media is commonly encountered in many natural and industrial processes. Examples include CO2 sequestration and hydrates formation,1,2 groundwater remediation,3,4 as well as soil wetting and drying.5,6 Understanding and predicting such flows in porous media is essential and has been the subject of very extensive research for decades. For porous media of homogeneous and heterogeneous permeabilities, the resulting fluid flows are well-established in the literature. For example, the injection of a fluid in a porous medium containing a second fluid is classically described by the Lenormand diagrams7 as a function of viscosity ratios and capillary numbers.Given the small scale of pores in rocks (μm), surface forces and thus surface wettability play a predominant role in fluid flows. For porous media of homogeneous wettability, the fluid behaviour in porous media is also generally well-documented.7–9 However, natural rocks and geological resevoirs frequently exhibit wettability heterogeneities. Experimental investigations have been undertaken in various geometries bearing wettability heterogeneities, such as sandpacks7,10 and reservoir rocks11–18 and the flow behaviour observed differed significantly from that in homogeneously wet porous media. For example, CO2-saturated mixed-wettability core samples exhibit less residual trapping, while oil-saturated mixed-wettability core samples demonstrate greater oil displacement during imbibition. Complementary studies have extended the Lenormand diagrams to encompass finer variations in wettability.19–23 These studies have also uncovered novel pore invasion mechanisms and emphasised the inherently complex, three-dimensional nature of such multiphase flows, even in quasi-2D micromodel experiments bearing simple channel geometries. Whilst various imaging techniques and modeling methods exist for the study of fluid transport in real porous media,24–26 they often struggle to capture transport phenomena at the pore scale where deterministic phenomena can occur. Microfluidic model porous media known as micromodels are made from transparent materials such as polymers or glass, offering a direct visualisation of pore-scale phenomena within the medium.27–29 The precision of micromodel fabrication also allows great control over the system's geometrical parameters.
Recent studies on micromodels with discrete wettability zones have linked interfacial fluid dynamics to local wettability.22,30–33 Pore-scale distributions of mixed-wettability zones significantly impact fluid flow, though this effect diminishes at higher Ca as viscous forces dominate and lubrication film thickness increases as per Brethertons law.32 Irannezhad et al.22 observed water preferentially filling strongly water-wet zones while avoiding weakly water-wet ones in an otherwise oil-wet micromodel, contradicting Lenormand diagram predictions at low Ca and attributed to the interface curvature in mixed-wet pores. Another study34 numerically demonstrated how mixed-wet pores and tortuous pore structures affect fluid front stability.
Fabricating mixed-wet micromodels involves modifying surface wettability between hydrophobic and hydrophilic states. Methods include pre-wetting,22 coating,32,33,35 and surface functionalisation,36,37 the latter being widely applied via polymerisation. Hu, Ren et al.38–41 leveraged UV-initiated polymerisation with hydrophilic compounds like PEG, acrylamide, and acrylic acid (AA). Schneider et al.30 and Ramirez-Gutiérrez et al.42 later replicated this using AA to achieve durable water contact angles as low as 40–45° on PDMS, reducing them by 65–70°.
A further method for surface functionalisation is plasma exposure. Since Langmuirs pioneering work in the 1920s on ionised gases, plasma technology has become a well-established technique for surface treatment.43–46 When plasma interacts with a surface, it increases its surface energy, facilitating surface functionalisation44–47 or thin-layer deposition of hydrophilic monomers (precursors) like PEG or AA.48–50 Atmospheric pressure plasmas allow uniform hydrophilic coatings using organosilicate precursors (e.g., hexamethyldisiloxane HMDSO, TEOS) without low-pressure conditions.51–55 These techniques, known as Polymer Enhanced Chemical Vapor Deposition (PECVD) or plasma polymerisation, provide exceptionally durable treatments on thermoplastics like polymethyl methacrylate (PMMA) or cyclic olefin copolymer (COC). These treatments can last for several days or even weeks, making them increasingly popular in microfluidics applications.
In this study, we propose a complete experimental methodolgy for the study of pore-scale flows in porous media bearing wettability heterogeneities. This includes a novel method for a fabrication of transparent micromodels from cyclic olefin copolymer (COC) of variable and localised wettability. The PECVD process is optimised to provide the maximum robust increase in surface wettability. Experimental results from the injection of a single phase and an emulsion are then considered with respect to several wettability patterns. A very simple 2D regular porous structure under a radial injection is used, mimicking geological injection of CO2 for underground storage. We nonetheless expect that this method can be transposable to various porous geometries, injection condtions, and PECVD treatments, allowing for the study of a large variety of surface treatments concerning many different applications.
2 Material and methods
Our main objective was to produce oil-wet porous media patterned with discrete water-wet clusters of controlled wettability, position, and size. The experimental work involved three primary steps: (i) the systematic quantification of the surface treatment methods, (ii) the manufacture of COC micromodels with modified wettability, and (iii) fluid injection into the micromodels. Surface treatments were first tested on flat COC surfaces to systematically quantify their effectiveness and durability under varying plasma parameters. Wettabilities were then quantified through contact angle measurements, and optimal surface treatment conditions regarding contact angle reduction and robustness were determined. Surface treatments were then applied to the micropatterned surfaces of model porous media, which were subsequently sealed and used for fluid injection experiments. In this section we will discuss how the patterned COC micromodels were made, including the surface functionalisation step, before presenting contact angle measurements and the subsequent fluid injection observations.2.1 Fabrication of the COC micromodels
The main steps for the fabrication of the COC microfluidic devices are summarised in Fig. 1. | ||
| Fig. 1 Schematic summary of the COC microfabrication procedure. (1) Sylgard PDMS counter mould. (2) Replication of the microstructure of the silicon wafer on an RTV PDMS membrane. (3) Hot pressing of COC to impart microstructure. (4) Deposition of an organosilicon layer using TEOS as a precursor in the plasma process. A mask can be positioned over the COC to limit the treatment to precise zones. (5) Closing of the microfluidic device. | ||
A mould, consisting of a silicon wafer and a patterned layer of SU8 resin, was made following a standard photolithography procedure.56 The geometry of the micromodel was designed using the layout editor Clewin 5. A micropatterned disk of PDMS (Sylgard 184 from Dow Corning, base![[thin space (1/6-em)]](https://www.rsc.org/images/entities/char_2009.gif) :curing agent ratio of 9:1, degassed) with a thickness of approximately 5 mm was produced from the mould then treated with an O2 plasma and silanised. This Sylgard PDMS block was then spin-coated with 50 mL of a second PDMS mix (RTV 615 from Neyco, base:curing agent ratio of 5:1, degassed) at 500 rpm for 40 s. The final speed of 500 rpm is achieved after a ramp rate of 10 rpm. The whole assembly was then placed in an oven at 70 °C for 2 hours minimum. Afterwards, the PDMS assembly was treated with an O2 plasma alongside a clean silicon wafer before bonding the two together, RTV PDMS side down. Trapped air bubbles were immediately removed and the system was placed in an oven at 90 °C for 15 minutes. The Sylgard PDMS can then be removed using isopropanol, and the wafer bearing the RTV PDMS membrane is overbaked for 3 hours on a hot plate at 250 °C.
:curing agent ratio of 9:1, degassed) with a thickness of approximately 5 mm was produced from the mould then treated with an O2 plasma and silanised. This Sylgard PDMS block was then spin-coated with 50 mL of a second PDMS mix (RTV 615 from Neyco, base:curing agent ratio of 5:1, degassed) at 500 rpm for 40 s. The final speed of 500 rpm is achieved after a ramp rate of 10 rpm. The whole assembly was then placed in an oven at 70 °C for 2 hours minimum. Afterwards, the PDMS assembly was treated with an O2 plasma alongside a clean silicon wafer before bonding the two together, RTV PDMS side down. Trapped air bubbles were immediately removed and the system was placed in an oven at 90 °C for 15 minutes. The Sylgard PDMS can then be removed using isopropanol, and the wafer bearing the RTV PDMS membrane is overbaked for 3 hours on a hot plate at 250 °C.
The micropattern of the RTV PDMS is then hot-embossed onto a COC slide (COC 6013, ChipShop, 3 mm thick) using a 3-ton SCAMEX press preheated to 50 °C. The RTV membrane is positioned on the lower plate of the press and a 3.5 × 5 cm COC slide placed on top of the former. The lower and upper plates of the press are heated to 180 °C and 140 °C respectively. The press is initiated at a pressure of 3 bars and left for 12 minutes before decreasing the temperatures of both plates to 50 °C. The embossed COC slide can then be removed and treated following the procedure described in Section 2.3 to modify its wettability. Finally, the micromodel is sealed with a second COC 6013 slide using a laminator. Prior to lamination, the embossed COC was preheated to the laminator temperature of 140 °C whilst the COC 6013 slide was placed on a block of PDMS saturated with hexadecane for 4 minutes. Excess hexadecane was removed prior to lamination.
2.2 Micromodel geometry
The porous medium, consisting of a circular porous region of diameter 2R = 13 mm and height H = 50 μm, is shown in Fig. 2. | ||
| Fig. 2 Schematic of the circular porous region with a central injection. Top insert: SEM photo of a COC micromodel, 250× magnification, 29° tilt. Bottom insert: Optical profilometer image of a COC micromodel, 10× magnification. The scale bar of 80 μm applies to both insert images. | ||
The porous region contains approximately 25000 cylindrical posts of diameter 2r = 50 μm arranged in a square lattice, giving a porosity ϕ of 0.60 and an inter-post spacing of d = 25 μm. The permeability of the porous medium in all flow directions was measured to be 16.3 ± 2.4 darcy. The tortuosity of the micromodel was obtained through a pore-structure analysis using the software ‘plug im!’ developed by IFP Energies nouvelles57 and ranges from 1.00 to 1.08, as shown in the ESI† (Fig. SI.3).
Upon inspection using a SEM and an optical profilometer, the posts are very reliably reproduced, and the 50 μm height of the posts was well respected. Additionally, when injecting a water and fluorescein mixture into the uniformly hydrophilic porous media, the fluorescein was only observed around the posts, suggesting the system is well sealed to the flat COC surface. A surrounding channel of width 300 μm and a straight exit channel (Fig. 2, main image) of width 300 μm and length 20 mm were added.
2.3 Surface treatment methodology
To render certain areas hydrophilic, we adopted the PECVD technique described by Da Silva et al.53 and Bourg et al.58 A thin layer of tetraethylorthosilicate (TEOS, 98%, Sigma-Aldrich) was deposited on the micropatterned COC substrates using an atmospheric plasma system (AcXys Technologies).The surface of the COC sample is first cleaned by performing an air plasma pre-treatment. Unless mentioned otherwise, a pre-treatment consisting of 2 passes of the air plasma at a power of 667 W, a gas flow rate of 32 L min−1, and a frequency of 80 kHz was used for each sample. For the silica layer deposition step, the previous plasma treatment is repeated, but this time a TEOS precursor was also injected at a flow rate between 100 μL min−1 and 500 μL min−1, controlled by a flowmeter. A SiO2-like layer of organo-silicon is deposited. The carrier gas vaporises the liquid precursor at a flow rate between 5 L min−1 and 25 L min−1. A schematic of the plasma nozzle can be found in the ESI† (SI.1). A wide-range of wettability patterns can easily be produced by covering the COC prior to surface treatment with a mask containing holes or by simply covering with a piece of cellotape, limiting the silica deposition to the exposed areas only.
Characterisation of the silica layer is performed using the transform infrared spectroscopy (FTIR) technique and the spectra can be found in the ESI† (SI.2). To characterise the patterning on the mircomodels, energy dispersive spectroscopy (EDS) using an electron microscopy (SEM) technique is performed. The results of the patterning deposition can be found in Section 3.3.
2.4 Contact angles
In order to characterise the hydrophilic or hydrophobic character of the material, contact angle measurements were carried out using a drop of distilled water exposed to air. The static contact angles (left and right) were measured and averaged for five drops at different positions on the same sample. The contact angle hysteresis is within the error bars and the uncertainty is about 2°. Furthermore, the durability of the hydrophilic treatment was evaluated by repeating contact angle measurements on the same samples over time periods ranging from several hours to several weeks. Between measurements, COC samples were stored in closed Petri dishes. Static measurements were carried out either using a camera and image processing with ImageJ, or with the Drop-Shape Analyser (DSA, Krüss) device. Results did not vary between the two methods. After optimising the possible surface treatment parameters, contact angles measurements were repeated using water and mineral oil, the fluids used for the flow observations (see Section 2.5).2.5 Fluid injection
The fluids used in this study are distilled water and high-purity mineral oil (Alfa Aesar, dynamic viscosity 18 mPa s) with 1 wt% Span 80 (Sigma-Aldrich) added to the oil. Since both fluid phases are transparent, 1 g L−1 of blue methylene (Merck) was added to the distilled water to enhance contrast for visualising the diphasic flow. The interfacial tension between the aqueous phase and the oil phase was measured to be 5.0 ± 0.2 mN m−1 using the Wilhelmy plate method. The emulsion is formed with a flow-focusing droplet generator. The droplet diameter is 50 μm, and the droplet dispersity within the emulsion is evaluated using the coefficient of variation (CV). It is found to be highly monodisperse in the bulk with CV < 4% at short times. Details about the emulsion's stability are provided in the ESI.† Fluid injections were performed at low pressures, controlled using a Fluigent system (Flow EZ 2000 mbar) at the micromodel entrance, while the outlet was at atmospheric pressure. Given the radial nature of the flows in this study, we define the capillary number as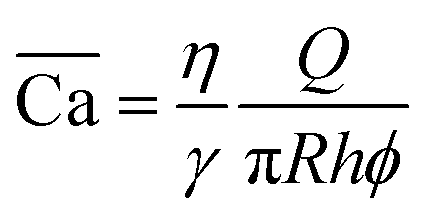 where η is the greater of the two dynamic viscosities, γ the interfacial tension, Q the injection flowrate, and R and h the radius and height of the porous medium respectively.
3 Results and discussion
3.1 Optimisation of the surface treatment
Our goal is to optimise the surface functionalisation to obtain the lowest and most durable contact angles. We performed three series of tests by varying the following parameters in the PECVD technique: the number of passes of silica-like deposition,58 the distance between the torch and the COC substrate, and the different possible post-treatments. The optimisation was conducted on flat COC samples before patterning the micromodel. | ||
| Fig. 3 Evolution of contact angle following TEOS silica-like deposition. The numbers indicated in the legend represent the number of deposition passes, ranging from 2 to 12. (a) The torch-to-surface distance is d1 = 15 mm. (b) Continuous lines represent data for a torch-to-surface distance of d1 = 15 mm, whereas for dashed lines d2 = 31.5 mm. Inset: Image of a COC sample with one half treated using 2 passes of silica-like deposition at d1 = 15 mm. The magnification is 64.5× and the scale bar is 1 mm. | ||
Fig. 3(a) illustrates the influence of the TEOS passes at a fixed torch-to-surface distance of d1 = 15 mm. Immediately after surface treatment, the contact angles are around 50° before further decreasing to around 20° during the first few days. After the fourth day the contact angles increased before reaching a plateau at around 45–55° at around 15 days.
The unexpected descrease in most of the contact angles curves (except for the 12 passes sample) during the first few days could be attributed to the dissolution of remaining monomers in the droplet, turning the water droplet into a mixture of water and TEOS monomers and reducing the contact angle. These monomers remaining at the surface are likely still in the process of reticulating at the surface and have not yet polymerised. It seems that the full polymerisation and functionalisation processes occur after three days. This behaviour can be nullified by a rinsing step as shown in Section 3.1.3.
Conversely, the contact angles of the surface treated with 12 passes increased immediately following the treatment and after 5 days were very similar to that of the untreated COC. An excessive throughput can lead to deposit delamination, a stacking of layers with the loss of adhesion at the interface. This delamination effect results in an increase of the contact angles to around the value of an untreated COC surface.
After two days, the contact angle curves for samples treated with 4, 6, and 8 passes overlap (see Fig. 3(a)), with the 2-passes sample most often offering the largest contact angle values. The same trends are observed for a torch-to-surface distance of d2 = 31.5 mm, as discussed in the next section. It is worth noting that Bourg et al.58 have shown that when increasing from 4 to 8 passes, the thickness of the deposition increases. To minimise the risk of forming an uncontrolled roughness structure, a thinner silica-like layer is preferable. Therefore, 4 passes of the silica-like deposition were used throughout the remainder of the study.
At d2 = 31.5 mm an almost identical evolution of hydrophilicity was observed as for d1 = 15 mm: a steep decrease of the contact angle during the first days, followed by a slow increase to a plateau of 40–50° (<87° for untreated COC). Furthermore, 4 passes of the PECVD process were sufficient to obtain a hydrophilic surface with a contact angle of around 40° after 2 weeks. We, therefore, used a torch-to-surface distance of d2 = 31.5 mm for all subsequent treatments.
 | ||
Fig. 4 Influence of post-treatments on the time variation of contact angles following silica-like surface deposition. Air plasma pre-treatment and 4 passes of the PECVD process were applied to all samples. Three conditions of plasma post-treatment are shown: 2 passes ( ), 6 passes ( ), 6 passes ( ), or rinsing with water for 10 s right after the deposition ( ), or rinsing with water for 10 s right after the deposition ( ). The torch-to-surface distance is of d = 31.5 mm for all experiments. ). The torch-to-surface distance is of d = 31.5 mm for all experiments. | ||
However, the contact angle is not stable over time and increases after 1 day. Since the fluid injections are performed 2 days after the treatment, i.e. when the contact angle value is at its lowest (when no post-treatment is performed), it was deemed not necessary to rinse the samples for our experiments.
In addition, increasing the number of passes of the plasma torch significantly increased the resulting contact angle, effectively counteracting the effects of the silica-like deposition on the substrate. We therefore decided not to perform any post-treatments on the samples in order to obtain the lowest possible contact angles.
3.2 Final contact angles
The contact angle measurements carried out so far have been for drops of distilled water in air. However, our objective is to observe the flows of immiscible liquids in micromodels, such as water, mineral oil or a water-in-oil emulsion (Section 2.5). We measured the contact angles for drops of oil in air and drops of water in oil on both untreated COC and on COC substrates following silica-like deposition with the previously optimised parameters. The resulting droplet shapes and the corresponding contact angles are displayed in Fig. 5. Since all fluid injections were performed several days after manufacture of the surface-treated micromodels, the contact angles presented here were also measured several days after treatment to most accurately represent the experimental conditions. | ||
| Fig. 5 Comparison of the contact angles of water droplets in oil (top) and oil droplets in air (bottom) on flat substrates of COC (left) and COC + TEOS (right, in blue for clarity only). The oil phase consists of mineral oil with 1 wt% SPAN 80. | ||
In the continuous oil phase, a droplet of water did not wet the untreated COC, forming a contact angle of 140°. After the surface was treated with TEOS, the water in the oil partially wets the surface of the solid with a contact angle of around 70°, meaning the treated surface is much more hydrophilic than the untreated one. This angle is also around 30° larger than that for a water droplet in air on the treated COC. It is, therefore, interesting to note that while the treatment is hydrophilic, it is not lipophobic. The silica-like deposition even slightly improves the spreading of the oil on the surface from 30° to 20°.
3.3 Characterisation of deposition patterning
To introduce wettability heterogeneities within the micromodels, the silica-like deposition can be restricted to certain areas on the COC surfac. In this study, deposition was blocked by placing a PDMS mask of the desired geometry. The localised deposition can be characterised using EDS with SEM, as shown in Fig. 6 for two example patterns. The pink zones show the areas of TEOS silica-like deposition. The contrast between these areas and the rest of the micromodel demonstrates that the treatment is well localised. We estimate by image analysis that the complete wettability gradient is obtained over a distance shorter than 300 μm. In this study, the quadrant pattern (Fig. 6 left) was used for all fluid injections. | ||
| Fig. 6 SEM EDS photos for two examples of localised silica-like deposition (in light pink) on COC micromodels. The bright pink zones correspond to areas with the most Si molecules grafted. | ||
3.4 Fluid flow in micromodels with variable wettability
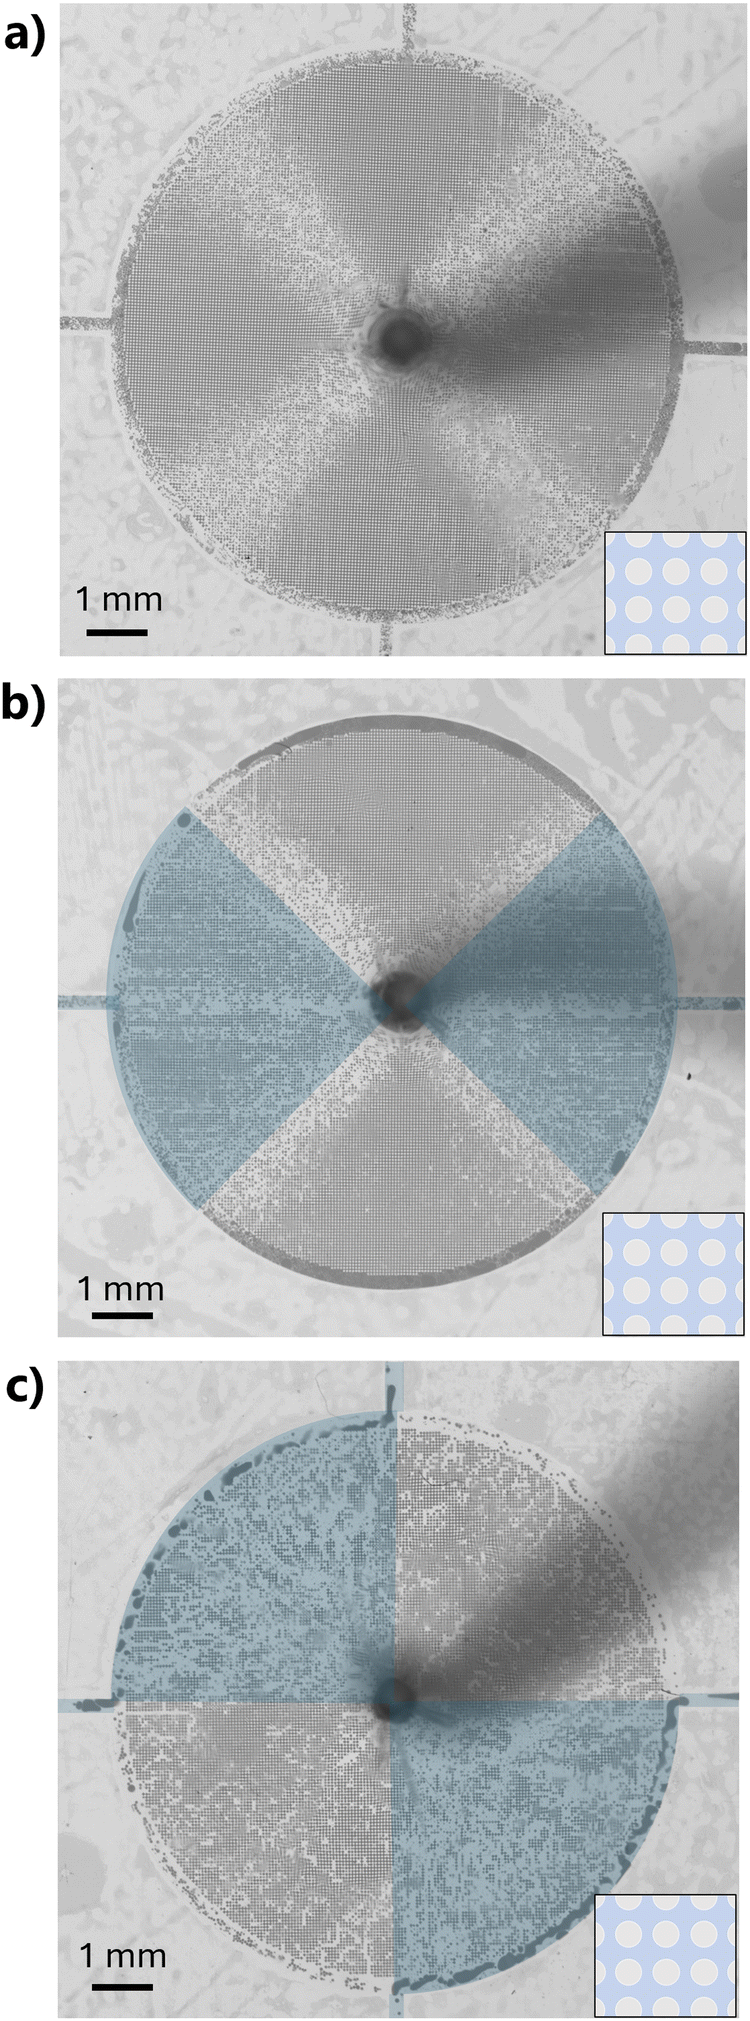
Only a few examples of study of fluid flows in micromodels with localised wettability can be found in the literature.36,37 The geometry of the micromodel and the radial flow can be seen as a highly simplified model experiment of flows encountered in geological CO2 storage processes for example. Here, we propose a novel qualitative study of the influence of variable wettability for both single-phase fluid injection and emulsion (water-in-oil) injection. | ||
| Fig. 7 (a)–(c) Injection of water + blue methylene (1 g L−1) in micromodels pre-filled with air at the constant pressure P = 300 mbar. (d)–(f) Injection of mineral oil + 1 wt% SPAN 80 in micromodels pre-filled with water at the constant pressure P = 300 mbar. (a) and (d) No hydrophilic deposition was made. (b) and (e) The micromodels are entirely rendered hydrophilic. (c) and (f) Only 2 quadrants are rendered hydrophilic by the silica-like deposition (upper left and lower right in blue). Before injection, all the micromodels are filled with either air (a)–(c) or water (d)–(f). The micromodels are made from COC (contact angle 87°) and consist of square lattices of posts of diameter 50 μm (see bottom-right inset in (a)). Zones coloured in blue correspond to areas rendered hydrophilic (contact angle approximately 40°) by the silica-like deposition. The water phase can be differentiated by its darker grey in all images. | ||
In the untreated COC micromodel (hydrophobic, Fig. 7(a)) the water flow is restricted, flowing through a limited number of preferential paths. Following percolation, the water continues to flow through these established paths without forming new ones, and as such the flow pattern becomes stable. The uniformly treated micromodel (hydrophilic, Fig. 7(b)) is filled more homogeneously, with an initially homogeneous front, before percolation paths form near the edges of the micromodel. This is likely due to the reduction in the capillary number with radius given the radial nature of the flow. As expected, the water injected in the mixed-wettability micromodel (Fig. 7(c)) flows preferentially in the areas treated by the PECVD process with TEOS precursor, i.e. in the hydrophilic areas.
During oil injection into the water-filled porous medium (Fig. 7(d)–(f)), an initially uniform front is observed in the untreated COC micromodel (Fig. 7(d)). This was expected given the favourable viscosity ratio defined by Lenormand7M = η1/η2 = 18 between the invading phase (viscosity of η1) and defending phase (viscosity of η2). As was the case for water injection, the front becomes less homogeneous with distance from the central injection point. For the uniformly hydrophilic system (Fig. 7(e)) the front is even less homogeneous and we observe residual water trapped behind the advancing oil front.
Finally, in the case of a mixed wettability (Fig. 7(f)), we see that the oil initially flows solely in the hydrophobic zones in a stable manner. As shown before in Section 3.2, the affinity of oil with both non-treated COC and treated COC is roughly the same. The chosen flow pathways are mostly driven, therefore, by the wettability of the water and consequently the ease for water to be drained. In the hydrophobic upper right quadrant the water is completely drained. Fig. 8 clearly shows the oil phase invading only the hydrophobic zones at each step, confirming the robustness of the surface treatment. This continues until the water in the bottom-right quadrant is completely surrounded by the oil phase in the neighbouring quadrants and the exit channels (Fig. 8, t = 40 s). At the end, the oil appears to start invading the bottom-right quadrant despite its hydrophilicity (Fig. 8, t = 90 s). This is likely due the position of the sole exit channel (to the right). To mitigate this effect, additional exit channels were incorporated in later experiments involving emulsion injection (Fig. 9).
 | ||
| Fig. 8 Dynamic steps for the injection of mineral oil + 1 wt% SPAN 80 in a mixed-wet micromodel pre-filled with water at the constant pressure P = 300 mbar. The pictures are from a video recorded at 5 fps. The last image at t = 90 s corresponds to the final, stable stage of the injection. Zones coloured in blue correspond to areas rendered hydrophilic (contact angle approximately 40°) by the silica-like deposition. The water phase can be differentiated by its darker grey in all images. | ||
 | ||
| Fig. 9 Injection of a water-in-oil emulsion in a COC micromodel of variable wettability: uniformly hydrophobic ((a), contact angle 87°) and mixed (b)–(c). Hydrophilic zones (contact angle 40°) have been colored in blue in the images. Grey-level within the micromodels indicates the concentration of dyed water droplets. | ||
A water-in-oil emulsion was injected at a constant total flow rate into different micromodels pre-filled with the continuous oil phase. The resulting flow patterns, once the steady state was reached, are shown in Fig. 9. A total flow rate of 7.5 μL min−1 was used, corresponding to  . In the case of the homogeneously hydrophobic micromodel (Fig. 9(a)) we observe the same droplet transport patterns as in similar, homogeneously hydrophobic PDMS models discussed elsewhere.60 Notably, the droplets flow preferentially in the direction of greater tortuosity, as shown in the ESI† (Fig. SI.3) and discussed by Speirs.60 For geometries of mixed wettability (Fig. 9(b) and (c)), the flow pattern is greatly dependent on the location of the zones rendered hydrophilic. In the case of Fig. 9(b) the limits of the hydrophilic zones intersect the lines of preferential droplet flow. We also see that the flow in the untreated quadrants (hydrophobic) appears to be identical to the equivalent zones in the uniformly hydrophobic micromodel. In the remaining hydrophilic zones, droplets coalesce significantly and their flow paths are unclear. In Fig. 9(c), however, we no longer observe the four distinct lines of preferential flow from the hydrophobic micromodel as in Fig. 9(a). Large degrees of coalescence occur in the hydrophilic zones, as observed by the much larger droplets in the circular exit channels at the edge of the two blue quadrants. Flow occurs preferentially in the hydrophilic zones, with most of the droplets in the hydrophobic zones remaining trapped in place and only a few percolation paths opening up intermittently. As a result, very few droplets exit the porous region through the hydrophobic quadrants.
These behaviours are still not fully understood, but the positioning of the hydrophilic zones seems to have a strong influence on the nature of the droplet transport within a micromodel bearing a homogeneous microstructure and constant proportions of hydrophobic and hydrophilic zones in the case of Fig. 9(b) and (c). We can also imagine that other wettability patterns would induce different fluid transport behaviours.
4 Conclusions and perspectives
In this paper we proposed an experimental system for the manufacture of mixed-wet micromodels. Model porous media consisting of cylindrical posts with a spacing of 20 μm were accurately reproduced in COC. Controllable surface treatments were then performed using PECVD-based silica coating to produce precise local heterogeneities in wettability, as quantified using sessile drop contact angle measurements. For the COC substrates with an intrinsic contact angle for a water drop in air of 87°, the surface treatments allowed us to pass to as low as 20°, with stable contact angles of 40° several weeks after the treatment. These devices allow us to better understand and model multiphase flows in real porous media consisting of largely heterogeneous wettabilities.Intermediate contact angles could be achieved in several ways, allowing for a more continual variation of wettability, or devices bearing several different wettabilities. It is unclear whether varying the PECVD parameters discussed previously would yield different contact angles whilst still producing a homogeneous surface modification.
As for the fluid flow studies, the influence of wettability heterogeneities on the flow pattern for both single-phase or emulsion injections has been demonstrated and confirmed the robustness of the microfabrication method. However, a more systematic variation of the transport of the emulsion for varying injection capillary numbers or droplet sizes could be performed, allowing the stability and the transport of the emulsion with respect to the models wettability to be better understood.
Observations using a microscope at the pore-scale could also allow a better understanding of the origin of the flow patterns observed.
Author contributions
CB: data acquisition, conceptualisation, formal analysis, investigation, methodology, writing – original draft, review & editing. ES: conceptualisation, data curation, formal analysis, writing – original draft, review & editing. CG: conceptualisation, supervision, writing – review. MT: conceptualisation, supervision, funding acquisition, writing – review. NP: conceptualisation, funding acquisition, project administration, supervision, writing – review & editing.Data availibility
The data are available in the excel file attached to the submitted article. The data for the duplicates are available upon request from the corresponding author.Conflicts of interest
There are no conflicts to declare.Acknowledgements
This work has received the support of “Institut Pierre-Gilles de Gennes” (laboratoire dexcellence, “Investissements davenir” program ANR-10-IDEX-0001-02 PSL and ANR-10-LABX-31.), Equipex IPGG (ANR-10-EQPX-34) and this work was carried out in the programme of “convention Etat-ANR relative à l’action valorisation – Instituts Carnot”. This work benefited from the technical contribution of the joint service unit CNRS UAR 3750. The authors would like to thank the engineers of this unit (and in particular Audric Jan and Bertrand Cinquin) for their advice during the development of the experiments. We also thank Marie-Caroline Jullien at IPR for her advice and proofreading, and Eric Kohler at IFP Energies nouvelles for his help in SEM EDS analysis.Notes and references
- A. N. Rehman, C. B. Bavoh, R. Pendyala and B. Lal, ACS Sustainable Chem. Eng., 2021, 9, 15075–15108 CrossRef CAS.
- L. K. Abidoye, K. J. Khudaida and D. B. Das, Crit. Rev. Environ. Sci. Technol., 2015, 45, 1105–1147 CrossRef CAS.
- C. T. Simmons, T. R. Fenstemaker and J. M. Sharp Jr, J. Contam. Hydrol., 2001, 52, 245–275 CrossRef CAS.
- G. Liu, H. Zhong, Z. Ahmad, X. Yang and L. Huo, Crit. Rev. Environ. Sci. Technol., 2020, 50, 2301–2378 CrossRef CAS.
- L. F. DeBano, J. Hydrol., 2000, 231, 4–32 CrossRef.
- M.-H. Hui and M. J. Blunt, J. Phys. Chem. B, 2000, 104, 3833–3845 CrossRef CAS.
- R. Lenormand, J. Phys.: Condens. Matter, 1990, 2, SA79–SA88 CrossRef.
- C. Cottin, H. Bodiguel and A. Colin, Phys. Rev. E: Stat., Nonlinear, Soft Matter Phys., 2011, 84, 026311 CrossRef PubMed.
- R. Dreyfus, P. Tabeling and H. Willaime, Phys. Rev. Lett., 2003, 90, 144505 CrossRef PubMed.
- J.-M. Lombard, PhD thesis, Paris 6, 1992.
- A. Mascini, M. Boone, S. van Offenwert, S. Wang, V. Cnudde and T. Bultreys, Geophys. Res. Lett., 2021, 48, e2021GL095185 CrossRef.
- A. Scanziani, Q. Lin, A. Alhosani, M. J. Blunt and B. Bijeljic, Proc. R. Soc. A, 2020, 476, 20200040 CrossRef PubMed.
- J. P. Stokes, D. Weitz, J. P. Gollub, A. Dougherty, M. O. Robbins, P. M. Chaikin and H. M. Lindsay, Phys. Rev. Lett., 1986, 57, 1718–1721 CrossRef PubMed.
- M. Cieplak and M. O. Robbins, Phys. Rev. Lett., 1988, 60, 2042–2045 CrossRef CAS.
- Q. Lin, B. Bijeljic, S. Berg, R. Pini, M. J. Blunt and S. Krevor, Phys. Rev. E, 2019, 99, 063105 CrossRef CAS.
- A. S. Al-Menhali and S. Krevor, Environ. Sci. Technol., 2016, 50, 2727–2734 CrossRef CAS PubMed.
- A. Mascini, V. Cnudde and T. Bultreys, J. Colloid Interface Sci., 2020, 572, 354–363 CrossRef CAS.
- M. Amirmoshiri, X. Wang, C. Bai, R. D. Tewari, S. X. Xie, R. Z. K. Bahrim, P. M. Singer, R. Farajzadeh, S. L. Biswal and G. J. Hirasaki, Energy Fuels, 2021, 35, 7681–7692 CrossRef CAS.
- R. Holtzman and E. Segre, Phys. Rev. Lett., 2015, 115, 164501 CrossRef PubMed.
- B. Zhao, C. W. MacMinn and R. Juanes, Proc. Natl. Acad. Sci. U. S. A., 2016, 113, 10251–10256 CrossRef CAS PubMed.
- C. Odier, PhD thesis, Université de Lyon, 2017.
- A. Irannezhad, B. K. Primkulov, R. Juanes and B. Zhao, Phys. Rev. Fluids, 2023, 8, L012301 CrossRef.
- B. K. Primkulov, A. A. Pahlavan, X. Fu, B. Zhao, C. W. MacMinn and R. Juanes, J. Fluid Mech., 2021, 923, A34 CrossRef CAS.
- T. Bultreys, W. De Boever and V. Cnudde, Earth-Sci. Rev., 2016, 155, 93–128 CrossRef.
- M. J. Blunt, B. Bijeljic, H. Dong, O. Gharbi, S. Iglauer, P. Mostaghimi, A. Paluszny and C. Pentland, Adv. Water Resour., 2013, 51, 197–216 CrossRef.
- D. Wildenschild and A. P. Sheppard, Adv. Water Resour., 2013, 51, 217–246 CrossRef.
- Y. Zhang, X. Zhao, P. Han, T. He, H. Yin, L. Zhang, Y. Feng and D. A. Weitz, Lab Chip, 2023, 23, 2808–2818 RSC.
- A. Anbari, H.-T. Chien, S. S. Datta, W. Deng, D. A. Weitz and J. Fan, Small, 2018, 14, 1703575 CrossRef.
- A. Jahanbakhsh, K. L. Wlodarczyk, D. P. Hand, R. R. Maier and M. M. Maroto-Valer, Sensors, 2020, 20, 4030 CrossRef CAS.
- M. Schneider, PhD thesis, Université Pierre et Marie Curie, Paris VI, 2011.
- C. Laroche, O. Vizika and F. Kalaydjian, J. Pet. Sci. Eng., 1999, 24, 155–168 CrossRef CAS.
- C. Chang, T. J. Kneafsey, J. Wan, T. K. Tokunaga and S. Nakagawa, Water Resour. Res., 2020, 56, e2019WR026789 CrossRef CAS.
- A. M. Saad, M. P. Yutkin, C. J. Radke and T. W. Patzek, Energy Fuels, 2022, 36, 5647–5656 CrossRef CAS.
- Z. Diao, S. Li, W. Liu, H. Liu and Q. Xia, Capillarity, 2021, 4, 50–62 CrossRef.
- L. Wang, K. Yin, Q. Deng, Q. Huang and C. J. Arnusch, Carbon, 2024, 219, 118824 CrossRef CAS.
- M. H. Schneider, H. Willaime, Y. Tran, F. Rezgui and P. Tabeling, Anal. Chem., 2010, 82, 8848–8855 CrossRef CAS PubMed.
- A. AlOmier, D. Cha, S. Ayirala, A. Al-Yousef and H. Hoteit, Lab Chip, 2024, 24, 882–895 RSC.
- S. Hu, X. Ren, M. Bachman, C. E. Sims, G. P. Li and N. Allbritton, Anal. Chem., 2002, 74, 4117–4123 CrossRef CAS PubMed.
- S. Hu, X. Ren, M. Bachman, C. E. Sims, G. P. Li and N. Allbritton, Electrophoresis, 2003, 24, 3679–3688 CrossRef CAS.
- S. Hu, X. Ren, M. Bachman, C. E. Sims, G. P. Li and N. L. Allbritton, Langmuir, 2004, 20, 5569–5574 CrossRef CAS PubMed.
- S. Hu, X. Ren, M. Bachman, C. E. Sims, G. P. Li and N. L. Allbritton, Anal. Chem., 2004, 76, 1865–1870 CrossRef CAS.
- D. Ramírez-Gutiérrez, C. Nieto-Draghi, N. Pannacci, L. V. Castro, F. Álvarez-Ramírez and B. Creton, Langmuir, 2015, 31, 1400–1409 CrossRef PubMed.
- E. M. Liston, J. Adhes., 1989, 30, 199–218 CrossRef CAS.
- R. D’Agostino, Plasma Deposition, Treatment, and Etching of Polymers, Elsevier, 1997 Search PubMed.
- M. Wertheimer, R. D’Agostino, P. Favia and C. Oehr, et al. , Plasma Processes Polym., 2005, 2, 7–15 CrossRef.
- J. M. Grace and L. J. Gerenser, J. Dispersion Sci. Technol., 2003, 24, 305–341 CrossRef CAS.
- S. Hemmilä, J. V. Cauich-Rodríguez, J. Kreutzer and P. Kallio, Appl. Surf. Sci., 2012, 258, 9864–9875 CrossRef.
- B. T. Ginn and O. Steinbock, Langmuir, 2003, 19, 8117–8118 CrossRef CAS.
- V. Sharma, M. Dhayal, S. M. Shivaprasad and S. C. Jain, Vacuum, 2007, 81, 1094–1100 CrossRef CAS.
- K. M. Kovach, J. R. Capadona, A. S. Gupta and J. A. Potkay, J. Biomed. Mater. Res., Part A, 2014, 102, 4195–4205 Search PubMed.
- V. Barbier, M. Tatoulian, H. Li, F. Arefi-Khonsari, A. Ajdari and P. Tabeling, Langmuir, 2006, 22, 5230–5232 CrossRef CAS PubMed.
- D. Lee and S. Yang, Sens. Actuators, B, 2012, 162, 425–434 CrossRef CAS.
- B. Da Silva, M. Zhang, G. Schelcher, L. Winter, C. Guyon, P. Tabeling, D. Bonn and M. Tatoulian, Plasma Processes Polym., 2017, 14, 1600034 Search PubMed.
- C. Huang, C.-H. Liu, C.-H. Su, W.-T. Hsu and S.-Y. Wu, Thin Solid Films, 2009, 517, 5141–5145 CrossRef CAS.
- D. Magni, C. Deschenaux, C. Hollenstein, A. Creatore and P. Fayet, J. Phys. D: Appl. Phys., 2001, 34, 87–94 CrossRef CAS.
- Y. Xia and G. M. Whitesides, Annu. Rev. Mater. Sci., 1998, 28, 153–184 CrossRef CAS.
- plugim!: Open source, customisable software for signal, and image processing, https://www.plugim.fr/.
- S. Bourg, S. Griveau, F. d'Orlyé, M. Tatoulian, F. Bedioui, C. Guyon and A. Varenne, Plasma Processes Polym., 2019, 16, 1800195 CrossRef.
- G. Morand, C. Guyon, P. Chevallier, M. Saget, V. Semetey, D. Mantovani and M. Tatoulian, Plasma Processes Polym., 2022, 19, 2200047 CrossRef CAS.
- E. Speirs, PhD thesis, Université de Rennes, 2023.
Footnotes |
| † Electronic supplementary information (ESI) available. See DOI: https://doi.org/10.1039/d4sm01461h |
| ‡ These authors contributed equally to this work. |
| This journal is © The Royal Society of Chemistry 2025 |