Tuneable microfibrillar collagen structures within dense chitosan hydrogels†
Enguerran
Devernois
,
Christophe
Hélary
 ,
Jérôme
Charliac
,
Gervaise
Mosser
and
Thibaud
Coradin
,
Jérôme
Charliac
,
Gervaise
Mosser
and
Thibaud
Coradin
 *
*
Sorbonne Université, CNRS, Laboratoire de Chimie de la Matière Condensée de Paris, 4 place Jussieu, Paris 75005, France. E-mail: thibaud.coradin@sorbonne-universite.fr; Tel: +33144274018
First published on 20th March 2025
Abstract
Chitosan-type I collagen hydrogels are paradigms of polysaccharide–protein assemblies with applications as biomaterials. However, preparing physical hydrogels combining them at comparable, high concentrations (>20 mg mL−1) within interpenetrated networks remains challenging. Here, we could combine chitosan and collagen solutions at 25 mg mL−1 to prepare two different types of concentrated hydrogels. When neutralized under ammonia vapours, mixed solutions form composite hydrogels, where collagen fibers exhibiting an unusual, branched morphology occupy a chitosan network porosity. In contrast, neutralization by immersion in liquid ammonia yielded hybrid networks where collagen microfibrils were associated with chitosan nanoaggregates. Structural variations impacted the mechanical behaviour and biological properties, assessed by 2D cultures of fibroblasts, of these hydrogels. Differences in gelation kinetics between the two biomacromolecules in the two processes appeared as a key factor driving the mixed network structuration. This work discloses a new route to obtain dense hydrogels from binary biopolymer systems and offers additional insights into the underlying gelation process.
1. Introduction
Polysaccharide–protein mixed hydrogels have attracted immense attention in food technology, especially thanks to their cost-effectiveness, edibility and biodegradability.1,2 In the field of biomaterials, such associations have become popular as they replicate aspects of the combination of proteins with glycosaminoglycans and proteoglycans found in extracellular matrices.3,4 Furthermore, inclusion of proteins with polysaccharides may help to address the important motifs driving cell response, such as adhesion or differentiation, that polysaccharide scaffolds alone may lack.5Hydrogels exhibiting an interpenetrated polymer network (IPN) structure, i.e. hydrogels where the two components form distinct but intertwined extended networks, are of particular interest.6,7 They can be formed from homogeneous mixtures either using a common gelation method, for instance when two thermally-gelling polymers are combined, or orthogonal ones, such as ionotropic and thermal gelation.8 However, several parameters can hinder their formation. A first challenge is to obtain homogeneous mixtures of the two components in solution, requiring identification of common pH, ionic strength and temperature solubility conditions, and also possibly facing the issue raised by the rapid increase of the viscosity of biomacromolecule solutions with their concentration.9 Secondly, even if orthogonal gelation methods are applied sequentially, the formation of the first network may impact the growth of the second one.10 Noticeably, this can happen even if a common gelation method is used when the kinetics of network expansion differ between the two systems.
In this context, hydrogels combining Type I collagen and chitosan constitute both interesting and particularly complex systems. Type I collagen in the tropocollagen form is soluble under acidic conditions (pH < 3) as rod-like semi-flexible macromolecules (300 nm × 1.5 nm).11 At higher pHs, the positive charge of the chains decreases and intermolecular hydrogen bonds permit the self-assembly of triple helices into fibrils whose size increases with pH.12,13 At the same time, fibrils assemble into fibers and gelation occurs upon percolation of the fibrous network, which is usually achieved at pH > 6.5.14 Noticeably, the value of the type I collagen isoelectric point (IEP) was reported to be between 5.5 and 9.13 Recent calculations suggest that there is in fact a broad range of pH values, between ca. 6 and 9, where the protein charge is almost zero.15 Chitosans, i.e. deacylated form of chitin, are also soluble under acidic conditions.16 Assuming that the IEP of chitosan is close to the pKa of secondary amines (6.5), almost all available glucosamine groups should be protonated at pH 5, ensuring chitosan solubility in acidic aqueous solution, thanks to its high positive charge, except at low deacetylation degree and high molecular weight.17 With increasing pH, intermolecular hydrophobic interactions can prevail over repulsive electrostatic interactions, leading to the aggregation of chitosan chains. A rapid neutralization process leads to chitosan precipitation, while a progressive pH increase can lead to controlled chitosan nanoaggregate growth and formation of a percolated network.18
On this basis, mixed physical hydrogels prepared by neutralization of type I collagen and chitosan acidic solutions have already been described.19 The most popular method is based on the neutralization of an acidic collagen–chitosan mixture with NaOH or on a thermo-induced gelation using β-glycerophosphate.20,21 However, for concentrated polymer solutions, homogeneous mixing with the gelation solutions is hindered by their high viscosity. This issue can be addressed by using a gas phase process where the acidic mixtures are neutralized under ammonia vapours.22 Resulting morphologies ranged from chitosan nanoaggregates bridged by collagen fibres to collagen fibres coated with chitosan nanoaggregates.20,23,24 However, none of these hydrogels were prepared from concentrated collagen solutions and no detailed structural studies beyond SEM images were provided.19 In terms of biological properties, there is a general observation that mixed hydrogels could exhibit improved cell adhesion, proliferation and differentiation, with an overall beneficial effect on bone formation both in vitro (using osteoblasts or mesenchymal stem cells) or in vivo.20,25 It has been suggested that the effect of chitosan was mainly related to its influence on the structural and mechanical properties of the hydrogels, while collagen could favour cell adhesion and hydrogel degradation in vivo.20,26
In order to extend the range of available compositions of such mixed hydrogels that can be used as biomaterials, as well as to understand interactions at stake in co-gelling IPN-like biopolymer systems, this study reports the synthesis and characterization of chitosan–collagen I physical hydrogels starting from highly concentrated solutions (≥25 mg mL−1). Multiscale imaging highlighted the morphological evolution of both components with collagen concentration and the influence of the preparation methods. Mechanical and rheological studies provided further information on the interplay between the networks. Finally, 2D cultures of human fibroblasts were performed to evaluate the impact of hydrogel composition and microstructure on cell adhesion and proliferation.
2. Materials and methods
2.1. Preparation of the mixed hydrogels
Sterile type I collagen was extracted from rat-tail tendons according to an existing protocol and kept at 4 °C.27 Initial collagen concentration was determined by hydroxyproline titration. A collagen solution at 25 mg mL−1 in 0.125 M acetic acid was prepared by controlled evaporation. Chitosan powder (medium molecular weight, viscosity η = 110 mPa s at 1% in 1% acetic acid at 20 °C, deacetylation degree (DDA) = 96.1%, Heppe Medical Chitosan) was purified prior to use. Chitosan powder was dissolved in a 5% acetic acid solution and filtered through a 0.45 μm membrane. It was then precipitated using 30% (w/v) ammonia solution and washed using H2O until the pH in the supernatant becomes neutral. Finally, it was lyophilised for 48 h and kept for further use. Chitosan acidic solutions were prepared by dissolving the lyophilised powder in acetic acid (0.125 M) overnight at room temperature. No significant modification in viscosity could be measured after purification.Chitosan–collagen type I hydrogels (3 mL) at fixed final chitosan content (25 mg mL−1) and varying final collagen content (0–7.5 mg mL−1) were prepared. For this purpose, 2.7, 2.4 or 2.1 mL of a chitosan solution at 27.7, 31.0 or 35 mg mL−1 were mixed with 0.3, 0.6 or 0.9 mL of the 25 mg mL−1 of the collagen solution.28 Hereafter, samples are designated based on the collagen![[thin space (1/6-em)]](https://www.rsc.org/images/entities/char_2009.gif) :
:![[thin space (1/6-em)]](https://www.rsc.org/images/entities/char_2009.gif) chitosan weight ratio in percent, i.e. 10, 20 or 30%.
chitosan weight ratio in percent, i.e. 10, 20 or 30%.
Because of their high viscosity, solutions were collected using a positive displacement pipet (Gibson, M1000E) and mixed with an IKA Ultra-Turrax T25 Basic Disperser in a Petri dish. Head speed was fixed at 6500 rpm and mixing time was 30 s. Then, gel formation was induced by increasing the pH using 1 M ammonium hydroxide solution according to two protocols. The vapour or gas process consisted in exposing the solution to ammonia vapours for 24 h in a closed vessel, as already described for collagen, chitosan and collagen–chitosan mixtures.22,29,30 The wet or liquid process consisted in immersing the acidic solution in the NH4OH solution for 1 h, as already reported for chitosan only.31 In both cases, 40 mL of ammonia solution were used to neutralize 3 mL of the acidic mixtures. Recovered hydrogels were thoroughly washed with deionized water to remove the excess of ammonium hydroxide and acetate salts. A detailed protocol is available in the ESI.†
2.2. Scanning electron microscopy (SEM)
The internal morphology of the hydrogels was assessed using scanning electron microscopy (SEM) using a Hitachi S-3400N microscope operating at 10 kV. Gels were fixed overnight at 4 °C in a solution of 4% PFA/2% glutaraldehyde in phosphate saline buffer (PBS 1X) and rinsed with PBS three times. Sample preparation was achieved by dehydration for 1 h using graded ethanol solutions (30%, 50%, 70%, 90% and 100%) and critical point drying. Prior to SEM observation, samples were coated with a 20 nm gold layer.2.3. Transmission electron microscopy (TEM)
Sample observation was also performed using transmission electron microscopy (TEM) using a Tecnai spirit G2 microscope operating at 10 kV. Samples were fixed with a mixture of 2.5% glutaraldehyde, 2% formaldehyde, 0.18 M sucrose, 0.1% picric acid in 0.1 M Sorensen phosphate buffer (SPB) at pH 7.4, for 1/2 h. 1% OsO4 was then added to the fixative mixture for 30 min. Samples were then washed three times with distilled water before dehydration in a series of graded ethanol (30%, 50%, 70%, 90% and 100%). Samples were embedded in non-antigenic LR white resin and sectioned (60 nm) using an ultra-microtome (EM UC7, Leica) with a diamond knife and transferred to 200 mesh Cu grids, coated with a grid-coated pen.2.4. Second harmonic generation/2-photon excitation fluorescence (SHG/2PEF) microscopy
The spatial distribution and architecture of collagen were observed using second harmonic generation (SHG) coupled to 2-photon excitation fluorescence (2PEF) microscopy. To image chitosan, fluorescein 5(6)-isothiocyanate (FITC) was grafted onto chitosan according to an existing protocol.32 Briefly, FITC at 1 mg mL−1 was dissolved in methanol and added to a chitosan acidic solution (10 w% in 0.125 M acetic acid). It was stirred at RT in the dark for 4 h and precipitated using a 1 M NaOH solution. The precipitate was rinsed using water–ethanol mixtures and water until no fluorescence was detected in the supernatant and the pH became basic. Images were obtained using an Upright Leica CFS microscope. The analysis of collagen structures was performed using the AnalyzeSkeleton plugin in the Image J software (open source, version 2.0.0-rc-43/1.52n), as detailed in Fig. S1 (ESI†).2.5. Single polymer gel formation kinetics
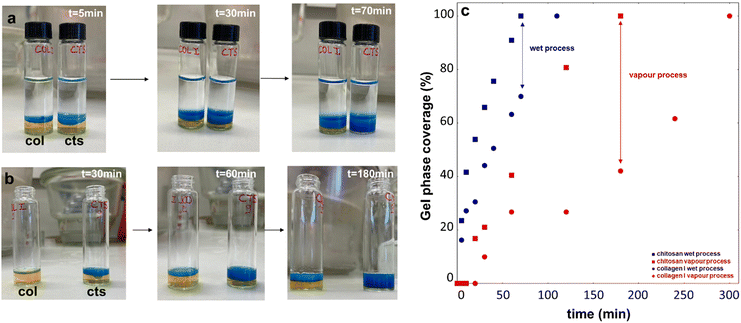
The kinetics of neutralization of the two biopolymers were studied using bromothymol blue as a pH colour indicator.33 For this, a solution of bromothymol blue at 0.1% in acetic acid (0.125 M) was prepared by introducing 4 mg of powder in 4 mL of acidic solution. At this concentration, the solution was saturated. Excess bromothymol blue was removed using a 0.22 μm filter. Chitosan solution at 25 mg mL−1 in the polymer was prepared by dissolving chitosan in acidic solution with a few droplets of a colour indicator. Collagen I solution was prepared by introducing a colour indicator in the collagen I acidic solution used for this study. 2 mL of each solution were poured in a 15 mL glass container. For the wet process, 5 mL of ammonia solution at 1 M was introduced in the glass container. For the vapour process, solutions were exposed to ammonia vapour in a desiccator. The evolution of the sol–gel interface was followed with a colour change from yellow (2 < pH < 6) to blue (pH > 7.5). Using ImageJ, the distance between the top and bottom of gel phase was measured (gel phase height), along with the distance between the top of gel and the bottom of the solution (total height). The kinetics here can be defined as the distance covered by gel phase as compared to the total distance. Gel coverage was calculated as follows (eqn (1)): | (1) |
2.6. Rheological and mechanical studies
The viscosity of the solutions was measured using an MCR-302 rheometer (Anton Paar). Tests were carried out at 25 °C using a cone–plate geometry with an 1° angle. Viscosity was determined for the shear rate from 0.01 s−1 to 100 s−1. η values were determined at a shear rate of 0.01 s−1. Viscoelastic properties of the hydrogels were assessed at 25 °C in amplitude mode using a plate–plate (25 mm) geometry with an applied normal force of 0.2 N, a frequency of ω = 1 rad s−1 and deformation γ ranging from 0.0001 to 100%.Unconfined compression tests were performed on hydrogels (n = 5). Hydrogels had a cylindrical shape with a height of 5 mm and diameters of 21 mm for each condition. Tests were carried out up to 80% strain on a 34SC-5 machine (INSTRON) equipped with a 50 N load cell, Bluehill software and using two nonporous plates. All experiments were performed at a constant rate of 0.01 mm s−1, with a commutation preload of 0.10 N at a rate of 0.20 mm min−1. The compressive modulus was obtained from the slope of the initial linear (<20%) region.
2.7. 2D cell culture
Normal human dermal fibroblasts (NHDFs, from Promocell (Germany)) were used from passage 4 to 7. Cells were cultured in a 5% CO2 humidified incubator (Thermo Scientific) and the medium (DMEM 1X, 10% v/v of foetal bovine serum, 1% penicillin/streptomycin and 1% fungizone) was changed every 3 days. Hydrogels were prepared as described previously in 4-well plates. 0.5 mL of NHDF suspension at a density of 50![[thin space (1/6-em)]](https://www.rsc.org/images/entities/char_2009.gif) 000 cells per mL were deposited on each gel. Samples were placed in a 5% CO2 humidified incubator and cultured for 7 days. Medium was changed every 3 days.
000 cells per mL were deposited on each gel. Samples were placed in a 5% CO2 humidified incubator and cultured for 7 days. Medium was changed every 3 days.
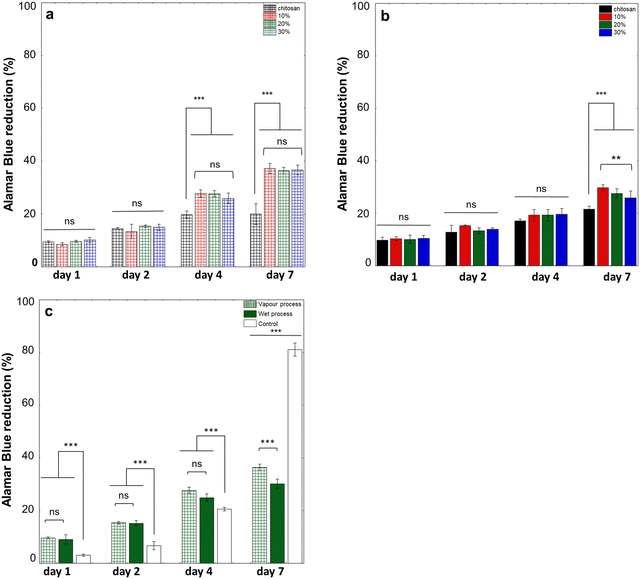
Cellular metabolic activity was assessed by using Alamar blue at Day 1 (D1), Day 2 (D2), Day 4 (D4) and Day 7 (D7). Medium was removed and replaced with complete medium without phenol red. Fresh medium with 10% (v/v) Alamar blue reagent was put in contact with gels for 4 h. After colour change, it was removed and the absorbance of the supernatant was measured at 570 nm and 600 nm. Reduction percentage was calculated according to the supplier recommendations.
At D1, D2, D4 and D7, cells were fixed with 4% PFA, permeabilized using PBS – 0.2% Triton and stained with phalloidin (1/200 dilution in PBS) and DAPI (1/5000 dilution in PBS). Phalloidin stains the actin filament in cell cytoskeletons and DAPI stains cell nuclei. Samples were observed with an Upright Leica confocal scanning microscope. Images were processed using imageJ software.
2.8. Statistical analyses
Data were presented as mean values ± standard deviation. Statistically significant differences between the samples were determined using a one-way ANOVA with a Tukey-Kramer's posthoc test. The level of statistical significance was set for p = 0.05. *p < 0.05, **p < 0.01, and ***p < 0.005.3. Results
3.1. Preparation and structural characterization
Using an ultra-turrax stirrer, it was possible to obtain homogeneous mixtures of collagen and chitosan despite the high viscosity of the starting solutions (ηcollagen > 60 Pa s, ηchitosan = 0.3–1 Pa s). Both wet and vapour routes resulted in homogeneous gels at the macroscopic scale even for increasing collagen content (Fig. 1). These gels retained their initial shape upon demoulding and did not collapse under their own weight.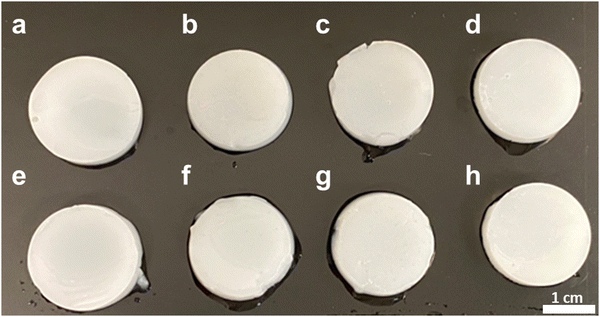 | ||
| Fig. 1 Macroscopic views of gels obtained by the (a)–(d) the wet process ((a) chitosan, (b) 10%, (c) 20%, (d) 30%) and (e)–(h) the vapour process ((e) chitosan, (f) 10% (g) 20%, (h) 30%). | ||
Combination of second harmonic generation (SHG) microscopy with 2-photon excitation fluorescence (2PEF) microscopy was used to image the repartition of type I collagen (in red) into the FITC-chitosan matrix (in blue) (Fig. 2). At this scale, the chitosan network appeared continuous, confirming the absence of phase separation at the macroscale. Meanwhile, collagen was present as dispersed fibrillar structures rather than forming a continuous network.
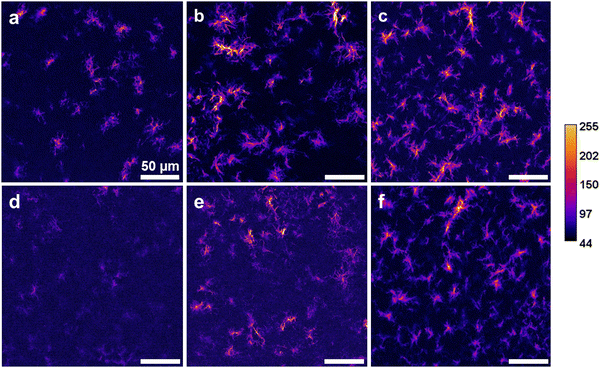
SHG microscopy was further used as a structural probe for collagen I (Fig. 3). For all preparation conditions, the relative area occupied by collagen structures observed by SHG seemed to increase with the collagen ratio. Moreover, brighter structures were observed in 20% samples compared to 10%. However, at same concentrations, signals were fainter for samples obtained by the liquid route compared to the gaseous one and required longer signal accumulation to visualize collagen, especially for the 10% (w/w) sample. These structures appeared to consist of a core bright fibre several tens of micron in length surrounded by numerous shorter fibrils of various lengths and signal intensity.
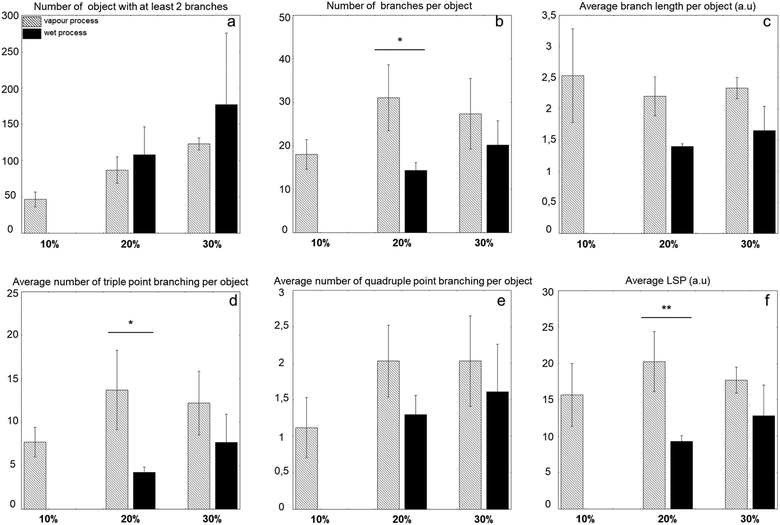
In order to draw quantitative information about the organization of the collagen network, branching analysis was performed using the AnalyzeSkeleton plugin (Fig. S1, ESI†). Main extracted parameters are gathered in Fig. 4. In the case of the vapour process, these analyses confirmed that the number of structures, as defined by distinct objects possessing at least two branches, was increasing with collagen concentration. The number of branches per structure as well as the branching degree, as estimated from triple and quadruple point occurrence, increased from 10% to 20%, and then remained comparable at 30%. Meanwhile, the average branch length and the longest shortest path (i.e. shortest distance between the two most extreme pixels of a given nanoaggregate) remained constant. For samples obtained via the liquid process, no reliable data could be obtained for 10% due to the low intensity of the signal. There was a trend in increase of all parameters, including the average branch length with collagen content. When the two preparation methods were compared, there was a trend toward more nanoaggregates formed via the liquid process for the same collagen concentration but all other parameters were smaller than, or at best comparable to, those measured for samples obtained by the vapour process.
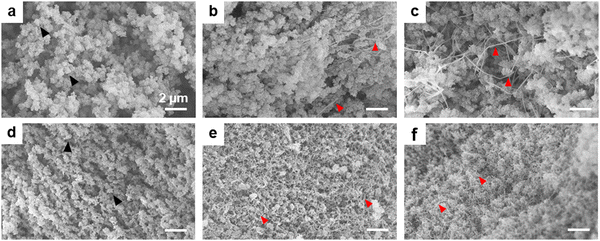
The network morphology at the micron scale was assessed by SEM after sample fixation, dehydration and supercritical CO2 drying (Fig. 5 and Fig. S2, ESI†). Although not free of artefacts, this treatment is well-adapted to preserve the porosity of biopolymer-based hydrogels upon drying and compare samples prepared using the same protocol.34 For both synthesis routes, chitosan-only gels had a porous structure composed of interconnected porous nanoaggregates. However, while individual nanoaggregates ca. 500 nm in size were easily distinguished in vapour processed-samples (Fig. 5a), less defined aggregates were observed in the wet-processed ones (Fig. 5d). For both synthesis routes, the mixed networks consisted of nanoaggregates (chitosan) and fibrils (collagen). However, the vapour process produced fibrils >100 nm in diameter located in between chitosan structures that seemed to be preserved with increasing collagen content. A different network was obtained using the wet process as it consisted in thinner fibrils intertwined with the chitosan structures, whose size appeared to decrease with increasing collagen content.
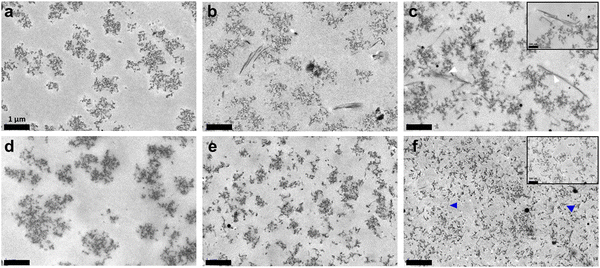
TEM imaging first confirmed that while chitosan nanoaggregates were not significantly impacted by the presence of collagen in vapour-gelled samples, their size decreased with increasing collagen content in wet-gelled ones, from ca. 500 to 1000 nm without collagen to <500 nm in the 30% sample (Fig. 6 and Fig. S2, ESI†). In parallel, under the ammonia vapours, collagen type I self-assembled into defined fibrils, presenting a typical D-banding pattern that could be up to 3 μm long. The number of fibrils appeared to increase with increasing collagen content. Furthermore, they appeared to branch out following various shapes (T-junction, curvature, etc.). Although collagen was mostly located in the spaces between chitosan structures, some contact points between the two components could be distinguished. The wet process produced very different networks, in agreement with SEM observations. Mixed networks were composed of chitosan nanostructures and short and very thin collagen fibrils. While these two components were easily distinguished at low collagen content, the increase in collagen concentration favoured the formation of smaller collagen and chitosan structures.
It was hypothesised that structural differences might arise from differences in gel formation kinetics between the two polymers. As shown in Fig. 7a and b, chitosan gelation was faster than collagen gelation under the two neutralization routes. Moreover, both polymers gelled faster in the liquid process than in the gaseous route. Thus, when full chitosan gelation was achieved under ammonia vapours, only 40% of the collagen gel was formed, whereas ca. 80% of collagen had gelled when chitosan was fully gelled after immersion in liquid ammonia (Fig. 7c).
3.2. Rheological and mechanical analyses
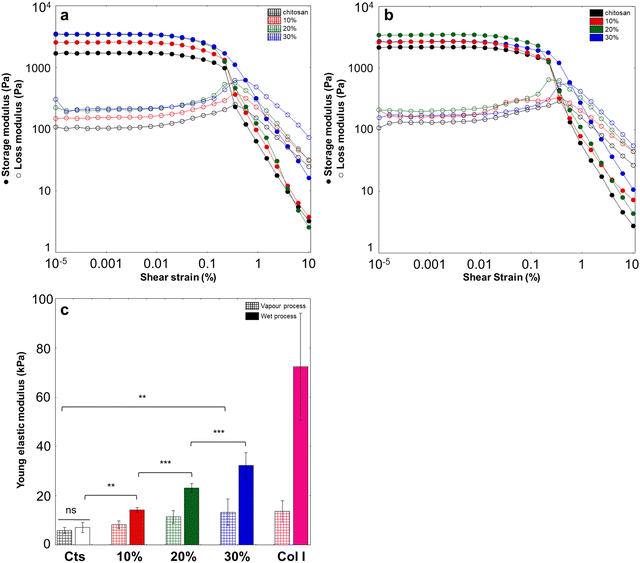
For all samples, rheological measurements confirmed the formation of gels because the storage modulus G′ was greater than the loss modulus G′′ at low deformation (<0.1%) (Fig. 8a and b). For both types of gels, G′ increased with collagen content up to 20%, from 1. 6 kPa to 3.6 kPa for vapour and from 2.1 kPa to 3.4 kPa for the wet process. It then remained stable for the “gas” sample, while it slightly decreased for the “liquid” sample. At higher deformation, G′ values decreased for all samples until they become smaller than G′′, reflecting gel breaking. Noticeably, the deformation value at which the G′ and G′′ curves crossed, indicative of gel breaking, increased in the 30% condition for both preparation methods.In parallel, unconfined compression tests highlighted a regular increase in compressive Young's modulus with increasing collagen content for both types of hydrogels (Fig. 8c and Fig. S3, ESI†). However, this increase was more significant for wet-processed hydrogels. While chitosan-alone hydrogels exhibited similar initial moduli (ca. 7–8 kPa), mixed gels obtained by the wet process showed higher moduli than those obtained by the gaseous route for the same collagen content, with the 30% hydrogel reaching ca. 35 kPa obtained in the wet process and ca. 12 kPa only in the vapour process. As comparison, collagen hydrogels at 25 mg mL−1 exhibited compressive Young's moduli of 70 kPa and 20 kPa, when obtained via the wet process and the vapour process, respectively.
3.3. Behaviour of normal human dermal fibroblasts on mixed hydrogels
To check the influence of hydrogel composition and structure on adhering cells, NHDFs, whose behavior on chitosan–collagen mixed coatings was previously reported,35 were seeded on their surface and cultured over one week. For both processes, metabolic activity together with cell density and morphology was assessed. For gels obtained using vapour process, the metabolic activity increased from D1 to D2 for all samples and with no significant difference between them (Fig. 9a). At D4, metabolic activity increased for all hydrogels containing collagen, without significant differences depending on the collagen content, and was higher than for pure chitosan hydrogels. At D7, metabolic activity levelled off for pure chitosan hydrogels, while it further increased for mixed hydrogels, with again no effect of collagen content.For hydrogels prepared by the wet process, metabolic activity increased between D1 and D2 and remained stable for all samples, with no significant influence of the presence of collagen (Fig. 9b). At D4, NHDF's metabolic activity was increased for all samples but was significantly lower on pure chitosan hydrogels. At D7, metabolic activity did not significantly increase on pure chitosan hydrogels, whereas it increased on hybrid hydrogels. In contrast to the gaseous process, differences based on collagen content were observed, with cells on 10% hydrogels showing a significantly higher metabolic activity than on 30% hydrogels at D7. Finally, the two preparation methods were compared for a selected composition (20%) (Fig. 9c). From D1 to D4, there was no difference in metabolic activity between the two gelation methods. Differences were significant at D7, with metabolic activity on hydrogels obtained by a gaseous process being higher than on those obtained by the wet process. Compared to cells seeded on a control plastic plate, metabolic activity was higher on hydrogels until D4 but then lowered at D7.
Cells nuclei and cytoskeletons were observed to investigate the influence of the substrate on cell adhesion and morphology (Fig. 10 and 11). On pure chitosan hydrogels, a few cells exhibiting a round morphology were observed at D1, independent of the gelation process. Nuclei stained with DAPI suggested that cells were clustered on the hydrogel surface (Fig. S4, ESI†). At D4 and D7, the cells remained scarce and rounded for hydrogels prepared by the two routes. For mixed hydrogels prepared by the vapour process (Fig. 10), a few spindle-like NHDFs were observed at D1, without any sign of clustering (Fig. S4, ESI†). At D4, more cells were visible with a larger spreading surface. At D7, confluency has been reached with numerous and well-spread cells being visible, with no clear impact of collagen content. For hydrogels obtained by the wet process (Fig. 11), scattered spindle-like NHDFs were also observed at D1. At D4, cells have proliferated and spread on the 10% hydrogels and continued to do so at D7, but to a lesser extent than on 10% hydrogel obtained by the gaseous process. For the 20% and 30% hydrogels, NHDF spreading was markedly lower than in the 10% hydrogel at D4 and D7. Cell counting based on DAPI nuclei staining paralleled Alamar blue data (Fig. S5, ESI†). The cell density increased over culture time for all mixed hydrogels but not for pure chitosan systems, and the influence of collagen content was only observed on gels obtained by the wet process at D7.
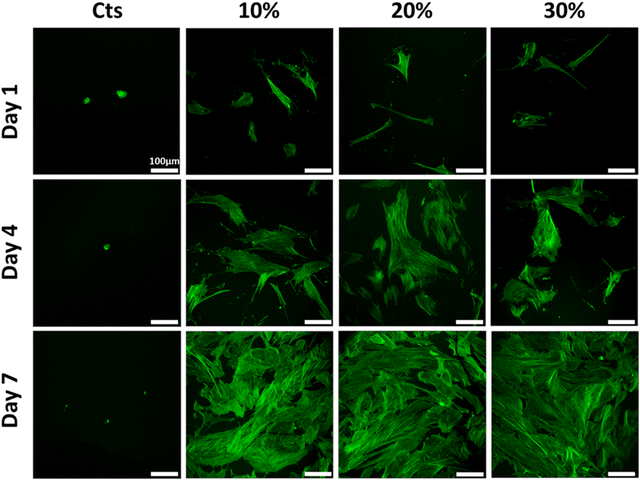 | ||
| Fig. 10 NHDF cytoskeleton morphologies on hydrogels obtained by the gaseous process. Cytoskeletons were stained with phalloidin. Scale bar: 100 μm. | ||
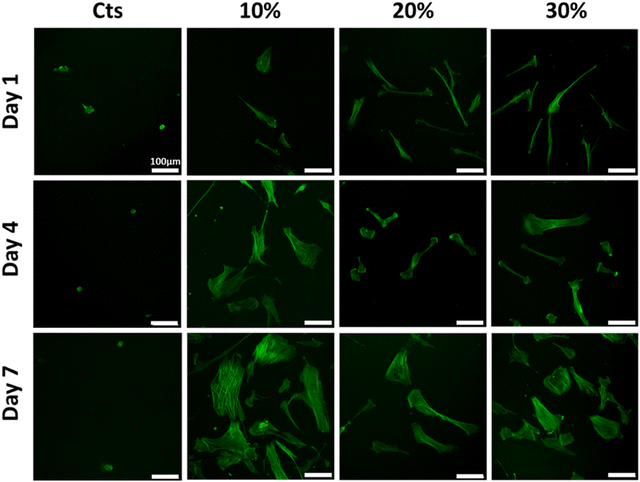 | ||
| Fig. 11 NHDF cytoskeleton morphologies on hydrogels obtained by the wet process. Cytoskeletons were stained with phalloidin. Scale bar: 100 μm. | ||
4. Discussion
4.1. Preparation of concentrated collagen–chitosan hydrogels
The aim of this work was to prepare dense physical hydrogels combining chitosan and collagen that could be used as biomaterials for tissue repair. To favour the formation of mixed networks with IPN-like organization, methods allowing for both chitosan and collagen gelation were screened. In the literature, three main approaches relying on the neutralization of an acidic mixture of the two biomacromolecules were previously described: (i) the diffusion of ammonia vapours, (ii) the addition of a sodium hydroxide solution and (iii) the addition of a β-glycerophosphate solution.20,22,25 An alternative interesting methodology, already used for the formation of chitosan dense hydrogels but not for collagen or mixed systems, relies on the immersion of the macromolecule solution in excess liquid ammonia.31 However, this requires concentrated polymer solutions to avoid their redispersion before gelation. This is probably the main reason why it was previously used only for chitosan, for which concentrated solutions are commonly used in contrast to collagen.19The first challenge to address was to prepare mixed solutions at high concentrations. In the case of chitosan, the use of a polymer with low MW and high DA is favourable to its dissolution in acidic medium.16 In terms of viscosity, it was previously shown to increase with chitosan concentration with a sharp increase beyond a critical value. This was attributed to a change in the molecular organisation of the solution.30 This concentration was called the second critical concentration above which the self-association of polymer chains leads to the formation of nanometric aggregates. This might represent a frontier between the semi-dilute and the concentrated regimes.33,36 The concentration of the initial solution also strongly affects the properties of the resulting physical hydrogel. Mechanical properties improve with increasing concentrations. Low concentrations (<0.5% (w/w)) lead to hydrogels with weak mechanical properties due to low chain entanglement, but very high concentrations (>10% (w/w)) lead to inhomogeneous hydrogels.36 Here, based on previous reports, the concentration was fixed to an intermediate 2.5% (w/w), i.e. 25 mg mL−1.28 Considering that substantial collagen:chitosan ratios were looked for, it was also necessary to use collagen solution with comparable, and therefore high, concentration. Noticeably, at 25 mg mL−1 in acidic solutions, collagen triple helices are in a concentrated, repulsive regime which could, in principle, favor their interaction with chitosan over collagen–collagen association.37 Here, high mechanical energy, as provided by a disperser, allowed to obtain solutions, which, after neutralization using ammonia vapours or liquid ammonia, led to macroscopically homogeneous hydrogels. Importantly, both the observation of D-banded fibrils by TEM and the possibility to image collagen using SHG indicate that the process does not induce significant collagen denaturation.
4.2. Concentrated collagen–chitosan hydrogels’ structural properties
From chitosan-only solutions, homogeneous hydrogels were obtained by using the two protocols. However, they exhibited distinct microstructures, with more regular and smaller chitosan nanoaggregates being obtained by the vapour process. It has been shown that physical chitosan hydrogels undergo a dynamic structuration process, with slow gelation favoring finer and more organized structures.38 In this context, our kinetics study highlighted that chitosan gelation was faster in the liquid process compared to the gaseous route. The latter implies an initial step during which ammonia has to go from the gaseous to liquid phase at the chitosan/ammonia interface, which contributes to mass transfer resistance.31 Moreover, during neutralization by ammonia vapour, the first external layer is formed at the surface of the solution and the internal gel is formed after the diffusion of ammonia through the membrane.36 In the case of the wet process, the chitosan solution is instantaneously in contact with a high concentration of ammonia and its diffusion is favored by the large concentration gradient, making the gelation faster. However, the neutralisation route had little impact on the mechanical and rheological properties of the pure chitosan hydrogels. Noticeably, a previous study reported lower Young's moduli for gels prepared by a vapour process compared to a wet process but, in this case, NaOH solution was used instead of liquid ammonia as a neutralizing bath.39In the case of the vapour process, SEM and TEM indicate that the microstructure of the chitosan network is not significantly modified by the presence of collagen. Meanwhile, large collagen fibrils occupy the porosity of the chitosan network. In parallel, SHG suggests that nanoaggregates’ growth favors branched structures. This would be in favor of a two-step process where the chitosan network is first formed followed by collagen self-assembly. This is in agreement with our kinetics study showing that under ammonia vapours, when full chitosan gelation is achieved, only 40% of the collagen gel is formed. This self-assembly process would mainly occur in a confined media, thus explaining why collagen fibril branching prevails over extension. Moreover, the increase of nanoaggregate number rather than nanoaggregate size with collagen concentration and the nanoaggregate organization would indicate a nucleation-controlled process, which is often observed in confined media.
In contrast, in the liquid process, the chitosan elementary nanoaggregates decrease in size and become entangled with thin collagen fibrils. At the same time, SHG suggests that more collagen structures are formed as compared to the vapour process, with larger spatial expansion (smaller longest shortest path) but less branching. This would be in favor of more simultaneous aggregation/self-assembly of chitosan and collagen chains. This is supported by the fact that under this neutralization condition, when full chitosan gelation is achieved, ca. 80% of collagen has already gelled.
It is also important to point out that during neutralization, both polymers undergo a change in charge state, with chitosan becoming neutral and collagen becoming neutral and then negatively charged. If neutralization occurs at a comparable rate for the two components, there can be an intermediate stage where both polymers are neutral, which can favor their interaction by decreasing electrostatic repulsion and promoting attractive hydrogen bonds.40 This would explain why, in the wet process, chitosan nanoaggregates undergo a morphological change with increasing collagen amount, forming a hybrid network.
4.3. Concentrated collagen–chitosan hydrogels’ mechanical and rheological properties
It was observed that collagen had little effect on the compressive Young's modulus in the vapour process but significantly increases Young's modulus for wet-prepared gels. In parallel, the G′ value increased up to 20% (w/w) and then leveled-off in the vapour process but decreased in the liquid process. It is worth noting that because the hydrogels are prepared at fixed chitosan content and increasing collagen content, the total concentration of biomacromolecules in the solution and gels is not constant, which could explain observed variations. To check this point, hydrogels were prepared with only chitosan but containing the same total polymer concentration as the 30% chitosan–collagen samples. In the case of the wet process, both hydrogels exhibited the same Young's modulus, whereas in the gaseous process, the pure chitosan hydrogel showed a higher modulus than the mixed system. (Fig. S6, ESI†). In parallel, G′ values at low deformation were the same for 30%-like pure chitosan and 30% mixed hydrogels for both processes but the strain at break was much lower for the chitosan-only samples.Thus, in the case of vapour-induced gelation, the presence of collagen microfibrils can be considered as defects in the chitosan network, as some favorable chitosan–chitosan interactions are lost, while new collagen–chitosan interactions are either weak or even unfavorable. In this case, the increase in polymer content with increasing collagen amount, that should increase Young's modulus, is balanced by the parallel decrease in binding interactions. However, the fact that increasing collagen content increases the G′ value and the deformation at break suggests that the protein contributes differently to the behaviour of the hydrogel under compression and to its dynamic behaviour under shear. Collagen fibers are formed by the close stacking of fibrils, which are themselves constituted of assembled collagen triple helices. It has been reported that fibrils have an elastic modulus in the order of GPa and fibers in the MPa range, depending on the fiber diameter.41 Under tension, fibril–fibril interactions first offer resistance to the strain (increasing G′) and then fibrils can slide one along the other in a reversible manner, conferring deformability to the fibers, until they detach irreversibly (increasing deformation at break). With increasing collagen concentration, SHG analyses revealed that collagen structures did grow in number but not in size. In other words, there are more objects that can contribute to the elastic response but they individually exhibit a similar resistance to strain.
In the case of the wet route, new hybrid networks are formed consisting of thin collagen fibrils and small chitosan nanoaggregates different from those of pure chitosan hydrogels at the same concentration. In that sense, direct comparison with the chitosan-alone hydrogel properties is not straightforward. The decrease in chitosan nanoaggregates’ size with increasing protein content increases their interface with other chitosan nanoaggregates which should increase their Young's modulus. Again, collagen fibers can destabilize the chitosan network by creating collagen–chitosan interactions to be detriment of chitosan–chitosan interactions. However, the fact that Young's modulus increases with collagen content suggests that such collagen–chitosan interactions are favorable. Moreover, it was previously shown that small collagen fibers have a large load-bearing capacity so that they can directly contribute to this increase. From the rheological perspective, an increase in G′ and deformation at break was noticed, except for the 30% mixed sample where G′ decreased. At such content, TEM indicates that the hydrogel can no longer be described as a chitosan network modified by collagen but rather as a hybrid chitosan–collagen network. It therefore becomes difficult to compare its behaviour with those obtained at lower collagen content.
Importantly, none of these data suggest that a percolated collagen network was formed, in agreement with imaging techniques that did not allow to evidence connections between the fibrillar structures. In that sense, here-obtained mixed hydrogels cannot be considered as IPN per se but rather as composite materials, with collagen fibrils acting as fillers of the chitosan network in the vapour process, or hybrid materials, composed of collagen and chitosan interacting at the nanoscale, in the liquid process.
4.4. Concentrated collagen–chitosan hydrogels as substrates for NHDFs
The possibility to obtain two types of organization for hydrogels containing the same collagen and chitosan content opens the possibility to compare the influence of their microstructure on their interaction with cells. Here normal human dermal fibroblasts were selected because their interaction with a wide diversity of biomaterials has been reported.42 It was first noticed that the time evolution of metabolic activity closely follows that of cell proliferation, indicating that none of the substrates are cytotoxic for NHDFs. Then, gathered data indicate that for both processes, the presence of collagen improves cell adhesion, spreading and proliferation compared to chitosan-only hydrogels, even at a low collagen ratio (10%). In fact, for chitosan-only hydrogels, cell adhesion is drastically altered and cell nuclei formed clusters, suggesting that cell–cell interactions are favoured over cell–substrate interactions, whereas the presence of collagen introduces binding sites for NHDFs allowing for their homogeneous adhesion and spreading. Noticeably, in the vapour process, an increase of the collagen content leads to negligible variations in cell proliferation and spreading, which can be paralleled by the absence of a significant change in Young's modulus. In contrast, in the liquid process, higher collagen concentrations, correlated with an increase of Young's modulus, seem to limit surface colonization. Yet, the Young's modulus value varies in the 10–30 kPa range which, according to the literature, should not impact NHDF adhesion and spreading.43 In parallel, there is no correlation between G′ values and cell behaviour. Altogether, the rheological/mechanical properties of the hydrogels do not appear to be determining parameters for the NHDF's response to the hydrogels. Therefore, the surface topology of the two types of gel has to be considered.The vapour process leads to large fibrillary structures, which should be favorable to cell adhesion and spreading.44 Although the size and number of collagen structures increased with collagen content between 10 and 20%, this has no clear influence on cell behaviour. This points out that the structure of the collagen fibrils is more important than their density on the gel surface under our conditions. In fact, SHG and TEM indicate that the distance between collagen structures is already ca. 5–10 μm for the 10% sample, which is smaller than the cell dimension. Therefore, all cells can have access to several adhesion sites, even at confluency.
For the gels obtained by the liquid phase, fibrillary structures are smaller. Moreover, and probably more importantly, they are closely intertwined with chitosan nanoaggregates that appear unfavorable to cell adhesion. As collagen concentration increases, the hybrid nature of the network becomes more marked, which can explain why NHDF spreading and proliferation become more limited.
5. Conclusions
This worked aimed at designing mixed physical hydrogels combining chitosan and collagen at high concentrations with potential applications as biomaterials. The use of a high-energy homogenizer was critical to achieve homogeneous mixing of viscous solutions without denaturing collagen. Neutralization of these solutions resulted in hydrogels consisting of microfibrillar collagen structures associated with chitosan nanoaggregates. However, the neutralization route had a profound impact on the hydrogel structure, related to the kinetics of gelation, – especially the difference in the gelation rate between collagen and chitosan, as well as transitory pH conditions that can affect their mutual interactions. In particular, instead of IPN where both biomacromolecules would form continuous networks, composite-like or hybrid structures were obtained. The gelation route also strongly impacted the cell response to the hydrogel surface which appears more sensitive to the collagen microstructure than to the collagen content. In this perspective, the vapour process seems more adapted to the future design of biomaterials. Moreover, it would be interesting to increase the relative content of collagen in the mixed hydrogels and explore an alternative composition range where the protein is the major component. In parallel, the unusual, branched morphology of collagen structures observed in our work calls for a closer investigation of collagen fibrillogenesis in confined environments.Author contributions
Conceptualization, resources, supervision, validation: T. C.; formal analysis: J. C., T. C., E. D., C. H., G. M.; investigation: J. C., E. D., G. M.; methodology: T. C.; E. D.; C. H.; visualization: E. D.; G. M.; writing – original draft: T. C., E. D.; writing - review & editing: J. C., C. H., G. M.Data availability
The data supporting this article have been included as part of the ESI.†Conflicts of interest
There are no conflicts of interest to declare.Acknowledgements
This work received financial support from the National Research Agency of France (ANR-21-CE19-0042). E. D. thanks Dr F. M. Fernandes (LCMCP) for his introduction and guidance in image analysis.References
- K. Liu, Y. Y. Chen, X. Q. Zha, Q. M. Li, L. H. Pan and J. P. Luo, Research progress on polysaccharide/protein hydrogels: Preparation method, functional property and application as delivery systems for bioactive ingredients, Food Res. Int., 2021, 147, 110542 CAS.
- X. T. Le, L. E. Rioux and S. L. Turgeon, Formation and functional properties of protein–polysaccharide electrostatic hydrogels in comparison to protein or polysaccharide hydrogels, Adv. Colloid Interface Sci., 2017, 239, 127–135 CrossRef CAS.
- E. J. Bealer, S. Onissema-Karimu, A. Rivera-Galletti, M. Francis, J. Wilkowski and D. Salas-de La Cruz, et al., Protein–Polysaccharide Composite Materials: Fabrication and Applications, Polymers, 2020, 12(2), 464 CrossRef CAS PubMed.
- M. Prasathkumar, C. Dhrisya, F. Lin and S. Sadhasivam, The Design and Developments of Protein-Polysaccharide Biomaterials for Corneal Tissue Engineering, Adv. Mater. Technol., 2023, 8(15), 2300171 CAS.
- M. Jin, J. Shi, W. Zhu, H. Yao and D. A. Wang, Polysaccharide-Based Biomaterials in Tissue Engineering: A Review, Tissue Eng., Part B, 2021, 27(6), 604–626 CAS.
- P. Matricardi, C. Di Meo, T. Coviello, W. E. Hennink and F. Alhaique, Interpenetrating Polymer Networks polysaccharide hydrogels for drug delivery and tissue engineering, Adv. Drug Delivery Rev., 2013, 65(9), 1172–1187 Search PubMed.
- M. S. Silverstein, Interpenetrating polymer networks: So happy together?, Polymer, 2020, 207, 122929 Search PubMed.
- X. Hou, L. Lin, K. Li, F. Jiang, D. Qiao and B. Zhang, et al., Towards superior biopolymer gels by enabling interpenetrating network structures: A review on types, applications, and gelation strategies, Adv. Colloid Interface Sci., 2024, 325, 103113 CAS.
- W. J. Frith, Mixed biopolymer aqueous solutions – phase behaviour and rheology, Adv. Colloid Interface Sci., 2010, 161(1–2), 48–60 CAS.
- Y. S. Lipatov and T. T. Alekseeva, Phase-Separated Interpenetrating Polymer Networks. In: Phase-Separated Interpenetrating Polymer Networks, Springer, Berlin, Heidelberg, 2007, pp. 1–227 [cited 2024 Sep 12]. Available from: DOI:10.1007/12_2007_116.
- K. E. Kadler, C. Baldock, J. Bella and R. P. Boot-Handford, Collagens at a glance, J. Cell Sci., 2007, 120(12), 1955–1958 Search PubMed.
- B. R. Williams, R. A. Gelman, D. C. Poppke and K. A. Piez, Collagen fibril formation. Optimal in vitro conditions and preliminary kinetic results, J. Biol. Chem., 1978, 253(18), 6578–6585 Search PubMed.
- Y. Li, A. Asadi, M. R. Monroe and E. P. Douglas, pH effects on collagen fibrillogenesis in vitro: Electrostatic interactions and phosphate binding, Mater. Sci. Eng., C, 2009, 29(5), 1643–1649 Search PubMed.
- G. Forgacs, S. A. Newman, B. Hinner, C. W. Maier and E. Sackmann, Assembly of Collagen Matrices as a Phase Transition Revealed by Structural and Rheologic Studies, Biophys. J., 2003, 84(2), 1272–1280 CAS.
- B. Andrew and D. Stefan, Modelling the charge across pH and isoelectricpoint of bovine collagen during leather manufacture. In 2019.
- S. Kou (Gabriel), L. Peters and M. Mucalo, Chitosan: A review of molecular structure, bioactivities and interactions with the human body and micro-organisms, Carbohydr. Polym., 2022, 282, 119132 Search PubMed.
- V. Zargar, M. Asghari and A. Dashti, A Review on Chitin and Chitosan Polymers: Structure, Chemistry, Solubility, Derivatives, and Applications, ChemBioEng Rev., 2015, 2(3), 204–226 Search PubMed.
- P. Sacco, F. Furlani, G. De Marzo, E. Marsich, S. Paoletti and I. Donati, Concepts for Developing Physical Gels of Chitosan and of Chitosan Derivatives, Gels, 2018, 4(3), 67 CAS.
- E. Devernois and T. Coradin, Synthesis, Characterization and Biological Properties of Type I Collagen–Chitosan Mixed Hydrogels: A Review, Gels, 2023, 9(7), 518 CAS.
- F. Chicatun, C. E. Pedraza, C. E. Ghezzi, B. Marelli, M. T. Kaartinen and M. D. McKee, et al., Osteoid-Mimicking Dense Collagen/Chitosan Hybrid Gels, Biomacromolecules, 2011, 12(8), 2946–2956 CAS.
- X. Li, X. Ma, D. Fan and C. Zhu, New suitable for tissue reconstruction injectable chitosan/collagen-based hydrogels, Soft Matter, 2012, 8(14), 3781 CAS.
- V. A. Reyna-Urrutia, V. Mata-Haro, J. V. Cauich-Rodriguez, W. A. Herrera-Kao and J. M. Cervantes-Uc, Effect of two crosslinking methods on the physicochemical and biological properties of the collagen-chitosan scaffolds, Eur. Polym. J., 2019, 117, 424–433 Search PubMed.
- J. Ohmes, L. M. Saure, F. Schütt, M. Trenkel, A. Seekamp and R. Scherließ, et al., Injectable Thermosensitive Chitosan-Collagen Hydrogel as A Delivery System for Marine Polysaccharide Fucoidan, Mar. Drugs, 2022, 20(6), 402 Search PubMed.
- B. Sun, W. Ma, F. Su, Y. Wang, J. Liu and D. Wang, et al., The osteogenic differentiation of dog bone marrow mesenchymal stem cells in a thermo-sensitive injectable chitosan/collagen/β-glycerophosphate hydrogel: in vitro and in vivo, J. Mater. Sci.: Mater. Med., 2011, 22(9), 2111–2118 CrossRef CAS.
- L. Wang and J. P. Stegemann, Thermogelling chitosan and collagen composite hydrogels initiated with β-glycerophosphate for bone tissue engineering, Biomaterials, 2010, 31(14), 3976–3985 CrossRef CAS.
- J. Shan, B. Tang, L. Liu, X. Sun, W. Shi and T. Yuan, et al., Development of chitosan/glycerophosphate/collagen thermo-sensitive hydrogel for endoscopic treatment of mucosectomy-induced ulcer, Mater. Sci. Eng., C, 2019, 103, 109870 CrossRef CAS.
- F. Gobeaux, G. Mosser, A. Anglo, P. Panine, P. Davidson and M. M. Giraud-Guille, et al., Fibrillogenesis in Dense Collagen Solutions: A Physicochemical Study, J. Mol. Biol., 2008, 376(5), 1509–1522 CrossRef CAS PubMed.
- Y. Von Boxberg, S. Soares, C. Giraudon, L. David, M. Viallon and A. Montembault, et al., Macrophage polarization in vitro and in vivo modified by contact with fragmented chitosan hydrogel, J. Biomed. Mater. Res., 2022, 110(4), 773–787 CrossRef CAS.
- C. Helary, A. Abed, G. Mosser, L. Louedec, D. Letourneur and T. Coradin, et al., Evaluation of dense collagen matrices as medicated wound dressing for the treatment of cutaneous chronic wounds, Biomater. Sci., 2015, 3(2), 373–382 RSC.
- A. Montembault, C. Viton and A. Domard, Rheometric Study of the Gelation of Chitosan in Aqueous Solution without Cross-Linking Agent, Biomacromolecules, 2005, 6(2), 653–662 CrossRef CAS PubMed.
- A. Venault, D. Bouyer, C. Pochat-Bohatier, L. Vachoud and C. Faur, Investigation of chitosan gelation mechanisms by a modeling approach coupled to local experimental measurement, AIChE J., 2012, 58(7), 2226–2240 CrossRef CAS.
- S. H. Moussa, A. A. Tayel and A. I. Al-Turki, Evaluation of fungal chitosan as a biocontrol and antibacterial agent using fluorescence-labeling, Int. J. Biol. Macromol., 2013, 54, 204–208 CrossRef CAS PubMed.
- J. Nie, W. Lu, J. Ma, L. Yang, Z. Wang and A. Qin, et al., Orientation in multi-layer chitosan hydrogel: morphology, mechanism and design principle, Sci. Rep., 2015, 5(1), 7635 CrossRef CAS PubMed.
- N. D. Machado, M. L. Goñi and N. A. Gañán, Effect of supercritical CO2 drying variables and gel composition on the textural properties of cellulose aerogels, J. Supercrit. Fluids, 2025, 215, 106414 Search PubMed.
- R. Huang, W. Li, X. Lv, Z. Lei, Y. Bian and H. Deng, et al., Biomimetic LBL structured nanofibrous matrices assembled by chitosan/collagen for promoting wound healing, Biomaterials, 2015, 53, 58–75 Search PubMed.
- A. Fiamingo, A. Montembault, S. E. Boitard, H. Naemetalla, O. Agbulut and T. Delair, et al., Chitosan Hydrogels for the Regeneration of Infarcted Myocardium: Preparation, Physicochemical Characterization, and Biological Evaluation, Biomacromolecules, 2016, 17(5), 1662–1672 CAS.
- F. Gobeaux, E. Belamie, G. Mosser, P. Davidson and S. Asnacios, Power law rheology and strain-induced yielding in acidic solutions of type I-collagen, Soft Matter, 2010, 6(16), 3769–3777 Search PubMed.
- N. Sereni, A. Enache, G. Sudre, A. Montembault, C. Rochas and P. Durand, et al., Dynamic Structuration of Physical Chitosan Hydrogels, Langmuir, 2017, 33(44), 12697–12707 CAS.
- L. Rami, S. Malaise, S. Delmond, J. Fricain, R. Siadous and S. Schlaubitz, et al., Physicochemical modulation of chitosan-based hydrogels induces different biological responses: Interest for tissue engineering, J. Biomed. Mater. Res., 2014, 102(10), 3666–3676 Search PubMed.
- M. N. Taravel and A. Domard, Relation between the physicochemical characteristics of collagen and its interactions with chitosan: I, Biomaterials, 1993, 14(12), 930–938 CAS.
- M. P. E. Wenger, L. Bozec, M. A. Horton and P. Mesquida, Mechanical Properties of Collagen Fibrils, Biophys. J., 2007, 93(4), 1255–1263 Search PubMed.
- M. S. Niepel, B. Fuhrmann, H. S. Leipner and T. Groth, Nanoscaled Surface Patterns Influence Adhesion and Growth of Human Dermal Fibroblasts, Langmuir, 2013, 29(43), 13278–13290 Search PubMed.
- M. H. Tong, N. Huang, A. H. W. Ngan, Y. Du and B. P. Chan, Preferential sensing and response to microenvironment stiffness of human dermal fibroblast cultured on protein micropatterns fabricated by 3D multiphoton biofabrication, Sci. Rep., 2017, 7(1), 12402 Search PubMed.
- Y. Hsu, C. Chen, J. Chiu, S. Chang and Y. Wang, The effects of fiber size on MG63 cells cultured with collagen based matrices, J. Biomed. Mater. Res., 2009, 91B(2), 737–745 CAS.
Footnote |
| † Electronic supplementary information (ESI) available. See DOI: https://doi.org/10.1039/d4sm01448k |
| This journal is © The Royal Society of Chemistry 2025 |


