DOI:
10.1039/D4SM01265H
(Paper)
Soft Matter, 2025,
21, 1686-1698
Temperature dependence of phase diagrams and dynamics in nanocrystal assembly by solvent evaporation†
Received
29th October 2024
, Accepted 23rd January 2025
First published on 24th January 2025
Abstract
We provide a systematic study of the phase diagram and dynamics for single component nanocrystals (NCs) by a combination of a self-consistent mean-field molecular theory (MOLT-CF) and molecular dynamics (MD) simulations. We first compute several thermodynamic functions (free energy, entropy, coefficient of thermal expansion and bulk modulus) as a function of temperature by both MOLT-CF and MD. While MOLT-CF correctly captures the trends with temperature, the predicted coefficients of thermal expansion and bulk moduli display quantitative deviations from MD and experiments, which we trace back to the mean-field treatment of attractions in MOLT-CF. We further characterize the phase diagram and calculate the dependence on temperature of the bcc to fcc transition. Our results reveal that differences in entropic and enthalpic contributions to the free energy oscillate as a function of NC separation and are correlated to a geometric quantity: the volume of overlap between the ligand layers in different particles. In this way, we generally show that bcc is favored by enthalpy, while fcc is by entropy, in agreement with previous experimental evidence of fcc stabilization with increasing temperature, but contrary to what is expected from simpler particle models, where bcc is always entropically favored. We also show that the lowest relaxation times drastically increase in the latest stages of solvent evaporation. Overall, our results demonstrate that MOLT-CF provides an adequate quantitative model describing all phenomenology in single component NCs.
1 Introduction
Assembly of nanocrystals (NCs) into ordered arrays provides a route to engineering materials with structures and properties that are inaccessible with more traditional building blocks such as atoms and molecules. In this context, assembly by solvent evaporation has become one of the most robust strategies for the engineering of nanostructures.1,2 The goal of this paper is to provide a detailed characterization of the thermodynamic properties of single-component superlattices (SLs) at different stages of the solvent evaporation process, with a particular emphasis on the role of temperature, as well as a general description of the dynamics. For this purpose, we use MOLT-CF (molecular theory for compressible fluids) and molecular dynamics (MD) simulations. Recent experimental advances3 provide the ability to halt the evaporation process at any intermediate state and, in this way, characterize the structure of any possible activation or metastable state, thus making it possible to rigorously verify the predictions presented in this paper.
In a previous paper4 we introduced MOLT-CF by extending previous models5,6 as a general predictive tool for both structure and dynamics. We verified MOLT-CF with MD simulations and demonstrated that it successfully predicts the available experimental phenomenology in single-component superlattices (SLs), including the fcc-to-bcc transition as a function of the length of the hydrocarbon ligands for dry systems7,8 and the fcc-to-bcc Bain transition as a function of decreasing solvent content.9–11 We also showed that MOLT-CF satisfies an incompressibility condition (IC), which implies that the ligands and solvent fill out 3D space with constant density. In fact, the IC alone can be used to predict many aspects of the structure, such as lattice constants.12
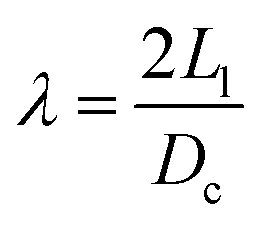
In our first study4 only a single temperature was investigated. Yet, there are many important effects related to temperature. In ref. 13, it was shown that an interplay between the solvent and the ligand leads to a complex non-linear agglomeration as a function of temperature. Temperature plays an important role in determining the phase diagram of SLs. For example, in binary systems14 many different SL phases are observed in the temperature range between 253 K and 358 K. Furthermore, temperature provides a powerful knob to develop reconfigurable materials as demonstrated by the recently developed thermally triggerable ligands.15 Oleate capped NCs show that increasing temperature leads to a reversible bcc → bct → fcc transition,16,17 which strongly suggests that the entropy of fcc is larger than that of bcc, Sfcc > Sbcc. This conclusion is supported by isothermal microcalorimetry measurements (with PbSe cores), which have shown that bcc has a lower enthalpy than fcc (i.e., bcc is favoured by energy).18 Goodfellow et al.19 used Gaussian-chain statistics to determine ligand entropy, which predicts Sfcc < Sbcc, in disagreement with the considerations above. On the other hand, MD simulations by Fan and Grünwald20 have shown that the bcc–fcc entropy difference oscillates with the softness parameter λ (λ = 2L/Dc, where Dc is the core diameter and L is the ligand length): entropy favours fcc for 0.56 < λ < 0.98, but it disfavours this phase for λ < 0.56 or λ > 0.98. As a comparison, the experiments referred above16–18 correspond to λ ∼ 0.57–0.89. These results paint a rather nuanced picture of the thermodynamics of the bcc–fcc phase transition in SLs.
A critical aspect for high-quality assembly of materials is the characterization of the longest relaxation time τR. If the experimental (or simulation) time t is shorter than τR, different modes within the system remain out of equilibrium, and the quality of assembly decreases. Simulations reported in ref. 21 and 22 provided evidence that in the latest stages of evaporation, τR is inversely proportional to the solvent diffusion coefficient, which in turn becomes vanishingly small as the solvent diffuses by a mechanism of hopping from one ligand to the next. Yet, these conclusions were obtained from simulations that only considered clusters with a small number of NCs. In this paper, we extend these results by describing how solvent diffusion takes place in SLs and analyze its temperature dependence.
The paper is organized as follows: we first describe general aspects of MOLT-CF and simulations, and then present the results: first fundamental thermodynamic quantities and then the phase diagram, with particular emphasis on the bcc–fcc critical region. We also analyze the dependence on the enthalpic and entropic components of the free energy and finalize with the determination of relaxation times. We complete the paper with a summary and general conclusions. We also discuss the applicability of MOLT-CF to broader systems.
2 General aspects of theory and simulation
2.1 Definition of the system
We consider nc quasi-spherical NPs, i.e. truncated octahedra for simulations and some MOLT-CF calculations, and spherical in other MOLT-CF calculations. We therefore characterize the NC core by its diameter Dc, grafted with nl ligands containing nh,l monomers each. There are also ns solvent molecules, each consisting of nh,s monomers.
The nc NCs are positioned in the corresponding SL sites, either holding them with springs in the simulation or simply fixing the positions within MOLT-CF. Then, thermodynamic functions such as the Helmholtz free energy F(T,V,nc,ns) are obtained as a function of lattice constant (or volume).
The NCs are surrounded by the solvent, and if the lattice constant is sufficiently large, there is additional free space separating the NCs in different lattice sites. As the lattice parameter is reduced, the solvent eventually condenses and fills the entire space not occupied by the NCs, as discussed in our previous paper.4
2.2 The incompressibility condition
The IC is the statement that solvent and NC fill the entire space, and it is precisely formulated as| | 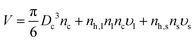 | (1) |
where υl/s are the molecular volumes for ligand and solvent monomers respectively. Even if both ligands and solvent consist of the same type of monomer, alkane chains for example, as it is considered in this paper, it must be assumed that υl ≠ υs. This is because at high grafting densities the ligand monomers, specially close to the core, are subject to large forces, resulting in a much reduced molecular volume. Therefore, we expect that υl < υs. The IC in a SL is stated as| |  | (2) |
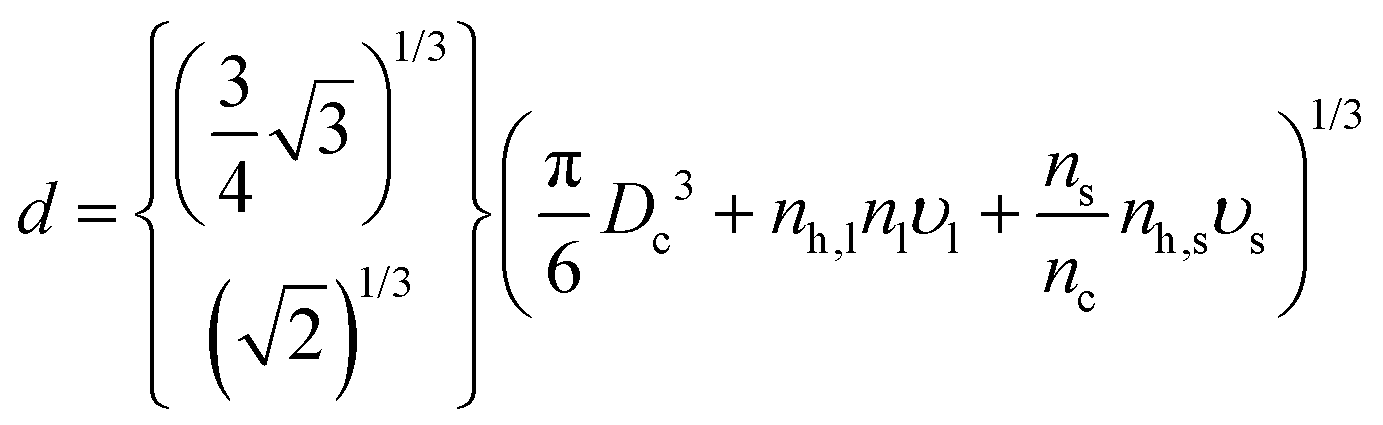
where VUC is the volume and nSLUC the number of NCs within a unit cell. Using the cubic bcc/fcc unit cells, then VUC = aL3 and nSLUC = 2/4, respectively. The formula for the nearest-neighbor d follows as| |  | (3) |
where the top result corresponds to bcc and the bottom to fcc. Of course, for this formula to have real predictive value, both υl and υs need to be obtained from independent calculations not involving an SL.
Following previous work we define the solvent fraction as
| |  | (4) |
and it is convenient to introduce the ligand
Φl and core
Φc volume fractions as
| |  | (5) |
where the last equality requires that there are no voids,
i.e. the entire volume is occupied by NCs and solvent in the liquid state. The actual volume occupied by matter can be approximated as
12| |  | (6) |
where
Ll/s is the maximum extent of the ligand/solvent and
A0,l/s is its footprint (or molecular area). Basically, these formulas assume that ligand/solvent molecules have an intrinsic volume =
A0,l/sLl/s. This volume is different to (and smaller than)
nh,l/sυl/s, as the latter is a measure of the free volume and includes the available space where the molecules vibrate, while the former defines the actual volume occupied by matter. In other words,
A0,l/sLl/s has a meaning similar to a van der Waals molecular volume, while
nh,l/sυl/s is analogous to a partial molecular volume. Therefore the packing fraction is given as
| |  | (7) |
For a dry system without voids, ns = 0 and the above formula, combined with eqn (1) gives an explicit expression for υl
| |  | (8) |
With the currently accepted values for
A0,
L and with

, as extensively discussed in ref.
12υl is unambigously determined. An independent simulation of the pure solvent determines
υs| |  | (9) |
As expected,
υl <
υs. The simulation and experimental results at
T = 298.15 K reported in ref.
23 are respectively
υs = 35.3 Å
3 and
υs = 36.3 Å
3. There is a clear temperature dependence for
υs, but
υl is less sensitive to the temperature because the monomers are subjected to large forces and are therefore much less sensitive to
kBT variations.
Because the molecular volume depends on temperature, the values of Φs in eqn (4) for a fixed number of solvent molecules change slightly as a function of temperature. We will label the system by the value at Φs at T = 387 K and quote their values at other temperatures.
2.3 Dynamical scales in solvent evaporation
Ref. 21 and 22 show that the slowest relaxation time τR in a solvent evaporation process is given as| |  | (10) |
When the solvent is the majority component, V is the volume of the entire system, basically the volume of the vapor phase, and D is the diffusion constant of the vapor. This model amounts to the well known Maxwell model for evaporation.24 In the latest stages of the evaporation process, defined by the NC occupying about 50% of the available volume, with the other 50% occupied by the solvent in the liquid phase, Dl is the solvent diffusion coefficient and V the volume of the NC–solvent mixture, so eqn (10) becomes| |  | (11) |
which shows that the relaxation times are inversely proportional to the diffusion constant. Here Dl is much smaller than the Stokes–Einstein value  (R, η solvent radius and viscosity) characterizing the pure solvent, as the solvent residing mainly in the interstitial lattice needs to diffuse through the ligands by hopping from one NC to the next, until it eventually reaches the boundary of the system and escapes into the vapor phase.
2.4 Some technical aspects regarding simulations
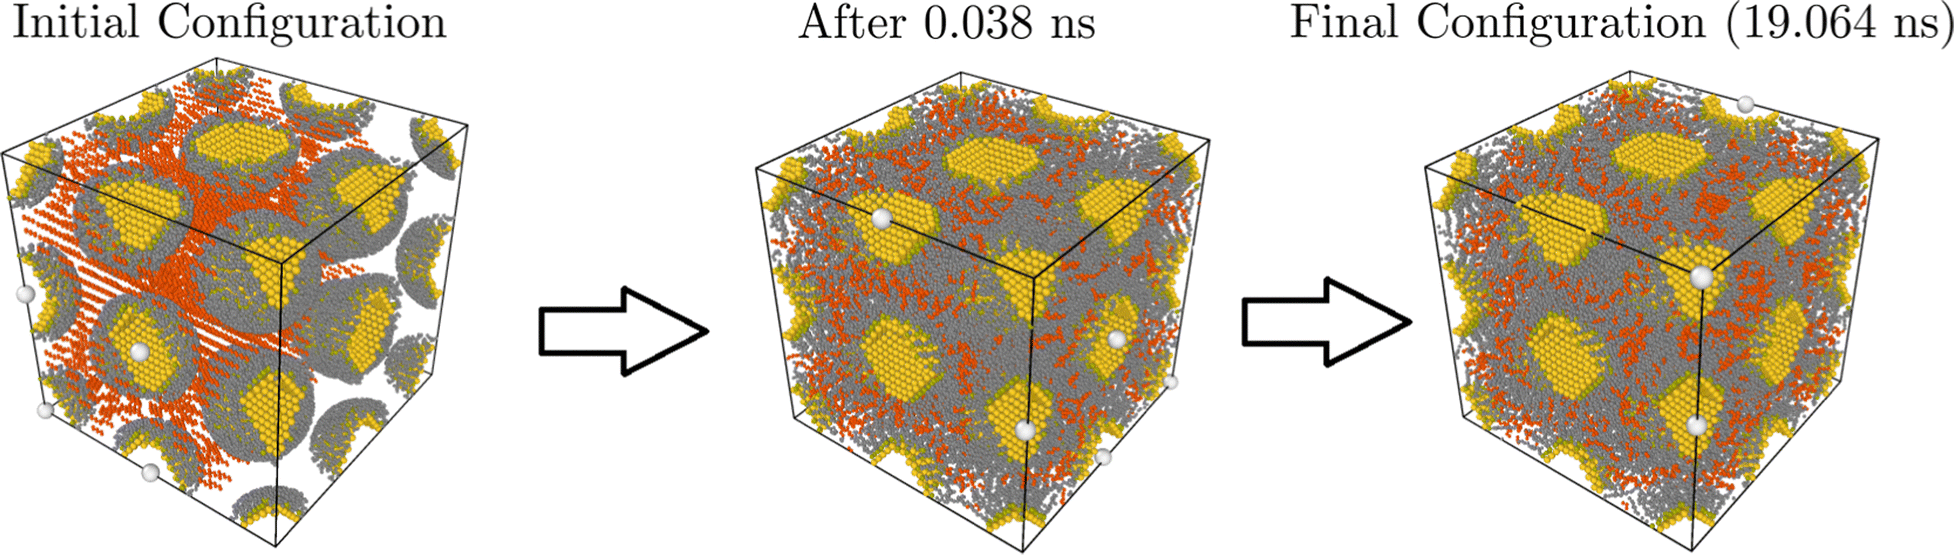
We performed molecular dynamics (MD) simulations using HOODLT,25 which runs HOOMD-Blue26 with rigid body dynamics27 with the opls force field.23 We simulate temperatures in the range 305–387 K. Fig. 1 illustrates how a typical simulation proceeds.
 |
| | Fig. 1 Summary of a typical simulation: a bcc configuration with aL = 63 Å and Φv = 0.18. The solvent (hexane) is marked in red. In the left there is the initial configuration, which after only 0.381 ns is roughly thermalized. The configuration at the end of the simulation (19.064 ns) is shown. | |
The simulations were all done with Au1072(SC12)229, which is a gold core grafted with nl = 229 dodecanethiol ligands (nh,l = 12). The diameter of the core is D = 3.53 nm, resulting in a grafting density σ = 5.85 chains per nm2, the same reported in our previous papers.4,28 The results in this paper make a clear case that free energies and any other thermodynamical quantities calculated from MOLT-CF are transferable to any other NC.
The free energy is calculated by computing the reversible work as outlined in our previous papers.4,28,29 The diffusion constants are obtained by a fit to the relation
| | 〈((![[r with combining right harpoon above (vector)]](https://www.rsc.org/images/entities/i_char_0072_20d1.gif) (t) − (t = 0))2〉 = 6Dt for large t (t) − (t = 0))2〉 = 6Dt for large t | (12) |
after removing periodic boundary conditions by particle images.
2.5 Some technical aspects regarding MOLT-CF calculations
The model used is the same described in ref. 4. Briefly, MOLT-CF is based on writing down and minimizing the free-energy functional of the system, Ω, which is canonical for the particle cores and ligands and grand-canonical for the solvent molecules. Ω contains the following contributions:| | | βΩ[T,V,nSLUC,μs] = βFTr,s + βFConf + βFvdW + βFHS − βμsns | (13) |
βFTr,s and βFConf are the free energies due to the entropies of solvent translation and solvent and ligand conformational freedom. βFvdW models the vdW attractions (∼r−6) between the CH2/CH3 beads in the ligands and solvent. βFHS is a position-dependent hard-sphere functional that accounts for bead–bead repulsions. Finally, −βμsns is included because Ω is a grand canonical potential for the solvent (ns and μs are the number and chemical potential of solvent molecules, respectively). In the dry limit, this term is absent and Ω is equal to the total Helmholtz free energy, F. As explained in the ESI† and ref. 4, Ω depends on functions that describe the structure of the system in three-dimensions and are a priori unknown. The functional minimization of Ω with respect to those functions results in a set of self-consistent equations that are discretized and solved using numerical methods. As an output, we obtain structural and thermodynamical information of the system.
Ω takes as an input a set of conformations of the ligands and solvent molecules and, therefore, the theory explicitly takes into account the molecular details of those molecules. While previous formulations of the molecular theory (MOLT) employed a packing constraint and a good-solvent approximation to model hard-core repulsions and attractive forces,5,6,30 MOLT-CF explicitly models these contributions with a hard-sphere (HS) functional (βFHS) and a mean-field van der Waals attraction (βFvdW), respectively. This modification enables modelling of both dry and solvent-containing SLs5 and allows deviations from IC. A succinct description is provided in ESI† for completeness.
3 Results
3.1 Thermodynamic functions
Fig. 2a shows the free energy predicted by MD at T = 387 K (similar plots for other temperatures are provided in ESI†) for different amounts of solvent.
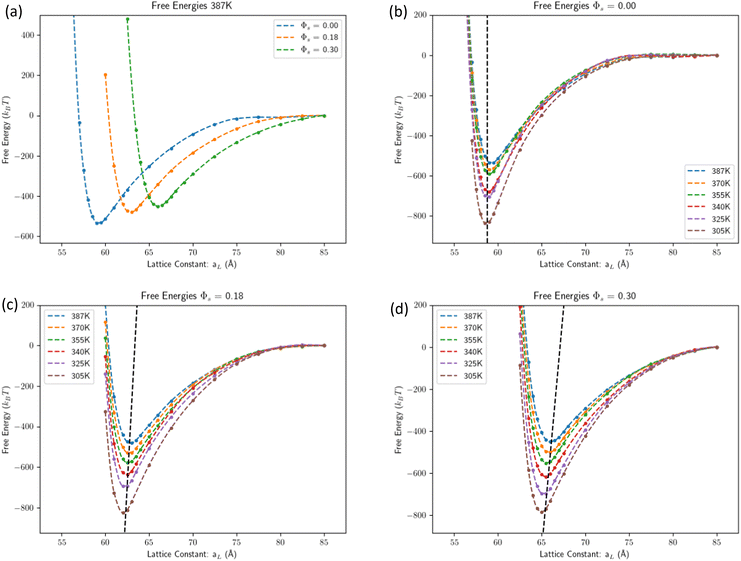 |
| | Fig. 2 Free energies computed by MD. (a) Free energy at T = 387 K predicted by MD for the three solvent contents considered. (b) Free energy predicted by MD for Φv = 0 (dry case) at all simulated temperatures. The dashed lines are the predictions from eqn (9) with the molecular volumes from eqn (9). (c) Free energy predicted by MD for Φs = 0.18 at all simulated temperatures. (Because of the temperature dependence of the molecular volume eqn (9) it is Φs(T = 387) = 0.180 Φs(T = 305) = 0.162 approximated as Φs = 0.18.) (d) Free energy predicted by MD for Φs = 0.298 at all temperatures simulated. (Because of the temperature dependence of the molecular volume eqn (9) it is Φs(T = 387) = 0.298 Φs(T = 305) = 0.274 approximated as Φs = 0.30.) | |
The dry case free energy is shown in Fig. 2b. The depth of the potential becomes larger with decreasing temperature, as the absolute value of the cohesive energy increases relative to kBT. Swollen systems, see Fig. 2c and d, follow similar trends to the dry case but display a stronger temperature dependence of the lattice constant. The agreement with the IC eqn (3), using the molecular volumes in eqn (9), is excellent.
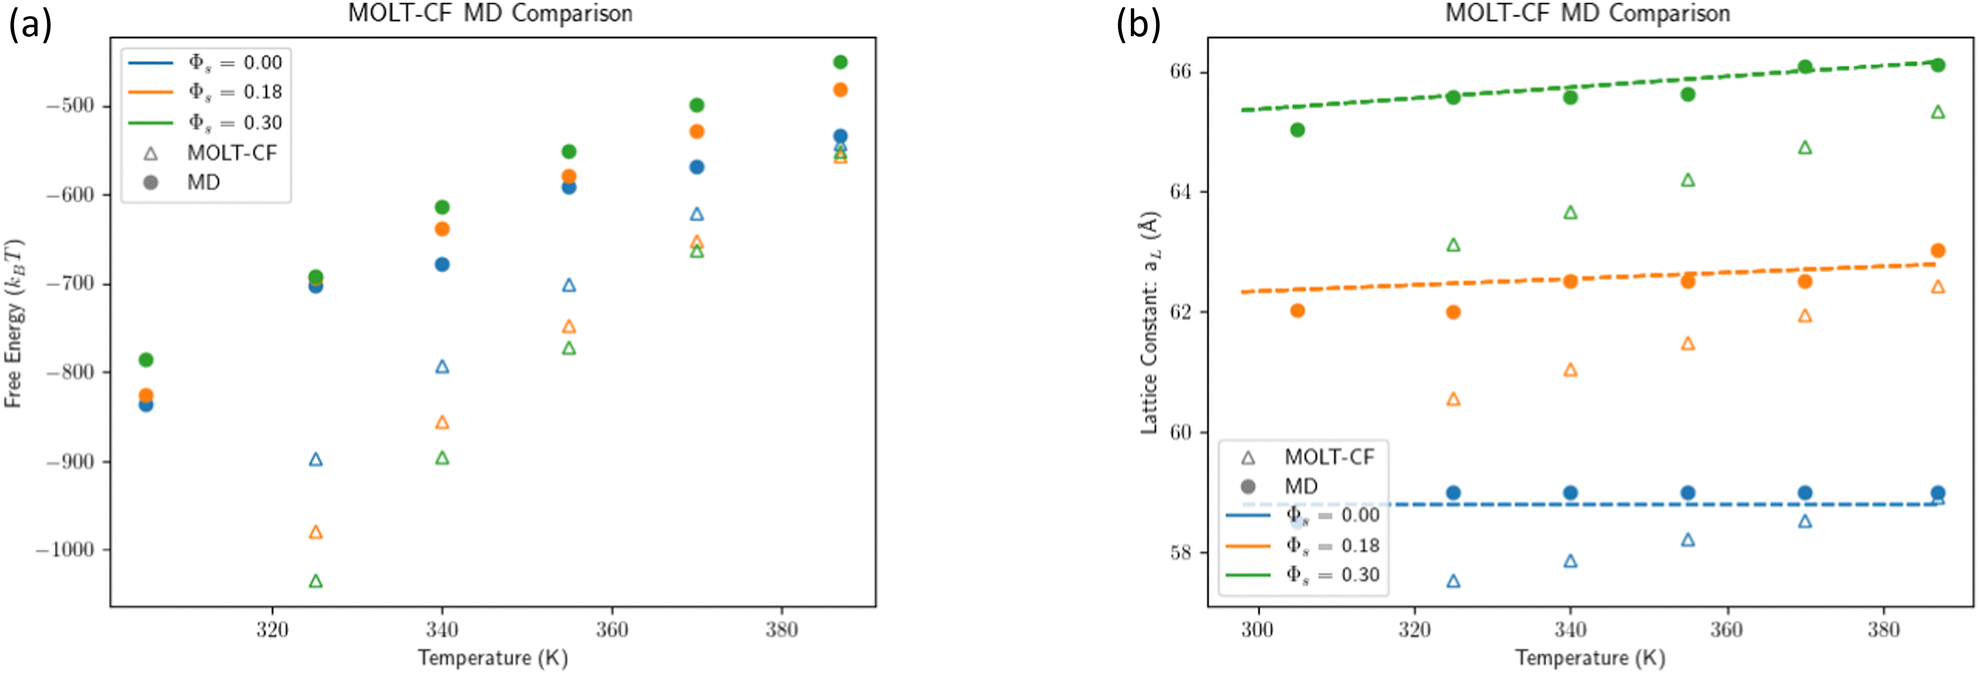
Simulations are compared against MOLT-CF predictions in Fig. 3a for the equilibrium (minimum) free energy and in Fig. 3b for the lattice constant. Qualitatively, both results follow the same trends, with lattice constants and free energies decreasing with temperature. There is a small but significant deviation between MOLT-CF and MD, parameterized by the coefficient of thermal expansion
| |  | (14) |
 |
| | Fig. 3 Comparison of MOLT-CF vs. simulation. (a) Comparison of the free energy minimum computed with MOLT-CF and MD simulations. (b) Comparison of lattice constant MOLT-CF and MD simulations. The dashed lines illustrate the prediction eqn (3) with the molecular volume eqn (9). | |
Within MD, the thermal expansion coefficient for the inorganic core is zero as the core is modeled as a rigid body. Experimentally, it is found that the thermal expansion coefficient of the core αPbS(300 K) = 2 × 10⁻⁵ K−1 (ref. 31) is two orders of magnitude smaller than that of the organic component αn-hexane(300 K) = 1.5 × 10⁻³ K−1,32 so assuming α ≈ 0 for the NC core is a well-justified approximation. MD provides α values in good agreement with the experiment, see Table 1 and a more detailed comparison in ESI.†
Table 1 Thermal coefficient expansion, α/K−1. * means estimated using eqn (15) as a function of the number of solvent molecules per unit cell, where in parenthesis we quote the value of Φs at T = 387 K. More detailed results for pure hexane are provided in ESI. Experimental results are for hexane are from ref. 32 and 33
| Method |
Dry(0) |
1496(0.18) |
2912(0.3) |
Liq. hexane (300 K) |
| MOLT-CF |
0.0011 |
0.0015 |
0.0017 |
0.0037 |
| MD |
0.0004 |
0.0005 |
0.0005 |
0.0013(1) |
| Exp. |
∼0.0001 |
|
|
0.0014 |
Table 1 summarizes the coefficient of thermal expansion predicted by MOLT-CF and MD and measured experimentally. MOLT-CF overestimates α compared with MD and experiments (for liquid n-hexane), which in turn, explains the small discrepancy between lattice constants and equilibrium free energies in Fig. 3a and b.
The experimental thermal expansion coefficient was estimated from Fig. 1 in ref. 34 by using the formula
| | 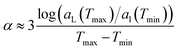 | (15) |
and corresponds to NPs with
Dc = 3.6 nm and dodecanethiol ligands, very close to the system studied here. It is obtained from the peaks of the structure factor using the formula

. If the interval between
T/K = [313.15,363.15] is used, then
α < 0.0005 K
−1, but
α ≈ 0.0005 K
−1 between
T/K = [363.15,413.15]. Ref.
16 measured
α = 1.2 × 10
−4 K
−1 at
T = 300 K, consistent with these estimates.
It is also of interest to examine the bulk modulus B and the isothermal compressibility κ
| |  | (16) |
Within MD, we compute the bulk modulus at the minimum of the free energy from the equation
| |  | (17) |
where
Vmin is the volume at the free energy minimum. The intercept provides the bulk modulus
B, and the slope of the fit an accurate estimate for the lattice constant at the minimum. We parameterize the results according to
| | | B(T) = B(T = 305) − (T− 305)cB | (18) |
| | | aL(T) = aL(T = 305) + (T − 305)ca, | (19) |
with actual coefficients given in
Table 2. Note that this value for the lattice constant provides a self-consistent accurate determination of the coefficient of linear expansion, and for this reason, is the value quoted in
Table 1. We should mention, however, that fitting to
eqn (17) is susceptible to large errors and consequently, relatively low precision estimates. In ESI
† information we discuss how the results are actually obtained from the simulation and show some examples for the fits. Higher precision determinations for
B would require calculations that are beyond the goals of this paper.
Table 2 Temperature dependence of bulk modulus B (GPa) and lattice constant aL (nm) as a function of the number of solvent molecules per unit cell, where in parenthesis we quote the value of Φs at T = 387 K, as parameterized by eqn (18)
| Quantity |
Dry(0.0) |
1496(0.18) |
2912(0.3) |
|
B
L(305 K) |
6.0 |
5.4 |
3.5 |
|
c
B
|
0.027 |
0.025 |
0.015 |
|
a
L(305 K) |
58.5 |
61.8 |
64.8 |
|
c
L
|
0.008 |
0.01 |
0.01 |
As shown in Fig. 4, B decreases with T for both MOLT-CF and MD, but MOLT-CF underestimates the bulk modulus when compared against MD. Experimental results give a value of the order B ≈ 5 GPa35 entirely consistent with MD. Overall, there is a small but significant temperature dependence on B, getting smaller with increasing temperature, reflected by the negative sign of the slope in eqn (18). We mention the MOLT-CF prediction of B for liquid hexane (BMOLT-CF = 203 MPa at P = 1 MPa and T = 387 K), which is also smaller than the experimental value in the same conditions (BExperiment = 352 MPa36).
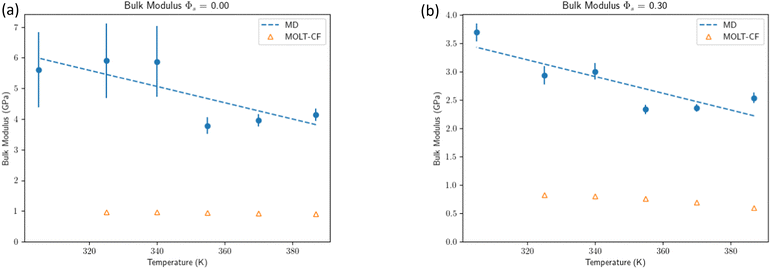 |
| | Fig. 4 Comparison of bulk modulus eqn (16) MOLT-CF vs. MD simulations. See the ESI† for additional plots and a more elaborated discussion. (a) Bulk modulus for the dry system. (b) Bulk modulus for the swollen system. | |
3.2 Phase boundaries
Fig. 5a summarizes MOLT-CF predictions in the dry limit (for a core diameter Dc = 3.53 nm) as a function of ligand length nh,l and temperature. This transition is expected to take place at8| |  | (20) |
where the critical softness is λc = 0.7 and the maximum ligand length is given by the formula L/nm = 0.128nh,l + 0.2.12Fig. 5a predicts that ncrith,l is temperature dependent. The breakdown of the different contributions to the bcc–fcc free energy difference is given in Fig. 5b. The free energy due to the ligands entropy (βFconf = −Sconf/kB) favors fcc (Fconf(bcc) > Fconf(fcc)). On the other hand, the energy of ligand–ligand interactions (vdW attractions + HS repulsions) favors bcc. Finally, the energy of the gauche/trans dihedral angles favors bcc, but its contribution is rather small.
 |
| | Fig. 5 Bcc vs. fcc stability in the dry case. (a) Free energy difference between bcc and fcc for the dry system predicted by MOLT-CF. (b) Contributions to the free energy difference between bcc and fcc for the dry system and nh,l = 7 predicted by MOLT-CF. | |
The fact that fcc is favored by entropy (Sconf(fcc) > Sconf(bcc)) and bcc by energy results in the prediction of a bcc → fcc transition for increasing T (Fig. 6), in agreement with experimental observations for oleate capped PbS NPs.16,17
 |
| | Fig. 6 Free energy difference between bcc and fcc for the nh,l = 12 and different solvent contents predicted by MOLT-CF. | |
3.3 Origin of the bcc–fcc transition
Fig. 7 shows the entropic (ligand conformations, solid red lines) and energetic (vdW + HS + gauche, dashed red lines) contributions to the bcc–fcc Helmholtz free-energy difference in the dry limit (with spherical cores) as a function of the average NC particle distance| | ![[d with combining macron]](https://www.rsc.org/images/entities/i_char_0064_0304.gif) = (VUC/nSLUC)1/3. = (VUC/nSLUC)1/3. | (21) |
Note that 3 is the volume per NP,  , and therefore, the value of is different for each lattice.
 |
| | Fig. 7 (a)–(c) Difference between the ligad–shell overlap volume in bcc and fcc lattices (blue line, see inset in panel (a)) and free-energy contributions due to ligand entropy (red solid lines and filled symbols) and energy (red dotted lines and empty symbols) vs. average distance per particle, (VUC/nSLUC)1/3, for a dry SL of 1.5-nm radii spherical NPs coated by ligands of 4 (a), 8 (b) and 12 (c) C per chain at T = 387 K. The equilibrium volumes per NP (corresponding to the minima of the free energy) are indicated with black dotted vertical lines. The free energy is calculated by MOLT-CF. | |
The equilibrium eq (minimum of F) is approximately given by the IC condition (see above), and it is indicated with vertical dashed lines in Fig. 7. The different contributions to the bcc–fcc free-energy difference, Δbcc–fccFj, oscillate as a function of . Interestingly, similar oscillations were observed by Fan et al.20 for Δbcc–fccS and Δbcc–fccU (obtained by MD simulations) vs. the softness parameter λ, as well as in the different contributions of the free energy vs. solvent content in our previous model for SLs using a packing constraint.5
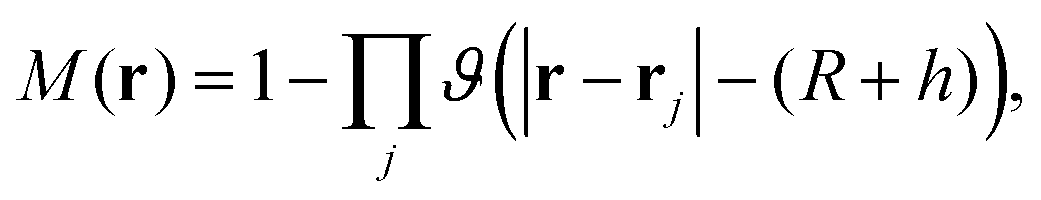
We now define the overlap volume Voverlap (see the inset in Fig. 7) of two NCs of radius  and ligand shell h. More precisely, taking a test NC at the origin, then
| |  | (22) |
where the function
M(
r,
θ,
ϕ) is 1 if at the point
r = (
r,
θ,
ϕ) there is an overlapping ligand shell or core of a particle (different than the test particle) or 0 otherwise.
| |  | (23) |
where
ϑ is the Heaviside step function and the product runs over all particles in the SL different from the test particle, which are located at positions
rj. As expected,
Voverlap monotonically decreases with increasing
, reaching zero for large
and becoming equal to the volume of the ligand shell at very small
(not shown).
The difference Δbcc–fccVoverlap (blue line in Fig. 7) oscillates as a function of . For → ∞, both overlap volumes are zero, so Δbcc–fccVoverlap = 0. As the NCs approach, Δbcc–fccVoverlap first becomes positive because the nearest neighbors in bcc are closer than in fcc (Table 3). As continues to decrease, the sign of Δbcc–fccVoverlap reverses because fcc has more nearest neighbors than bcc. Δbcc–fccVoverlap displays additional oscillations due to the differences in the distance and numbers of nearest and next to nearest neighbors in both phases, until it becomes zero again in the limit of small , where the overlap volumes of both phases become equal to the volume of the ligand shell.
Table 3 Number and distance of nearest neighbors (NN) and next-nearest neighbors (NNN) in bcc and fcc lattices
| Cell |
Type |
Distance/ |
Number |
| bcc |
NN |
2−2/3 × 31/2 = 1.09 |
8 |
| fcc |
NN |
21/6 = 1.12 |
12 |
| bcc |
NNN |
21/3 = 1.26 |
6 |
| fcc |
NNN |
22/3 = 1.59 |
6 |
If Δbcc–fccVoverlap > 0, then there is more ligand overlap in bcc than fcc, and intuitively, both the internal energy and entropy should be expected to be lower for bcc than fcc. Fig. 7 shows that this is exactly what is found, with Δbcc–fccF(conformational) ≈ −TΔS(entropy) anti-correlated to Δbcc–fccF(vdW + HS + g/t) ≈ Δbcc–fccU(enthalpy).
The key parameter in the definition of Voverlap is the ligand shell h. A first estimate would consider h as the maximum extended size of the ligand, which is proportional to the softness λ
| |  | (24) |
see
eqn (20) and (21). A slightly more precise definition considers instead the size of the NC in vacuum using
The constant a = 0.088 nm results from fitting MOLT-CF calculations for an isolated NC, and b = 0.525 nm represents the range of the vdW attractions. The difference between eqn (24) and (25) is numerically small.
The largest = max where the overlap difference is different from zero is
| |  | (26) |
where

is obtained from the value for fcc in
eqn (3). Therefore, the new dimensionless variable
| |  | (27) |
is such that the maximum value where volume overlap is different from zero is
umax ≈ 1.8 independent of ligand length and NC core diameter.
Fig. 8a–c shows the free energies and overlap differences as a function of u. From previous considerations, the equilibrium value, i.e. the one determined by the incompressibility condition is approximately given by
| |  | (28) |
where we used
eqn (2) and

is the softness and
ξ =
σA0 the dimensionless grafting density, see
eqn (6) for the definition of the other parameters. For large values of
nh,l (
λ ≫ 1),
eqn (28) implies that
ueq shifts to the left for increasing softness as
ueq ∝
λ−2/3.
 |
| | Fig. 8 Top panel: (a)–(c) Same as Fig. 7 but rescaling the average particle distance by the total particle size, R + h. (d)–(f) Bottom panel: Same as (a)–(c) but with the total bcc–fcc free energy difference. The free energy is calculated by MOLT-CF. | |
Fig. 8d–f shows the total free-energy differences as a function of u. As expected from the discussion in the previous paragraph, umax ≈ 1.8. Eqn (28) predicts that ueq (position of the vertical dashed line in Fig. 8) shifts to the left as the ligand becomes longer (λ becomes larger): ueq = 1.55, 1.45, and 1.35 for n = 4, 8, and 12. Fig. 8d–f shows that increasing the ligand length (increasing λ) decreases ueq, which for the approximately universal Δbcc–fccF vs. u curve shown in magenta lines, increases the stability of the bcc phase, in good agreement with previous theoretical and experimental works.4,5,20,29,37,38
3.4 Dynamics
The data obtained from MD simulations will now be used to characterize the dynamics of the system. Because diffusion coefficients are dynamical quantities, they cannot be compared with MOLT-CF. Yet, they are still important for an appropriate characterization of the system. The slowest relaxation time of a SL as the solvent evaporates, see eqn (10), is directly related to the solvent diffusion coefficient, Dl, and its dependence on solvent volume fraction Φs, see also eqn (11). Therefore, we consider first the diffusion coefficient for pure solvent, i.e. hexane, and then present a detailed analysis of its dependence within an SL.
The diffusion coefficients reported in ref. 39 for pure n-hexane are compared against our MD predictions, Table 4.
Table 4 Experimental vs. predicted diffusion coefficients of n-hexane, Dl (m2 s−1)
|
T/K |
Experiment |
MD simulation |
| 387 |
|
10.4 × 10⁻⁹ |
| 333 |
6.0 × 10⁻⁹ |
6.7 × 10⁻⁹ |
| 305 |
4.2 × 10⁻⁹ |
4.8 × 10⁻⁹ |
We then performed two types of simulations. In the first case, see Fig. 11, we consider a bcc SL with a fixed number of hexane molecules per cubic unit cell nsUC, with the two cases nsUC = 187 and 364 explicitly simulated. If the lattice constant aL is large, there are voids in the system, as apparent in the largest constant in Fig. 11, and some of the solvent molecules are in the gas phase. In Fig. 9a we show the diffusion coefficient, computed according to eqn (12), as a function of the lattice constant at T = 387 K. At large lattice constants there are significant voids and diffusion is fast Dl/Dl(hexane) ≫ 1. As the lattice constant reaches its equilibrium value, the diffusion constant is significantly below the magnitude of Dl(hexane). Fig. 9b and c show the dependence of the diffusion coefficient on temperature and aL. As expected, Dl increases with temperature and with the number of solvent molecules.
 |
| | Fig. 9 Values of diffusion coefficients from MD simulations. (a) Diffusion constants at T = 387 K as a function of lattice constant. The vertical lines are the lattice constants at the two solvent concentrations. (b) Diffusion coefficient for different temperatures for Φv ≈ 0.18. (c) Diffusion coefficient for different temperatures for Φv ≈ 0.3. | |
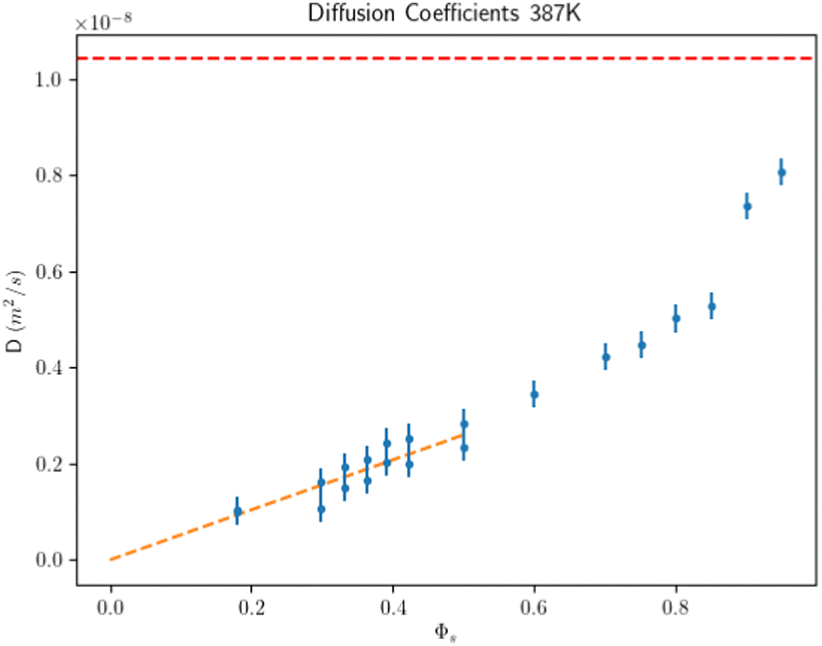
The second type of simulation consists of NC separated by a lattice constant aL, where the remaining box is completely filled with the solvent. These simulations enable the determination of Dl(Φs) for any Φs, including the limit Φs → 1, where the diffusion coefficient should reach the pure solvent Dl(hexane) value. Results are shown in Fig. 10. At large solvent fractions, D approaches Dl(hexane) but as the solvent is further evaporated D/Dl(hexane) ≪ 1 because the solvent resides primarily in interstitial lattice sites4 and the ligands act as “obstacles” which drastically reduce the diffusion coefficient. A fit for small solvent volume fractions shows that Dl extrapolates to zero at Φs → 0, see Fig. 10. In the ESI† we provide similar plots for other temperatures, which exhibit the same trends.
 |
| | Fig. 10 Hexane diffusion coefficient from MD simulations as a function of Φv at the minimum of the free energy for T = 387. The dashed red line is the diffusion coefficient for hexane. The dashed orange fit shows that the limit of the diffusion at a low volume fraction is consistent with zero. | |
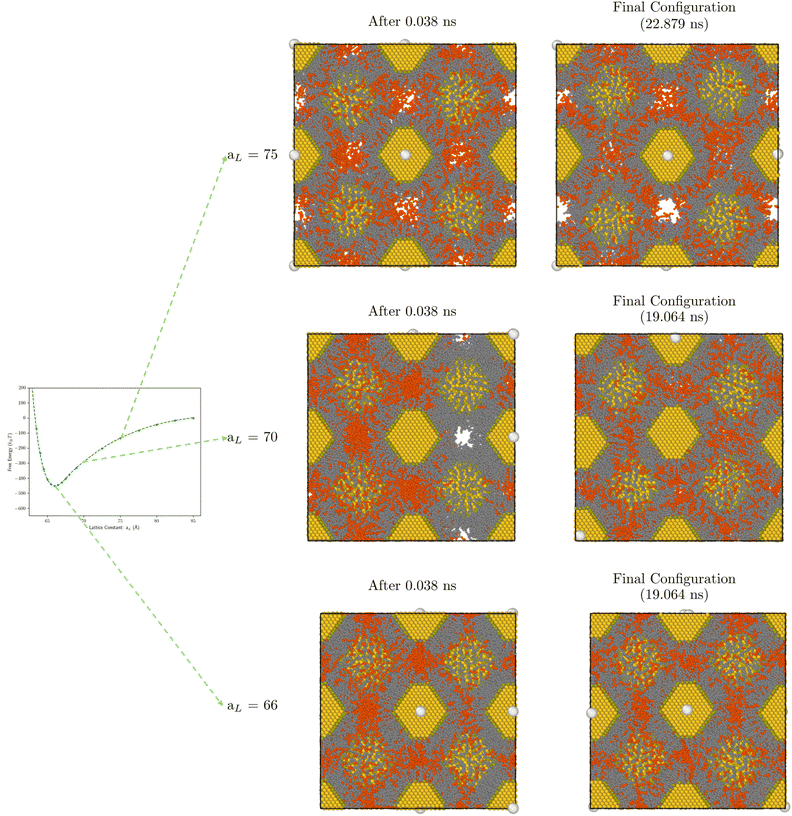 |
| | Fig. 11 Visualization of bcc configurations with Φv = 0.30 at increasing aL at 0.038 ns and 19.064 ns in MD simulation. | |
4 Conclusions
We have provided a detailed account of the thermodynamics and dynamics of assembly by solvent evaporation as a function of temperature. Our results show that MOLT-CF4 generally agrees well with simulations albeit with small but significant quantitative discrepancies (except, perhaps, for the elastic constants). The simulations presented, in turn, are in agreement with the experimental results.
The quantitative discrepancies between MOLT-CF and the simulations are traced back to the fact that MOLT-CF overestimates the coefficient of thermal expansion α and underestimates the bulk modulus B. We recall that MOLT-CF models interbead interactions as a combination of a hard-sphere potential and an algebraic attraction of the form r−6. The former is modeled using a position-dependent Carnahan–Starling functional and the latter is taken into account at the mean-field level. For homogeneous fluids, this combination is known as the augmented van der Waals theory,40 which has the advantages of being simple and physically intuitive and of requiring only two fitting parameters, but certainly ignores relevant correlations.41 It should be possible to include more complex functionals that improve the accuracy of the thermal expansion coefficient and the bulk modulus. However, our results show that MOLT-CF describes the equilibrium lattice constant and free-energy minimum at 387 K in very good agreement with MD simulations. This excellent level of agreement is observed because MOLT-CF was originally parameterized to reproduce the density of the hexane and NC ligands at 387 K and P close to Pvap (0.33 MPa). An alternative approach is possible without modifying the functional form and consists of parameterizing MOLT-CF with temperature-dependent coefficients so that the solvent phase diagram quantitatively agrees with simulations and experiments. In this way, the model has no predictive power with regard to the solvent, but still remains fully predictive for the prediction of the stable phases in nanoparticle systems.
MOLT-CF very generally shows that fcc is favored by entropy while bcc by enthalpy. This is a somewhat counterintuitive result: calculations that treat ligands implicitly by using soft interparticle interaction potentials25 show that the vibrational (phonon) entropy of bcc is always larger than fcc, a result that is attributed to the slightly more spherical bcc-shell. For the same reason, polymer theory considering ideal Gaussian statistics19 also predicts that bcc is entropically favored. We have provided a physical interpretation of the bcc to fcc transition by examining how the entropic and enthalpic components change as a function of NC separation; see Fig. 7, and have shown that entropy and energy differences between bcc and fcc are strongly correlated to a purely geometric quantity: the difference in volume overlap eqn (22), thus underlying a universal description, i.e. holding true for a large class of NC interactions irrespective of actual microscopic details.
It was shown in ref. 21 and 22 that the slowest relaxation time is inversely proportional to the solvent diffusion coefficient. Our simulations show that the diffusion coefficient consistently vanishes as the solvent content tends to zero, implying a significant slowdown in the latest stages of the evaporation process.
In summary, we have provided a detailed investigation of the thermodynamic properties, phase behavior and relaxation timescales of NC single component systems. For the former two sets of properties, MOLT-CF provides a powerful self-consistent theory that favorably compares with experimental results and MD predictions.
The success of MOLT-CF in predicting all the available phenomenology in single component systems, makes a strong case for its applicability in more general cases. Indeed, with minor modifications to the calculations presented in this paper, this tool can be applied to any NC shape, for example, ref. 42 and 43, multicomponent NC systems12,44 and other cases, such as patchy NCs.45 We will definitely report on this in the near future.
Author contributions
AT and MT designed the project. AU performed MD and MT and LM performed the MOLT-CF calculations. All authors participated in the data analysis. AT and MT wrote the paper.
Data availability
The data used in this paper are available free of charge at the DataShare repository at Iowa State University https://www.lib.iastate.edu/collections/datashare-isu-data-repository with the digital object identifier: https://doi.org/10.25380/iastate.27879912.
Conflicts of interest
There are no conflicts to declare.
Acknowledgements
AT acknowledges interest and discussions with S. Mallapragada and D. Vaknin and X. Ye. AT and AU work is supported by NSF-DMR-CMMT 2402548. MT is a fellow of CONICET. MT acknowledges financial support from ANPCyT (PICT 1520-2019) and CONICET (PIP 11220200102008C). This work used EXPANSE and BRIDGES2 through allocation MCB140071 from the Advanced Cyberinfrastructure Coordination Ecosystem: Services Support (ACCESS) program,46 which is supported by National Science Foundation grants 2138259, 2138286, 2138307, 2137603, and 2138296.
Notes and references
- C. L. Bassani, G. van Anders, U. Banin, D. Baranov, Q. Chen, M. Dijkstra, M. S. Dimitriyev, E. Efrati, J. Faraudo, O. Gang, N. Gaston, R. Golestanian, G. I. Guerrero-Garcia, M. Gruenwald, A. Haji-Akbari, M. Ibáñez, M. Karg, T. Kraus, B. Lee, R. C. Van Lehn, R. J. Macfarlane, B. M. Mognetti, A. Nikoubashman, S. Osat, O. V. Prezhdo, G. M. Rotskoff, L. Saiz, A.-C. Shi, S. Skrabalak, I. I. Smalyukh, M. Tagliazucchi, D. V. Talapin, A. V. Tkachenko, S. Tretiak, D. Vaknin, A. Widmer-Cooper, G. C. L. Wong, X. Ye, S. Zhou, E. Rabani, M. Engel and A. Travesset, ACS Nano, 2024, 18, 14791–14840 CrossRef CAS.
- M. A. Boles, M. Engel and D. V. Talapin, Chem. Rev., 2016, 116, 11220–11289 CrossRef CAS PubMed.
- Y. Wang, J. Chen, C. Zhu, B. Zhu, S. Jeong, Y. Yi, Y. Liu, J. Fiadorwu, P. He and X. Ye, Nano Lett., 2021, 21, 5053–5059 CrossRef CAS PubMed.
- L. L. Missoni, A. Upah, G. Zaldívar, A. Travesset and M. Tagliazucchi, Nano Lett., 2024, 24, 5270–5276 CrossRef CAS PubMed.
- L. L. Missoni and M. Tagliazucchi, ACS Nano, 2020, 14, 5649–5658 CrossRef CAS PubMed.
- L. Missoni and M. Tagliazucchi, Nanoscale, 2021, 13, 14371–14381 RSC.
- R. L. Whetten, M. N. Shafigullin, J. T. Khoury, T. G. Schaaff, I. Vezmar, M. M. Alvarez and A. Wilkinson, Acc. Chem. Res., 1999, 32, 397–406 CrossRef CAS.
- U. Landman and W. D. Luedtke, Faraday Discuss., 2004, 125, 1–22 RSC.
- K. Bian, J. J. Choi, A. Kaushik, P. Clancy, D.-M. M. Smilgies and T. Hanrath, ACS Nano, 2011, 5, 2815–2823 CrossRef CAS PubMed.
- M. C. Weidman, D.-M. M. Smilgies and W. A. Tisdale, Nat. Mater., 2016, 15, 775–781 CrossRef CAS PubMed.
- I. Lokteva, M. Koof, M. Walther, G. Grübel and F. Lehmkühler, Small, 2019, 15, 1900438 CrossRef.
- A. Travesset, Curr. Opin. Solid State Mater. Sci., 2024, 30, 101159 CrossRef CAS.
- M. R. Hasan, B.-J. Niebuur, M. Siebrecht, B. Kuttich, R. Schweins, A. Widmer-Cooper and T. Kraus, ACS Nano, 2023, 17, 9302–9312 CrossRef CAS PubMed.
- M. I. Bodnarchuk, M. V. Kovalenko, W. Heiss and D. V. Talapin, J. Am. Chem. Soc., 2010, 132, 11967–11977 CrossRef CAS PubMed.
- Y. Ning, S. Yang, D.-B. Yang, Y.-Y. Cai, J. Xu, R. Li, Y. Zhang, C. R. Kagan, J. G. Saven and C. B. Murray, J. Am. Chem. Soc., 2024, 146, 3785–3795 CrossRef CAS PubMed.
- R. H. Gilmore, S. W. Winslow, E. M. Y. Lee, M. N. Ashner, K. G. Yager, A. P. Willard and W. A. Tisdale, ACS Nano, 2018, 12, 7741–7749 CrossRef CAS.
- S. W. Winslow, D.-M. Smilgies, J. W. Swan and W. A. Tisdale, J. Phys. Chem. C, 2020, 124, 13456–13466 CrossRef CAS.
- Z. Quan, H. Xu, C. Wang, X. Wen, Y. Wang, J. Zhu, R. Li, C. J. Sheehan, Z. Wang, D.-M. Smilgies, Z. Luo and J. Fang, J. Am. Chem. Soc., 2014, 136, 1352–1359 CrossRef CAS.
- B. W. Goodfellow, Y. Yu, C. A. Bosoy, D.-M. Smilgies and B. A. Korgel, J. Phys. Chem. Lett., 2015, 6, 2406–2412 CrossRef CAS PubMed.
-
Z. Fan and M. Gruenwald, ChemRxiv, 2019, preprint DOI:10.26434/chemrxiv.9178037.v1.
- E. Macias, T. Waltmann and A. Travesset, Soft Matter, 2020, 16, 7350–7358 RSC.
- T. Waltmann and A. Travesset, Nanoscale, 2019, 11, 18702–18714 RSC.
- W. L. Jorgensen, J. D. Madura and C. J. Swenson, J. Am. Chem. Soc., 1984, 106, 6638–6646 CrossRef CAS.
-
N. Fuchs, Evaporation and Droplet Growth In Gaseous Media, Pergamon Press, 1st edn, 1959, pp. 1–72 Search PubMed.
- A. Travesset, J. Chem. Phys., 2014, 141, 164501 CrossRef.
- J. A. Anderson, C. D. Lorenz and A. Travesset, J. Comput. Phys., 2008, 227, 5342–5359 CrossRef.
- T. D. Nguyen, C. L. Phillips, J. A. Anderson and S. C. Glotzer, Comput. Phys. Commun., 2011, 182, 2307–2313 CrossRef CAS.
- A. Upah, A. Thomas, J. Hallstrom and A. Travesset, J. Chem. Theory Comput., 2024, 20, 1559–1567 CrossRef CAS PubMed.
- X. Zha and A. Travesset, J. Phys. Chem. C, 2018, 122, 23153–23164 CrossRef CAS.
- G. Zaldivar, Y. A. Perez Sirkin, G. Debais, M. Fiora, L. L. Missoni, E. Gonzalez Solveyra and M. Tagliazucchi, ACS Omega, 2022, 7, 38109–38121 CrossRef CAS PubMed.
- S. Sadovnikov and A. Gusev, J. Alloys Compd., 2014, 610, 196–202 CrossRef CAS.
- Z. I. Zaripov, S. A. Burtsev, A. V. Gavrilov and G. K. Mukhamedzyanov, Theor. Found. Chem. Eng., 2002, 36, 400–405 CrossRef CAS.
- P. Pruzan, J. Chem. Thermodyn., 1991, 23, 247–259 CrossRef CAS.
- B. W. Goodfellow, M. R. Rasch, C. M. Hessel, R. N. Patel, D.-M. Smilgies and B. A. Korgel, Nano Lett., 2013, 13, 5710–5714 CrossRef CAS PubMed.
- P. Podsiadlo, B. Lee, V. B. Prakapenka, G. V. Krylova, R. D. Schaller, A. Demortiere and E. V. Shevchenko, Nano Lett., 2011, 11, 579–588 CrossRef CAS PubMed.
- J. Dymond, K. Young and J. Isdale, J. Chem. Thermodyn., 1979, 11, 887–895 CrossRef CAS.
- R. L. Whetten, J. T. Khoury, M. M. Alvarez, S. Murthy, I. Vezmar, Z. L. Wang, P. W. Stephens, C. L. Cleveland, W. D. Luedtke and U. Landman, Adv. Mater., 1996, 8, 428–433 CrossRef CAS.
- Z. Fan and M. Grünwald, J. Am. Chem. Soc., 2019, 141, 1980–1988 CrossRef CAS PubMed.
- K. R. Harris, J. Chem. Soc., Faraday Trans. 1, 1982, 78, 2265 RSC.
- R. Melnyk, I. Nezbeda, D. Henderson and A. Trokhymchuk, Fluid Phase Equilib., 2009, 279, 1–10 CrossRef CAS.
- P. J. Camp, Phys. Rev. E:Stat., Nonlinear, Soft Matter Phys., 2003, 67, 011503 CrossRef PubMed.
- Y. Liu, M. Klement, Y. Wang, Y. Zhong, B. Zhu, J. Chen, M. Engel and X. Ye, J. Am. Chem. Soc., 2021, 143, 16163–16172 CrossRef CAS.
- Y. Wang, J. Chen, Y. Zhong, S. Jeong, R. Li and X. Ye, J. Am. Chem. Soc., 2022, 144, 13538–13546 CrossRef CAS.
- I. Coropceanu, M. A. Boles and D. V. Talapin, J. Am. Chem. Soc., 2019, 141, 5728–5740 CrossRef CAS.
- T. Vo, Soft Matter, 2024, 20, 3554–3576 RSC.
-
T. J. Boerner, S. Deems, T. R. Furlani, S. L. Knuth and J. Towns, Practice and Experience in Advanced Research Computing, 2023, pp. 173–176 Search PubMed.
Footnote |
| † Electronic supplementary information (ESI) available: Contains technical details of the calculations and additional plots complementing the ones in the main paper. See DOI: https://doi.org/10.1039/d4sm01265h |
|
| This journal is © The Royal Society of Chemistry 2025 |
Click here to see how this site uses Cookies. View our privacy policy here. 
 Open Access Article
 This Open Access Article is licensed under a Creative Commons Attribution-Non Commercial 3.0 Unported Licence
 a,
Leandro
Missoni
a,
Leandro
Missoni


 , as extensively discussed in ref. 12υl is unambigously determined. An independent simulation of the pure solvent determines υs

 (R, η solvent radius and viscosity) characterizing the pure solvent, as the solvent residing mainly in the interstitial lattice needs to diffuse through the ligands by hopping from one NC to the next, until it eventually reaches the boundary of the system and escapes into the vapor phase.


 . If the interval between T/K = [313.15,363.15] is used, then α < 0.0005 K−1, but α ≈ 0.0005 K−1 between T/K = [363.15,413.15]. Ref. 16 measured α = 1.2 × 10⁻⁴ K−1 at T = 300 K, consistent with these estimates.


 , and therefore, the value of
 and ligand shell h. More precisely, taking a test NC at the origin, then


 is obtained from the value for fcc in eqn (3). Therefore, the new dimensionless variable

 is the softness and ξ = σA0 the dimensionless grafting density, see eqn (6) for the definition of the other parameters. For large values of nh,l (λ ≫ 1), eqn (28) implies that ueq shifts to the left for increasing softness as ueq ∝ λ−2/3.