
 Open Access Article
 This Open Access Article is licensed under a Creative Commons Attribution-Non Commercial 3.0 Unported Licence
Efficient energy transfer from organic triplet states to Mn2+ dopants for dynamic tunable multicolor afterglow in 1D hybrid cadmium chloride†
Ke
Zhang
a,
Zhikai
Qi
 *a,
Nan
Zhang
a,
Xingxing
Zhao
a,
Yanli
Fan
a,
Long
Sun
b,
Guojun
Zhou
a,
Shi-Li
Li
a and
Xian-Ming
Zhang
*ac
*a,
Nan
Zhang
a,
Xingxing
Zhao
a,
Yanli
Fan
a,
Long
Sun
b,
Guojun
Zhou
a,
Shi-Li
Li
a and
Xian-Ming
Zhang
*ac
aKey Laboratory of Magnetic Molecules & Magnetic Information Materials (Ministry of Education), School of Chemistry and Material Science, Shanxi Normal University, Taiyuan 030031, P. R. China. E-mail: qizk@sxnu.edu.cn; zhangxm@sxnu.edu.cn
bDepartment of Chemistry, Changzhi Universtiy, Changzhi 046011, P. R. China
cCollege of Chemistry and Chemical Engineering, Key Laboratory of Interface Science and Engineering in Advanced Material, Taiyuan University of Technology, Taiyuan 030024, P. R. China. E-mail: zhangxianming@tyut.edu.cn
First published on 6th March 2025
Abstract
Metal ion-doped organic–inorganic hybrid metal halides have emerged as promising room-temperature phosphorescence (RTP) materials owing to their tunable afterglow properties and significant potential in information security applications. However, optimizing RTP performance and achieving dynamic control over afterglow colors remain challenging in 1D hybrid systems, primarily because of the inefficient energy transfer from RTP-active organic components to external emissive sites. Herein, we report a novel 1D hybrid metal halide benchmark material, [(NBP)Cd2Cl5H2O] (NBP-Cd, NBP = N-benzylpiperidone), and a series of Mn2+-doped derivatives, NBP-Cd:xMn2+ (where x represents doping levels from 1% to 50%). The undoped compound exhibits blue-white fluorescence and exceptional long-lasting yellow-green organic RTP with a duration of up to 2 s. Upon Mn2+ doping, the afterglow color transitions progressively from yellow-green (1–5%) to yellow (10%), orange (20%), and finally red (50%), accompanied by a reduction in afterglow duration. This dynamic multicolor afterglow behavior is attributed to efficient energy transfer from the stable triplet states within the organic component to the 4T1 level of the Mn2+ dopants. Remarkably, the NBP-Cd:10% Mn2+ crystal demonstrates exceptional excitation-dependent dual-mode photoluminescence properties. These distinctive features underscore the significant potential of this model system for advanced applications in anti-counterfeiting technologies and high-level information encryption systems.
Introduction
Long-afterglow molecular systems demonstrating ultralong room temperature phosphorescence (RTP) have garnered significant attention because of their versatile applications in anti-counterfeiting and information encryption.1–4 Long-persistent luminescence materials studied extensively thus far including single-component organics,5,6 all-inorganic crystals,7 molecular cocrystals,8 carbon dots (CDs),9 and metal–organic self-assembly systems10,11 typically exhibit uniform afterglow due to their reliance on single electron transition pathways. Considerable efforts have been directed toward engineering duration-tunable multicolor afterglow materials that adjust long-lasting luminescence in response to variables such as excitation wavelength,12 time,13 or even temperature.14–16 For instance, host–guest doping strategies employed in polycyclic aromatic organic molecular systems have yielded temperature-dependent multicolor afterglow emission properties.17 Similarly, the construction of multiple emission centers in all-inorganic lattices through external metal ion doping has demonstrated efficacy in regulating the host-dopant energy transfer.18 Notably, Mn2+-doped 3D-networked CsCdCl3 and 2D-layered Ruddlesden–Popper perovskite Cs2CdCl4 crystals achieve a blue-to-orange color shift by manipulating trap energy levels.13,19 However, pure organic materials are often hindered by their inherent instability and low emission efficiency, while all-inorganic materials face challenges related to high energy consumption and safety concerns.20–24 These limitations have driven the search for novel benchmark materials capable of effectively modulating afterglow colors, unlocking innovative applications in the field.Organic–inorganic hybrid metal halides (OIMHs) have emerged as highly promising RTP materials due to their structural versatility, spectral tunability, and high quantum efficiency.25–29 By integrating RTP-active organic moieties with wide-bandgap low-dimensional inorganic sublattices, OIMHs can achieve tunable RTP emission.30,31 Additionally, previous studies have demonstrated that Mn2+ ion doping strategies can mitigate the reliance on single RTP-capable organic molecules and modulate multi-afterglow properties by precisely tuning the energy transfer between the organic and inorganic components.32–35 For example, enhanced Dexter energy transfer from organic triplet states to excitons in Mn-doped 2D perovskite lattices leads to superefficient red-light emission, with a red afterglow originating from Cd2+.36 Moreover, the formation of Mn2+ pairs in doped Cd-based layered matrices facilitates thermally assisted energy transfer from organic triplet excitons to the external dopants, enabling multilevel stimulus-responsive color-tunable RTP properties.37 Compared to 2D layered systems, one-dimensional (1D) chain-like structures exhibit more pronounced quantum confinement effects and larger exciton binding energy,38,39 almost aligning the energy levels of organic phosphorescent molecules and inorganic chains, thus representing an ideal platform for designing high-performance RTP OIMHs. However, the typical red emissions associated with the d–d transitions (4T1 → 6A1) of octahedral Mn2+ ions in 1D Cd-based hybrid systems often fail to support color-tunable afterglow,40–42 significantly limiting the exploration of advanced RTP materials due to the lack of efficient host-dopant energy transfer.
Herein, we report a novel 1D hybrid metal halide benchmark material, [(NBP)Cd2Cl5H2O] (NBP-Cd, NBP = N-benzylpiperidone), and a series of Mn2+-doped derivatives, NBP-Cd:xMn2+ (where x represents doping levels from 1% to 50%), characterized by 1D polyanionic chain encapsulated by RTP-active organic templates. The undoped compound exhibits blue-white fluorescence at 472 nm and exceptional long-lasting yellow-green organic RTP (550 nm) with a duration of up to 2 s. Upon Mn2+ doping, the afterglow color transitions progressively from yellow-green (1–5%) to yellow (10%), orange (20%), and finally red (50%), accompanied by a reduction in afterglow duration. This dynamic multicolor afterglow behavior is attributed to efficient energy transfer from the stable triplet excitons in the organic cations to the 4T1 level of the octahedral Mn2+. Notably, the NBP-Cd:10% Mn2+ crystal demonstrates exceptional excitation-dependent PL properties. These distinctive features underscore the potential of these materials for advanced applications in anti-counterfeiting technologies and high-level information encryption systems.
Results and discussion
The synthesis of NBP-Cd crystals was achieved via a straightforward solvent evaporation method. A 1![[thin space (1/6-em)]](https://www.rsc.org/images/entities/char_2009.gif) :1 molar ratio of CdCl2·2.5H2O and NBP was dissolved in a mixture of ethanol and hydrochloric acid. After stirring for 30 minutes to ensure a clear solution, the solvent was gradually evaporated over several days, yielding transparent crystals of NBP-Cd that can emit bright cyan light under 365 nm UV irradiation. Thermogravimetry-differential scanning calorimetry (TG-DSC) analysis revealed excellent thermal stability of NBP-Cd, with a decomposition temperature reaching up to 385 K, and no phase transition occurring before decomposition (Fig. S1†). Furthermore, Fourier-transform infrared (FT-IR) spectroscopy of the crystalline sample indicated stronger vibrational peaks for N–H bonds at ∼3160 cm−1 and for the carbonyl group (–C
:1 molar ratio of CdCl2·2.5H2O and NBP was dissolved in a mixture of ethanol and hydrochloric acid. After stirring for 30 minutes to ensure a clear solution, the solvent was gradually evaporated over several days, yielding transparent crystals of NBP-Cd that can emit bright cyan light under 365 nm UV irradiation. Thermogravimetry-differential scanning calorimetry (TG-DSC) analysis revealed excellent thermal stability of NBP-Cd, with a decomposition temperature reaching up to 385 K, and no phase transition occurring before decomposition (Fig. S1†). Furthermore, Fourier-transform infrared (FT-IR) spectroscopy of the crystalline sample indicated stronger vibrational peaks for N–H bonds at ∼3160 cm−1 and for the carbonyl group (–C![[double bond, length as m-dash]](https://www.rsc.org/images/entities/char_e001.gif) O) at around 1720 cm−1 (Fig. S2†) compared to those in amorphous NBP, signifying strong hydrogen bonding interactions within the material.43
O) at around 1720 cm−1 (Fig. S2†) compared to those in amorphous NBP, signifying strong hydrogen bonding interactions within the material.43
Single-crystal X-ray diffraction (XRD) analysis revealed that NBP-Cd crystallizes in the monoclinic space group P21/c (Table S1†), with the asymmetric unit comprising two Cd2+ ions, five Cl− anions, and one protonated organic cation (Fig. 1a). Cd1 adopts a distorted octahedral geometry, coordinated by two bridged Cl, three μ3-Cl, and one terminal H2O molecule, with Cd1–Cl bond distances ranging from 2.5481(17) to 2.7314(16) Å and a Cd1–O bond length of 2.325(5) Å (Table S2†). The Cl–Cd1–Cl and O–Cd1–Cl bond angles span 84.77(5)–175.48(6) ° and 81.38(15)–165.86(15)°, respectively (Table S3†). Similarly, the Cd2 ions also adopt a six-coordinated octahedral configuration involving one terminal, two bridged, and three μ3-Cl atoms, with Cd2–Cl bond lengths of 2.5485(18) to 2.7670(16) Å (Table S2†) and Cl–Cd2–Cl bond angles between 81.58(5)° and 174.58(5)° (Table S3†). These Cd-centered octahedra form a 1D polyanion [Cd2Cl5H2O]nn− chain through edge-sharing (Fig. 1b), which interacts with NBP+ cations through C/N⋯H–Cl and C/O⋯H–O hydrogen bonds (Fig. S3 and Table S4†). To further investigate the intermolecular interactions, we performed 3D Hirshfeld surfaces and 2D fingerprint plotting for the NBP+ cations and found that C/N/O–H⋯Cl and O–H⋯O interactions contribute 29.22% and 13.34%, respectively, to the total intermolecular contacts (Fig. S4†). Notably, NBP molecules are stacked perpendicular to the bc plane, forming ladder-type stacking facilitated by π⋯π interactions,31,44 with benzene ring distances ranging from 3.56 Å to 4.00 Å (Fig. 1c). Additionally, the three-dimensional (3D) stacking pattern along the a-axis shows that the 1D octahedral chain is encapsulated by organic cations (Fig. 1d). This molecular arrangement, combined with robust hydrogen bonding, enhances molecular rigidity, effectively suppressing non-radiative recombination by limiting molecular rotation in the excited states.
 | ||
| Fig. 1 (a) Asymmetric unit and (b) inorganic polyanionic [Cd2Cl5H2O]nn− chain of NBP-Cd. (c) Ladder-type arrangement of organic cations. (d) 3D stacking diagram along the a axis. | ||
NBP-Cd crystals exhibit bright cyan luminescence, accompanied by a yellow-green afterglow persisting for ∼2 s upon cessation of 365 nm irradiation and a faint cyan afterglow following removal of 254 nm irradiation (Fig. 2a). Steady state and delayed emissive spectra, along with kinetic decay curves, were recorded to characterize PL properties. The powder XRD pattern of NBP-Cd (Fig. S5†) matched the simulated pattern derived from single-crystal XRD data, confirming the high sample purity. Under 365 nm excitation, the prompt emission spectrum of NBP-Cd revealed a single band at 472 nm with a full width at half maximum (FWHM) of 150 nm and a photoluminescence quantum yield (PLQY) of 10.5% (Fig. 2b). The peak position remains constant under variable excitation energies (Fig. S6†), indicating a single emission site. The average lifetime (τavg) of this emission was 4.84 ns, indicative of fluorescence behavior (Fig. S7†). The delayed spectrum exhibited an emission peak at 550 nm (FWHM = 123 nm), resulting in a shift in CIE coordinates from blue-white (0.237, 0.230) to yellow-green (0.360, 0.497) (Fig. S8†). To elucidate the origin of these luminescence properties, spectral analysis of amorphous NBP demonstrated identical peak positions at 472 nm and 550 nm, as seen in NBP-Cd, though the emission lines were broadened due to increased vibrational modes. Fig. S9† indicates that the alterations in CIE coordinates for NBP are comparable to those of NBP-Cd. The τavg of the prompt emission in amorphous NBP is slightly shorter at 3.72 ns (Fig. S10†). Notably, the photoluminescence excitation (PLE) spectrum of NBP-Cd contains that of NBP (Fig. S11a†). These findings suggest that PL properties of NBP-Cd are primarily derived from the organic NBP cations. To further understand the differences in their excitation spectra, we measured the PL spectrum of NBP-Cd under 325 nm excitation, showing a dual-mode broadband emission with two peaks at 430 and 472 nm (Fig. S11b†). The lifetime of this high-energy peak was measured to be 1.27 ns (Fig. S11c†), which can be attributed to the free exciton within 1D Cd–Cl inorganic chains.39 Furthermore, upon removal of 365 nm UV irradiation, a brief glow lasting 0.2 s was observed in NBP (Fig. S12†). The kinetic measurements reveal that NBP-Cd and amorphous NBP have lifetimes of 328.06 ms and 54.07 ms, respectively (Fig. 2d). The extended lifetime of NBP-Cd can be attributed to enhanced ISC facilitated by external heavy-atom effects (HAE) of Cd2+ as well as the rigid hydrogen-bonded environment restricting nonradiative transitions. Therefore, the yellow-green afterglow luminescence of NBP-Cd can be predominately attributed to radiative recombination in the triplet states of NBP.
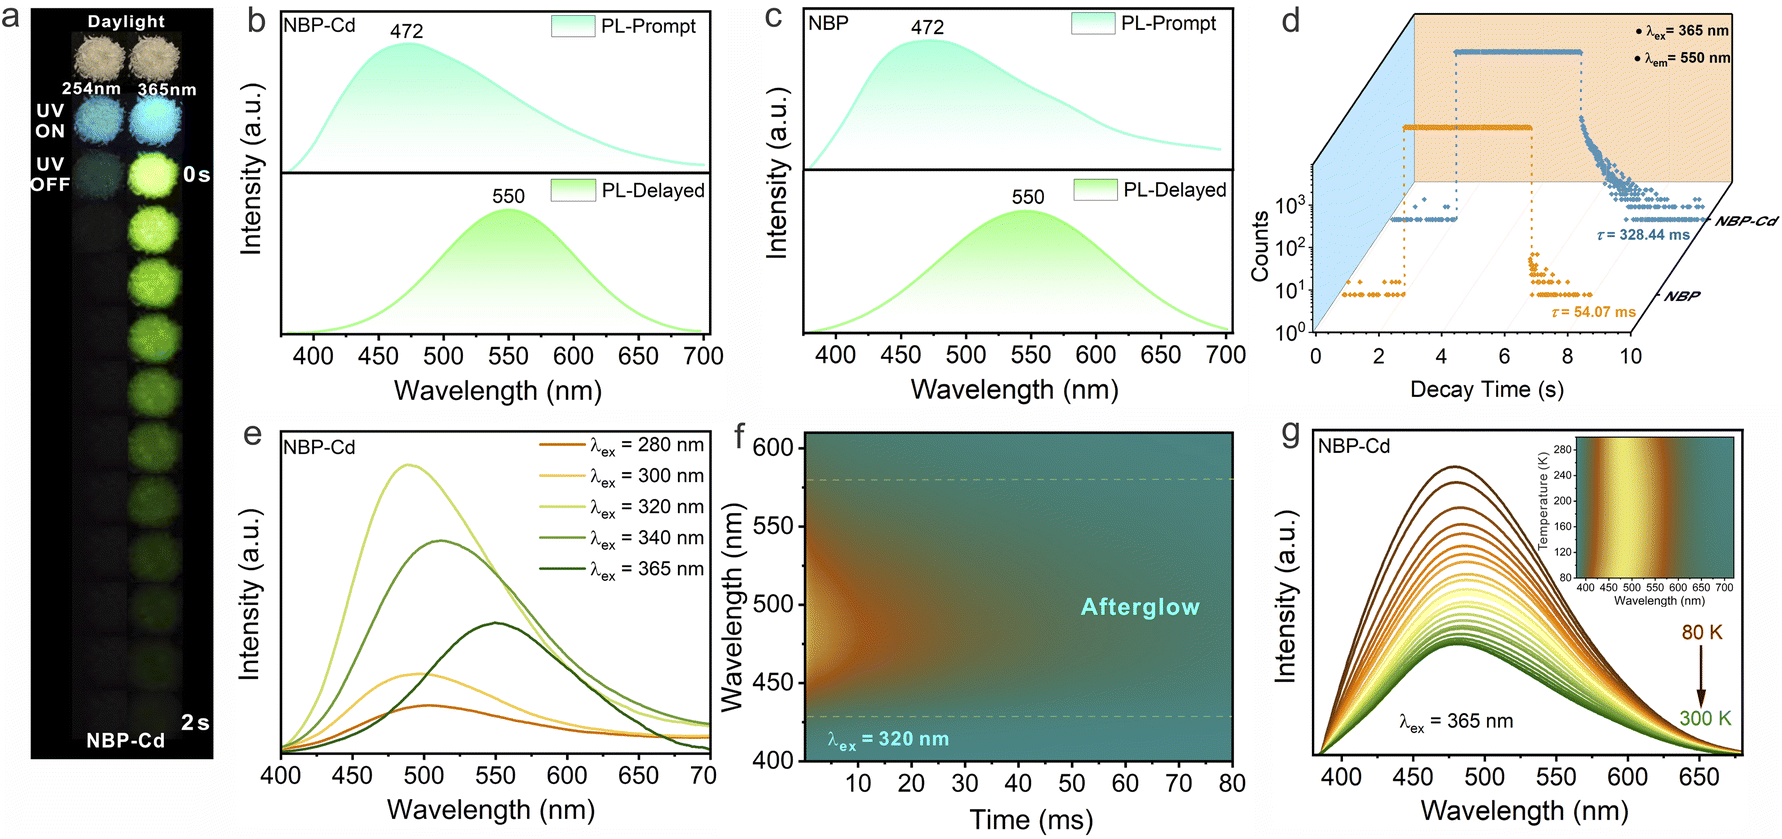 | ||
| Fig. 2 (a) Photographs of NBP-Cd crystals before and after cessation of 254 nm and 365 nm irradiation. Prompt and delayed (acquired after 0.5 ms of excitation) PL spectra of (b) NBP-Cd and (c) NBP under photoexcitation at 365 nm. (d) Kinetic decay curves of the delayed emission peak at 550 nm for NBP-Cd and NBP. (e) Excitation-dependent delayed spectra of NBP-Cd ranging from 280 nm to 365 nm. (f) Time-resolved delayed spectra of NBP-Cd under photoexcitation at 320 nm. (g) Variable-temperature emission spectra of NBP-Cd under photoexcitation at 365 nm. Inset: the corresponding mapping with normalized PL intensity. | ||
Excitation-dependent afterglow properties of NBP-Cd were further analyzed, revealing that the delayed emission peak shifted from 485 nm to 550 nm as the excitation wavelength varied from 280 to 365 nm (Fig. 2e). This shift corresponds to different triplet excited state levels, possibly arising from ladder-type stacking of the NBP aromatic rings and strong interactions between organic templates and inorganic metal halide substructures, rather than the individual NBP molecules.12 Under optimal excitation at 320 nm, prompt and delayed emission peaks appeared at 472 nm and 485 nm, respectively (Fig. S13a†). The decay curves monitored at these wavelengths indicate singlet and triplet lifetimes of 4.31 ns (Fig. S13b†) and 313.98 ms (Fig. S13c†), respectively. Fig. 2f shows that the spectra measured at various delay times under 320 nm excitation reveal a stable triplet emission peak at 485 nm, with no observable shift in the peak position despite decreasing intensity, indicating the robustness of the triplet emission. To further investigate the emission origin of NBP-Cd, we performed an exhaustive analysis by systematically acquiring variable-temperature steady-state PL spectra and time-resolved decay curves. As shown in Fig. 2g, as the temperature is lowered from 300 K to 80 K, the peak intensity at 472 nm progressively increases, mainly due to the suppression of non-radiative decay pathways at reduced temperatures. Additionally, the corresponding bandwidths remain almost consistent across the whole temperature range (inset of Fig. 2g and S14†), which is in accordance with the previous observations in hybrid luminescence systems primarily governed by organic molecules.26,45,46 Plus, the PL decay curve at 80 K reveals a decreased decay rate, with a τavg of 392.2 ns (Fig. S15†), which is two orders of magnitude higher than that at RT, because of the reduction in non-radiative transition probabilities.47 These findings conclusively prove that the afterglow emission is of phosphorescent nature and rules out the possibility of thermally activated delayed fluorescence (TADF) with reversed ISC.
To gain deeper insights into the emission mechanism of NBP-Cd, density functional theory (DFT) calculations were performed to scrutinize the band structure, density of states (DOS), and electron density distribution. As illustrated in Fig. 3a, the electronic band structure indicates flat bands featuring a direct band gap of 3.50 eV, with both valence band maximum (VBM) and conduction band minimum (CBM) situated at the Γ (0, 0, 0) point. DOS analysis reveals that the VBM and CBM are mainly composed of contributions from the carbon (C 2p) and oxygen (O 2p) orbitals (Fig. 3b). Frontier orbital analysis further demonstrates that electrons in the highest occupied molecular orbital (HOMO) are predominantly distributed across the benzyl group of NBP, with a minor contribution from the chlorine atom of the inorganic unit (Fig. 3c). Conversely, holes in the lowest unoccupied molecular orbital (LUMO) are primarily localized on the piperidine ring and carbonyl group within NBP (Fig. 3d). This spatial distribution suggests efficient charge transfer from the benzyl group to the piperidine carbonyl group of NBP molecules during photoexcitation, which is responsible for the luminescence of NBP-Cd. Concurrently, the subtle transition involving the chlorine atoms to the piperidine carbonyl group implies the approximate alignment of energy levels between organic phosphorescent molecules and inorganic chains, underlying the excitation-dependent phosphorescence emission. This observation underscores the role of the organic–inorganic interface in modulating the electronic transitions and photophysical properties of the material.
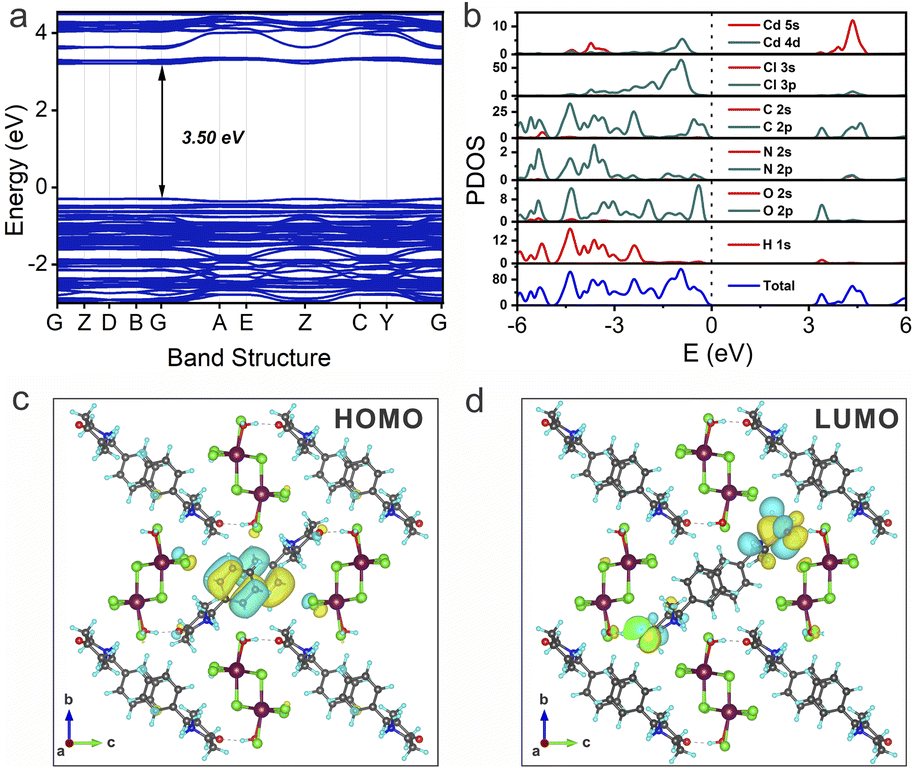 | ||
| Fig. 3 (a) Band structure, (b) PDOS, (c) HOMO, and (d) LUMO of NBP-Cd. | ||
Previous studies proved that doping with Mn2+ ions represents an effective strategy to modulate the luminescence properties of hybrid metal halides, largely due to efficient energy transfer between multiple emission sites.32,48–50 Since Mn2+ and Cd2+ have identical valences, Mn2+ ions can readily substitute for Cd2+ within the host lattice.35 Following this principle, we synthesized a series of NBP-Cd:xMn2+ (x = 1–50%) crystal samples using the solvothermal method. As depicted in Fig. 4a, Mn2+ ions partially replace Cd2+ at the original lattice sites. Inductively coupled plasma (ICP) emission spectrometry confirmed the Mn2+ content in the doped samples, as presented in Fig. 4b. The actual Mn2+ content increased proportionally with the feed ratio during synthesis, ranging from 0.01 to 0.36 as the feed ratio increased from 1% to 50%. Powder XRD data (Fig. 4c) show that the characteristic diffraction peaks of the doped samples closely match those of pure NBP-Cd, indicating that the external ionic dopants do not destroy the host lattice of the benchmark material. A shift in the primary diffraction peak (<10°) from 7.91° to 8.02° was observed as the Mn2+ content increased from 0.01 to 0.09, corresponding to lattice shrinkage due to the smaller ionic radius of Mn2+ (0.67 Å) compared to Cd2+ (0.96 Å). However, as the Mn2+ content further increases from 0.12 to 0.36, the diffraction peak shifts back to a lower angle at 7.89° (Fig. S16†), suggesting lattice expansion. This phenomenon likely results from excess Mn2+ ions entering into interstitial sites within the lattice rather than substituting for Cd2+ ions,51,52 thereby expanding the NBP-Cd lattice. Moreover, a new weak diffraction peak at 7.62° is observed for the NBP-Cd:50%Mn2+ sample, suggesting that external Mn2+ doping induces a minor structural disturbance or introduces a structural defect.53,54 Additionally, the TGA curves of NBP-Cd:10%Mn2+ show similar decomposition processes and temperatures (385 K) to those of pure NBP-Cd, demonstrating that the introduction of small amounts of Mn2+ does not significantly affect the thermal stability of the host lattice.
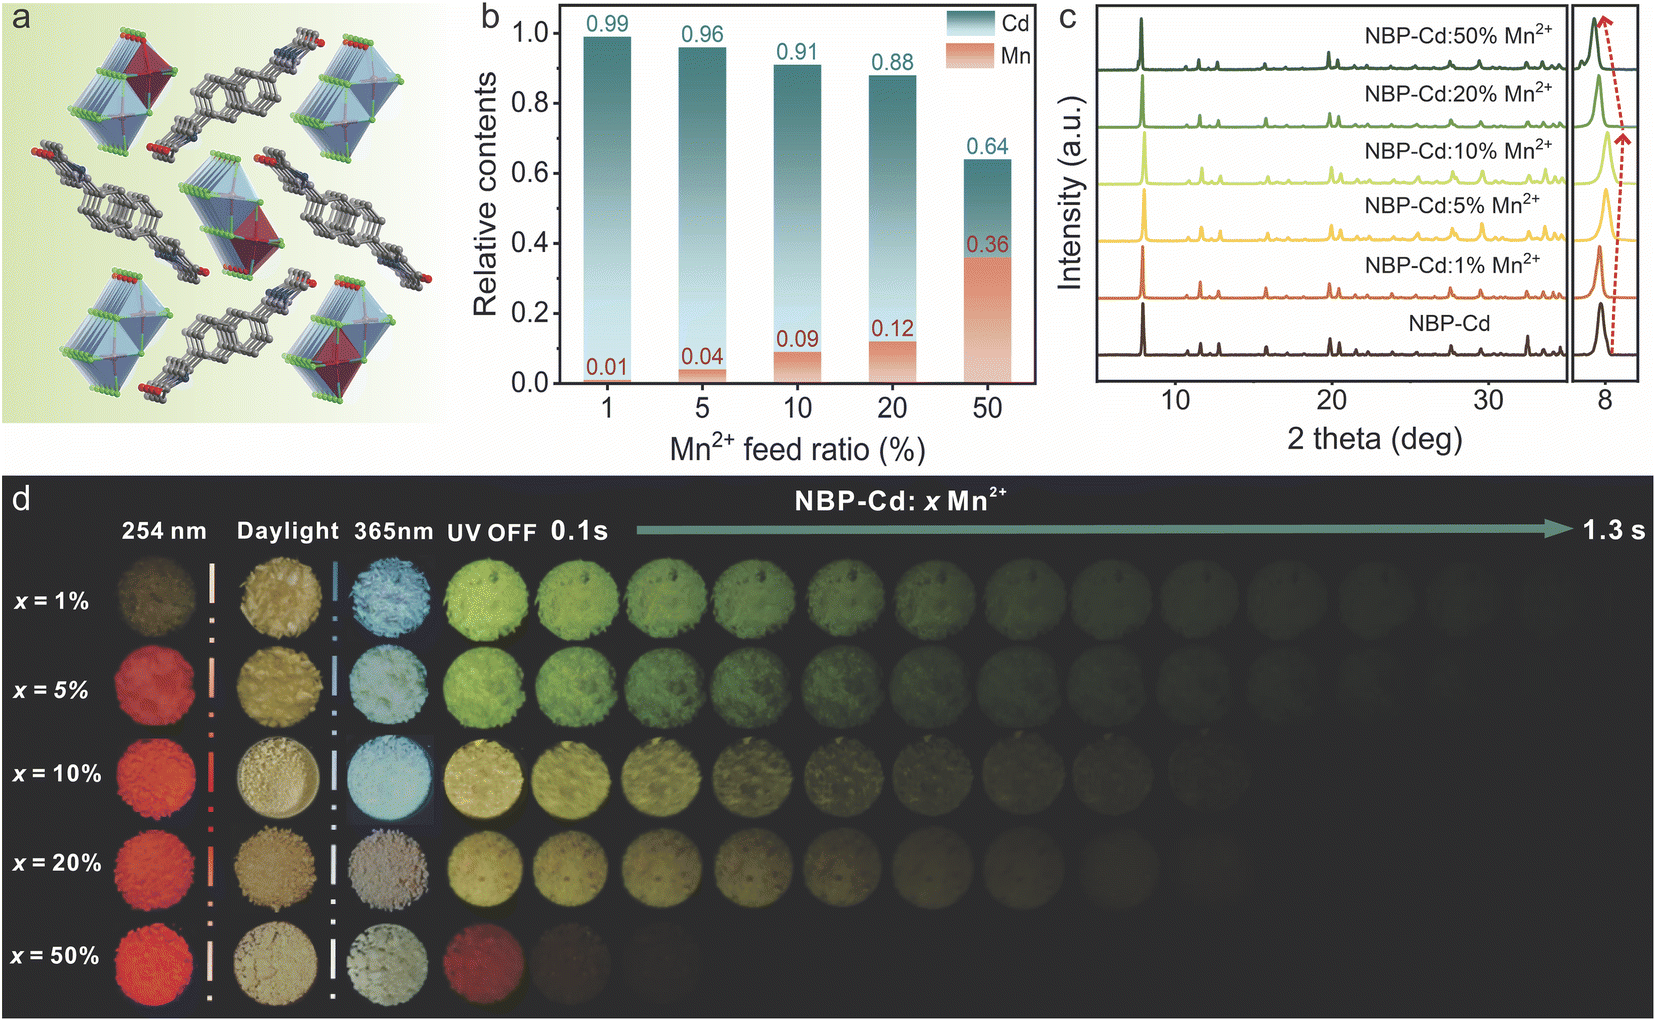 | ||
| Fig. 4 (a) Schematic representation of the crystal structure of NBP-Cd:xMn2+. (b) Actual Mn2+ content as a function of feed ratio of Mn and Cd in doped NBP-Cd systems. (c) PXRD patterns of NBP-Cd:xMn2+ samples. (d) Photographs of NBP-Cd:xMn2+ crystals under 254 nm and 365 nm irradiations as well as after removing 365 nm irradiation. | ||
Upon irradiation with a 254 nm UV lamp, the doped samples exhibited red emission with no afterglow upon switching off the UV source (Fig. 4d). Conversely, excitation with 365 nm UV light caused a shift in emission color from blue-white to white as the Mn2+ concentration increased. Upon turning off the 365 nm UV exposure, afterglow emission ranging from yellow-green to orange-yellow was observed for samples with doping levels of 1% to 20% (Fig. 4d), with afterglow durations decreasing from 1.3 s to ∼1.0 s. The NBP-Cd:50%Mn2+ crystals exhibited a brief red afterglow lasting ∼0.2 s. These observations demonstrate that the introduction of Mn2+ significantly alters the afterglow emission properties of NBP-Cd, likely by creating new afterglow emission centers or facilitating energy transfer from organic ligands to the d orbitals of Mn2+.36,37
Spectral and lifetime measurements for the doped samples were conducted to further investigate the luminescence performance. Fig. 5a shows that under photoexcitation at 254 nm, NBP-Cd:10% Mn2+ displayed the strongest red emission at 660 nm, surpassing other samples with varying Mn2+ doping levels. This emission is attributed to the 4T1 (G) → 6A1(S) transition of Mn2+ ions in an octahedral field, rather than the characteristic energy level transition of Cd (3Eg–1A1g, with emission at 612 nm) as reported in previous studies.19 We measured the PL lifetimes for these red emissions across all samples and found that the lifetime initially increased from 203.62 μs to 312.30 μs as the x value increased from 1% to 10%, before gradually reducing to 260.62 μs at a doping level of 50% (Fig. 5b). Fig. S17† shows the excitation spectra of NBP-Cd:xMn2+ for the emission peak at 660 nm with two obvious excitation peaks at 270 and 306 nm. The emission spectra under 270 nm photoexcitation are almost consistent with those under 254 nm excitation (Fig. S18a†). Moreover, the 306 nm excitation leads to characterized dual-mode emissions when the Mn2+ doping content is >1% (Fig. S18b†). The PL lifetimes of emission at 660 nm under both 270 nm and 306 nm excitations show similar tendency to that under 254 nm excitation (Fig. S18c and d†), with the longest lifetimes observed at a Mn2+ doping content of 10%. Furthermore, a similar trend was observed in the PLQY measurements (Table S5†), with the NBP-Cd:10%Mn2+ sample exhibiting highest emission efficiency (31.1% for 254 nm and 40.5% for 270 nm). The reduced PL lifetimes and decreased emission efficiencies for the doping levels of 20% and 50% could be attributed to the enhanced defect-related nonradiative recombination at high Mn2+ concentration.52,55 These findings suggest that when x is 10%, Mn ions optimally substitute Cd lattice sites in the host, consistent with PXRD data. For the NBP-Cd:10%Mn2+ sample, the emission properties exhibit distinct variations with excitation energy (Fig. 5c). Specifically, the peak intensity at 660 nm gradually wanes as the excitation wavelength increases from 260 nm to 370 nm, while peaks associated with the organic component correspondingly increase. This observation indicates that the 365 nm light source cannot effectively induce the spin-forbidden d–d transition in Mn2+ ions, in contrast to previous reports on Mn-doped 2D hybrid systems.36 The corresponding CIE coordinates (Fig. S19†) and PLE spectra (Fig. S20†) reveal notable excitation-dependent emission characteristics for the NBP-Cd:10%Mn2+ sample. As shown in Fig. 5d, upon 365 nm UV light excitation, the emission spectra of doped samples are dominated by high-energy broadband emissions from the organic conjugate group. Increasing Mn2+ content leads to decreasing nanosecond-scale lifetimes (Fig. 5e), indicating that the Mn2+ incorporation reduces the excited state populations in organic emission centers. Notably, low-energy emissions are observed when the doping concentration exceeds 10%, likely due to the d–d spin-forbidden transition of octahedral Mn2+.
 | ||
| Fig. 5 (a) Prompt emission spectra and (b) corresponding decay curves for the red emissions at 660 nm in NBP-Cd:xMn2+ under excitation at 254 nm. (c) Excitation-dependent emission spectra of the NBP-Cd:10%Mn2+ sample. (d) Prompt emission spectra and (e) corresponding decay curves for high-energy yellow-green emissions in NBP-Cd:xMn2+ under excitation at 365 nm. (f) UV-vis absorption spectra of NBP-Cd:xMn2+ (x = 0, 10%, and 20%). | ||
The UV-vis absorption spectra shown in Fig. 5f illustrate that NBP-Cd:xMn2+ samples (x = 0, 10%, and 20%) exhibit a high-energy absorption band centered at 260 nm and a low-energy band peaking at 360 nm, with a tail extending toward higher wavelengths. These two bands are attributed to π/n → π* electron transitions in organic templates.32 Notably, the absorption peak at 360 nm undergoes a significant enhancement and a slight blueshift with increasing Mn2+ doping levels, which likely originates from the enhanced absorption energy level (4E) of Mn2+ within the structure.56 Additionally, the observed augmentation in low-energy absorption in the 400–600 nm range is plausibly linked to the rise in structural defects introduced by higher Mn2+ concentrations.57
To further explore the RTP properties of the doped samples, NBP-Cd:xMn2+, we analyzed their delayed spectra and kinetic lifetimes. As shown in Fig. 6a, for doping levels of 1–5% Mn2+, the emission peak position remains consistent with that of the undoped base matrix (550 nm). However, as the doping content increases, the peak intensity reduces markedly, accompanied by a blue-shift in the peak position to 522 nm (50%). The corresponding phosphorescence lifetimes also shorten considerably, from 250.38 ms (1%) to 180.42 ms (20%), as shown in Fig. 6b. These findings suggest that Mn2+ doping alters the excited state energy levels, facilitating electron transitions and ultimately reducing the emission lifetime. Interestingly, at doping levels of 10% to 20%, a prominent red emission emerges in the low-energy region around 650 nm, with increasing intensity at higher doping concentrations. This red emission aligns with the PL emission observed under 254 nm photoexcitation, indicating the presence of energy transfer from the organic triplet state to Mn2+ dopants. This phenomenon can be attributed to the Dexter energy transfer mechanism, as substantiated by previous reports.33,37 Furthermore, this mechanism also elucidates the yellow and orange-yellow afterglow phenomena observed in the 10% and 20% samples (Fig. 4d), respectively, as supported by the corresponding CIE coordinates (Fig. S21†). At a doping level of 50%, the red peak gradually shifts to 660 nm and becomes the dominant emission. Fig. 6c shows that this red emission exhibited a millisecond-scale lifetime, aligning well with the d–d transition of Mn2+ in an octahedral coordination field. As the doping level increases from 10% to 50%, the lifetimes of the low-energy emission progressively decreased from 175.23 ms to 70.36 ms, which could be attributed to the conjecture that the elevated Mn2+ doping levels lead to the formation of Mn2+ pairs with much faster decay rate than isolated ions.58–60 The overall reduction in lifetime for both emission peaks as Mn2+ doping increases accounts for the shortened afterglow duration observed in Fig. 4d. Moreover, because of the excitation-dependent phosphorescence emission properties in the undoped NBP-Cd sample (Fig. 2e), we tested the prompt and delayed emission spectra of Mn-doped samples under 320 nm excitation. Fig. S22† shows the dual-mode emission from organic molecules and Mn dopants at a Mn2+ concentration of >1%. The delayed spectra (Fig. S23a†) and dynamic lifetimes of the two emission peaks (Fig. S23b and c†) demonstrate a similar trend to those under 365 nm excitation. These observations prove that the energy transfer process from the organic triplet to the energy level of Mn2+ can also occur under 320 nm excitation.
 | ||
| Fig. 6 (a) Delayed emission spectra and corresponding kinetic decay curves of emission peaks at (b) 550 nm and (c) 660 nm in NBP-Cd:xMn2+ under 365 nm excitation. (d) Schematic illustration of the proposed mechanism for the Mn2+ doped NBP-Cd system. | ||
To further explore the electronic properties of the Mn2+ doped samples and better understand the energy transfer mechanism, we carried out DFT calculations of the NBP-Cd:20%Mn2+ (see details in the ESI†). The band structures in Fig. S24a† show that the calculated bandgap of the Mn2+ doped sample is reduced from 3.50 eV to 2.18 eV. The PDOS in Fig. S24b† indicates that the HOMO is predominantly localized on the organic units, consistent with that of NBP-Cd, while the LUMO originates from the Mn 3d orbitals. These calculated results account for the extra absorption band in the low energy region, which could be favorable for the Dexter energy transfer from the organic unit to Mn2+ sites.
Based on the aforementioned investigations, we propose a plausible emission mechanism, as depicted in Fig. 6d. Upon excitation with 365 nm UV light, electrons in the ground state (S0) of the benchmark material NBP-Cd are promoted to the excited state (S1), forming free excitons. These excitons then relax back to the ground state, emitting nanosecond-scale fluorescence at 472 nm. Simultaneously, a portion of excitons undergo ISC to populate the triplet excited state (T1), where the excitation energy can subtly modulate the vibrational levels within the organic lattice. Triplet excitons eventually return to the ground state through a spin-forbidden transition, emitting long-lasting yellow-green phosphorescence. The elevated temperature does not reverse the ISC process. For Mn2+-doped matrices, photoexcitation at 254 nm promotes transitions from the 6A1(S) ground state to various excited states, including 4E (D), 4T2 (D), 4E (G), 4T2 (G), and 4T1 (G), characteristic of octahedral Mn2+ coordination. These transitions culminate in a typical red emission from the 4T1(G) → 6A1(S) transition. Although 365 nm UV irradiation does not significantly excite the spin-forbidden d–d transition of Mn2+ ions, upon the removal of the 365 nm light source, energy transfer from the stable organic triplet state  to the 4T1 level in the Mn2+ dopants is efficiently induced. This energy transfer process triggered by 300–365 nm irradiation leads to the combination of organic phosphorescence and octahedral Mn2+-specific emission, giving rise to multicolor afterglow from yellow to orange-yellow. At higher Mn2+ concentrations in the host matrix, organic phosphorescence is nearly quenched, and the red emission from Mn2+ becomes dominant. As a result, the afterglow properties of NBP-Cd:xMn2+ are predominantly governed by Mn2+ emission at elevated doping levels.
The adaptable PL and RTP properties of NBP-Cd and its manganese-doped variants make them highly suitable for a variety of applications, particularly in anti-counterfeiting and secure encryption. Fig. 7a demonstrates the practical application of NBP-Cd:10%Mn2+ by crafting intricate deer and leaf patterns, which are transparent under daylight but emit distinct colors—red, pink, and blue—when exposed to UV light at 254, 310, and 365 nm UV light, respectively. This excitation-wavelength-dependent color emission provides a robust method for anti-counterfeiting. Additionally, Fig. 7b shows patterns of snowflakes, square stars, and clouds created utilizing NBP-Cd, NBP-Cd:10%Mn2+, and NBP-Cd:50%Mn2+. These patterns emit blue-white and white light under 365 nm UV light and exhibit yellow-green, yellow, and red afterglows upon cessation of the UV light. On the other hand, two encryption strategies leverage the unique luminescent properties of these materials. In the first case, a dot-matrix pattern (4 × 8) was created using NBP-Cd, NBP-Cd:10%Mn2+, and NBP-Cd:50%Mn2+ to encrypt and decrypt information based on the binary code and ASCII conversion (Fig. 7c), in which luminescent dots represent ‘1’ and non-luminescent dots ‘0’. The matrix appears as an invalid binary code under visible light, and then the fluorescence triggered by UV excitation reveals a binary-to-ASCII conversion that initially reads “wDELow”. Decryption proceeds in two stages: (1) immediate cessation of the UV source alters the emission, converting the deceptive message to “gxsf”, and (2) after a 1.5-second delay, the correct message, “SXNU,” emerges from the afterglow. In the second encryption strategy, the distinct afterglow colors of the materials are used to encode Morse code symbols (Fig. 7d). A matrix pattern is constructed where yellow-green, yellow, and red afterglows represent the Morse code symbols “·”, “–”, and “– ·” respectively, simultaneously incorporating blank signals. Messages such as “RAZG” and “SXNU” are encrypted by arranging the afterglow patterns into sequential lines, which can be decrypted by interpreting the Morse code from the luminescent signals.
 | ||
| Fig. 7 (a) Anti-counterfeiting patterns with excitation-dependent properties designed using NBP-Cd:10%Mn2+. (b) Luminescence photographs of patterns before and after 365 nm UV lamp irradiation, where the snowflake, square star, and cloud patterns correspond to NBP-Cd:xMn2+ (x = 0, 10%, and 50%), respectively. (c) Schematic illustration of the encryption and decryption process in a time-resolved anti-counterfeiting system, decryptable as “SXNU”. (d) Information encryption employing afterglow colors of NBP-Cd:xMn2+ (x = 0, 10%, and 50%) to define Morse code symbols. | ||
Conclusions
In summary, we have successfully prepared a novel 1D hybrid Cd-based metal halide benchmark material [(NBP)Cd2Cl5H2O], featuring an infinite edge-shared octahedral polyanionic chain comprising two dependent CdCl6 and CdCl5O octahedra. This halide demonstrates blue-white fluorescence at 472 nm under 365 nm photoexcitation, alongside exceptional long-lasting yellow-green RTP at 550 nm with an afterglow duration of up to 2 s following the removal of the excitation source. The prolonged RTP is attributed to the triplet excitons in the organic templates with highly-ordered stacking states, enabled by the enhanced structural rigidity and strengthened intermolecular interactions. To achieve tunable RTP properties in terms of both color and lifetime, we implemented a Mn2+ doping strategy to synthesize a series of Mn2+-doped derivatives NBP-Cd:xMn2+. PXRD analysis confirms that at an optimal doping concentration of 10%, Mn2+ ions effectively substitute Cd2+ sites within the host lattice. The NBP-Cd:10%Mn2+ crystal exhibits the strongest red emission at 660 nm with a PLQY of 31.1%, along with exceptional excitation-dependent PL properties characterized by dual-mode emission. Notably, 365 nm UV irradiation does not significantly excite the spin-forbidden d–d transition of Mn2+ ions. Upon removal of the 365 nm excitation source, the afterglow color transitions seamlessly from yellow-green to yellow, orange, and eventually red with increasing Mn2+ doping level from 1% to 50%, accompanied by a reduction in afterglow duration. This dynamic tunable multicolor afterglow behavior unequivocally demonstrates efficient energy transfer from the stable triplet states within the organic component to the 4T1 level of the Mn2+ dopants. Furthermore, we explored the potential applications of these materials in anti-counterfeiting technologies and advanced information encryption systems. This study provides valuable experimental insights for engineering novel dynamic multicolored afterglow materials and significantly advances the development of OIMHs in the field of information security.Data availability
The data supporting this article have been included as part of the ESI.†Author contributions
K. Z., Z. Q. and X.-M. Z. conceived and designed the research. K. Z., X. Z. and Y. F. carried out the experiments. N. Z. was responsible for DFT calculations. L. S. was responsible for ICP characterization. All the authors analysed the data and discussed the results. K. Z., Z. Q. and X.-M. Z. wrote the manuscript.Conflicts of interest
There are no conflicts to declare.Acknowledgements
The authors acknowledge the financial support from the Joint Funds of the National Natural Science Foundation of China (U24A20506), the National Natural Science Foundation of China (22271211, 52202177, 22075168), the 1331 Project of Shanxi Province, and the Graduate Education Innovation Project of Shanxi Province (2024KY459).Notes and references
- X. Yang, G. I. N. Waterhouse, S. Lu and J. Yu, Chem. Soc. Rev., 2023, 52, 8005–8058 RSC.
- J.-Q. Zhao, D.-Y. Wang, T.-Y. Yan, Y.-F. Wu, Z.-L. Gong, Z.-W. Chen, C.-Y. Yue, D. Yan and X.-W. Lei, Angew. Chem., Int. Ed., 2024, 63, e202412350 CrossRef PubMed.
- M. Dai, Z. Qi and D. Yan, Angew. Chem., Int. Ed., 2024, 64, e202420139 CrossRef PubMed.
- F. Nie and D. Yan, Nat. Commun., 2024, 15, 5519 CrossRef PubMed.
- P. Alam, T. S. Cheung, N. L. C. Leung, J. Zhang, J. Guo, L. Du, R. T. K. Kwok, J. W. Y. Lam, Z. Zeng, D. L. Phillips, H. H. Y. Sung, I. D. Williams and B. Z. Tang, J. Am. Chem. Soc., 2022, 144, 3050–3062 CrossRef PubMed.
- D. R. Lee, K. H. Lee, W. Shao, C. L. Kim, J. Kim and J. Y. Lee, Chem. Mater., 2020, 32, 2583–2592 CrossRef.
- R. Yang, D. Yang, M. Wang, F. Zhang, X. Ji, M. Zhang, M. Jia, X. Chen, D. Wu, X. J. Li, Y. Zhang, Z. Shi and C. Shan, Adv. Sci., 2023, 10, 2207331 CrossRef.
- W. Chen, Z. Tian, Y. Li, Y. Jiang, M. Liu and P. Duan, Chem.–Eur. J., 2018, 24, 17444–17448 CrossRef PubMed.
- X. Fang, Y. Tang, Y.-J. Ma, G. Xiao, P. Li and D. Yan, Sci. China Mater., 2022, 66, 664–671 CrossRef.
- Z. Wang, X. Y. Zhang, J. T. Mo, C. Y. Su and M. Pan, Adv. Opt. Mater., 2023, 11, 2203144 CrossRef.
- C. Xing, B. Zhou, D. Yan and W.-H. Fang, CCS Chem., 2023, 5, 2866–2876 CrossRef.
- Y.-J. Ma, Z. Qi, G. Xiao, X. Fang and D. Yan, Inorg. Chem., 2022, 61, 16477–16483 CrossRef PubMed.
- T. Chen and D. Yan, Nat. Commun., 2024, 15, 5281 CrossRef PubMed.
- C. Si, T. Wang, A. K. Gupta, D. B. Cordes, A. M. Z. Slawin, J. S. Siegel and E. Zysman-Colman, Angew. Chem., Int. Ed., 2023, 62, e202309718 CrossRef PubMed.
- J. Du, A. Feng and D. Poelman, Laser Photonics Rev., 2020, 14, 2000060 Search PubMed.
- Y. Zhang, L. Chen, B. Liu, S. Yu, Y. Yang and X. Liu, Adv. Funct. Mater., 2024, 34, 2315366 CrossRef.
- W. Xie, W. Huang, J. Li, Z. He, G. Huang, B. S. Li and B. Z. Tang, Nat. Commun., 2023, 14, 8098 CrossRef PubMed.
- T. Kou, Q. Wei, T. Chang, H. Wang, W. Zheng, X. Jiang, Q. Zhao, Z. Zhou, D. Huang, Z. Chen, L. Wang, J. Tang and W. W. Yu, Laser Photonics Rev., 2024, 19, 2400953 CrossRef.
- Y. Liu, S. Yan, T. Wang, Q. He, X. Zhu, C. Wang, D. Liu, T. Wang, X. Xu and X. Yu, Angew. Chem., Int. Ed., 2023, 62, e202308420 CrossRef CAS PubMed.
- X. Zhang, H. Suo, Y. Guo, J. Chen, Y. Wang, X. Wei, W. Zheng, S. Li and F. Wang, Nat. Commun., 2024, 15, 6797 CrossRef CAS PubMed.
- Y. Liang, P. Hu, H. Zhang, Q. Yang, H. Wei, R. Chen, J. Yu, C. Liu, Y. Wang, S. Luo, G. Shi, Z. Chi and B. Xu, Angew. Chem., Int. Ed., 2024, 63, e202318516 CrossRef CAS.
- X. Zhu, T. Gu, L. Zhao, W. Gao, H. Liu, L. Nie, F. Zhao, Y. Yue, Q. He, X. An, P. Hao, A. N. Yakovlev, T. Hu, S. Yu, X. Xu, X. Yu and T. Wang, Small, 2023, 20, 2306299 CrossRef PubMed.
- J. Yang, X. Zhen, B. Wang, X. Gao, Z. Ren, J. Wang, Y. Xie, J. Li, Q. Peng, K. Pu and Z. Li, Nat. Commun., 2018, 9, 840 CrossRef.
- X. Yuan, S. Ji, M. C. De Siena, L. Fei, Z. Zhao, Y. Wang, H. Li, J. Zhao and D. R. Gamelin, Chem. Mater., 2017, 29, 8003–8011 CrossRef CAS.
- H. Hu, F. Meier, D. Zhao, Y. Abe, Y. Gao, B. Chen, T. Salim, E. E. M. Chia, X. Qiao, C. Deibel and Y. M. Lam, Adv. Mater., 2018, 30, 1707621 CrossRef.
- J. H. Wei, W. T. Ou, J. B. Luo and D. B. Kuang, Angew. Chem., Int. Ed., 2022, 61, e202207985 CrossRef CAS PubMed.
- S. Yang, D. Wu, W. Gong, Q. Huang, H. Zhen, Q. Ling and Z. Lin, Chem. Sci., 2018, 9, 8975–8981 RSC.
- W. Ma, D. Liang, Q. Qian, Q. Mo, S. Zhao, W. Cai, J. Chen and Z. Zang, eScience, 2023, 3, 100089 CrossRef.
- F. Lang, J. Pang and X.-H. Bu, eScience, 2024, 4, 100231 CrossRef.
- S. Feng, Y. Ma, S. Wang, S. Gao, Q. Huang, H. Zhen, D. Yan, Q. Ling and Z. Lin, Angew. Chem., Int. Ed., 2022, 61, e202116511 CrossRef CAS.
- B. Zhou, G. Xiao and D. Yan, Adv. Mater., 2021, 33, 2007571 CrossRef CAS.
- Z. Luo, Y. Liu, Y. Liu, C. Li, Y. Li, Q. Li, Y. Wei, L. Zhang, B. Xu, X. Chang and Z. Quan, Adv. Mater., 2022, 34, 2200607 CrossRef CAS PubMed.
- X. Chen, M. Li, L. Ge, S. Liu, W. Lv, Y. Yu, Y. Tang, C. Han, M. Li, Y. Tao, L. Xu and R. Chen, Inorg. Chem., 2023, 62, 16538–16546 CrossRef CAS PubMed.
- S. Wang, S. Feng, R. Li, J. Jin, J. Wu, W. Zheng, Z. Xia, X. Chen, Q. Ling and Z. Lin, Adv. Mater., 2023, 35, 2211992 CrossRef CAS PubMed.
- X. Yang, S. Wang, J. Wu, W. Hu, L. Huang, Q. Ling and Z. Lin, Adv. Opt. Mater., 2023, 12, 2301661 CrossRef.
- S. Wang, S. Feng, R. Li, J. Jin, J. Wu, W. Zheng, Z. Xia, X. Chen, Q. Ling and Z. Lin, Adv. Mater., 2023, 35, 2211992 CrossRef CAS.
- Y. Peng, J. Ma, Y. Zhao, D. You, Y. Yao, Z. Deng, J. Liao, Y. Chang, W. Shen, M. Li, R. He and L. Zhou, Adv. Funct. Mater., 2024, 2420311, DOI:10.1002/adfm.202420311.
- H. Sun, X. Yang, P. Li, Y. Bai, Q. Meng, H. Zhao, Q. Wang, Z. Wen, L. Huang, D. Huang, W. W. Yu, H. Chen and F. Liu, Nano Lett., 2024, 24, 10355–10361 CrossRef CAS.
- Z. Qi, Y. Chen, Y. Guo, X. Yang, F.-Q. Zhang, G. Zhou and X.-M. Zhang, J. Mater. Chem. C, 2021, 9, 88–94 RSC.
- S. Yan, W. Tian, H. Chen, K. Tang, T. Lin, G. Zhong, L. Qiu, X. Pan and W. Wang, Adv. Funct. Mater., 2021, 31, 2100855 CrossRef.
- T. Jiang, W. Ma, H. Zhang, Y. Tian, G. Lin, W. Xiao, X. Yu, J. Qiu, X. Xu, Y. Yang and D. Ju, Adv. Funct. Mater., 2021, 31, 2009973 CrossRef.
- G. Hu, B. Xu, A. Wang, Y. Guo, J. Wu, F. Muhammad, W. Meng, C. Wang, S. Sui, Y. Liu, Y. Li, Y. Zhang, Y. Zhou and Z. Deng, Adv. Funct. Mater., 2021, 31, 2011191 CrossRef.
- B. Zhou and D. Yan, Chem. Sci., 2022, 13, 7429–7436 RSC.
- Y. Zhang, J. Li, J. Zhao, X. Li, Z. Wang, Y. Huang, H. Zhang, Q. Liu, Y. Lei and D. Ding, Angew. Chem., Int. Ed., 2023, 63, e202313890 CrossRef PubMed.
- S. Liu, X. Fang, B. Lu and D. Yan, Nat. Commun., 2020, 11, 4649 Search PubMed.
- H. Ma, Q. Peng, Z. An, W. Huang and Z. Shuai, J. Am. Chem. Soc., 2018, 141, 1010–1015 CrossRef PubMed.
- G. Xiao, Y.-J. Ma, Z. Qi, X. Fang, T. Chen and D. Yan, Chem. Sci., 2024, 15, 3625–3632 RSC.
- G. Zhou, Y. Mao, J. Zhang, Q. Ren, M. S. Molokeev, Z. Xia and X. M. Zhang, Adv. Funct. Mater., 2025, 35, 2413524 Search PubMed.
- L. Kang, S. Wang, Q. Xu, J. Wu, Y. Wu, L. Huang, Q. Chen and Z. Lin, Inorg. Chem., 2024, 63, 7053–7062 Search PubMed.
- J. H. Marayathungal, D. K. Das, R. Bakthavatsalam, J. Sam, V. R. Hathwar, R. Pallepogu, S. Dutta and J. Kundu, J. Phys. Chem. C, 2023, 127, 8618–8630 Search PubMed.
- Z. Yu, H. Peng, Q. Wei, T. Huang, S. Yao, Y. Tian, C. Peng and B. Zou, Mater. Today Chem., 2022, 24, 100781 CrossRef.
- S. Li, J. Jiang, H. Zhang, H. Fu, J. Liu, Y. Song, S. Cao, W. Yang, J. Zheng and J. Zhao, Mater. Res. Bull., 2024, 170, 112568 Search PubMed.
- N. Rajamanickam, T. H. Chowdhury, S. Isogami and A. Islam, J. Phys. Chem. C, 2021, 125, 20104–20112 CrossRef.
- P. Arunkumar, H. B. Cho, K. H. Gil, S. Unithrattil, Y. H. Kim and W. Bin Im, Nat. Commun., 2018, 9, 4691 CrossRef PubMed.
- D. Liang, S. M. H. Qaid, X. Yang, S. Zhao, B. Luo, W. Cai, Q. Qian and Z. Zang, Opto-Electron. Adv., 2024, 7, 230197 Search PubMed.
- Y. Huang, Y. Pan, S. Guo, C. Peng, H. Lian and J. Lin, Inorg. Chem., 2022, 61, 8356–8365 CrossRef CAS PubMed.
- B. Li, H. Li, X. Gao, M. G. Humphrey, C. Zhang and Z. Huang, Mater. Today Phys., 2023, 38, 101219 CrossRef CAS.
- J. O. M. Bockris and T. Otagawa, J. Electrochem. Soc., 1994, 131, 290 CrossRef.
- C. Barthou, J. Benoit and P. Benalloul, J. Electrochem. Soc., 1994, 141, 524 CrossRef CAS.
- J. Sanchez-Quesada, M. R. Ghadiri, H. Bayley and O. Braha, J. Am. Chem. Soc., 2000, 122, 7408 Search PubMed.
Footnote |
| † Electronic supplementary information (ESI) available: Details of methods and additional figures and tables. CCDC 2410479. For ESI and crystallographic data in CIF or other electronic format see DOI: https://doi.org/10.1039/d4sc08718f |
| This journal is © The Royal Society of Chemistry 2025 |