
 Open Access Article
 This Open Access Article is licensed under a
 Creative Commons Attribution 3.0 Unported Licence
Deciphering the mechanism of hydrogen peroxide formation in ultrasound-mediated water-in-oil microdroplets†
Xiaohu
Zhou‡
 *,
Shutong
Du‡
,
Wenjuan
Zhang
and
Bo
Zheng
*
*,
Shutong
Du‡
,
Wenjuan
Zhang
and
Bo
Zheng
*
Institute of Chemical Biology, Shenzhen Bay Laboratory, Shenzhen, 518132, China. E-mail: zhouxh@szbl.ac.cn; bozheng@szbl.ac.cn
First published on 6th March 2025
Abstract
Microdroplet chemistry has emerged as a fascinating field, demonstrating remarkable reaction acceleration and enabling thermodynamically unfavorable processes. The spontaneous generation of hydrogen peroxide (H2O2) in water microdroplets presents a particularly intriguing phenomenon with significant implications for green chemistry and prebiotic processes. However, the transient nature of conventional microdroplets has hindered in-depth mechanistic investigations. This study employs ultrasound-mediated water-in-oil microdroplets to elucidate the underlying mechanism of H2O2 generation. Under ultrasound irradiation, the H2O2 concentration increases linearly with a production rate of 0.24 mM min−1, reaching 14.37 mM after one hour. Notably, 99% of this production occurs at the water–oil interface, corresponding to approximately 0.10 mM m−2 min−1. Quantification of key intermediates reveals that superoxide radical (·O2−) concentrations are approximately tenfold higher than those of H2O2 and thousandfold higher than those of hydroxyl radicals (·OH). Through radical scavenging and isotope labeling experiments, we identify dissolved oxygen as the primary source and ·O2− as the main intermediate in H2O2 formation, following the pathway: O2 → ·O2− → H2O2. We validate the critical role of the water–oil interface in initiating H2O2 production via charge separation reactions and demonstrate the significance of proton availability and surface propensity in facilitating efficient H2O2 generation. These findings not only advance our understanding of microdroplet interfacial chemistry but also offer potential applications in atmospheric chemistry, green disinfection, and origins of life research.
Introduction
Microdroplet chemistry has garnered considerable attention due to its extraordinary ability to accelerate chemical reactions by two to six orders of magnitude and to drive reactions that typically require catalysts in the bulk phase.1–9 These reactions encompass not only simple oxidation/reduction processes10–12 but also pivotal synthetic transformations, including C–C, C–N, and C–O bond formation,13–16 as well as reactions involving biomolecules and abiotic synthesis.17–20 Microdroplet chemistry holds immense potential in fields such as green chemistry, environmental science, prebiotic chemistry, and astrobiology. Despite the consensus that the aqueous interface of microdroplets plays a crucial role in reaction rate acceleration, the detailed mechanisms remain elusive.1,5 Unlike bulk solvation, the theoretical understanding of interfacial solvation is still in its infancy.5 Given the ubiquity of water, comprising 71% of the Earth's surface and more than half of every living cell, elucidating the mechanisms of microdroplet chemistry is both fundamentally important and practically relevant.21One of the most debated phenomena in microdroplet chemistry is the spontaneous formation of hydrogen peroxide (H2O2) in pure water microdroplets smaller than 10 μm.22–28 Zare and colleagues first reported that sprayed water microdroplets could spontaneously generate H2O2,22 a finding later extended to condensed water microdroplets.23 The yield of H2O2 is influenced by factors, such as microdroplet size, with smaller droplets achieving higher concentrations,22–24,26 and environmental conditions, including the relative humidity29 and substrate temperature.30 These findings have sparked interest in microdroplet interfaces as potential platforms for catalyst-free H2O2 production.
Despite significant progress, the exact mechanism underlying H2O2 formation in microdroplets remains not fully understood.31–34 Based on their findings, Zare and colleagues proposed that the primary mechanism involves a strong electric field at the air–water interface31 that facilitates charge separation, converting hydroxide ions (OH−) into hydroxyl radicals (·OH), which then recombine to form H2O2.22–25,32 Additionally, apart from the ·OH radical recombination, George and co-workers proposed a second reaction pathway to form H2O2 in the presence of oxygen.26,27 In this pathway, dissolved oxygen reacts with the solvated electrons, forming superoxide radicals (·O2−), which subsequently react with hydrogen ions (H+) to form hydroperoxyl radicals  that self-recombine to form H2O2. Recent theoretical studies have supported this mechanism by revealing that an increased amount of hydroxide dissociates at interfaces due to reduced solvation.35,36 Moreover, the detected presence of ·OH radicals in microdroplets lends further credence to this hypothesis.24,26,37 In addition, Colussi proposed an alternative mechanism that involves collisions between oppositely charged microdroplets to produce H2O2.33
In contrast, Mishra and colleagues during rigorous studies have contested the concept of spontaneous H2O2 formation at the air–water interface,38 arguing that the observed H2O2 could arise from experimental artifacts such as ambient ozone contamination39 or water–solid interface effects.40 These contradictions are reinforced by Williams and co-workers' recent observation that hydroxyl radicals are not spontaneously generated in inactivated water droplets,41 paired with theoretical evidence showing that the electric fields at the air–water interface are insufficient to induce spontaneous electron transfer.42,43 Together, these findings challenge the hypothesis of spontaneous H2O2 generation at the air–water interface. These findings underscore the necessity for stringent experimental controls and reveal the intricate nature of interfacial chemistry in microdroplets.
However, the transient nature of microdroplets, which exist for mere milliseconds in the case of sprayed microdroplets or several minutes for condensed microdroplets,22,23 and the relatively low yield of H2O2 (<30 μM)44 pose significant challenges to further in-depth investigation into the underlying mechanisms. Elucidating the primary source of H2O2 formation and gaining a quantitative understanding of the interplay between various reactive oxygen species (H2O2, ·OH, and ·O2−) during this process are crucial for advancing our knowledge in this burgeoning field.
Recently, Lee et al. introduced an innovative approach using ultrasound-mediated water microdroplets with extended lifetimes, ranging from milliseconds to hours, by employing an oil–water interface instead of an air–water interface to create the microdroplets.45 The study demonstrated that the oil-confined aqueous microdroplets continuously generated hydroxyl radicals near the interface, resulting in H2O2 formation at mM concentrations, enabling the synthesis of polymers at high reactant concentrations ranging from mM to M. However, this work primarily focused on applying this setup for radical polymerization in polymer synthesis, without delving into the underlying mechanism of H2O2 formation.
In this study, we aimed to elucidate the underlying mechanism of H2O2 generation using ultrasound-mediated water-in-oil microdroplets. It should be emphasized that our work focuses strictly on the ultrasound-mediated process rather than on spontaneous H2O2 formation in the absence of external stimuli. We demonstrated that under ultrasound irradiation, the H2O2 concentration increases linearly with time, with a production rate of approximately 0.24 mM min−1, reaching up to 14.37 mM after 1 hour of irradiation. Notably, 99% of this production occurs at the water–oil interface, corresponding to a surface-area-normalized production rate of approximately 0.10 mM m−2 min−1, attributed to the combined effects of the water–oil interface, ultrasonic cavitation, and the enhanced solubility and mass transfer rate of O2 in oil. We identified and quantified key intermediate radicals during H2O2 production, finding that concentrations of superoxide radicals (·O2−) and hydroxyl radicals (·OH) also increased linearly with irradiation time, similar to H2O2. Notably, the yield of superoxide radicals was nearly 10 times higher than that of H2O2 and approximately 1000 times higher than that of hydroxyl radicals. Subsequently, we confirmed that the dissolved oxygen is the primary source, and the ·O2− serves as the primary intermediate for H2O2 formation through the radical scavenging and isotope labeling experiments, identifying the reaction pathway: O2 → ·O2− → H2O2. Additionally, we validated the essential role of the water–oil interface in initiating H2O2 production through the charge separation reactions. Lastly, we validated the crucial roles of proton availability and surface propensity in facilitating efficient H2O2 generation by examining the effects of pH and ionic environments on the aqueous phases. Although this study focuses on ultrasound-mediated H2O2 formation, which operates under different conditions compared to spontaneous H2O2 generation in microdroplets, we hope the findings of this study can provide valuable insights for spontaneous H2O2 generation in microdroplets. This study not only sheds light on the unique physicochemical properties of microdroplets but also has potential implications for atmospheric chemistry, green disinfection, and understanding the origins of life on Earth.
Results and discussion
Generation of H2O2 in ultrasound-mediated water-in-oil microdroplets
We first investigated the generation of H2O2 in ultrasound-mediated water-in-oil microdroplets. The experimental setup and the proposed reaction pathway are illustrated in Fig. 1a. In our experiment, 200 μL deionized (DI) water was emulsified into microdroplets within 2 mL hexadecane oil using an ultrasonic bath (40 kHz, 200 W). The resulting water microdroplets had an average diameter of 0.5 μm (Fig. 1b). | ||
Fig. 1 Generation of H2O2 in ultrasound-mediated water-in-oil microdroplets. (a) Schematic representation of the experimental setup and overall reaction process. (b) Diameter distribution of microdroplets formed by ultrasonic emulsification of a 1![[thin space (1/6-em)]](https://www.rsc.org/images/entities/char_2009.gif) :10 (v/v) water-to-hexadecane mixture. The inset displays water microdroplets after 5 minutes of ultrasound irradiation. (c) H2O2 concentration in microdroplets as a function of ultrasound irradiation time. (d) H2O2 concentration in microdroplets following partial removal of dissolved O2 by N2 purging, as a function of ultrasound irradiation time. (e) H2O2 concentration in 2.2 mL DI water as a function of ultrasound irradiation time. :10 (v/v) water-to-hexadecane mixture. The inset displays water microdroplets after 5 minutes of ultrasound irradiation. (c) H2O2 concentration in microdroplets as a function of ultrasound irradiation time. (d) H2O2 concentration in microdroplets following partial removal of dissolved O2 by N2 purging, as a function of ultrasound irradiation time. (e) H2O2 concentration in 2.2 mL DI water as a function of ultrasound irradiation time. | ||
The concentration of H2O2 was quantified via UV-vis spectroscopy of the aqueous phase collected by centrifugation after ultrasound irradiation (Fig. S1†).45,46 As shown in Fig. 1c, the concentration of H2O2 increased linearly with ultrasound irradiation time, with a production rate of approximately 0.24 mM min−1, reaching up to 14.37 mM after 1 hour of irradiation. This finding is consistent with previous reports of H2O2 production in ultrasound-mediated microdroplets45 and significantly exceeds the yields observed in sprayed or condensed microdroplets.22–24 The enhanced yield under these conditions could be attributed to the longer reaction time and the effects of ultrasonic cavitation.
We further evaluated the production of H2O2 in water-in-hexadecane microdroplets after removing dissolved O2 by purging with N2 for 15 minutes and replacing the vial lid with a N2 balloon during ultrasound exposure. It should be noted that this method only partially removed dissolved O2 from the liquid phases.47 Even with the reduced concentration of dissolved O2, the H2O2 concentration continued to increase linearly with irradiation time, achieving a production rate of 0.057 mM min−1 and a yield of 3.34 mM after 1 hour, approximately 23% of the yield obtained without O2 removal (Fig. 1d). These findings indicate that dissolved O2 may be a major contributor to H2O2 production.
In contrast with the previous results,45 we found that bulk water subjected to the same ultrasound irradiation conditions also generated detectable levels of H2O2.48 Note that due to the experimental setup and ultrasonic bath power, H2O2 yield is volume-dependent (Fig. S2†). To ensure comparability across results, all samples were maintained at a constant total volume of 2.2 mL. The concentration of H2O2 in bulk water increased linearly with ultrasound exposure, at a production rate of about 0.0024 mM min−1, resulting in 0.14 mM H2O2 after 1 hour—only 1% of the yield obtained in microdroplets (Fig. 1e). This suggests that ultrasonic cavitation may contribute to H2O2 formation in bulk water.23,38
To elucidate the contribution of the oil phase to the high yield of H2O2 production in ultrasound-mediated water microdroplets, we compared the yields of H2O2 production in two-phase systems with varying ratios of DI water and hexadecane (Fig. S3†). Strikingly, the yield of H2O2 increased proportionally with the oil-to-water ratio, likely attributable to the enhanced solubility and accelerated mass transfer rate of O2 in hexadecane,49,50 since the dissolved O2 may be a major contributor to H2O2 production (Fig. 1c and d). However, given the substantial reduction in H2O2 yield upon interfacial blocking with surfactants (Fig. 2f), coupled with the negligible solubility of H2O2 in hexadecane,51 and since single-phase bulk water produced only 1% of the H2O2 yield obtained in microdroplets, we may infer that the remaining 99% of H2O2 formed at the water–oil interface. Utilizing the average microdroplet dimensions (Fig. 1b), we estimated the cumulative water–oil interfacial area to be approximately 2.40 m2, resulting in a surface-area-normalized H2O2 production rate of approximately 0.10 mM m−2 min−1. This rate is five orders of magnitude higher than the previously reported value of 7.7 nM m−2 min−1 for static microdroplets in oil.28 This substantial increase in the production rate is likely due to the combined effects of dynamic interfacial renewal, ultrasonic cavitation and accelerated mass transfer rates under irradiation.
 | ||
| Fig. 2 Characterization and quantification of reactive oxygen species in ultrasound-mediated water-in-oil microdroplets. (a and b) EPR spectra of (a) BMPO-·O2−, (b) DMPO-·OH after 5 minutes of ultrasound irradiation. (c) Quantification of H2O2 in water microdroplets under ultrasound irradiation for 60 seconds in an air atmosphere. (d) Quantification of ·O2− with NBT and ·OH using TA in water microdroplets under ultrasound irradiation within 60 seconds in an air atmosphere. (e) H2O2 evolution in the presence of various radical scavengers at different concentrations. (f) Comparison of H2O2 yields in water-in-oil microdroplets with or without a surfactant and in bulk water after 60 seconds of ultrasound irradiation. | ||
Previous studies suggested that hydroxyl radicals (·OH) generated from hydroxide anions at the water–oil interface are the primary source of H2O2, with sufficient radical concentration initiating free radical polymerization.45 The studies imply that water could be the main source of H2O2 formation, following the reaction pathway: H2O → ·OH → H2O2. However, when we attempted to induce microdroplet-mediated radical polymerization using the acrylamide monomer, the subsequent 1H NMR analysis showed no detectable polymerization after 1 hour of ultrasound irradiation (Fig. S4†). Our observation suggests that the hydroxyl radicals produced during H2O2 formation are insufficient to initiate radical polymerization under these conditions.
Identification and quantification of key intermediates in H2O2 formation
To elucidate the mechanism of H2O2 production in the water–oil sonication system, we systematically investigated the intermediates involved in this process. Electron paramagnetic resonance (EPR) spectroscopy was employed to identify the intermediate products and elucidate the reaction pathway of H2O2 production. For this purpose, 200 μL 100 mM BMPO and 200 μL 100 mM DMPO were employed as the aqueous phase to detect superoxide radicals (·O2−) and hydroxyl radicals (·OH), respectively.46,52As shown in Fig. 2a and b, after 5 minutes of ultrasound irradiation, the BMPO test exhibited characteristic sextuplet peaks indicative of BMPO-·O2− (Fig. 2a), which arises from the reduction of O2. Similarly, the DMPO test displayed characteristic quadruplet peaks for DMPO-·OH (Fig. 2b), suggesting that ·OH was generated during the H2O2 production, likely due to the influence of the strong electric fields at the water–oil interface22–24,26,31 and/or the ultrasonic cavitation.53,54 These results confirmed the presence of both superoxide radicals (·O2−) and hydroxyl radicals (·OH) during ultrasound irradiation, indicating that both the dissolved oxygen and water might serve as the main source for H2O2 production.
To further investigate the formation mechanism, we quantitatively monitored the intermediate products (·O2− and ·OH) during H2O2 production under ultrasound irradiation. Nitroblue tetrazolium (NBT, 2,2′-di-p-nitrophenyl-5,5′-diphenyl-(3,3′-dimethoxy)-4,4′-bisphenyleneditetrazolium chloride) was used as the color indicator for the detection and quantification of ·O2−, while terephthalic acid (TA) was employed to quantify the ·OH.52
Upon reduction by ·O2−, NBT transitions from yellow to blue formazan (Fig. S5†), and the non-fluorescent TA reacts with ·OH to produce fluorescent hydroxyterephthalic acid (hTA) (Fig. S6†). Given the low solubility of NBT and its product, as well as the high yield of H2O2, our focus was primarily on intermediate products and reaction pathways within the first 60 seconds of ultrasound irradiation (Fig. 2c and d).
We first examined H2O2 production in water-in-hexadecane microdroplets within 60 seconds of ultrasound irradiation (Fig. 2c). The H2O2 concentration increased with irradiation time, reaching 204.10 μM H2O2 after 60 seconds of irradiation. During short irradiation times, the H2O2 production rate did not exhibit a strong linear fit. However, accounting for the ultrasonic bath's response time and detection limits, excluding the 10-second data point reveals a strong linear correlation between the H2O2 production rate and irradiation time from 20 to 60 seconds (Fig. 2c). The calculated production rate was approximately 3.40 μM s−1 or 0.20 mM min−1, which aligns with the previously observed rate of 0.24 mM min−1 under 1 hour of irradiation (Fig. 1c). The result confirms a consistent linear relationship between the H2O2 yield and ultrasound irradiation time across different time scales, suggesting that the underlying reaction mechanism remains constant.
Using the stoichiometric relationship that 1 mole of NBT consumes 2 moles of ·O2− (or electrons) to form monoformazan, we determined that the concentration of ·O2− increased linearly with the ultrasound irradiation time with the production rate of 0.033 mM s−1, which reached 1.98 mM after 60 seconds (Fig. 2d). This was approximately 10 times greater than the yield of H2O2.
Interestingly, the concentration of ·OH also increased linearly with the ultrasound irradiation time, albeit at a much slower production rate of 0.038 μM s−1, yielding only 2.29 μM after 60 seconds (Fig. 2d). This was about 100 times lower than the H2O2 yield and roughly 1000 times lower than the ·O2− concentration, suggesting that ·O2− is likely the primary radical intermediate in H2O2 production.
Furthermore, considering the high reactivity and short lifetimes of ·O2− and ·OH, not all radicals were converted to H2O2, implying that intermediate radicals existed at higher concentrations than the H2O2 product. These observations reinforce the notion that the oxygen reduction pathway is the main contributor to H2O2 formation, following the reaction pathway: O2 → ·O2− → H2O2.
We extended our investigation to ultrasound irradiation under reduced dissolved O2 conditions (Fig. S7†). By N2 purging for 15 minutes to remove part of the dissolved O2, the H2O2 production in 60 seconds ultrasound-mediated water-in-oil microdroplets significantly decreased to 33.76 μM, only about 16% of the H2O2 produced under an air atmosphere (Fig. S7a†). The percentage decrease of the yield was consistent with the results from prolonged irradiation (Fig. 1c and d). Notably, under anaerobic conditions, NBT acted as a direct electron acceptor, forming monoformazan at slightly higher yields with the stoichiometric parameter that 1 mole of NBT consumes 2 moles of electrons (Fig. S7b†).55 Interestingly, after partially removing the dissolved O2 by N2 purging, the amount of ·OH was also markedly reduced under ultrasound irradiation in the N2 environment (Fig. S7c†). After 60 seconds of ultrasound irradiation, only approximately 0.30 μM ·OH was produced in a N2 atmosphere, about 13% of that observed in air. The decrease in ·OH concentration mirrored the reduction in the H2O2 yield under a N2 environment, suggesting a positive relationship between ·OH levels and the H2O2 yield, even though their absolute quantities were not comparable.
Radical scavenging experiments: elucidating the reaction pathway
Next, to further elucidate the mechanism of H2O2 production, we performed radical scavenging experiments using p-benzoquinone (p-BQ) and tert-butanol (t-BuOH) as quenchers for ·O2− and ·OH, respectively.52,56 Initially, introducing 1 mM p-BQ into the aqueous phase resulted in a marked reduction in H2O2 yield (Fig. 2f). After a brief ultrasound exposure of 10 seconds, H2O2 was entirely undetectable. Following 60 seconds of ultrasound irradiation, the H2O2 yield was approximately 71% of the control group. Given the high initial presence of ·O2− (Fig. 2d), we increased the p-BQ concentration to 10 mM, which led to an 85% decrease in H2O2 yield after 60 seconds of ultrasound exposure (Fig. 2e). These results strongly indicate that ·O2− serves as the primary intermediate for H2O2 formation, following the reaction pathway: O2 → ·O2− → H2O2.In contrast, the introduction of 1 mM t-BuOH as a ·OH quencher significantly enhanced the yield of H2O2 (Fig. 2e). After 60 seconds of ultrasound irradiation, the H2O2 yield increased to approximately 170% of the control group. This unexpected outcome suggests that quenching the ·OH radicals promotes H2O2 production, implying that ·OH is not a direct intermediate in the formation of H2O2. Furthermore, increasing the t-BuOH concentration to 10 mM did not further augment the H2O2 yield, indicating a saturation effect (Fig. 2e).
To further investigate the effects of the water–oil interface, we introduced the nonionic surfactant Span 80 (1% w/v) into the aqueous phase, which accumulates at the water–oil interface and likely suppresses interfacial reactions by blocking reactive sites. After 60 s of ultrasound irradiation, the presence of the surfactant led to a drastic reduction in the H2O2 yield, reaching only 15.50 μM, approximately 7% of the H2O2 yield without the surfactant (Fig. 2f). This substantial decrease confirms the critical role of interfacial effects in H2O2 production. Notably, the H2O2 yield with the surfactant remained higher than the yield from bulk water (1.33 μM), possibly due to incomplete interface blockage.
Considering the confirmed presence of ·O2− and ·OH radicals (Fig. 2c), the substantial decrease in the H2O2 yield upon partial removal of dissolved oxygen (Fig. 1c and d), and the marked reduction in the H2O2 yield upon quenching of ·O2− radicals (Fig. 2e) or blocking the interface with a surfactant (Fig. 2f), we propose the following reaction pathway: under the influence of ultrasonic cavitation and a strong electric field at the water–oil interface, hydroxyl radicals (·OH) and solvated electrons (e−) are generated through charge separation of hydroxide ions (OH−). Dissolved oxygen (O2) subsequently accepts these solvated electrons, forming superoxide radicals (·O2−). These radicals then react with hydrogen ions (H+), generating hydroperoxyl radicals  , which subsequently undergo a self-reaction to form H2O2 (Fig. 1a). This pathway elucidates why ·O2− serves as the primary intermediate in H2O2 production.
The addition of t-BuOH, a hydroxyl radical scavenger, shifts the charge separation reaction rightward, leading to increased production of solvated electrons and consequently enhanced the yield of H2O2. Furthermore, the formation rates of hydroxyl radicals and solvated electrons, constrained by the availability of water–oil interfaces, explain why further increases in t-BuOH concentration do not result in additional H2O2 yield.
To further corroborate the influence of the charge separation reaction, we introduced electron scavengers into the system: 10 mM AgNO3 in the aqueous phase and 10 mM CCl4 in the oil phase.46,52,56 In both cases, the yield of H2O2 significantly increased (Fig. S8a†). Additionally, the introduction of CCl4 as an electron scavenger markedly increased the yield of ·OH radicals (Fig. S8b†), providing direct evidence for the rightward shift of the charge separation reaction. These observations collectively reinforce our proposed mechanism and highlight the critical role of interface dynamics in the H2O2 production pathway.
Isotopic labeling techniques for tracing the H2O2 formation pathway
To further validate the reaction pathway leading to H2O2 production, we employed oxygen isotope labeling experiments to trace the origin of the oxygen atoms in H2O2 using mass spectrometry (MS) analysis.57 We used 4-carboxyphenylboronic acid as a probe, which reacts with the generated H2O2 to form 4-hydroxybenzoic acid. If the produced H2O2 contained the oxygen isotope, the resulting 4-hydroxybenzoic acid would exhibit corresponding isotope signals in the mass spectra (Fig. 3a). | ||
| Fig. 3 Isotope labeling experiment for elucidating the H2O2 formation mechanism. (a) Reaction scheme of H2O2-promoted/H218O2-promoted deborylation of 4-carboxyphenylboronic acid. (b) Mass spectrometric analysis of the resulting 4-hydroxybenzoic acid. | ||
We conducted three sets of experiments to compare the formation of 4-hydroxybenzoic acid: (1) the control experiment with O2/H2O, (2) a water replacement experiment using O2/H218O, and (3) an oxygen replacement experiment using 18O2/H2O. The relative intensity of the mass spectrometric peak at 139.02 m/z in the O2/H218O setup remained as low as that observed in the O2/H2O setup. In contrast, the intensity at 139.02 m/z increased significantly from 1% to 70% in the 18O2/H2O experiment, indicating that the oxygen atoms in the H2O2 predominantly originated from the dissolved O2 (Fig. 3b). It should be noted that despite purging for 15 minutes, we could not completely replace all dissolved O2 with 18O2. These findings further confirm that dissolved O2 serves as the primary source of H2O2 in the reaction pathway.
While the charge separation reaction at the water–oil interface is central to H2O2 formation (Fig. 2b, e, f, and S6†), our findings raised questions about the minimal recombination of hydroxyl radicals (·OH) into H2O2 (Fig. 2f and 3b) and the substantially lower levels of ·OH detection compared to H2O2 and superoxide radicals (·O2−) (Fig. 2d). Considering the interfacial nature of the charge separation and the prevalence of water and hexadecane in the system, we hypothesized that the highly reactive and short-lived ·OH radicals primarily reacted with hexadecane, resulting in the formation of various organic compounds. This hypothesis was supported by our MS analysis (Fig. S9†).
Influence of pH and ionic environment on H2O2 production dynamics
Building on the previous experiments, which identified oxygen oxidation as the primary pathway for H2O2 production in ultrasound-mediated water-in-oil microdroplets, we hypothesized that lower pH conditions, with an increased concentration of H+ ions, would enhance H2O2 formation. To test this hypothesis, we prepared solutions with pH values ranging from 0 to 14 using the HCl and NaOH solutions and subjected them to ultrasound-mediated reactions. The results demonstrated a positive correlation between the H2O2 yield and proton concentration ([H+]) in the pH range from 0 to 12 (Fig. 4a).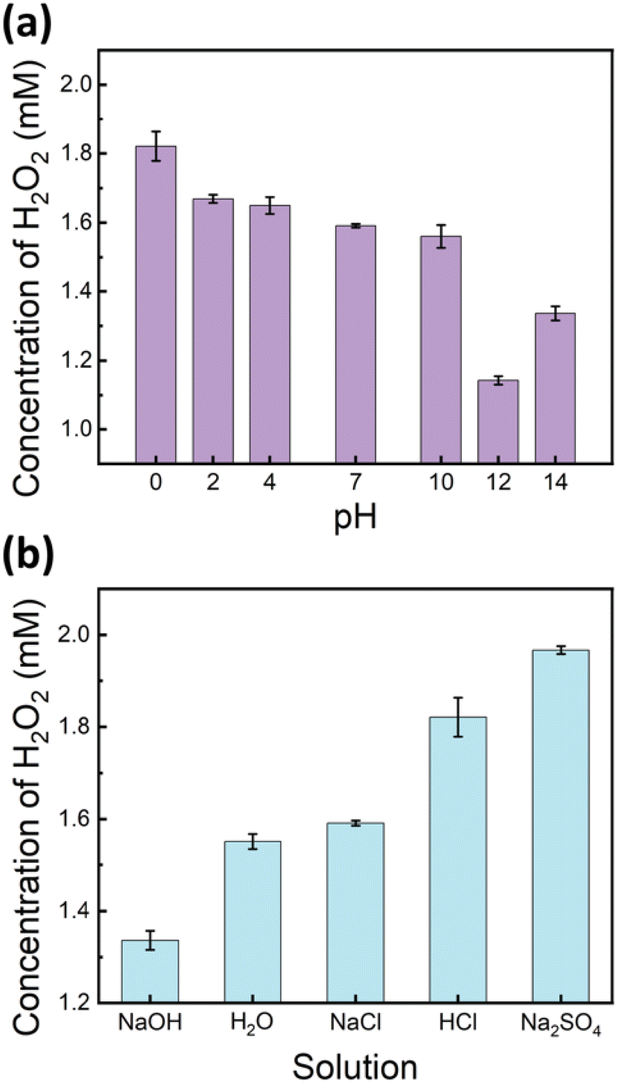 | ||
| Fig. 4 Comparison of H2O2 yields after 5 minutes of ultrasound irradiation: (a) at different pH levels and (b) in various 1 M salt solutions. | ||
Intriguingly, an unexpected increase in H2O2 yield was observed at pH 14. This phenomenon may be attributed to altered interfacial dynamics, specifically the adsorption of excess hydroxide ions (OH−) at the interface,58 which potentially promotes charge separation reactions and consequently enhances H2O2 production (Fig. 4a). It is noteworthy that the surface tension of water remains relatively constant between pH 1 and 13.59 This physicochemical property supports our observation of a consistent positive correlation between the H2O2 yield and proton concentration ([H+]) within this pH range, highlighting the mechanistic relationship between acidity and peroxide formation.
In addition to pH, we investigated the influence of various salts on H2O2 production. As shown in Fig. 4b, the addition of 1 M NaCl, at a neutral pH, did not significantly affect the H2O2 yield compared to that of DI water. However, the presence of Na2SO4, also at neutral pH, significantly enhanced H2O2 yields, even surpassing those observed in a 1 M HCl solution. The results suggest that beyond the direct effect of proton concentration, SO42− anions with their relatively higher proton transfer efficiency and lower surface propensity60 promote charge-separation reactions and hydroperoxyl radical formation, thereby enhancing H2O2 production. These observations reinforce the critical role of both proton availability and surface propensity in facilitating efficient H2O2 generation in ultrasound-mediated water microdroplets.
Conclusions
In this study, we investigated the underlying mechanism of H2O2 generation in ultrasound-mediated water-in-oil microdroplets. Our investigations revealed a linear increase in H2O2 concentration under ultrasound irradiation, achieving a remarkable production rate of 0.24 mM min−1. After one hour of irradiation, the H2O2 concentration reached an impressive value of 14.37 mM. Notably, 99% of this yield occurred at the water–oil interface, corresponding to a surface-area-normalized production rate of approximately 0.10 mM m−2 min−1, arising from synergistic effects, including interfacial dynamics, ultrasonic cavitation, and the enhanced solubility and mass transfer rate of O2 in oil.Through comprehensive radical scavenging and isotope labeling experiments, we identified superoxide radicals (·O2−) as the principal intermediates in the H2O2 formation pathway, establishing that dissolved oxygen serves as the primary source. This confirmed the reaction sequence O2 → ·O2− → H2O2. Our quantitative analysis further demonstrated that the yield of superoxide radicals was approximately 10 times greater than that of H2O2, underscoring their pivotal role in the reaction mechanism. Additionally, charge separation reactions at the water–oil interface were found to be integral to H2O2 formation, highlighting the crucial influence of interfacial dynamics on reaction kinetics in microdroplet systems. Moreover, our investigation into the effects of pH and ionic environments revealed that proton availability and surface propensity significantly affect H2O2 production, emphasizing the impact of pH and ionic composition on interfacial chemistry.
This study advances the understanding of microdroplet chemistry by providing detailed insights into the generation of H2O2 and the essential role of interfacial effects. Although this study focuses on ultrasound-mediated H2O2 formation, which operates under different conditions compared to spontaneous H2O2 generation in microdroplets, we hope the findings of this study could provide valuable insights for the spontaneous H2O2 generation in microdroplets. These findings have broader implications for atmospheric chemistry, green disinfection strategies, and prebiotic chemistry, offering avenues for optimizing H2O2 production and deepening our comprehension of chemical processes at aqueous interfaces.
Data availability
The data that are discussed in this article are available in the supplementary information of the corresponding articles referenced. Additional details on materials, methods, and experimental results, including calibration curves (Fig. S1, S5 and S6†), H2O2 yield dependence on the sample volume (Fig. S2†) and water-to-hexadecane ratio (Fig. S3†), 1H NMR spectra (Fig. S4†), quantification of H2O2, monoformazan and ·OH in a N2 environment (Fig. S7†), evolution of H2O2 and ·OH in the presence of electron scavengers (Fig. S8†), and mass spectra (Fig. S9†) are available in the ESI.†Author contributions
X. Z. and B. Z. conceived the project. S. D. conducted the experiments. W. Z. helped develop the methodology. X. Z. and S. D. conducted data analysis. X. Z. drafted the original manuscript. X. Z. and B. Z. reviewed and edited the manuscript. B. Z. provided financial support and supervised the work. X. Z. and S. D. contributed equally to this work.Conflicts of interest
The authors declare no competing financial interest.Acknowledgements
This research was supported by the Shenzhen Bay Laboratory Startup Fund (21280031 to B. Z.). Technical support from the Biomedical Research Core Facilities, especially NMR Core and Multi-omics Mass Spectrometry Core, is gratefully acknowledged.References
- Z. Wei, Y. Li, R. G. Cooks and X. Yan, Annu. Rev. Phys. Chem., 2020, 71, 31–51 CrossRef CAS PubMed.
- L. Qiu and R. G. Cooks, Angew. Chem., Int. Ed., 2024, 63, e202400118 CrossRef CAS PubMed.
- J. K. Lee, S. Banerjee, H. G. Nam and R. N. Zare, Q. Rev. Biophys., 2015, 48, 437–444 CrossRef CAS PubMed.
- X. Yan, R. M. Bain and R. G. Cooks, Angew. Chem., Int. Ed., 2016, 55, 12960–12972 CrossRef CAS PubMed.
- M. F. Ruiz-Lopez, J. S. Francisco, M. T. C. Martins-Costa and J. M. Anglada, Nat. Rev. Chem., 2020, 4, 459–475 CrossRef CAS PubMed.
- J. K. Lee, S. Kim, H. G. Nam and R. N. Zare, Proc. Natl. Acad. Sci. U. S. A., 2015, 112, 3898–3903 CrossRef CAS PubMed.
- A. Fallah-Araghi, K. Meguellati, J.-C. Baret, A. E. Harrak, T. Mangeat, M. Karplus, S. Ladame, C. M. Marques and A. D. Griffiths, Phys. Rev. Lett., 2014, 112, 028301 CrossRef PubMed.
- D. Guo, D. Zhu, X. Zhou and B. Zheng, Langmuir, 2015, 31, 13759–13763 CrossRef CAS PubMed.
- S. Narayan, J. Muldoon, M. G. Finn, V. V. Fokin, H. C. Kolb and K. B. Sharpless, Angew. Chem., Int. Ed., 2005, 44, 3275–3279 CrossRef CAS PubMed.
- L. Qiu and R. G. Cooks, Angew. Chem., Int. Ed., 2022, 61, e202210765 CrossRef CAS PubMed.
- J. K. Lee, D. Samanta, H. G. Nam and R. N. Zare, J. Am. Chem. Soc., 2019, 141, 10585–10589 CrossRef CAS PubMed.
- J. K. Lee, D. Samanta, H. G. Nam and R. N. Zare, Nat. Commun., 2018, 9, 1562 CrossRef PubMed.
- Y. Meng, E. Gnanamani and R. N. Zare, J. Am. Chem. Soc., 2022, 144, 19709–19713 CrossRef CAS PubMed.
- J. Dong, J. Chen, W. Wang, Z. Wei, Z.-Q. Tian and F. R. Fan, J. Am. Chem. Soc., 2024, 146, 2227–2236 CrossRef CAS PubMed.
- D. Zhang, X. Yuan, C. Gong and X. Zhang, J. Am. Chem. Soc., 2022, 144, 16184–16190 CrossRef CAS PubMed.
- S. Banerjee and R. N. Zare, Angew. Chem., Int. Ed., 2015, 54, 14795–14799 CrossRef CAS PubMed.
- D. T. Holden, N. M. Morato and R. G. Cooks, Proc. Natl. Acad. Sci. U. S. A., 2022, 119, e2212642119 CrossRef CAS PubMed.
- I. Nam, J. K. Lee, H. G. Nam and R. N. Zare, Proc. Natl. Acad. Sci. U. S. A., 2017, 114, 12396–12400 CrossRef CAS PubMed.
- X. Zhong, H. Chen and R. N. Zare, Nat. Commun., 2020, 11, 1049 CrossRef CAS PubMed.
- Y. Li, J. Ding and W. Qin, J. Am. Chem. Soc., 2024, 146, 24389–24397 CrossRef CAS PubMed.
- O. Björneholm, M. H. Hansen, A. Hodgson, L.-M. Liu, D. T. Limmer, A. Michaelides, P. Pedevilla, J. Rossmeisl, H. Shen, G. Tocci, E. Tyrode, M.-M. Walz, J. Werner and H. Bluhm, Chem. Rev., 2016, 116, 7698–7726 CrossRef PubMed.
- J. K. Lee, K. L. Walker, H. S. Han, J. Kang, F. B. Prinz, R. M. Waymouth, H. G. Nam and R. N. Zare, Proc. Natl. Acad. Sci. U. S. A., 2019, 116, 19294–19298 CrossRef CAS PubMed.
- J. K. Lee, H. S. Han, S. Chaikasetsin, D. P. Marron, R. M. Waymouth, F. B. Prinz and R. N. Zare, Proc. Natl. Acad. Sci. U. S. A., 2020, 117, 30934–30941 CrossRef CAS PubMed.
- M. A. Mehrgardi, M. Mofidfar and R. N. Zare, J. Am. Chem. Soc., 2022, 144, 7606–7609 CrossRef CAS PubMed.
- J. P. Heindel, H. Hao, R. A. LaCour and T. Head-Gordon, J. Phys. Chem. Lett., 2022, 13, 10035–10041 CrossRef CAS PubMed.
- K. Li, Y. Guo, S. A. Nizkorodov, Y. Rudich, M. Angelaki, X. Wang, T. An, S. Perrier and C. George, Proc. Natl. Acad. Sci. U. S. A., 2023, 120, e2220228120 CrossRef CAS PubMed.
- M. Angelaki, Y. Carreira Mendes Da Silva, S. Perrier and C. George, J. Am. Chem. Soc., 2024, 146, 8327–8334 CrossRef CAS PubMed.
- K. Zhou, H. Su, J. Gao, H. Li, S. Liu, X. Yi, Z. Zhang and W. Wang, J. Am. Chem. Soc., 2024, 146, 2445–2451 CrossRef CAS.
- M. Mofidfar, M. A. Mehrgardi, Y. Xia and R. N. Zare, Proc. Natl. Acad. Sci. U. S. A., 2024, 121, e2315940121 CrossRef CAS.
- A. Berbille, X.-F. Li, Y. Su, S. Li, X. Zhao, L. Zhu and Z. L. Wang, Adv. Mater., 2023, 35, 2304387 CrossRef CAS.
- H. Xiong, J. K. Lee, R. N. Zare and W. Min, J. Phys. Chem. Lett., 2020, 11, 7423–7428 CrossRef CAS PubMed.
- D. Nguyen, P. Lyu and S. C. Nguyen, J. Phys. Chem. B, 2023, 127, 2323–2330 CrossRef CAS PubMed.
- A. J. Colussi, J. Am. Chem. Soc., 2023, 145, 16315–16317 CrossRef CAS PubMed.
- G. Rovelli, M. I. Jacobs, M. D. Willis, R. J. Rapf, A. M. Prophet and K. R. Wilson, Chem. Sci., 2020, 11, 13026–13043 RSC.
- H. Hao, I. Leven and T. Head-Gordon, Nat. Commun., 2022, 13, 1–8 Search PubMed.
- M. T. C. Martins-Costa and M. F. Ruiz-López, J. Am. Chem. Soc., 2023, 145, 1400–1406 CrossRef CAS PubMed.
- D. Xing, Y. Meng, X. Yuan, S. Jin, X. Song, R. N. Zare and X. Zhang, Angew. Chem., Int. Ed., 2022, 61, e202207587 CrossRef CAS PubMed.
- N. H. Musskopf, A. Gallo Jr, P. Zhang, J. Petry and H. Mishra, J. Phys. Chem. Lett., 2021, 12, 11422–11429 CrossRef CAS PubMed.
- A. G. Jr, N. H. Musskopf, X. Liu, Z. Yang, J. Petry, P. Zhang, S. Thoroddsen, H. Im and H. Mishra, Chem. Sci., 2022, 13, 2574–2583 RSC.
- M. A. Eatoo and H. Mishra, Chem. Sci., 2024, 15, 3093–3103 RSC.
- C. J. Chen and E. Williams, Angew. Chem., Int. Ed., 2024, e202407433 CAS.
- M. T. C. Martins-Costa and M. F. Ruiz-López, Angew. Chem., Int. Ed., 2025, 64, e202418593 CrossRef CAS PubMed.
- K. Gong, A. Nandy, Z. Song, Q.-S. Li, A. Hassanali, G. Cassone, S. Banerjee and J. Xie, J. Am. Chem. Soc., 2024, 146, 31585–31596 CrossRef CAS PubMed.
- D. Nguyen and S. C. Nguyen, J. Phys. Chem. B, 2022, 126, 3180–3185 CrossRef CAS PubMed.
- K. Lee, H.-R. Lee, Y. H. Kim, J. Park, S. Cho, S. Li, M. Seo and S. Q. Choi, ACS Cent. Sci., 2022, 8, 1265–1271 CrossRef CAS PubMed.
- J. Zhao, X. Zhang, J. Xu, W. Tang, Z. Lin Wang and F. Ru Fan, Angew. Chem., Int. Ed., 2023, 62, e202300604 CrossRef CAS PubMed.
- I. B. Butler, M. A. A. Schoonen and D. T. Rickard, Talanta, 1994, 41, 211–215 CrossRef CAS PubMed.
- E. L. Mead, R. G. Sutherland and R. E. Verrall, Can. J. Chem., 1976, 54, 1114–1120 CrossRef CAS.
- L.-K. Ju and C. S. Ho, Biotechnol. Bioeng., 1989, 34, 1221–1224 CrossRef CAS PubMed.
- R. Battino, T. R. Rettich and T. Tominaga, J. Phys. Chem. Ref. Data, 1983, 12, 163–178 CrossRef CAS.
- F. Orrico, A. C. Lopez, D. Saliwonczyk, C. Acosta, I. Rodriguez-Grecco, I. Mouro-Chanteloup, M. A. Ostuni, A. Denicola, L. Thomson and M. N. Möller, J. Biol. Chem., 2021, 298, 101503 CrossRef PubMed.
- Y. Nosaka and A. Y. Nosaka, Chem. Rev., 2017, 117, 11302–11336 CrossRef CAS PubMed.
- K. S. Suslick, Science, 1990, 247, 1439–1445 CrossRef CAS PubMed.
- X. Fang, G. Mark and C. von Sonntag, Ultrason. Sonochem., 1996, 3, 57–63 CrossRef CAS.
- J. R. Baker, D. V. Zyzak, S. R. Thorpe and J. W. Baynes, Clin. Chem., 1993, 39, 2460–2465 CrossRef CAS.
- M. Ran, B. Du, W. Liu, Z. Liang, L. Liang, Y. Zhang, L. Zeng and M. Xing, Proc. Natl. Acad. Sci. U. S. A., 2024, 121, e2317435121 CrossRef CAS PubMed.
- B. Chen, Y. Xia, R. He, H. Sang, W. Zhang, J. Li, L. Chen, P. Wang, S. Guo, Y. Yin, L. Hu, M. Song, Y. Liang, Y. Wang, G. Jiang and R. N. Zare, Proc. Natl. Acad. Sci. U. S. A., 2022, 119, e2209056119 CrossRef CAS PubMed.
- A. Gray-Weale and J. K. Beattie, Phys. Chem. Chem. Phys., 2009, 11, 10994–11005 RSC.
- J. K. Beattie, A. M. Djerdjev, A. Gray-Weale, N. Kallay, J. Lützenkirchen, T. Preočanin and A. Selmani, J. Colloid Interface Sci., 2014, 422, 54–57 CrossRef CAS PubMed.
- C. Tian, S. J. Byrnes, H.-L. Han and Y. R. Shen, J. Phys. Chem. Lett., 2011, 2, 1946–1949 CrossRef CAS.
Footnotes |
| † Electronic supplementary information (ESI) available. See DOI: https://doi.org/10.1039/d4sc08098j |
| ‡ X. Z. and S. D. contributed equally. |
| This journal is © The Royal Society of Chemistry 2025 |