
 Open Access Article
 This Open Access Article is licensed under a Creative Commons Attribution-Non Commercial 3.0 Unported Licence
Electrochemical hydrocarboxylation of styrene with CO2 in continuous flow†
Jonas
Mortier
 ,
Christian V.
Stevens
and
Thomas S. A.
Heugebaert
*
,
Christian V.
Stevens
and
Thomas S. A.
Heugebaert
*
Department of Green Chemistry and Technology, Faculty of Bioscience Engineering, Ghent University, Coupure Links 653, 9000 Ghent, Belgium. E-mail: Thomas.Heugebaert@UGent.be
First published on 16th May 2025
Abstract
This study demonstrates the advantages of an electrochemical continuous flow cell regarding the β-hydrocarboxylation of styrene. An efficient continuous flow method was developed, obtaining high yields of carboxylic acid with a very low residence time, however still maintaining high selectivity.
Introduction
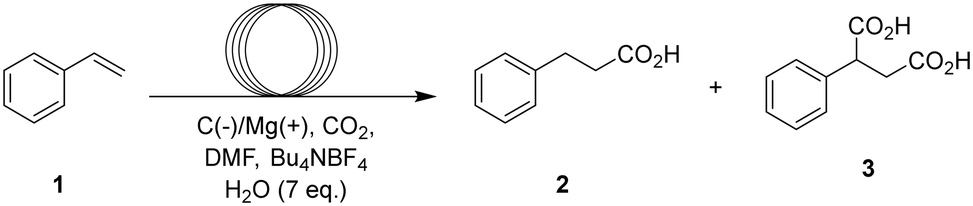
Harnessing CO2 as a carbon source for carboxylation reactions is a highly appealing route to synthesize carboxylic acids. A key driver of progress in CO2 utilization has been the development of diverse activation strategies, each designed to overcome the molecule's inherent thermodynamic and kinetic stability. Earlier approaches to CO2 utilization relied on highly nucleophilic intermediates—such as Grignard1 or organolithium reagents2—which readily attack the electrophilic carbon center of CO2. In recent years, however, there has been growing interest in developing milder activation strategies, with several photocatalytic and electrochemical single electron transfer methods emerging as promising alternatives focussing mostly on alkyl3,4 and aryl4 halide substrates, as well as on the mono-and dicarboxylation of alkenes.5–11 One prominent photochemical method, developed by Jamison et al.,5 demonstrates the hydrocarboxylation of styrene and derivatives under continuous flow conditions via a single-electron transfer mechanism. However, the inherently high reduction potential of CO2 towards its radical anion (−1.9 V vs. NHE) necessitates the use of a strongly reducing photocatalyst p-terphenyl, which in turn requires excitation with a high-intensity 500 W Hg(Xe) UV lamp. Additionally, the process requires two equivalents of the sacrificial reductant pentamethylpiperidine for each carboxylation event. To supply the high energy electrons required for the reduction of CO2, researchers have thus turned to electrochemistry. This allows precise tuning and on-demand delivery of the required potential, as well as opening up a broader choice of electron sources (reductants) at the counter electrode. Recently, several electrochemical methods have demonstrated the ability to selectively produce β-carboxylic acids from styrene derivatives, while α-carboxylic and dicarboxylic acids are formed as side products.12–14 (Table 1) Despite these promising developments, practical implementation remains hindered by challenges such as small-scale operation, suboptimal selectivity, and extended reaction times. Moreover, the process often requires excessive amounts of CO2 and electrons to achieve full conversion, leading to significant resource inefficiency. A recent literature review concerning electrochemical carboxylation with CO2 by Yu and co-workers15 also emphasizes that the use of continuous flow microreactors remains underexplored, with only a few examples in the literature regarding the synthesis of α-amino acids via the hydrocarboxylation of imines16 and biologically active carboxylic acids via deoxy-carboxylation of alcohols.17 In 2021, however, Buckley and co-workers demonstrated that the precursor to ethosuximide could be synthesized via electrochemical hydrocarboxylation in 81% yield by recirculating the reaction mixture through a microreactor for 4 hours.18 While this approach employs flow technology, it does not represent a fully continuous, single-pass process. Nonetheless, it provided a valuable foundation and inspired us to develop a single-pass, fully continuous flow hydrocarboxylation method that offers an efficient, scalable, and rapid route to carboxylic acids. By leveraging the advantages of continuous flow reactors—such as precise control over residence time, CO2 dosing, and electron flux—our system delivers significant improvements in both efficiency and practicality (Fig. 1).|
|
|||||||
|---|---|---|---|---|---|---|---|
| Ref. | Electrodes | Reaction volume | Styrene concentration | Solvent (electrolyte) | Reaction time | Conversion 1 | Yield 2/3/4 (%) |
| a 10 eq. of t-BuOH and 8 eq. of TMSCl used in reaction. Prior to styrene addition, reaction mixture is electrolyzed for 4 hours for Sm2+ generation. b Mixture electrolyzed with a constant potential of 10 V. c Electrolyzed with a constant current of 35 mA, corresponding to a total charge of 3 F mol−1. | |||||||
| 12 | Sm(−)/SS(+) | 40 ml | 0.025 M | MeCN (0.025 M Bu4NPF6) | 4 h | n.a. | 65/0/0 |
| 13 | C(−)/C(+) | 10 ml | 0.1 M | DMF (0.05 M Et4NI) | 3.5 h | 99 | 62/0/8 |
| 14 | Ni(−)/Mg(+) | 20 ml | 0.175 M | DMF (0.1 M Bu4NPF6) | 8 h | 80 | 53/13/0 |

 | ||
| Fig. 1 Advantages of continuous flow hydrocarboxylation strategy vs. batch. | ||
Results and discussion
Before delving into the complete and efficient one-pass continuous flow reaction set-up, it is important to address the current limitations of CO2-reductive electrochemistry. One key challenge lies in the limited selection of suitable solvents, particularly when working with species like CO2 that require highly negative reduction potentials. Solvents with cathodic stability beyond the reduction potential of CO2 are essential for such reactions. Suitable options include DMF, THF, and MeCN.19 Solvents with less negative cathodic limit potentials will result in competitive reactions at the working cathode, lowering the faradaic efficiency or bringing the reaction to a complete halt. Recent literature reviews reveal that DMF is predominantly utilized.15,20 A second limitation is the narrow choice of counter reactions. Unlike oxidative electrochemistry, which often uses simple proton reduction as the counter reaction, CO2 reduction typically relies on sacrificial anodes. Although literature includes examples of CO2 reduction reactions employing non-sacrificial counter-electrodes, these approaches suffer from a poorly defined anodic chemistry and face challenges such as high operating potentials and reduced selectivity.12,13 Therefore, sacrificial magnesium anodes (Mg → Mg2+ + 2e−) have been chosen for the next experiments. Lastly, the widely accepted mechanism for the electrochemical carboxylation of styrene indicates that a hydrogen donor is essential for achieving β-selective hydrocarboxylation, as it ‘quenches’ the resulting radical intermediate (Fig. 2, path a). In the absence of a hydrogen donor, the reaction pathway shifts toward dicarboxylation instead13,21 (Fig. 2, path b). An effective hydrogen donor should have a pKa lower than that of the corresponding α-proton in the product, ensuring efficient proton transfer. At the same time, its pKa should be high enough to minimize competitive proton reduction at the working cathode. With these criteria in mind, water (pKa = 14)22 was selected as the hydrogen donor. | ||
| Fig. 2 Generally accepted mechanism for the electrochemical mono- and dicarboxylation of styrene at the cathode. | ||
To analyze the hydrocarboxylation reaction in terms of electron flux, the reactor operates under constant current conditions. Maintaining a steady current, along with known reactor dimensions, (Fig. S1, ESI†) allows for precise calculation of the electron exposure per mole of substrate (F mol−1). At maximal theoretical efficiency, 2 moles of electrons are needed for every mole of substrate (Fig. 2). In practice, however, a part of the supplied electrons will lead to side reactions, e.g. unproductive proton reduction at the cathode, thus a higher electron flux is needed. The flow cell's small internal volume of 0.086 mL results in an extremely short residence time of just 25 seconds with an electron flux of 3 F mol−1. The initial optimization was performed by saturating the reaction mixture with CO2 bubbling, resulting in a saturated liquid reaction mixture where the CO2 is fully dissolved. Using this pre-saturated mixture, the reaction takes place in an electrochemical flow cell driven by a syringe pump.
With all prior conditions set, an electrolyte optimization was conducted first, evaluating a group of seven candidates. Among these, Bu4NBF4 demonstrated the best performance (Table 2, entry 1).
|
|
|||
|---|---|---|---|
| Entrya | Electrolyte | Conv. 1b (%) | Yield 2/3c (%) |
| a Reactions were performed after flushing the reaction mixture with CO2 for 30 minutes, with a styrene starting concentration of 0.05 M, under constant current conditions (0.208 mL min−1, 50 mA, 3 F mol−1, 25 s residence time). b Conversion determined via quantitative HPLC analysis. c Yield determined via quantitative 1H-NMR analysis of extracted products. d Reactor clogging, yield was not determined. | |||
| 1 | Bu4NBF4 | 86 | 68/11 |
| 2 | Et4NBF4 | 47 | 21/2 |
| 3 | Me4NBF4 | 0 | 0 |
| 4 | LiClO4 | n.d. | n.d.d |
| 5 | Bu4NClO4 | 81 | 54/14 |
| 6 | Bu4NPF6 | 84 | 56/10 |
| 7 | Et4NI | 45 | 22/4 |

As mentioned before, only DMF, MeCN and THF were considered as solvent due to their sufficiently low cathodic limit potential. When DMF was used as solvent, 86% styrene 1 was converted, yielding 68% of monocarboxylated product 2 (Table 3, entry 1). Using MeCN and THF unfortunately caused reactor clogging within just a few minutes due to fouling (Table 3, entries 2–3). When MeCN and THF were combined with DMF in equal volumes, reactor clogging could be avoided, but lower yields were obtained (Table 3, entries 4–5).
|
|
|||
|---|---|---|---|
| Entrya | Solvent | Conv. 1b (%) | Yield 2/3c (%) |
| a Reactions were performed after flushing the reaction mixture with CO2 for 30 minutes, with a styrene starting concentration of 0.05 M, under constant current conditions (0.208 mL min−1, 50 mA, 3 F mol−1, 25 s residence time). b Conversion determined via quantitative HPLC analysis. c Yield determined via quantitative 1H-NMR analysis of extracted products. d Reactor clogging after a few minutes, yield was not determined. e Reactor started clogging near the end of the reaction. | |||
| 1 | DMF | 86 | 68/11 |
| 2 | MeCN | n.d. | n.d.d |
| 3 | THF | n.d. | n.d.d |
| 4 | DMF/MeCN (1/1) | 75 | 53/9 |
| 5 | DMF/THF (1/1) | 78 | 60/8e |

To obtain the highest yield and selectivity for β-carboxylated 2, monocarboxylation (Fig. 2, path b) needs to be favoured by adding sufficient hydrogen donor. However, the amount of hydrogen donor has an upper limit, as excessive dosing of water can lead to competitive proton reduction at the working electrode, thereby lowering the faradaic efficiency of monocarboxylated product 2 while decreasing overall conversion. An optimum was found when adding 7 eq. H2O while running the reaction at 3 F mol−1 (Table 4, entry 3). When adding 15 eq. H2O, styrene conversion is significantly decreased. The presence of large gas bubbles post-reaction suggests that competitive hydrogen evolution is likely occurring—a conclusion supported by previous literature, which reported nearly 50% faradaic efficiency toward hydrogen generation upon the addition of 10 equivalents of water,21 ultimately leading to reduced overall conversion (Table 4, entry 4).
|
|
||||
|---|---|---|---|---|
| Entrya | Hydrogen donor (eq.) | F mol−1 | Conv. 1b (%) | Yield 2/3c (%) |
| a Reactions were performed after flushing the reaction mixture with CO2 for 30 minutes, with a styrene starting concentration of 0.05 M, under constant current conditions (for 3 F mol−1: 0.208 mL min−1, 50 mA, 25 s residence time. For 3.5 F mol−1: 0.177 mL min−1, 50 mA, 29 s residence time). b Conversion determined via quantitative HPLC analysis. c Yield determined via quantitative 1H-NMR analysis of extracted products. | ||||
| 1 | H2O (3) | 3 | 86 | 68/11 |
| 3.5 | 97 | 60/10 | ||
| 2 | H2O (5) | 3 | 80 | 63/10 |
| 3.5 | 89 | 66/11 | ||
| 3 | H2O (7) | 3 | 87 | 72/10 |
| 3.5 | 86 | 68/7 | ||
| 4 | H2O (15) | 3 | 70 | 50/4 |
| 3.5 | 80 | 58/4 | ||

To promote responsible resource management, additional experiments were conducted using reduced electrolyte concentrations. Results indicated that the electrolyte concentration could be lowered from 0.1 M to 0.02 M with only a slight decrease in yield. (Table 5, entry 2) At lower concentrations, the reaction mixture lacked sufficient conductivity, causing a continuous rise in cell potential until failure (Table 5, entries 3–4).
|
|
|||
|---|---|---|---|
| Entrya | Electrolyte conc. | Conv. 1b (%) | Yield 2/3c (%) |
| a Reactions were performed after flushing the reaction mixture with CO2 for 30 minutes, with a styrene starting concentration of 0.05 M, under constant current conditions (0.208 mL min−1, 50 mA, 3 F mol−1, 25 s residence time). b Conversion determined via quantitative HPLC analysis. c Yield determined via quantitative 1H-NMR analysis of extracted products. d Potential gradually increased due to insufficient conductivity, thus reaching the preset safety limit of 8 V. At that point, the reaction was halted prematurely, and the yield could not be determined. | |||
| 1 | 0.1 M | 87 | 72/10 |
| 2 | 0.02 M | 80 | 62/7 |
| 3 | 0.01 M | n.d.d | n.d.d |
| 4 | 0.005 M | n.d.d | n.d.d |
Following the initial optimization, a fully continuous flow hydrocarboxylation process was implemented, with CO2 carefully dosed using a mass flow controller (MFC). Instead of saturating the reaction mixture with an excess of CO2, this approach allows precise dosing of stoichiometric amounts, minimizing waste. To prevent leakage caused by the downstream placement of the back pressure regulator (BPR), it was relocated upstream, as the reactor is designed to operate under atmospheric pressure conditions. A homogeneous reaction stream is crucial to avoid accumulation of gas bubbles in the electrochemical cell, potentially causing fluctuations in product selectivity. Via trial-and-error it was observed that a maximum of 0.22 M of CO2 could be dissolved without residual gas bubbles entering the electrolysis cell, corresponding to 4.4 equivalents of CO2. The observed CO2 solubility closely matches previously reported literature value.23
In contrast to the previously identified optimum of 7 equivalents of water, the addition of just 1.5 equivalents already led to a better selectivity for monocarboxylated 2 (Table 6, entry 1 vs.Table 4, entry 3). Increasing the water content to 3 equivalents resulted in a noticeable decrease in conversion, suggesting that additional water offers no further benefit. (Table 6, entry 2) The reason for the overall change in product ratio compared to the syringe pump setup could not be pinpointed. A possible explanation is that residual water enters the reaction mixture, leading to a slight increase in water concentration thereby favouring formation of monocarboxylated product 2. Despite thorough flushing of the circuit with the reaction mixture prior to the reaction, the substantial internal volume of the pump, mixing zone, and back-pressure regulator makes it challenging to completely eliminate the possibility of water contamination. Alternatively, a slightly lower CO2 concentration is expected in this setup, operating just below the CO2 saturation point. This reduction in CO2 levels may, in turn, favor monocarboxylation over dicarboxylation (Fig. 2, path a vs. b).
|
|
|||
|---|---|---|---|
| Entrya | H2O (eq.) | Conv. 1b (%) | Yield 2/3c (%) |
| a Reactions were performed with a styrene starting concentration of 0.05 M, under constant current conditions (50 mA, 3 F mol−1, 25 s residence time) with 1 bar back pressure and 4.4 eq. CO2 (1.02 mlN min−1). b Conversion determined via quantitative HPLC analysis. c Yield determined via quantitative 1H-NMR analysis of extracted products. | |||
| 1 | 1.5 | 84 | 59/3 |
| 2 | 3 | 71 | 56/2 |

Attempts to enhance productivity by increasing current were unfortunately unsuccessful, as higher currents led to the formation of a gel-like substance that clogged the reaction system (Table S1, ESI†). However, when maintaining the 0.05 M substrate concentration, the electrolysis cell displayed a stable time-on-stream operation of approximately 100 residence times (Table S2, ESI†).
Conclusions
In summary, we have developed a convenient and fully continuous flow system for the hydrocarboxylation of styrene with CO2, offering a highly efficient and controlled approach to this transformation. By utilizing a continuous setup, we ensure precise delivery of CO2 in stoichiometric amounts, minimizing waste while drastically reducing the reaction time. This method not only enhances reaction efficiency but also achieves high β-selectivity and high conversion, demonstrating its potential for scalable applications.Data availability
The data supporting this article have been included as part of the ESI.†Conflicts of interest
There are no conflicts to declare.Acknowledgements
Jonas Mortier gratefully acknowledges financial support for this publication by Ghent University Special Research Fund; grant no. BOF/STA/202102/003.Notes and references
- V. S. Pfennig, R. C. Villella, J. Nikodemus and C. Bolm, Angew. Chem., 2022, 134, e202116514 CrossRef.
- J. Wu, X. Yang, Z. He, X. Mao, T. A. Hatton and T. F. Jamison, Angew. Chem., Int. Ed., 2014, 53, 8416–8420 CrossRef CAS PubMed.
- L. Li, Z.-X. Yan, C.-K. Ran, Y. Liu, S. Zhang, T.-Y. Gao, L.-F. Dai, L.-L. Liao, J.-H. Ye and D.-G. Yu, Chin. Chem. Lett., 2024, 35, 110104 CrossRef CAS.
- G.-Q. Sun, W. Zhang, L.-L. Liao, L. Li, Z.-H. Nie, J.-G. Wu, Z. Zhang and D.-G. Yu, Nat. Commun., 2021, 12, 7086 CrossRef CAS PubMed.
- H. Seo, A. Liu and T. F. Jamison, J. Am. Chem. Soc., 2017, 139, 13969–13972 CrossRef CAS PubMed.
- T. Ju, Y.-Q. Zhou, K.-G. Cao, Q. Fu, J.-H. Ye, G.-Q. Sun, X.-F. Liu, L. Chen, L.-L. Liao and D.-G. Yu, Nat. Catal., 2021, 4, 304–311 CrossRef CAS.
- A. M. Sheta, M. A. Mashaly, S. B. Said, S. S. Elmorsy, A. V. Malkov and B. R. Buckley, Chem. Sci., 2020, 11, 9109–9114 RSC.
- A. M. Sheta, A. Alkayal, M. A. Mashaly, S. B. Said, S. S. Elmorsy, A. V. Malkova and B. R. Buckley, Angew. Chem., 2021, 133, 21765–22252 Search PubMed.
- X. T. Gao, Z. Zhang, X. Wang, J. S. Tian, S. L. Xie, F. Zhou and J. Zhou, Chem. Sci., 2020, 11, 10414–10420 RSC.
- B. Zhong, D. He, R. Chen, T. Gao, Y. Wang, H. Chen, Y. Zhang and D. Wang, Phys. Chem. Chem. Phys., 2019, 21, 17517–17520 RSC.
- W. Zhang, L. Liao, L. Li, Y. Liu, L. Dai, G. Sun, C. Ran, J. Ye, Y. Lan and D. Yu, Angew. Chem., Int. Ed., 2023, 62, e202301892 CrossRef CAS PubMed.
- S. Bazzi, L. Hu, E. Schulz and M. Mellah, Organometallics, 2023, 42, 1425–1431 CrossRef CAS.
- A. Alkayal, V. Tabas, S. Montanaro, I. A. Wright, A. V. Malkov and B. R. Buckley, J. Am. Chem. Soc., 2020, 142, 1780–1785 CrossRef CAS PubMed.
- N. Alhathlaul, Z. Ertekin, S. Sproules and M. D. Symes, J. Electroanal. Chem., 2023, 950, 117892 CrossRef CAS.
- G.-Q. Sun, L.-L. Liao, C.-K. Ran, J.-H. Ye and D.-G. Yu, Acc. Chem. Res., 2024, 57, 2728–2745 CrossRef CAS PubMed.
- Y. Qu, C. Tsuneishi, H. Tateno, Y. Matsumura and M. Atobe, React. Chem. Eng., 2017, 2, 871–875 RSC.
- S. Kumar and A. K. Singh, Green Chem., 2023, 25, 8516–8523 RSC.
- A. M. Sheta, A. Alkayal, M. A. Mashaly, S. B. Said, S. S. Elmorsy, A. V. Malkov and B. R. Buckley, Angew. Chem., Int. Ed., 2021, 60, 21832–21837 CrossRef CAS PubMed.
- C. Schotten, T. P. Nicholls, R. A. Bourne, N. Kapur, B. N. Nguyen and C. E. Willans, Green Chem., 2020, 22, 3358–3375 RSC.
- X.-F. Liu, K. Zhang, L. Tao, X.-B. Lu and W.-Z. Zhang, Green Chem. Eng., 2022, 3, 125–137 CrossRef.
- Y. Kim, G. Do Park, M. Balamurugan, J. Seo, B. K. Min and K. T. Nam, Adv. Sci., 2020, 7, 1900137 CrossRef CAS PubMed.
- T. L. Neils, S. Schaertel and T. P. Silverstein, Helv. Chim. Acta, 2024, 107, e202400103 CrossRef CAS.
- M. Jitaru, J. Univ. Chem. Technol. Metall., 2007, 42, 333–344 CAS.
Footnote |
| † Electronic supplementary information (ESI) available. See DOI: https://doi.org/10.1039/d5re00162e |
| This journal is © The Royal Society of Chemistry 2025 |