DOI:
10.1039/D5RE00137D
(Paper)
React. Chem. Eng., 2025,
10, 1878-1886
Formation of the E-isomer as an impurity in the optimized flow synthesis of a Z-α-thio-β-chloroacrylamide; E/Z photoisomerization in batch and flow, and solid state characterization of both isomers†
Received
25th March 2025
, Accepted 7th May 2025
First published on 12th May 2025
Abstract
N-(4-Methylphenyl)-Z-3-chloro-2-(phenylthio)propenamide (Z-3), which is valuable as a reactive substrate for a range of synthetic transformations, can be obtained by a three-step process involving both batch and flow methodologies. Compound Z-3 was isolated as a crystalline material of high purity, however, the E-isomer, E-3, was found to form in solid samples of Z-3 material during storage. Increased ratios of E-3 and pure isolated samples were obtained by photoisomerization in batch and flow modes, with the flow process being optimal in terms of process time. Crystal structure analysis of both the Z and E isomers highlighted key differences in molecular conformations and supramolecular interactions with greater deviation from planarity evident in E-3 relative to Z-3. Analysis of samples of Z-3 by PXRD and DSC after recrystallization from a variety of solvents gave data consistent with the determined crystal structure of Z-3.
Introduction
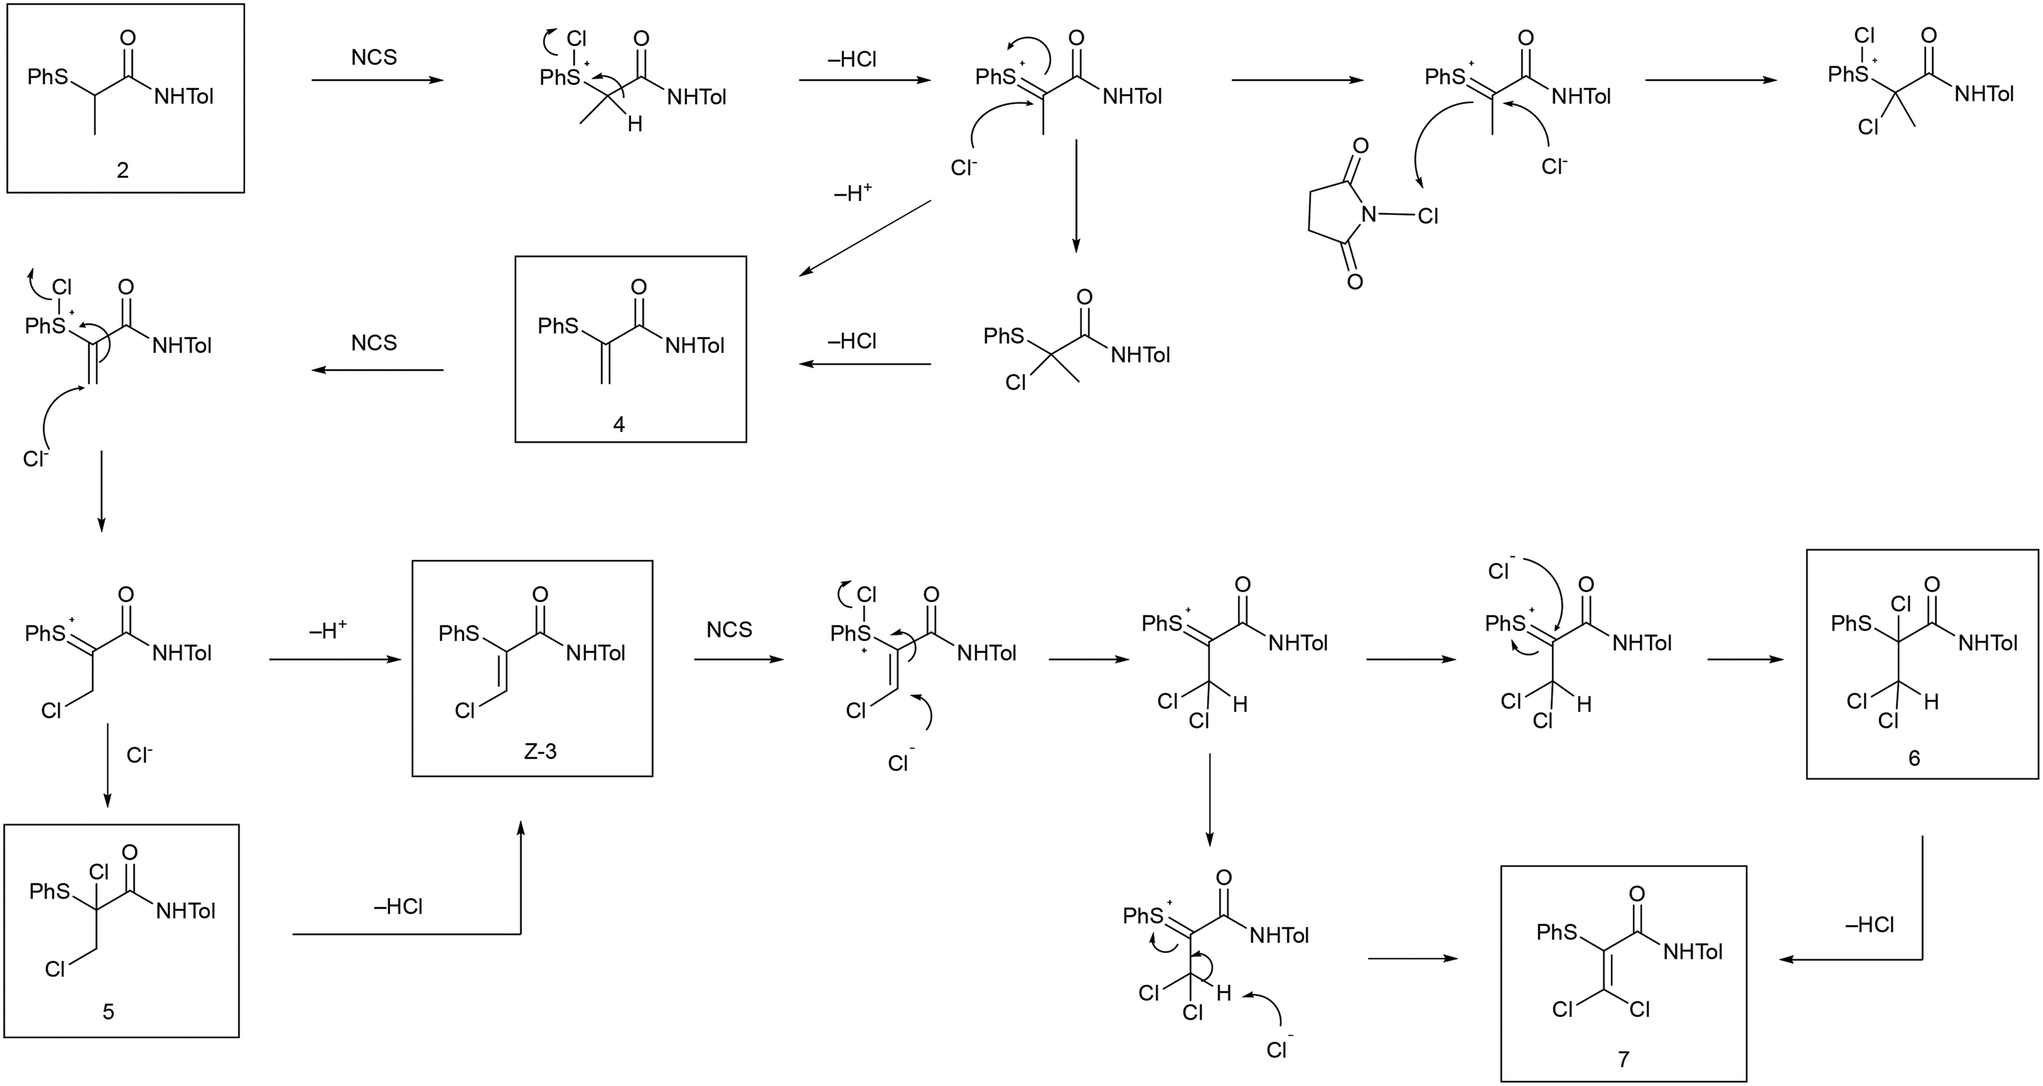
α-Thio-β-chloroacrylamides have shown their value as functionalized substrates for a range of transformations1,2 including nucleophilic substitution,3,4 1,3-dipolar cycloadditions,5,6 oxidation of the sulfide group7,8 and Diels–Alder reactions9 (Fig. 1). Synthesis of the prototypical α-thio-β-chloroacrylamide Z-3 consists of a three-step process (Scheme 1).10 The final step of the process is a cascade reaction (Scheme 2) which requires temperature control and efficient heat transfer.11 The challenges associated with scaling-up this three-step process have been addressed, allowing samples of up to 25 g of the intermediate product, α-thioamide 2, to be obtained.10,12 Scale-up of the final cascade step was more challenging, therefore, a continuous flow process was developed which was successfully scaled-up to a 30 g scale (Scheme 3).13
 |
| | Fig. 1 Synthetic transformations of α-thio-β-chloroacrylamides.1–9 | |
 |
| | Scheme 1 Three-step preparation of α-thio-β-chloroacrylamides.10 | |
 |
| | Scheme 2 α-Thio-β-chloroacrylamide cascade mechanism.11 | |
 |
| | Scheme 3 Optimized scale-up of continuous α-thio-β-chloroacrylamide Z-3 synthesis using 2.1 equiv. of NCS and an inline work-up.13 | |
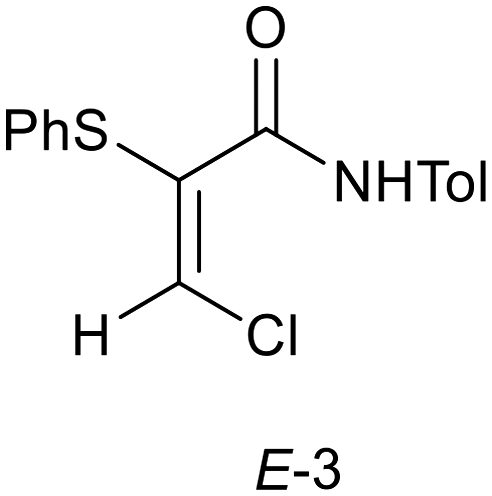
The purity and physical form of the isolated solid are important considerations in process scale up. Management of process side-products and impurities was a significant aspect of the previous work on the scale-up of this process.10,13 Compounds 4, 5, 6 and 7 shown in Scheme 2 were side-products which required process optimization to either minimize the extent of formation or remove from the isolated product by extraction. The isolated α-thio-β-chloroacrylamides Z-3 is a crystalline solid and its material as well as its molecular properties are significant. It is valuable to characterize the solid state form that is obtained, both with respect to any possible crystal polymorphism or solvate formation and also with respect to the stability of the Z-3 compound. The scale-up work also encountered the E-isomer (E-3) (Fig. 2) of the α-thio-β-chloroacrylamide as a minor component impurity which could be observed occurring in the isolated Z-3 product in the early stages of development of the flow process. However, the optimized process shown in Scheme 3 provided analytically pure Z-3 material, i.e., the inline washings and crystallization of the Z-3 product were sufficient for the removal of E-3 as well as the other impurities that had been observed.13 During the work described herein on the solid state characterization of the Z-3 material, formation of the E-3 isomer was also found to be significant. Hence the formation of E-3 by batch and flow processes was investigated in detail in this work, as was the crystal chemistry of the isolated E and Z isomers. While the formation of quantities of E-3 in samples of Z-3 is primarily seen as an impurity, availability of quantities of pure E-3 would allow investigation of the impact of stereochemistry on the range of processes shown in Fig. 1. The existence of E/Z isomers as impurities is also significant as such isomers can have differing physical and biological properties, requiring control of this form of isomerization.14
 |
| | Fig. 2
E-Isomer of N-(4-methylphenyl)-3-chloro-2-(phenylthio)propenamide (E-3). | |
Results & discussion
Previous work on the series of α-thio-β-chloroacrylamides had observed that the Z-isomer was selectively formed.1–3 Impurities 4 to 7, arising from process intermediates and over-chlorination, had been observed in work on the process in batch mode. During development of the flow process shown in Scheme 3, the E isomer E-3 was observed as an impurity and was also found to occur in isolated Z-3 material. However, the washing and crystallization of the Z-3 product in the final optimized flow process was sufficient for the effective management and removal of E-3 as well as the other impurities observed. Given the reactive nature of the Z-3 product, evaluation of its stability as an isolated compound in the solid state was desirable. Solid samples of Z-3 obtained by the optimized flow process and which had been shown to be analytically pure by HPLC were re-analyzed after storage at room temperature for one month. An impurity was observed to have formed in 3% to 10% quantities by HPLC (ESI† Fig. S1). On the basis of both the probability of E/Z isomerisation15 and our prior experience with analysis of impurities in the Z-3 process, it appeared likely that the impurity was the E-isomer (E-3) formed by isomerization of the original Z-3 product. Controlling the extent of E/Z isomerisation would be important for quality control in a product containing a material such as Z-3. The observation of formation of the E isomer in stored samples of Z-3 suggests storage at lower temperatures protected from light, with analysis of purity before use, would be recommended.
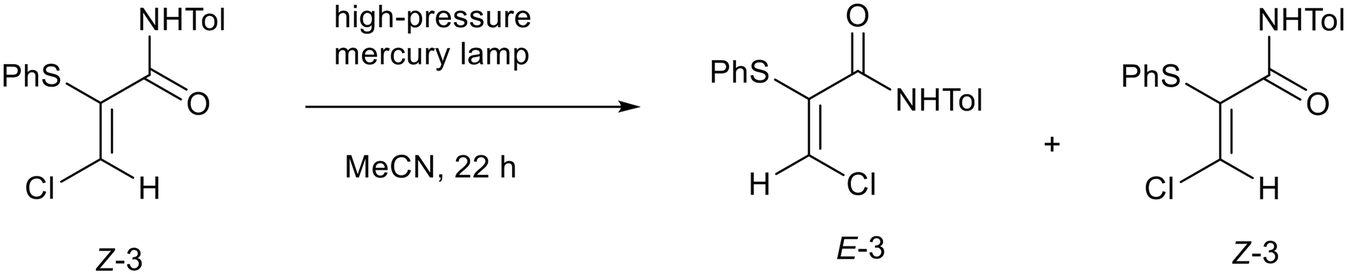
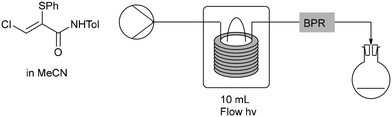
To produce enough material of E-3 for detailed analysis, a solution of pure Z-3 in acetonitrile was illuminated using a high-pressure mercury lamp for 22 h (Scheme 4). This approach produced a mixture of 43% E and 57% Z isomers, from which it was possible to isolate the E-isomer, E-3, by preparative chromatography. This batch photochemical process gave higher levels of E-3 than had been produced previously. The batch photoisomerization process was then transferred to a photochemical continuous flow process16 to investigate if the isomerization reaction could be optimized further. A solution of Z-3 in acetonitrile was pumped through a photochemical flow reactor with different conditions applied (Table 1). The ratio of E to Z-isomers was determined by 1H NMR spectroscopy by comparison of the integration for the β-proton in each (both singlets at 6.96 ppm and 8.04 ppm respectively). Initially, a back pressure regulator was not used to avoid a blockage occurring (Table 1, entries 1–3), however, it was reintroduced to control the movement of solution at low flow rates (Table 1, entries 4–13).
 |
| | Scheme 4 Photochemical isomerisation of N-(4-methylphenyl)-Z-3-chloro-2-(phenylthio)propenamide (Z-3). | |
Table 1 Optimization of isomerization of α-thio-β-chloroacrylamide Z-3 to E-3 using continuous flow processinga
|
|
| Entry |
Powerb (%) |
Filter typec |
Residence time (min) |
Conc. (M) |
Back pressure regulator (bar) |
E![[thin space (1/6-em)]](https://www.rsc.org/images/entities/char_2009.gif) :Zd % :Zd % |
|
A solution of Z-3 in MeCN was flowed through the photochemical reactor set at 35 °C.
% of 150 W maximum power.
See text for detailed description.
The samples were taken as liquid samples from the reactor, the solvent was evaporated and the entire sample was analyzed.
|
| 1 |
70 |
1, 190–2000 nm |
20 |
0.05 |
0 |
18:82 |
| 2 |
80 |
1, 190–2000 nm |
20 |
0.05 |
0 |
24:76 |
| 3 |
90 |
1, 190–2000 nm |
20 |
0.05 |
0 |
29:71 |
| 4 |
90 |
1, 190–2000 nm |
20 |
0.05 |
8 |
23:77 |
| 5 |
90 |
1, 190–2000 nm |
30 |
0.05 |
8 |
26:74 |
| 6 |
99 |
1, 190–2000 nm |
20 |
0.05 |
8 |
22:78 |
| 7 |
90 |
2, 250–390 nm |
20 |
0.05 |
8 |
21:79 |
| 8 |
90 |
2, 250–390 nm |
30 |
0.05 |
8 |
29:71 |
| 9 |
90 |
2, 250–390 nm |
10 |
0.05 |
8 |
21:79 |
| 10 |
90 |
2, 250–390 nm |
20 |
0.025 |
8 |
31:69 |
| 11 |
90 |
2, 250–390 nm |
20 |
0.01 |
8 |
39:61 |
| 12 |
90 |
2, 250–390 nm |
30 |
0.025 |
8 |
39:61 |
| 13 |
90 |
3, 300–2000 nm |
20 |
0.025 |
8 |
28:72 |
The photochemical reactor uses various filter fittings to access specific bands of light. Three of these, types 1, 2 and 3 were available for use. Type 1 is a quartz filter that allows a whole-wavelength range (190–2000 nm) to be produced (Table 1, entries 1–6). Type 2 allows only UV wavelengths (250–390 nm) (Table 1, entries 7–12) and type 3 is Pyrex© (300–2000 nm) (Table 1, entry 13) which was used to allow comparison with batch process glassware. All three filters were used while optimizing the residence time, solution concentration and the power of the light source to provide maximum isomerization to E-3. Starting with filter type 1, increasing the power of the light source from 70%, to 80%, to 90% (Table 1, entries 1–3) resulted in an increase in the conversion to E-3. However, when run at 99%, it was found that there was no improvement, therefore the use of 90% power was carried forward (Table 1, entry 6 compared to entry 4). Increasing residence time in conjunction with use of filter type 1 also gave no significant improvement (Table 1, entry 5). Following this, filter type 2 (for UV wavelengths alone) was used (Table 1, entries 7–9) which gave an increase in conversion to E-3 in conjunction with increased residence time. An improvement was also seen when reducing the solution concentration from 0.05 M to 0.025 M and then to 0.01 M (Table 1, entries 10 and 11). The best results were seen using filter type 2, giving the highest conversion and achieving a ratio of 39:61 for the E to Z isomer when performed at 90% power and either 0.01 M solution concentration with 20 min residence time (Table 1, entry 11), or 0.025 M solution concentration with a 30 min residence time (Table 1, entry 12). The extent of conversion was comparable to the batch process, with the advantage of a much shorter photolysis time. Use of filter type 3 (Table 1, entry 13), comparable to batch glassware, did not offer improved formation of E-3.
For E/Z isomers of alkenes, photochemical irradiation results in π to π* transitions and formation of excited state species with reduced alkene bond order, facilitating isomerisations such as those observed above for Z-3 and E-3.17 To minimise formation of E-3 during long term storage of samples of Z-3, protection from light would be recommended. Thermally induced E/Z isomerisation of alkenes can also occur, hence refrigeration would also be recommended.
As the final product of the process, Z-3, is a crystalline solid, evaluating the crystal form of the product material is an important aspect of the scale-up and valuable for an understanding of the stability of the material.18 Related to this is the need to determine purity both in terms of the levels of any impurities and the consistency of the crystalline phase. To achieve this for Z-3, multiple recrystallizations were carried out from a selection of different solvents to monitor whether the same form was obtained each time. Crystals of Z-3 were grown for analysis by single crystal X-ray diffraction (SCXRD) to determine the crystal structure and to investigate if this structure was representative of the bulk material produced. Generation of the theoretical PXRD pattern from the determined crystal structure allowed direct comparison with the PXRD patterns from the recrystallized samples, to demonstrate that the crystal selected for SCXRD had the same crystal structure as those used to obtain the experimental PXRD patterns. The crystal structure of E-3 was also obtained and was compared to the crystal structure of Z-3 to examine the different orientation and packing features of each isomer. The key stereochemical difference between the isomers, i.e., the Z or E geometries of the central alkene bond, is an intrinsic feature of the respective crystal structures.
Crystals of Z-3 were grown by slow evaporation of an ethyl acetate and heptane solvent mixture and crystals suitable for SCXRD identified. The Z-isomer crystals were solved in the monoclinic space group P21/n at 296 K and the unit cell orientation can be seen in Fig. 3. The torsion angle for the C![[double bond, length as m-dash]](https://www.rsc.org/images/entities/char_e001.gif) C–CO bond was measured, both for Z-3 and for E-3 (see below), to describe the central conformational feature of the molecule, and was found to be −21.3° in the Z-3 crystal structure in contrast to 123.3° in the E-3 structure. Furthermore, the crystal structure data allowed prediction of the theoretical powder X-ray diffraction (PXRD) pattern (ESI† Fig. S2) which proved useful for comparison against experimental patterns to confirm that the crystal structure obtained was representative of the bulk Z-3 material (see below).
C–CO bond was measured, both for Z-3 and for E-3 (see below), to describe the central conformational feature of the molecule, and was found to be −21.3° in the Z-3 crystal structure in contrast to 123.3° in the E-3 structure. Furthermore, the crystal structure data allowed prediction of the theoretical powder X-ray diffraction (PXRD) pattern (ESI† Fig. S2) which proved useful for comparison against experimental patterns to confirm that the crystal structure obtained was representative of the bulk Z-3 material (see below).
 |
| | Fig. 3 Unit cell of Z-3. | |
The crystal structure of compound Z-3 contains one-dimensional sheets along the b-axis, formed by C–H⋯OC discreet interactions of 2.45 Å (Fig. 4). The distance between the aromatic rings in adjoining molecules shown in Fig. 4 is <4.2 Å so that a π–π stacking motif is likely. The N–H⋯OC motif is widely seen in the solid state for amides, often forming one-dimensional stacks and ladder motifs via R22(8) dimers,19–22 however, the N–H is outside the plane in which they could interact with other molecules. Instead, an intramolecular N–H⋯S interaction of 2.61 Å is observed. The crystal structure shows additional interactions that knit two of these chains together side-by-side, shown in Fig. 5(a) and (b). This feature is visible through intermolecular edge-to-face aromatic interactions from the edge of the thiophenyl group to the face of the tolyl ring and through offset parallel stacking (face-to-face aromatic) interactions.23–25 These interactions result in a bridging connection being formed between the two chains through the thiophenyl group.
 |
| | Fig. 4 One-dimensional sheets along the b-axis in Z-3. | |
 |
| | Fig. 5 Views, (a) and (b), from different angles showing the knitting of two chains of Z-3 together based on edge-to-face (C–H⋯π 2.83 Å) and face-to-face aromatic interactions. | |
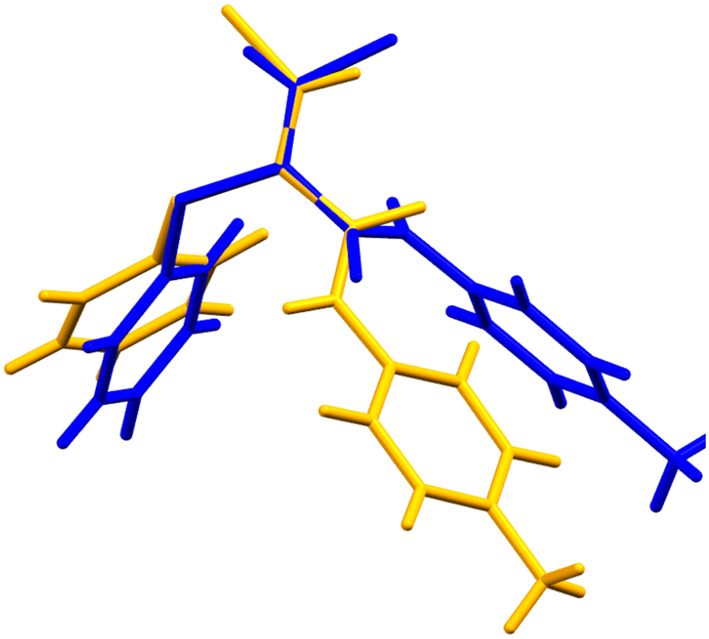
Crystals of the E-isomer (E-3) suitable for analysis by SCXRD were grown from a mixture of ethyl acetate and heptane by slow evaporation. The structure of the E-isomer crystals was solved in the monoclinic space group P21/c at 296 K. The torsion angle around the CC–CO bond was measured to be +123.3°. In contrast to the Z-3 isomer, the E-3 isomer forms one dimensional sheets along the b-axis by forming C(4) chains via N–H⋯OC hydrogen bonding interactions typical of secondary amides, Fig. 6. The N–H⋯OC length is 2.16 Å (N⋯O length is 2.92 Å) with an angle of 119°. The Cl⋯N length is 3.2 Å, i.e., slightly smaller than the sum of the van der Waals radii, with an intramolecular angle of 132°. Face-to-face π–π stacking is not present but edge-to-face aryl interactions are present with the nearest centroid at 2.67 Å. Comparison of the theoretical PXRD pattern based on the SCXRD data with the experimental PXRD show good agreement (ESI† Fig. S3), demonstrating that the crystal used for single crystal analysis was representative of the bulk material. The molecular conformational difference between the E-3 and Z-3 isomers can be clearly seen by overlaying the molecular conformations from the two crystal structures (Fig. 7 and 8). The significant conformational differences between the E-3 and Z-3 isomers are very clear, consistent with the differences in the NMR spectroscopic data for these compounds, with enhanced conjugation in Z-3 relative to E-3, in which the distortion from planarity across the unsaturated amide is much more significant (Table 2). The conformational properties of Z-3 are consistent with those seen in the analogous N-benzyl derivative.2
 |
| | Fig. 6 Hydrogen bonding and short contact interactions in the crystal structure of E-3. | |
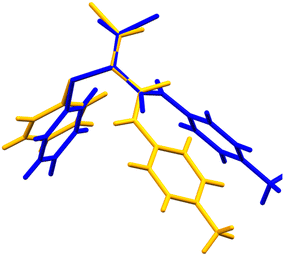 |
| | Fig. 7 Structure overlay diagram of Z-3 (yellow) and E-3 (blue). The overlapping atoms are the carbonyl C, αC and βC. The CC–CO torsional angles are Z −21.3°, E 123.3°. | |
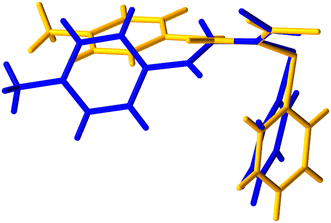 |
| | Fig. 8 Structure overlay diagram of Z-3 (yellow) and E-3 (blue), alternative view. | |
Table 2 Selected torsional angles and NMR chemical shifts for compounds Z-3 and E-3
| Torsion angles |
Z-3
|
E-3
|
| O4–C1–C2–C3 |
−21.3° |
123.3° |
| O4–C1–C2–S13 |
162.9° |
−48.9° |
| C1–C2–C3–Cl20 |
176.6° |
−3.2° |
| NMR |
|
δ
H (CDCl3) β-hydrogen |
8.04 ppm |
6.96 ppm |
|
δ
C (CDCl3) β-carbon |
140.7 ppm |
128.4 ppm |
Throughout the optimization of the NCS cascade reaction using continuous flow methods, the Z-3 material obtained was recrystallized and the material analyzed by HPLC, DSC and PXRD. The purity of each sample was analyzed by HPLC to make sure that the chemical composition of the material had not degraded or changed during the crystallization process. The solvent systems used in these recrystallizations included methanol, ethanol, isopropyl alcohol, acetonitrile, acetone, ethyl acetate, toluene, ethyl acetate/hexane, dichloromethane/hexane and ethyl acetate/heptane. The material obtained exhibited PXRD patterns consistent with each other and the theoretical patterns obtained from the Z-3 crystal structure (ESI† Fig. S4) demonstrating that the crystal used for single crystal analysis was representative of the bulk material. These data suggest that the same crystal form of the α-thio-β-chloroacrylamide Z-3 compound was observed throughout this study. DSC data showed a straightforward melt and the same melting point across the various recrystallizations, which also indicates the presence of the same crystal form (ESI† Fig. S5–S7). Fig. S8† shows the quality of the material used in the recrystallizations, typically 99.8% pure. The Z-3 material showed an uncomplicated decomposition when analyzed by TGA (ESI† Fig. S9), indicating that the material was not a hydrate or solvate.
Conclusions
The α-thio-β-chloroacrylamide Z-3 is valuable in synthesis as a highly functionalized substrate for nucleophilic substitution, oxidation, Diels–Alder and 1,3-dipolar cycloaddition reactions (Scheme 1). Producing substantial quantities of Z-3 was challenging as the final step involved a complex cascade mechanism (Scheme 2) which required a ‘hot plunge’ heating method in batch such that flow methods were preferable for larger scale synthesis (Scheme 3).10,13 During the development of the flow process for the NCS cascade the isomer E-3 was observed for the first time, however, the optimized flow process shown in Scheme 3 successfully removed E-3 as well as other impurities. A fully successful method for producing usable quantities of compound Z-3 needs to provide material of defined purity and solid state form.
Given the reactivity of Z-3, (ref. 1–9) the stability of Z-3 with respect to E/Z isomerization was also an issue to be investigated. Samples of Z-3, which had been shown to be pure by HPLC, were found on re-analysis after storage for one month to contain 3% to 10% quantities of the E isomer. Quantities of E-3 were conveniently obtained by photochemical isomerization of Z-3, which were carried out in batch but was optimized in flow using a photochemical reactor with use of a 150 W medium pressure mercury lamp in conjunction with a band-pass filter (250–390 nm) giving the highest conversion. The conversion by flow was comparable to the batch process, albeit with a much shorter photolysis time. Access to quantities of both Z-3 and E-3 allowed detailed comparison of their crystal chemistries. Crystal structural characterization of both the Z and E isomers highlighted differences in molecular conformations and supramolecular interactions between the two structures. Samples of Z-3 recrystallized from a variety of solvents gave PXRD patterns consistent with the observed crystal structure.
Experimental
General
All commercial reagents were purchased from Sigma Aldrich. 1H (300 MHz) and 13C (75.5 MHz) NMR spectra were recorded on a Bruker Avance 300 MHz NMR spectrometer at 300 K using tetramethylsilane (TMS) as the internal standard. Infrared spectra were recorded on a Perkin-Elmer Spectrum One FT-IR spectrometer. Elemental analysis was carried out by Microanalysis Laboratory, University College Cork, using Perkin-Elmer 240 and Exeter Analytical CE440 elemental analyzers. Low resolution mass spectra (LRMS) were recorded on a Waters Quattro Micro triple quadrupole instrument in electrospray ionization (ESI) mode using 50% acetonitrile–water containing 0.1% formic acid as eluent. High resolution mass spectra (HRMS) were recorded on a Waters LCT Premier Tof LC-MS instrument in electrospray ionization mode using 50% acetonitrile–water containing 0.1% formic acid as eluent. Samples prepared for either LRMS or HRMS by employing acetonitrile as solvent.
Single-crystal X-ray diffraction
Single-crystal X-ray diffraction data were collected on a Bruker APEX II DUO diffractometer26 using monochromatized Cu Kα (λ = 1.5418 Å) radiation and corrected for Lorentz and polarisation effects. The APEX27 suite of programs, incorporating the SHELX suite of programs, were used.28 The structures were solved using direct methods and refined by full-matrix least-squares using all F2 data. All non-hydrogen atoms were located and refined with anisotropic thermal parameters. The methyl hydrogen atoms were found from a Fourier difference map and allowed to ride on the parent atom; all other hydrogen atoms were placed in calculated positions and allowed to ride on the parent atom. Diagrams were prepared using Mercury,29 version 2022.2.0.
Synthesis of N-(4-methylphenyl)-Z-3-chloro-2-(phenylthio)propenamide (Z-3) by flow
A Vapourtec R-series reactor was used. A solution of 2-(phenylthio)-N-(4-methylphenyl)propanamide 2 (30.0 g, 0.11 mol) in EtOAc (553 mL) and a solution of N-chlorosuccinimide (NCS) (31.0 g, 0.23 mol) in EtOAc (1.161 mL) were prepared. The α-thioamide solution was pumped (1.935 mL min−1) into a T-piece where it met the solution of NCS (4.065 mL min−1). The combined stream passed through three 10 mL reactor coils at 145 °C (5.0 min residence time). To the reaction stream, 0.5 M aqueous NaOH was pumped (5 mL min−1) through 1 m of tubing before water was pumped (3 mL min−1) to join the stream in a 200 μL chip mixer and was pumped through 1.57 m of tubing before entering the continuous liquid phase separator. The reactor output was collected and most of the solvent was removed under reduced pressure, with heptane added as an antisolvent to crystallize the product from solution. The desired Z-3 product was isolated as an off-white solid (20.2 g, 60.5%); δH (300 MHz, CDCl3) 2.29 (3H, s, ArCH3), 7.09 (2H, d, J 8.4, ArH), 7.20–7.31 (7H, m, ArH), 8.04 (1H, s, CHCl), 8.61 (1H, br s, NH); δC (75.5 MHz, CDCl3) 20.8 (CH3, ArCH3), 120.2, 127.3, 128.2, 129.5, 129.7 (9 × CH, aromatic CH), 130.7, 132.5, 134.5, 134.7 [4 × C, aromatic C and SC], 140.7 (CH, CHCl), 160.3 (C, CO); MS (ESI+): m/z 304 ([M + H]+). A crystal of Z-3 of dimensions 0.257 × 0.212 × 0.176 mm was analysed: monoclinic, P21/n, C16H14ClNOS, M = 303.79, a = 11.7393(7) Å, b = 5.9359(4) Å, c = 21.5347(13) Å, β = 92.636(2)°, U = 1499.02(16) Å3, F(000) = 632, μ = 3.505 mm−1, R(Fo) = 0.0367 for 2545 observed reflections with I > 2σ(I), wR2(F2) = 0.1016 for all 2592 unique reflections.
Synthesis of N-(4-methylphenyl)-E-3-chloro-2-(phenylthio)propenamide (E-3) by batch photoisomerization
N-(4-Methylphenyl)-Z-3-chloro-2-(phenylthio)propenamide (Z-3) (0.65 g, 2.14 mmol) was dissolved in acetonitrile (50 mL) and was stirred for 22 h under a standard high pressure Philips HPL-N 80W/542 mercury lamp. The solvent was removed by reduced pressure and the crude product (Z-3:E-3 ratio of 1.3:1 by 1H NMR) was purified by column chromatography on silica gel using hexane–ethyl acetate as eluent (gradient elution 2–5% ethyl acetate) to give the pure E isomer E-3 (0.28 g, 43.1%) as a white solid; m.p. 100–102 °C; CHN analysis, found C: 63.76; H: 4.84; N: 4.34; S: 10.58; Cl: 11.72%. C16H14NOSCl requires C: 63.26; H: 4.65; N: 4.61; S: 10.55; Cl: 11.67%. νmax/cm−1 (KBr) 3286 (NH stretch), 1658 (CO stretch), 815 (CC bend), 742 (C–Cl stretch); δH (300 MHz, CDCl3) 2.29 (3H, s, ArCH3), 6.96 (1H, s, CHCl), 7.09 (2H, d, J 8.2 Hz, ArH), 7.24–7.41 (7H, m, ArH), 8.04 (1H, br s, NH); δC (75.5 MHz, CDCl3) 20.9 (ArCH3), 120.1, 128.1 (aromatic CH), 128.4 (CHCl), 129.5, 129.6, 129.8 (aromatic CH), 131.0, 132.4, 134.4, 134.7 (quaternary aromatic C and SC), 160.2 (CO); MS (ESI+): m/z 304 (M + H)+ (94%) isotopic Cl pattern observed; 304, 306 (3:1 35Cl, 37Cl); HRMS (ESI+): exact mass calcd for C16H15NOSCl35 (M + H)+ 304.0563, found 304.0550. A crystal of E-3 of dimensions 0.422 × 0.296 × 0.227 mm was analysed: monoclinic, P21/c, C16H14ClNOS, M = 303.79, a = 11.0845(3) Å, b = 9.0521(2) Å, c = 15.9379(4) Å, β = 98.0480(10)°, U = 1583.43(7) Å3, F(000) = 632, μ = 3.318 mm−1, R(Fo) = 0.0533 for 2599 observed reflections with I > 2σ(I), wR2(F2) = 0.1511 for all 2728 unique reflections.
Synthesis of N-(4-methylphenyl)-E-3-chloro-2-(phenylthio)propenamide (E-3) by flow photoisomerization
Vapourtec R series system with a UV-150 photochemical reactor were used. The tubing in the UV-150 photochemical reactor is made from a fluoropolymer which allows for UV transmission in the range 220–400 nm. This tubing had a wall thickness of 0.15 mm and an internal bore of 1.3 mm and the reactor has an overall volume of 10 mL. It has a pressure limit of 12 bar when at 80 °C. Filters (Table 3) were used to absorb unwanted heat generated by the medium pressure Hg lamp. These filters are placed between the reactor tubing and the lamp and can be easily changed. Three different filters were supplied with the UV-150 photochemical reactor and the cut-off wavelengths are as follows.
Table 3 Filter types and corresponding wavelength ranges for the UV-150 photochemical reactor
| Filter |
Wavelength |
| Type 1 (silver) |
190–2000 nm |
| Type 2 (gold) |
250–390 nm |
| Type 3 (red) |
300–2000 nm |
Data availability
The data supporting this article have been included as part of the ESI.† Crystallographic data for compounds Z-3 and E-3 has been deposited at the Cambridge Crystallographic Data Centre (CCDC) with CCDC numbers 2434027 and 2434028.
Author contributions
Olga C. Dennehy: data curation, formal analysis, investigation, methodology, writing – original draft. Denis Lynch: data curation, methodology, project administration, resources, writing – review & editing. U. B. Rao Khandavilli: data curation, formal analysis, investigation, methodology, writing – review & editing. Simon E. Lawrence: conceptualization, formal analysis, funding acquisition, methodology, project administration, resources, supervision, writing – review & editing. Stuart G. Collins: conceptualization, funding acquisition, methodology, resources, supervision, writing – review & editing. Anita R. Maguire: conceptualization, funding acquisition, methodology, project administration, resources, supervision, writing – review & editing. Humphrey A. Moynihan: conceptualization, funding acquisition, methodology, project administration, resources, supervision, writing – original draft.
Conflicts of interest
There are no conflicts of interest to declare.
Acknowledgements
This work was undertaken as part of the SSPC, the Research Ireland Research Centre for Pharmaceuticals, supported by Science Foundation Ireland, now Research Ireland, and cofunded under the European Regional Development Fund (Grants SFI SSPC 12/RC/2275 and SFI SSPC 12/RC/2275_2) and with use of equipment provided by Science Foundation Ireland, now Research Ireland, through two research infrastructure awards (Grant SFI 15/RI/3221 and 21/RI/9705). The authors would like to acknowledge the contribution of Janssen Pharmaceuticals, for the kind loan of one of the flow chemistry reactors used in this work.
References
- M. Kissane and A. R. Maguire, Synlett, 2011, 11, 1212–1232 Search PubMed.
- A. R. Maguire, M. E. Murphy, M. Schaeffer and G. Ferguson, Tetrahedron Lett., 1995, 36, 467–470 CrossRef CAS.
- M. Murphy, D. Lynch, M. Schaeffer, M. Kissane, J. Chopra, E. O'Brien, A. Ford, G. Ferguson and A. R. Maguire, Org. Biomol. Chem., 2007, 5, 1228–1241 RSC.
- M. Kissane, M. Murphy, E. O'Brien, J. Chopra, L. Murphy, S. G. Collins, S. E. Lawrence and A. R. Maguire, Org. Biomol. Chem., 2011, 9, 2452–2472 RSC.
- M. Kissane, M. Murphy, D. Lynch, A. Ford and A. R. Maguire, Tetrahedron, 2008, 64, 7639–7649 CrossRef CAS.
- M. Kissane, S. E. Lawrence and A. R. Maguire, Org. Biomol. Chem., 2010, 8, 2735–2748 RSC.
- M. Kissane, S. E. Lawrence and A. R. Maguire, Tetrahedron: Asymmetry, 2010, 21, 871–884 CrossRef CAS.
- M. Kissane, M. Murphy, S. E. Lawrence and A. R. Maguire, Tetrahedron: Asymmetry, 2010, 21, 2550–2558 CrossRef CAS.
- M. Kissane, D. Lynch, J. Chopra, S. E. Lawrence and A. R. Maguire, Org. Biomol. Chem., 2010, 8, 5602–5613 RSC.
- O. C. Dennehy, V. M. Y. Cacheux, B. J. Deadman, D. Lynch, S. G. Collins, H. A. Moynihan and A. R. Maguire, Beilstein J. Org. Chem., 2016, 12, 2511–2522 CrossRef CAS PubMed.
- D. A. Foley, C. W. Doecke, J. Y. Buser, J. M. Merritt, L. Murphy, M. Kissane, M. S. G. Collins, A. R. Maguire and A. Kaerner, J. Org. Chem., 2011, 76, 9630–9640 CrossRef CAS.
- B. de Souza, L. Keshavarz, R. R. E. Steendam, O. C. Dennehy, D. Lynch, S. G. Collins, H. A. Moynihan, A. R. Maguire and P. J. Frawley, J. Chem. Eng. Data, 2018, 63, 1419–1428 CrossRef CAS.
- O. C. Dennehy, D. Lynch, S. G. Collins, A. R. Maguire and H. A. Moynihan, Org. Process Res. Dev., 2020, 24, 1978–1987 CrossRef CAS.
- D. W. Robertson and J. A. Katzenellenbogen, J. Org. Chem., 1982, 47, 2387–2393 CrossRef CAS.
- P. E. Sonnet, Tetrahedron, 1980, 36, 557–604 CrossRef CAS.
- J. P. Knowles, J. P. Elliott and K. I. Booker-Milburn, Beilstein J. Org. Chem., 2012, 8, 2025–2052 CrossRef CAS PubMed.
-
F. A. Carroll, Perspectives on Structure and Mechanism in Organic Chemistry, Wiley, 2nd edn, 2010 Search PubMed.
- K. Edkins and A. J. Cruz-Cabeza, CrystEngComm, 2019, 21, 2031–2033 RSC.
- L. Leiserowitz and M. Weinstein, Acta Crystallogr., Sect. B, 1975, 31, 1463–1466 CrossRef.
- S. Weinstein, L. Leiserowitz and E. Gil-Av, J. Am. Chem. Soc., 1980, 102, 2768–2772 CrossRef CAS.
- L. Leiserowitz and A. T. Hagler, Proc. R. Soc. London, Ser. A, 1983, 388, 133–175 CAS.
- K. S. Eccles, C. J. Elcoate, A. R. Maguire and S. E. Lawrence, Cryst. Growth Des., 2011, 11, 4433–4439 CrossRef CAS.
- C. A. Hunter and J. K. M. Sanders, J. Am. Chem. Soc., 1990, 112, 5525–5534 CrossRef CAS.
- W. B. Jennings, B. M. Farrell and J. F. Malone, Acc. Chem. Res., 2001, 34, 885–894 CrossRef CAS.
- C. R. Martinez and B. L. Iverson, Chem. Sci., 2012, 3, 2191–2201 RSC.
- K. S. Eccles, S. P. Stokes, C. A. Daly, N. M. Barry, S. P. McSweeney, D. J. O'Neill, D. M. Kelly, W. B. Jennings, O. M. Ni Dhubhghaill, H. A. Moynihan, A. R. Maguire and S. E. Lawrence, J. Appl. Crystallogr., 2011, 44, 213–215 CrossRef CAS PubMed.
-
APEX2, v2009.3-0, Brucker AXS, Madison, WI, 2009 Search PubMed.
- G. Sheldrick, Acta Crystallogr., Sect. A: Found. Crystallogr., 2008, 64, 112–122 CrossRef CAS PubMed.
- C. F. Macrae, I. Sovago, S. J. Cottrell, P. T. A. Galek, P. McCabe, E. Pidcock, M. Platings, G. P. Shields, J. S. Stevens, M. Towler and P. A. Wood, J. Appl. Crystallogr., 2020, 53, 226–235 CrossRef CAS.
Footnote |
| † Electronic supplementary information (ESI) available: HPLC, PXRD, DSC and TGA methods; HPLC, NMR, PXRD, DSC and TGA data (PDF); crystallographic data (cif and checkcif files). See DOI: https://doi.org/10.1039/d5re00137d |
|
| This journal is © The Royal Society of Chemistry 2025 |
Click here to see how this site uses Cookies. View our privacy policy here. 
 Open Access Article
 This Open Access Article is licensed under a
  a,
Simon E.
Lawrence
a,
Simon E.
Lawrence