DOI:
10.1039/D5RA07886E
(Paper)
RSC Adv., 2025,
15, 50881-50897
Group-I lead oxide X2PbO3 (X = Li, Na, K, Rb, and Cs) glass-like materials for energy applications: a hybrid-DFT study
Received
15th October 2025
, Accepted 13th November 2025
First published on 18th December 2025
Abstract
Pb-based compounds have garnered considerable theoretical and experimental attention due to their promising potential in energy-related applications. In this study, we explore the glass-like alkali metal lead oxides X2PbO3 (X = Li, Na, K, Rb, Cs) and assess their suitability for piezoelectric and thermoelectric applications. First-principles calculations were performed using hybrid density functional theory (DFT), incorporating B3LYP, HSE06, and PBE0 functionals. Among these, PBE0 is identified as the most accurate, yielding lattice parameters in close agreement with experimental data. Structural stability was confirmed through the evaluation of thermal, mechanical, and formation energies. For the non-centrosymmetric orthorhombic phase Cmc21-X2PbO3 (X = K, Rb, Cs), piezoelectric constants were computed via both the numerical Berry phase (BP) method and the analytical Coupled Perturbed Hartree–Fock/Kohn–Sham (CPHF/KS) formalism. Notably, Cs2PbO3 exhibited a piezoelectric coefficient of e33 = 0.60 C m−2 (CPHF/KS), while K2PbO3 showed e32 = −0.51 C m−2 (BP). Thermoelectric properties were investigated using the semiclassical Boltzmann transport theory within the rigid band approximation. The calculated thermoelectric performance reveals promising figures of merit (ZT), ranging from 0.3 to 0.63, suggesting these materials are applicable as future thermoelectric materials.
1 Introduction
Energy generation and storage is crucial to meet the current global energy and environmental crises. The energy extracted from fossil fuels is extensively utilized for transportation, many industries and many other purposes, despite its known harmful effect.1 Thermoelectricity holds promise as a suitable and sustainable alternative to greenhouse gases emitting fuels if efficient thermoelectric (TE) devices of high heat energy-to-electric voltage conversion efficiency can be discovered.2–6 First-principles calculations with the incorporation of Boltzmann transport equation via the BoltzTraP code7 can help in predicting the candidates for the preparation of TE devices. Glass-like compounds have become fascinating materials, both experimentally and theoretically, due to the complexity of their structures which in turn exhibit low lattice thermal conductivity, tunable electronic properties, and flexibility in fabrication.8–11 Although silicate (SiO2) glasses are widely abundant and commonly used materials, they have significant limitations such as brittleness, high resistance and phase transition at higher temperatures, etc. Therefore, it is pivotal for researchers to find proper replacements for silicate glasses.12 In this novel work, we propose alkali metal oxide Pb-based glass-like materials X2PbO3 (X = Li, Na, K, Rb, Cs) as potential replacements for SiO2-glasses such as: Li2SiO3, Na2SiO3, etc., and conduct a thorough investigation on these compounds using density functional theory (DFT), particularly for their TE applications. To the best of our knowledge, among the suggested alkali metal oxides, K2PbO3 was the first compound to be synthesized back in 1964 by Hoppe and co-workers;13 later, in the year 1972 the Cs2PbO3 compound was synthesized by Panek et al.,14 and then latterly the Rb2PbO3 was again synthesized in 1977 by Hoppe and Stöver.15 From these earlier experimental studies, it was found that the K2PbO3, Rb2PbO3, and Cs2PbO3 existed in an orthorhombic structure with space group Cmc21 (no. 36). More recently, in 1982, Brazel and Hoppe synthesized the Li2PbO3 by decomposing K2Li6[Pb2O8] and reported a monoclinic structural symmetry (C2/c space group) for this compound.16 The interesting information about the Cmc21 symmetry materials of X2PbO3 is that in these structures, similar to the prototype Na2SiO3, and Na2GeO3, the presence of links between oxygen and Pb-atoms led to the formation of a three dimensional network of a tetrahedral chain of [PbO4]. The link forms the bridge-oxygen (BO) and non-bridge-oxygen (NBO), where alkali atoms such as X = K, Rb, and Cs are bonded.17 Therefore, K2PbO3 (KPO), Rb2PbO3 (RPO), and Cs2PbO3 (CPO) are non-centrosymmetric in structure, and consequently exhibit piezoelectric properties. Moreover, in case of Li2PbO3 (LPO) and Na2PbO3 (NPO), since the compounds are centrosymmetric, they do not possess piezoelectricity.
In the past few decades, experimental and theoretical insights into novel multi-function energy materials especially for TE and piezoelectric applications have become a hot topic among researchers.18–20 Thermoelectricity and piezoelectricity hold the requisite hallmarks for green energy resources as they produce electricity without any emissions of toxic pollutants. The glass-like materials possessing high mechanical and thermal stability, low lattice thermal conductivity (κL), high melting temperatures (Tm), ease of availability, and the cost-effectiveness have made these materials perfect candidates for multi-use energy generators. However, the presence of the toxic Pb-element in our proposed compounds i.e., X2PbO3 have made this topic more challenging. From various research articles, it has been observed that the toxicity offered by the Pb-element can be successfully minimized, and the prominent strategies for this include chelation therapy, nano-encapsulation, and N-acetylcysteine (NAC).21–23 A common strategy to reduce toxicity is the substitution of the Pb element with less toxic elements such as Sn and Pb. Since, both elements possess compatible ionic radii and electronic structures, they enable the replacement of Pb without major lattice distortions, while reducing the overall Pb content. Moreover, from a functional perspective, Sn-substitution is particularly attractive for energy-related applications because it retains the narrow band gap and high carrier mobility that are essential for optoelectronic and photocatalytic processes.24,25 However, for X2PbO3 materials, when X moves from Li → Cs, the environmental risk of X2PbO3 is expected to increase, as larger alkali ions weaken the glass network and facilitate Pb release. To reduce the energy crisis rendered by the global demands for energy sources, thermoelectricity and piezoelectricity could be an innovative approach although their efficiencies are low. From the recent study led by Zosiamliana et al.,26 the TE efficiencies at T = 1200 K for Pb-based perovskites such as PbTiO3, PbZrO3, and PbHfO3 were found to be ZT = 0.64, 0.66, and 0.61, revealing the suitability of Pb-based materials for TE devices. Also, recent reports reveal the relevancy of glass-like materials such as Na2SiO3 and Na2GeO3 (the prototype compounds for KPO, RPO, and CPO) for piezoelectric devices, with a response of e33 = 0.22 C m−2 and e33 = 0.91 C m−2, respectively.12,27,28 Experimentally and theoretically, only few research studies have been carried out on glass-like materials for TE applications. Recently, an efficiency of ZT = 0.027 at T = 393 K was reported for Na2SiO3 as a graphite/mixture (CuSO4 + CoOH + SiO2 + Na2SiO3)/aluminum by Chira et al.29 Thus, the unmet research area that needs to be addressed is the piezoelectric and TE applications of X2PbO3 glass-like materials.
As far as we know, from several literature surveys, only a few experimental and theoretical studies were conducted on these materials. Recently, the photo-catalytic use of these compounds for solar-to-hydrogen conversion was reported by Gelin and colleagues30 however, this failed to provide a comprehensive insight into the fundamental properties. As a result, the main focus of this work will be on the thorough analysis of the fundamental characteristics of X2PbO3 (X = Li, Na, K, Rb, Cs) and their applications for piezoelectric and TE materials employing hybrid-DFT.
2 Computational details
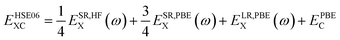
In this work we have performed density functional theory (DFT) calculations as implemented in the CRYSTAL17-code to evaluate the physical properties of X2PbO3. In this part of the DFT framework the crystal orbitals are described by the linear combination of Gaussian-type functions (GTF).31 The atomic centers for all the constituent atoms such as X = lithium (Li), sodium (Na), potassium (K), rubidium (Rb), and caesium (Cs), lead (Pb), and oxygen (O) were described by a revised triple-ζ valence plus polarization (TZVP) basis set.32,33 In this work, four different exchange–correlation functionals were adopted, namely; (1) the Perdew–Burke–Ernzerhof (PBE) generalized gradient approximation (GGA);34 global hybrids: (2) Becke 3-parameter Lee–Yang–Parr (B3LYP),35,36 and (3) PBE with 25% Fock exchange (PBE0);37 and (4) the range-separated hybrid screened-Coulomb (SC) called HSE06.38
The expressions for the employed hybrid functionals are:39
| | |
EB3LYPXC = ELSDAXC + a0(EexactX − ELSDAX) + aXΔEB88X + aCΔEPW91C
| (1) |
Here,
a0,
aX, and
aC are semi-empirical coefficients,
ELSDAXC is the local spin density exchange–correlation,
EexactX is the exact exchange energy, Δ
EB88X is Becke’s gradient correction for exchange, and Δ
EPW91C is the Perdew and Wang gradient correction.
| |
 | (2) |
Here, the full PBE correlation energy and the 3
![[thin space (1/6-em)]](https://www.rsc.org/images/entities/char_2009.gif)
:
1 ratio of PBE to HF exchange energies determine the PBE0 functional.
| |
 | (3) |
where,
ω = 0.2 is the screening parameter,
ESR,HFX represents the short-range Hartree–Fock exact exchange functional,
ESR,PBEX, and
ELR,PBEX are the short-range, and long-range PBE exchange functionals, respectively, and
EPBEC is the full correlation energy.
For the structural optimizations, an analytical quasi-Newtonian approach combined with Hessian Broyden–Fletcher–Goldfarb–Shanno (BFGS) scheme was used.40,41 To check the convergence, the gradient components and nuclear displacements with tolerances on their root-mean-square (RMS) were set to 0.0001 and 0.0004 Hartree (Ha), respectively. The accuracy of the convergence criteria was set to the five thresholds which control the overlap and penetration of the Coulomb integrals; the overlap for HF exchange integrals, and the pseudo-overlap were set to (10−7, 10−7, 10−7, 10−7, 10−7, 10−14). The first Brillouin zone integration was performed using a 10 × 10 × 10 k-mesh within the Monkhorst–Pack scheme,42 and an energy convergence criteria of 10−7 Ha was considered. Then, to ensure that the optimized geometries correspond to true minima on the potential energy surface (PES), we conducted an equation-of-state (EOS) analysis on the optimized structures. The total energy as a function of cell volume was examined to confirm that the optimized configurations correspond to the lowest point (global minimum) on the energy–volume curve, thereby validating the structural stability and energetic consistency of the obtained geometries. For the calculation of the physical properties we have set the higher k-mesh of 12 × 12 × 12. For the calculation of the elastic and piezoelectric properties, we have opted for the best suited exchange–correlation functionals depending on the accuracy in reproducing the experimental lattice parameters. To verify the structural stability, we performed an ab initio molecular dynamics (AIMD) simulation with an nVT canonical ensemble (calculation details are provided in Section 3.1).43–45
For the TE properties calculation, the Boltzmann transport semi-classical equation (BTE) within a rigid band approximation (RBA) using BoltzTraP as implemented in the CRYSTAL17-code was employed.7,46,47 The wave functions were recalculated at a dense k-mesh of 42 × 42 × 42 within the first Brillouin zone. A constant relaxation time approximation (CRTA) for carriers was assumed for all the investigated compounds, and fixed at τ = 10−14 s (default τ for BoltzTraP-code).
3 Results and discussions
3.1 Structural properties and stability
The structural optimization results using various adopted functionals such as PBE-GGA, B3LYP, HSE06, and PBE0 reveal that the investigated compounds X2PbO3 crystallized in monoclinic symmetry (C2/c space group) for X = Li, and Na, and in an orthorhombic structure (Cmc21 space group) for X = K, Rb, and Cs [see Fig. 1]. The agreements between the calculated lattice constants and the available experimental data for each compounds are presented in Table S1. For LPO, KPO, RPO, and CPO the global hybrid-PBE0 functional is found to be the most relevant functional in reproducing the experimental data with |Δa|, |Δb|, and |Δc| < 2%, as it is known that the global hybrid-PBE0 functional reproduces better lattice parameters and the electronic band structure of small or large band gap solids. It is important to remain aware that the stability of the studied systems will be impacted if the lattice constant’s precision deviates by more than 2%.26 From the formation energy (Ef) calculations using eqn (4), a negative Ef reveals the ground state structural stabilities for all the considered systems in their corresponding phases, and implies a possible realization of their experimental synthesis. Furthermore, a greater negative Ef is observed for each compound with the PBE0 functional, suggesting this functional is the most favored to acquire the energy ground state. As a result, each compound’s optical, elastic, and piezoelectric properties are investigated using the PBE0 functional. However, the electronic and TE properties are explicitly calculated using the four different adopted functionals in order to verify the role played by exchange–correlation functions during the study of TE properties.| |
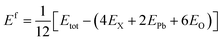 | (4) |
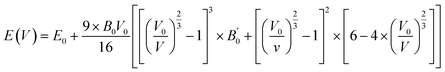
Here, Etot is total ground state energy, and EX, EPb, and EO are the corresponding single atom ground state energies for the X, Pb, and O atoms. Since there are 12 atoms in the unit cell, the right hand side (RHS) of eqn (4) is divided by 12. To obtain the most stable configurations for all the examined systems, total energies versus the unit cell volumes were fitted through the Birch–Murnaghan equation of states (EOS) scheme given by eqn (5) using the PBE0 functional.49,50 From the depicted smooth parabolic curves in Fig. 2, the energy difference where E − E0 = 0 eV corresponds to the most stable structure.| |
 | (5) |
 |
| | Fig. 1 The C2/c (X = Li, Na), and Cmc21 (X = K, Rb, Cs) structures of X2PbO3 viewed using an external program called VESTA.48 | |
 |
| | Fig. 2 Energy vs. volume curves of X2PbO3 (X = Li, Na, K, Rb, Cs) calculated using the Birch–Murnaghan’s EOS curve fitting method. Here, E0 is ground state energy. | |
To verify the thermal and dynamic stabilities of the studied systems, we have performed molecular dynamics (MD) simulations for each of the relaxed conventional cell structures (i.e., two times the number of atoms in the unit cell) both at room temperature and at T = 850 K, and the phonon dispersion curve calculations. Since MD simulations cannot be performed using the CRYSTAL17-code, throughout this computational process the QuantumATK Q-2019.12 code, which relies on a linear combination of the atomic orbital method (LCAO) with the canonical ensemble (nVT) based on Nosé–Hoover thermostat, was adopted.51–53 A 12 ps total simulation time with 4 fs time step for room temperature stability and a 5 ps total simulation time for T = 850 K were considered during the simulations for all the structures. The graphical representation of the MD simulations (see Fig. 4 and S16) calculated in nVT ensemble where the number of atoms, cell volume, and temperature are constant provides a more realistic insight into the evolution of energies (PE, and KE), and temperature (T). Here, PE and KE represent the sum of energies from non-bonded and bonded interactions, and the heat absorbed by the systems, respectively. The higher evolution of T with time suggests more movement of the atoms, thereby resulting in more fluctuation of the KE. The nearly linear fluctuations of PE, KE, and T even up to 12 ps time steps reveals the thermal stability for all the investigated materials at room temperature and the nearly linear fluctuation of the MD parameters at T = 850 K verified the thermal stability at the higher temperature range. To verify the dynamic stability of the studied systems, we have presented the GGA calculation of the lattice dynamics with their relaxed structures. The graphical representation of the phonon dispersion curve within the first Brillouin zone is shown in Fig. 3. Due to the presence of 24 atoms in a conventional cell, we can have 72 vibrational modes of phonons at any q-point, consisting of three acoustic modes and 69 optical modes. The absence of imaginary phonon frequencies for NPO confirms the dynamic stability, while for other systems, imaginary phonon frequencies (≤0.25 THz) at some q-points, suggested that they are dynamically unstable. However, such low imaginary phonon frequency values could arise from numerical noise during the calculation process. Also, negative phonon frequencies in glass-like materials (the generic nature of glass materials) indicate the presence of soft vibrational modes, consistent with their tendency toward amorphous or disordered configurations. They can also partly arise from computational limitations in modeling inherently non-periodic systems using periodic boundary conditions.
 |
| | Fig. 3 Phonon dispersion curves of X2PbO3: (a) X = Li, (b) X = Na, (c) X = K, (d) X = Rb, and (e) X = Cs. | |
 |
| | Fig. 4 The potential energy (PE), kinetic energy (KE), and evolution of temperature (T) as a function of time steps calculated using MD simulations based on a nVT-canonical ensemble: (a–c) X = Li, (d–f) X = Na, (g–i) X = K, (j–l) X = Rb, and (m–o) X = Cs. | |
3.2 Electronic properties
The emergence of physical properties can be understood by interpreting electronic properties with regard to orbital interactions at the atomic level. In this section, we have studied the electronic properties which includes band structures, density of states (DOS), and atomic charge transfer (QT) using PBE-GGA, B3LYP, HSE06, and PBE0 functionals. The presented band structures, and DOS calculated using the PBE0 functional in Fig. 5 and 6 (for PBE-GGA, B3LYP, and HSE06 see Fig. S1 and S2), and the energy gap (Eg) at the high symmetry points given in Table 1, revealed the indirect semi-conducting band gap nature for LPO, and NPO with the top and bottom of the valence and conduction bands lying at the A and Γ-symmetry points. For KPO, RPO, and CPO, Eg are along the Γ-symmetry suggesting a direct band gap semiconductor behavior. The incorporation of hybrid functional flavors during the electronic properties calculations has a significant effect on the Eg due to the shifts in the energy levels, however, the energy band profiles are preserved. Evidently, from Table 1, since the C2/c-X2PbO3 compounds have distinct local coordination environments and Pb–O network conductivities compared to those of the Cmc21-X2PbO3 compounds, in the C2/c-X2PbO3 structures, the Pb–O bonds experience stronger octahedral distortion and shorter Pb–O bond lengths, leading to enhanced Pb–O orbital overlap. This stronger hybridization raises the valence band maximum and narrows the Eg. Hence, within the C2/c structures, the smaller cation X = Li experiences increasing overlap and reducing Eg compared to X = Na, while in the Cmc21-X2PbO3 structures, there is a less distorted Pb–O framework and more symmetric coordination geometry. They have reduced Pb–O orbital overlap and weakened Pb–O hybridization, which lowers the valence band maximum and increases the Eg. Thus, within Cmc21 structures, Eg increases with increasing ionic radius because the structure becomes more open and less covalently bonded. Comparing the obtained Eg with the recent report led by Gelin et al.,30 where Eg were recorded for the C2/c symmetry of Li2PbO3, P63/mmc symmetry of K2PbO3, Pnma symmetry of Rb2PbO3, and Cmc21 symmetry of Cs2PbO3 using GGA and GGA+U approximations, one can find that these reported Eg accord well with our results.
 |
| | Fig. 5 Calculated band structures for X2PbO3 using the PBE0 functional: (a) X = Li, (b) X = Na, (c) X = K, (d) X = Rb, and (e) X = Cs. | |
 |
| | Fig. 6 Calculated DOS for X2PbO3 using the PBE0 functional: (a) X = Li, (b) X = Na, (c) X = K, (d) X = Rb, and (e) X = Cs. | |
Table 1 Electronic band gap (Eg) (in eV), and atomic charge transfer (QT) (in |e|) using Mulliken population analysis for X2PbO3 (X = Li, Na, K, Rb, Cs)
| X |
Eg |
QTX |
QTPb |
QTBO |
QTNBO |
|
Eg |
QTX |
QTPb |
QTBO |
QTNBO |
| |
PBE-GGA |
|
B3LYP |
| Li |
0.88 |
0.54 |
1.71 |
−0.95 |
−0.92 |
|
2.27 |
0.65 |
1.99 |
−1.10 |
−1.09 |
| Na |
0.53 |
0.74 |
1.49 |
−1.01 |
−0.98 |
|
1.83 |
0.82 |
1.76 |
−1.15 |
−1.12 |
| K |
1.23 |
0.71 |
1.34 |
−0.93 |
−0.92 |
|
2.94 |
0.75 |
1.55 |
−1.01 |
−1.01 |
| Rb |
1.45 |
0.77 |
1.27 |
−0.95 |
−0.93 |
|
3.08 |
0.81 |
1.47 |
−1.03 |
−1.02 |
| Cs |
1.53 |
0.77 |
1.24 |
−0.95 |
−0.92 |
|
3.13 |
0.82 |
1.43 |
−1.03 |
−1.02 |
| |
| |
HSE06 |
|
PBE0 |
| Li |
2.23 |
0.61 |
2.01 |
−1.08 |
−1.07 |
|
2.82 |
0.61 |
2.04 |
−1.09 |
−1.08 |
| Na |
1.79 |
0.81 |
1.77 |
−1.15 |
−1.12 |
|
2.34 |
0.82 |
1.80 |
−1.16 |
−1.13 |
| K |
2.84 |
0.75 |
1.57 |
−1.03 |
−1.03 |
|
3.50 |
0.75 |
1.59 |
−1.03 |
−1.03 |
| Rb |
3.02 |
0.82 |
1.50 |
−1.05 |
−1.04 |
|
3.67 |
0.82 |
1.51 |
−1.05 |
−1.04 |
| Cs |
3.09 |
0.81 |
1.47 |
−1.03 |
−1.02 |
|
3.72 |
0.81 |
1.48 |
−1.03 |
−1.03 |
Insight into the general distribution of electronic states at different energy levels and the electronic charge distributions upon the formation of bonds are gained through the analysis of DOS and Mulliken population analysis.54 From the DOS plots, it is comprehensible that for all the studied compounds, the main contributing states near the Fermi level (EF) along the valence band region are from the O-p states, while the major contributions along the conduction region are from the complex hybridized states of X-s, Pb-p, and O-p, which are analogous to those closely related glass-like materials such as Li2SiO3, Na2SiO3, Li2GeO3, and Na2GeO3.12,27,55,56 For each compound, from the relatively greater atomic concentrations of NBO than BO, and from the simple altercation of on-site Coulomb repulsion, the NBO-p orbitals which have greater energy (or lower binding energy) are likely to have larger valence charges than BO-p orbitals. Therefore, among the two prominent DOS peaks along the valence region found between −5 eV and 0 eV, the first peak which is closer to the EF is mainly from NBO-p contributions, while the second peak which is at the lower energy region is predominantly contributed by BO-p. Furthermore, from the data of the Mulliken population analysis of the relative atoms’ charge distributions calculated from different adopted functionals presented in Table 1, the X and Pb atoms transfer charges while the NBO and BO atoms accumulate them for all the considered systems. By establishing a correlation between the charge transfer and DOS, it is possible to clarify the impact of various functionals on the electronic properties calculation. For LPO, and NPO, from the DOS plots it is possible to notify that the total DOS (TDOS) contribution near EF is comparatively higher with the PBE-GGA functional when compared to other adopted functionals. This is mainly due to a significant change in QT between the PBE-GGA and hybrid functionals’ calculated results. With hybrid functionals the charge accumulated by the BO and NBO becomes larger suggesting a lower number of unoccupied states, which subsequently reduces the TDOS contribution around EF. However, for KPO, RPO, and CPO an opposite phenomenon of the PBE-GGA estimated TDOS exhibiting a lower contribution near EF than those hybrid functionals employed is observed, even-though QT for BO and NBO becomes larger with hybrid functionals. The structural arrangements of the materials can provide insight into the reason behind this behavior. The X–BO and X–NBO bond lengths in the C2/c symmetry compounds (i.e., X = Li and Na) are identical, while they are unequal in the Cmc21 symmetry compounds (i.e., X = K, Rb, and Cs). The difference in the structural arrangements of these materials for C2/c and Cmc21 symmetry compounds is the key factor for the non-centrosymmetric nature of the KPO, RPO, and CPO compounds.
Fig. S15 illustrates the two-dimensional differential charge density map for the investigated compounds, providing profound insights into the charge distribution among the X–BO/NBO, Pb–BO/NBO, and X–Pb interactions. The visualization highlights charge depletion in red and charge accumulation in blue, reflecting the redistribution of electron density within the system. This charge rearrangement plays a crucial role in elucidating the relationship between charge transfer mechanisms and electronic band structures, particularly concerning electron transitions from the valence band to the conduction band through the electronic band gap. In each case, X and Pb atoms predominantly act as electron donors, leading to localized charge depletion in their vicinity. In contrast, oxygen atoms, due to their higher electronegativity, attract electron density, resulting in significant charge accumulation around O-sites. This pronounced electron localization at oxygen centers underscores their function as electron-rich species, thereby influencing the overall electronic structure and bonding nature of the studied materials. The observed charge density differences align well with other electronic properties, including the calculated density of states (DOS) and Mulliken population analysis. Furthermore, while no substantial variations are observed between the employed functionals, noticeable differences arise when comparing the C2/c-X2PbO3 and Cmc21-X2PbO3 phases. Specifically, the C2/c-X2PbO3 structure exhibits a more pronounced presence of red and blue regions than the Cmc21-X2PbO3 phase, indicating stronger charge transfer interactions. This suggests a more significant charge redistribution in the C2/c system, highlighting its enhanced electronic polarization and bonding characteristics. Also, the analysis of the electronic structure has been expanded to correlate the observed trends with underlying Pb–O bonding and orbital hybridization. The variations in Eg are attributed to the interplay between Pb–O covalency, cation size, and crystal symmetry, where enhanced Pb–O hybridization in the C2/c phase narrows the Eg, while reduced overlap in the Cmc21 phase widens it.57 Charge-density and DOS analyses confirm the dominant Pb-6s/O-2p contributions near the band edges. These electronic features govern carrier transport and suggest that structural or compositional tuning could optimize the X2PbO3 compounds for thermoelectric, sensor, or optoelectronic applications.58
3.3 Optical properties
To interpret the interaction between electromagnetic radiation and the studied X2PbO3 materials, we have explored the optical properties by calculating the complex dielectric constants (ε), extinction coefficient, refractive index, reflectivity, and absorption coefficient as a function of photon energy using the PBE0 functional. It is known that at higher frequencies, ε is divided into two parts, namely; the real part (ε1), and the imaginary part (ε2) [see eqn (6)].59
For calculating other optical parameters like extinction coefficient (k), refractive index (η), reflectivity (R), and absorption coefficient (α), the employed formulae are:
| |
 | (7) |
| |
 | (8) |
| |
 | (9) |
| |
 | (10) |
The ε1 which is closely interrelated with η determines the amount of material polarization and dispersion of electromagnetic radiation when interacting with the material surface [see Fig. 7(a) and (d)]. The calculated static real dielectric constants ε1(0) are in the order of LPO > NPO > CPO > RPO > KPO, with values in the range of 2.80 to 3.90 arb. unit, for all x, y, and z-axes. The ε1(0) for the investigated materials are all higher than those of glass-like materials such as Na2SiO3, whose values is in the range of 1.00 to 1.40 arb. unit, while for Na2GeO3, ε1(0) is comparable with X2PbO3, whose value is ∼3.00 arb. unit.12,27 Along the x-axis, the first prominent peaks for εx1 are found within 3.0 to 4.5 eV and undergo blue shifting as X goes from Na → Li → Cs → Rb → K. This indicates that the maximum probable interaction with electromagnetic radiation not only differs but also varies across frequency ranges for each compound. Among all the investigated systems, higher static refractive index η(0) values are observed for X = Li, and Na than when X = K, Rb, and Cs, with η(0) values ranging from 1.5 to 2.0, revealing that they are translucent in nature. Corresponding to ε1, the curves of η show similar trends. The decreasing refractive indices at higher photon energy region i.e., beyond 8 eV, reveals that the electromagnetic radiation no longer has sufficient energy to interact electronically with the material’s electron.
 |
| | Fig. 7 Calculated optical properties of X2PbO3 (X = Li, Na, K, Rb, Cs) using the PBE0 functional: (a) real part of dielectric constant (ε1), (b) imaginary part of dielectric constant (ε2), (c) extinction coefficient (k), (d) refractive index (η), (e) reflectivity (R) and (f) absorption coefficient (α). | |
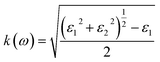
The ε2 which is closely related to the k and α corresponds to the inter-band transition between the valence and conduction bands. From Fig. 7(b), on analyzing the direction-wise behavior of ε2, it is noticeable that ε2 is highly anisotropic in nature. Clearly, one can find two prominent peaks of ε2 for each compound along the x and z-axes, and three distinct peaks in the y-axis. Along the x-axis, the first prominent peaks of εx2 are blue shifted as X moves from Li → K → Cs → Rb → Na. The extinction coefficient (k) which determines the materials capacity to absorb radiation of a specific wavelength is depicted in Fig. 7(c). The obtained minimum threshold energies for X = Li, Na, K, Rb, and Cs are 3.51, 2.33, 3.46, 3.62, and 3.69, respectively, and correspond to their respective optical band gaps. Meanwhile, when compared to other glass-like materials such as Na2SiO3 (ε2 = 2.5 eV) and Na2GeO3 (ε2 = 3.2 eV), our investigated materials exhibit a higher optical threshold energy. This indicates that these materials are likely to exhibit a stronger response in the higher visible-to-ultraviolet (vis–UV) spectral region. The optical band gaps for X = Na, K, Rb, and Cs, agree well with the first direct electronic transition from the top of the valence band (O-p state, specifically NBO-p state) to the bottom of the conduction band (X-s state) along the Γ-symmetry. However, for X = Li the optical band gap is due to the direct electron transition from the third band of the valence band (O-p state) to the bottom of the conduction band (Li-s state) along the Γ-symmetry. Along the x-axis, the respective first prominent peaks of kx for X = Li, Na, K, Rb, and Cs are located within the region 4.50 to 6.00 eV. This corresponds to the first inter-band transition between the valence band and conduction band along the A-symmetry point for LPO, and NPO, and for KPO, RPO, and CPO, the transition is along the Z-symmetry.
The main motive for exploring the optical properties is to determine the reflectivity and the optical absorption [see Fig. 7(e) and (f)]. From the reflectivity spectra as a function of the photon energy, similar to the other optical property parameters, a highly anisotropic trending of the reflectivity curves is found for each compound. The static reflectivity (R(0)) values being lower than 0.1 along x, y, and z-axes reveals the semi-conducting behavior of the considered systems. Between 0 and 4.0 eV photon energy, each compound shows increasing reflectivity with energy and then beyond 4.0 eV, drastically fluctuating reflectivity profiles are observed. Since the maximum reflectivity even at higher photon energy regions (i.e., within the ultra-violet region) is less than 25%, it indicates that the examined materials should be good high energy electromagnetic radiation absorbers rather than reflectors. From the curve of the absorption coefficient as a function of photon energy which is consistent with other optical properties such as ε2 and k, one can observe a rapid increase of absorption from ∼3.0 eV photon energy. For each compound, along the x, y, and z-axes the first promising optical absorptions are in the region of 4.0 to 5.0 eV. Since the most active optical absorptions for all the studied materials fall within the UV-region with α > 1 × 105 cm−1, these compounds might be a potential candidates for optical materials that can serve as UV-radiation shielding materials.
3.4 Elastic properties
For practical applicability particularly in the field of piezoelectric and TE applications, the crystalline materials’ strength which is interpreted from the elastic properties plays a key role. In this regard, we report the elastic constant (Cij) and other mechanical properties of X2PbO3. Since the investigated compounds exist in a monoclinic phase for X = Li, and Na, and orthorhombic phase for X = K, Rb, and Cs, we have ten elastic constants [see Table 2]. The necessary and sufficient conditions for the studied systems to become mechanically stable called Born criteria are given below:60,61
Table 2 Calculated elastic constants Cij (in GPa) of X2PbO3 (X = Li, Na, K, Rb, Cs) using the PBE0 functional
| X |
C11 |
C22 |
C33 |
C44 |
C55 |
C66 |
C12 |
C13 |
C23 |
C46 |
| Li |
155.99 |
202.51 |
230.62 |
67.19 |
47.69 |
54.42 |
50.38 |
34.38 |
67.17 |
−11.63 |
| Na |
136.52 |
170.85 |
183.30 |
70.52 |
49.14 |
59.95 |
46.12 |
40.96 |
59.79 |
8.06 |
| K |
83.28 |
57.12 |
131.37 |
25.30 |
9.52 |
16.44 |
32.04 |
13.19 |
31.84 |
0.00 |
| Rb |
74.45 |
63.81 |
117.98 |
26.76 |
7.17 |
13.32 |
31.59 |
11.35 |
31.19 |
0.00 |
| Cs |
74.09 |
62.86 |
102.86 |
26.99 |
2.52 |
13.78 |
30.15 |
16.55 |
26.87 |
0.00 |
For the monoclinic phase, the criteria are:
| |
 | (11) |
For the orthorhombic phase, the criteria are:
| |
 | (12) |
Since the calculated elastic constants Cij of the X2PbO3 compounds meet the above mentioned stability criteria, they are mechanically stable. In Table 2, the C11, C22, and C33 determine the system’s stiffness in relation to fundamental stresses while C44, C55, and C66 give their resistance against shear deformation. From the constants C11, C22, and C33 ≫ C44, C55, and C66 it can be understood that the compounds X2PbO3 tend towards greater resistance to axial compression than shear deformation, which is re-confirmed by the fact that bulk moduli (B) are greater than shear moduli (G). Also, the high dissimilarity values of Cij reveals that each compound possesses anisotropic single-crystal elastic behavior. Additionally, our results for the elastic constants also suggest that among the investigated X2PbO3 materials, the C2/c-X2PbO3 structured compounds show greater anisotropic elastic nature compared to those with the Cmc21-X2PbO3 structure. Herein, the elastic moduli: the bulk modulus (B), Young’s modulus (Y) and shear modulus (G) given in Table 3 are determined in terms of Voigt, Reuss, and Hill assumptions, which measure the uniform strain, uniform stress, and their average, respectively.62–64 The larger atomic size of X as it goes from Li → Na for the C2/c structure and from K → Rb → Cs for the Cmc21 structure reduces the incompressibility and resistance to volume changes due to the increasing lattice parameters which subsequently increases the inter-atomic distances, and consequently, causes B to reduce. In a similar vein, the resulting Y and G likewise decrease correspondingly. This implies that the studied compounds are soft, flexible, or easier to stretch as X moves down the group. Analyzing the brittleness or ductility based on calculations of Poisson’s (ν) (estimated using Voigt, Reuss, and Hill assumptions) and Pugh’s ratios (k) (estimated by Hill assumption only) evaluated using eqn (13) and tabulated in Tables 3 and 4, indicates that the C2/c-X2PbO3 structured compounds are brittle in nature, while the Cmc21-X2PbO3 structured compounds are ductile. The ductility behavior is in the order of CPO > RPO > KPO > (k = 1.75 or ν = 0.28) > LPO > NPO, where k = 1.75 and ν = 0.28 are the critical values for Pugh’s ratio and Poisson’s ratio such that the materials become ductile.
| |
 | (13) |
Table 3 Elastic moduli (bulk modulus (B), Young’s modulus (Y), and shear modulus (G) all in GPa units), and Poisson’s ratio (ν) (unitless) using the PBE0 functional. Here, the subscripts V, R and, H represent Voigt, Reuss and Hill assumptions, respectively
| X |
BV |
BR |
BH |
YV |
YR |
YH |
GV |
GR |
GH |
νV |
νR |
νH |
| Li |
99.22 |
87.11 |
93.17 |
156 |
132.71 |
144.36 |
63.01 |
53.25 |
58.13 |
0.24 |
0.25 |
0.24 |
| Na |
87.16 |
80.48 |
83.82 |
144.10 |
134.08 |
139.09 |
58.84 |
54.85 |
56.84 |
0.22 |
0.22 |
0.22 |
| K |
47.32 |
44.56 |
45.94 |
59.89 |
45.85 |
52.95 |
23.23 |
17.26 |
20.24 |
0.29 |
0.33 |
0.31 |
| Rb |
44.95 |
43.63 |
44.29 |
55.83 |
40.16 |
48.14 |
21.59 |
14.91 |
18.25 |
0.29 |
0.35 |
0.32 |
| Cs |
42.98 |
42.26 |
42.62 |
51.37 |
23.86 |
38.14 |
19.74 |
8.49 |
14.11 |
0.30 |
0.4 |
0.35 |
Table 4 Pugh’s ratio (k) (unitless) in Hill’s approximation, velocity of sound (v) (in km s−1), density (ρ) (in g cm−3), Kleinman coefficient (ζ) (unitless), anisotropic factor (Aan) (unitless), machinable factor (µm) (unitless), melting temperature (Tm) (in K), Debye temperature (Θ) (in K), and Frantsevich ratio (G/B). Here, the subscripts t, l and av represent transverse, longitudinal and average velocities, respectively
| X |
kH |
vt |
vl |
vav |
ρ |
ζ |
Aan |
µm |
Tm ± 300 |
Θ |
G/B |
| Li |
1.60 |
2.89 |
4.86 |
3.20 |
6.94 |
0.47 |
1.96 |
1.39 |
1475.06 |
432.07 |
0.62 |
| Na |
1.47 |
2.95 |
4.94 |
3.26 |
6.53 |
0.48 |
2.29 |
1.19 |
1359.97 |
415.51 |
0.65 |
| K |
2.27 |
2.04 |
3.87 |
2.28 |
4.87 |
0.52 |
1.77 |
1.82 |
1045.27 |
254.71 |
0.43 |
| Rb |
2.43 |
1.78 |
3.46 |
1.99 |
5.74 |
0.56 |
1.75 |
1.65 |
993.07 |
216.38 |
0.41 |
| Cs |
3.02 |
1.50 |
3.12 |
1.69 |
6.29 |
0.54 |
2.06 |
1.58 |
990.95 |
177.17 |
0.33 |
The information about internal deformation stability and anisotropic factors can be gained through the Kleinman coefficient (ζ) and elastic anisotropic factor (Aan) calculated using eqn (14) and presented in Table 4.65,66 The ζ which is in the range 0 ≤ ζ ≤ 1 represents stretching and bending of bonds; a value of ζ closer to 1 indicates a negligible contribution of bond stretching. Clearly, for C2/c-X2PbO3 structured compounds, the mechanical strength is mostly contributed by bond stretching, while for Cmc21-X2PbO3 structured compounds it is mainly due to the contribution from bending of bonds. Since the obtained Aan is larger than 1 for all the considered systems, they are highly anisotropic in nature (Aan = 1 represents isotropic).
| |
 | (14) |
In this novel work, the main requirement for calculating elastic properties is to check the material’s average sound velocity (vav) determined from the transverse and longitudinal velocities (vt and vl), and the Debye temperature (Θ) calculated using eqn (15) and (16):67–69
| |
 | (15) |
where,

and

. Here,
ρ is density.
| |
 | (16) |
where,
h is the Planck’s constant,
k the Boltzmann constant,
n the number of atoms per formula unit,
NA is Avogadro’s number and
M the molecular mass.
From the results presented in Table 4, we observe a decreasing vav and Θ when X moves from Li → Na → K → Rb → Cs which is mainly due to the increasing atomic masses. For the Cmc21-X2PbO3 structures, the reported vav are lower than those analogous compounds such as Na2SiO3, and Na2GeO3 with vav = 4.02 km s−1 and 3.19 km s−1, respectively.28 As sound velocities are inversely proportional to the density [see eqn (15)], the larger values of ρ for the investigated compounds have resulted in the slower vav when compared with the Na2SiO3 and Na2GeO3 glass-like materials.12,27,28 The Debye temperature being higher for the C2/c-X2PbO3 structures than the Cmc21-X2PbO3 structures suggests a greater number of active phonon modes in the C2/c-X2PbO3.
For the application of any compounds in practice, particularly in the area of piezoelectric and TE applications, machinable factor (µm), Frantsevich ratio (G/B), and melting temperature (Tm) play a key role.70 The µm calculated by employing eqn (17) suggests that the investigated X2PbO3 compounds exhibit an acceptable level of machinability with lower feed forces and intermediate lubricating properties which makes them a potential candidate for piezoelectric materials. The high Tm and low Frantsevich ratio also reveal that these compounds could be a future TE materials which can be utilized at high temperatures.
| |
 | (17) |
3.5 Thermodynamic properties
Knowledge of the state of any system in terms of their energy can be gained through thermodynamic properties calculations. In this regard, we have reported the properties for X2PbO3 such as the constant volume specific heat (CV), change in vibrational internal energy (Evib), vibrational entropy (Svib), vibrational Helmholtz free energy (Avib), and the linear thermal expansion coefficient (αL) as a function of temperature based on the quasi-harmonic Debye model (eqn (18)).71–74 From this model,| |
 | (18) |
Here, D is the Debye integral, γ Gruneisen parameter,75 and BT isothermal bulk modulus defined as,| |
 | (19) |
where, ν is the Poisson’s ratio.
The intrinsic disorderliness which provides the degree of randomness within the studied systems can be determined from the study of their vibrational entropy (Svib). From Fig. 8(c), it can be seen that the C2/c-X2PbO3 compounds have lower Svib than those compounds with Cmc21-X2PbO3 structures. This reveals that in Cmc21-X2PbO3 compounds, the amounts of thermodynamic potential (thermal energy) available for doing useful work are higher than in the C2/c-X2PbO3 compounds. The deviation in Svib between the monoclinic and orthorhombic structures of X2PbO3 is mainly due to the variation in the structural and atomic arrangement, and the change in the X-atom component. Also, the increasing Svib for each compound with T suggests more vibrational states become available or accessible when the temperature escalates. In C2/c-X2PbO3 compounds, since the arrangement of atoms especially the bonding between alkali atoms with BO and NBO are identical, nearly equivalent Svib curves are obtained. Whereas, for the Cmc21-X2PbO3 compounds, the X bonding with BO and NBO are in different arrangements which leads to different internal energy contributions, thus showing distinct thermodynamic properties. Additionally, the values of Avib [see Fig. 8(d)] for the Cmc21-X2PbO3 compounds being lower than those of the C2/c-X2PbO3 compounds re-confirms the higher availability of thermal energy for doing useful work in the Cmc21-X2PbO3 structures. In Fig. 8(b), a linearly increasing Evib with T for both the C2/c and Cmc21-X2PbO3 structured compounds are observed. This is due to the gradual rising of atoms’ kinetic energy with the continuously increasing heat, which leads to more atomic vibrations. This subsequently results in a continuous escalation of vibrational internal energy.
 |
| | Fig. 8 Calculated thermodynamic properties using GGA formalism: (a) constant-volume heat capacity CV (J K−1 mol−1), (b) change in vibrational internal energy Evib (kJ mol−1), (c) vibrational entropy Svib (J K−1 mol−1), (d) vibrational Helmholtz free energy Avib (kJ mol−1), and (e) linear thermal expansion coefficient α (K−1) as a function of temperature. | |
Comprehension of the lattice vibrational characteristics comes from the study of specific heat (CV) which is one of the focal points for thermodynamic properties’ investigation. The CV curves as a function of temperature for X2PbO3 materials are presented in Fig. 8(a). Evidently, the curves of CV showed similar trending to the nature of other thermodynamic properties parameters plots’ mentioned above. The higher value of CV for Cmc21-X2PbO3 structures reveals more heat can be stored with a small gradation in the temperature compared to the same for C2/c-X2PbO3 structures. At low temperatures (T ≪ Θ), the CV curves for each compound vary proportionally to T3, i.e., it follows the Debye’s T3 law [see eqn (20)],
| |
 | (20) |
However, at high temperatures (T ≫ Θ), the CV tends to Dulong–Petit limit [see eqn (21)],
where
R = 8.314 J K
−1 mol
−1 is the universal gas constant.
An analysis of the linear thermal expansion coefficient (αL) which is closely related to the Young’s modulus estimated in the Voigt assumption (uniform strain assumption), yields information about the relationship between the strain that any material endures as a temperature varies. Evidently, from the αL plot presented in Fig. 8(e), one can find that the expansion experienced by the C2/c-X2PbO3 compounds is nearly twofold to threefold lower than that of the Cmc21-X2PbO3 compounds. The fact that the Young’s modulus is lower in Cmc21-X2PbO3 compounds than C2/c-X2PbO3 compounds is a key factor for obtaining higher αL for Cmc21-X2PbO3 structures. A comparison of the thermodynamic parameters (Svib, CV and αL) for the investigated compounds with some other glass-like materials such as Na2SiO3 and Na2GeO3 is given in Table 5. Clearly, the investigated compounds are thermally more stable at room temperature since they exhibit higher Svib and CV than those of the Na2SiO3 and Na2GeO3 glass-like materials. Also, the lower expansion coefficient of X2PbO3 than Na2GeO3 reveals that the continuous increasing heat will have a reduced effect on the studied X2PbO3 when compared with Na2GeO3.
Table 5 Comparison table of Svib (in J K−1 mol−1), CV (in J K−1 mol−1), and αL (in K−1) at T = 300 K for X2PbO3 (current work), Na2SiO3 and Na2GeO3
| Compounds |
Svib |
CV |
αL |
| This work |
| C2/c-Li2PbO3 |
167.26 |
134.59 |
18.55 × 10⁻⁶ |
| C2/c-Na2PbO3 |
170.72 |
135.77 |
15.35 × 10⁻⁶ |
| Cmc21-K2PbO3 |
265.76 |
145.77 |
39.59 × 10⁻⁶ |
| Cmc21-Rb2PbO3 |
248.48 |
144.59 |
26.21 × 10⁻⁶ |
| Cmc21-Cs2PbO3 |
291.68 |
146.35 |
33.18 × 10⁻⁶ |
| |
| Other’s work |
| Cmc21-Na2SiO3 (ref. 76) |
112.50 |
109.50 |
— |
| Cmc21-Na2GeO3 (ref. 12) |
163.50 |
133.90 |
2.25 × 10⁻⁵ |
3.6 Piezoelectric and electromechanical coupling properties
As a green method of energy conversion, piezoelectricity has attracted much attention among researchers. Piezoelectric materials may prove to be a viable and sustainable source of energy if an efficient device of high mechanical stress to atomic scale polarization can be discovered. As mentioned in Sections 1 and 3.2, due to the centrosymmetric nature of C2/c-X2PbO3 structures, the compounds LPO, and NPO do not possess piezoelectricity. Therefore, in this section, we will be focusing on the piezoelectric properties for the Cmc21-X2PbO3 materials, calculated based on PBE0 functionals, only i.e., the most relevant functional in reproducing experimental lattice parameters for the investigated systems. In this work, piezoelectric tensors are computed using two different methodologies. Firstly, the direct and converse piezoelectric tensors are estimated through the numerical Berry phase (BP) approach which rely on the modern theory of polarization.77 According to BP approach [see eqn (22)],| |
 | (22) |
Here, eiν is the direct piezoelectric tensor, e electron charge, V volume, ali is the ith Cartesian component of the lth direct lattice basis vector al, ϕl is numerical first derivatives of the BP, and ην the strain tensor. Also, i = x, y, z; ν = 1, 2, 3, 4, 5, 6 (1 = xx, 2 = yy, 3 = zz, 4 = yz, 5 = xz, 6 = xy).
The direct and converse piezoelectric tensors are again related by the formula [see eqn (23)]:
| |
 | (23) |
Secondly, the piezoelectric tensors are computed through an analytical approach based on the Coupled Perturbed Hartree–Fock/Kohn–Sham (CPHF/KS) scheme.78,79 Herein, in addition to the electronic term’s analytical computation, the internal-strain tensor is used to assess the nuclear-relaxation contribution instead of atomic coordinates’ numerical geometry optimizations at strained configurations. The employed equation [see eqn (24)] for determining the nuclear-relaxation contribution is:
| |
 | (24) |
Here,
Γaj,ν and
Z* are the displacement-response internal-strain tensor which describes first order atomic displacements as induced by a first order strain, and the tensors containing the dynamic Born effective charges, respectively [see
eqn (25)]:
| |
 | (25) |
where
uaj are Cartesian components of the displacement vector
ua of atom
a (
j =
x,
y,
z).
The calculated piezoelectric tensors for Cmc21-X2PbO3 materials are presented in Table 6 for the BP numerical approach and Table 7 for the CPHF/KS analytical approach. The direct (eiν) and converse (diν) piezoelectricity presented in Table 6 determine the change of polarization under a finite strain and the strain induced by an applied electric field. At first glance, it can be noticed that from Table 6, the maximum direct piezoelectric constant from BP approach reduces as X goes from K → Cs (magnitude only). The increasing atomic masses of X-atoms when going from K → Cs progressively reduces the distortion of atomic positions from their equilibrium positions, resulting in the dis-amplification of polarization tensor which reduces the piezoelectric constants. For X = K and Rb the maximum responses are e32 = −0.51, and 0.45 C m−2 with the response direction along z-axis due to strain ηyy. Here, the negative sign (i.e., for X = K) indicates a compressive strain that leads ηyy to a negative value. For X = Cs the maximum response is e33 = 0.16 C m−2, which is in the z-axis direction and due to ηzz strain.
Table 6 Total direct (eiν in C m−2 unit) and converse (diν in pm V−1 unit) piezoelectric properties of X2PbO3 (X = K, Rb, Cs) using the PBE0 functional computed based on a Berry-phase numerical approach
| X |
Direct |
Converse |
| e31 |
e32 |
e33 |
e24 |
e15 |
d31 |
d32 |
d33 |
d24 |
d15 |
| K |
0.32 |
−0.51 |
0.30 |
−0.29 |
0.29 |
9.70 |
−17.41 |
5.49 |
−11.53 |
30.90 |
| Rb |
−0.38 |
0.45 |
−0.28 |
0.20 |
−0.18 |
−10.63 |
14.86 |
−5.24 |
7.55 |
−24.71 |
| Cs |
−0.01 |
−0.03 |
0.16 |
0.02 |
0.00 |
−0.11 |
−1.13 |
1.83 |
0.59 |
0.08 |
Table 7 The electronic term (eeiν), nuclear term (eniν), total direct ‘proper’ piezoelectric constant (eiν = eeiν + eniν) (all in C m−2 unit), and electromechanical (EM) coupling factor (kiν) for X2PbO3 (X = K, Rb, Cs) using the PBE0 functional computed using the CPHF/KS analytical approach
| X |
Electronic term |
Nuclear term |
| ee31 |
ee32 |
ee33 |
ee24 |
ee15 |
en31 |
en32 |
en33 |
en24 |
en15 |
| K |
−0.02 |
0.10 |
−0.08 |
0.14 |
−0.05 |
0.36 |
−0.62 |
0.38 |
−0.43 |
0.34 |
| Rb |
0.02 |
−0.09 |
0.06 |
−0.11 |
0.05 |
−0.39 |
0.53 |
−0.34 |
0.31 |
−0.23 |
| Cs |
−0.01 |
0.03 |
−0.02 |
0.03 |
−0.02 |
0.28 |
−0.08 |
0.61 |
−0.03 |
0.00 |
| X |
Total |
EM coupling |
| e31 |
e32 |
e33 |
e24 |
e15 |
k31 |
k32 |
k33 |
k24 |
k15 |
| K |
0.34 |
−0.52 |
0.30 |
−0.29 |
0.30 |
0.41 |
0.63 |
0.36 |
0.36 |
0.39 |
| Rb |
−0.37 |
0.44 |
−0.28 |
0.20 |
−0.19 |
0.44 |
0.52 |
0.33 |
0.24 |
0.23 |
| Cs |
0.27 |
−0.05 |
0.60 |
0.01 |
−0.02 |
0.31 |
0.06 |
0.69 |
0.01 |
0.02 |
It is well-known that performing piezoelectric properties calculations in an analytical fashion using the internal-strain tensor of energy second-derivatives with respect to atomic displacements and lattice deformations in combination with the inter-atomic force constant Hessian matrix, i.e. CPHF/KS, approach shows better accuracy than performing the calculation through numerical geometry optimizations to relax atomic positions at actual strained lattice configurations, i.e. the BP approach. Therefore, more detailed calculations including the electronic (eeiν) and nuclear (eniν) terms, and the total direct ‘proper’ (eiν) piezoelectric constants through the CPHF/KS approach are reported in Table 7 for the Cmc21-X2PbO3 compounds. Evidently, each compound’s total direct ‘proper’ piezoelectric response contribution from the eeiν are negligibly small and also reduce as X moves from K → Cs. The degree of polarization reduced resulting from a decrease in electronegativity down the periodic table group, which suggests that the contribution of eeiν has diminished. Consequently, eniν accounts for the majority of each material’s total direct piezoelectric responses. Interestingly, the total direct and total direct ‘proper’ piezoelectric constants obtained from BP and CPHF/KS schemes agreed well for X = K, and Rb with deviations |eiν| < 0.02 C m−2. However, in the case of X = Cs, a comparatively high piezoelectric constant appears for e31 and e33 when CPHF/KS is adopted. This discrepancy may arise from the inherently more robust nature of the CPHF/KS scheme in evaluating eniν, as it explicitly accounts for the partitioning of the nuclear-relaxation contribution of the piezoelectric tensor into phonon-mode-resolved components, together with the enhanced ionic polarizability introduced by the larger Cs cation. In such cases, the Berry-phase formalism, which predominantly captures the macroscopic polarization response, tends to emphasize long-range ionic contributions, whereas the CPHF/KS approach, being more sensitive to local field effects, reflects short-range electronic–ionic interactions. Consequently, the disparity between the two methods becomes more pronounced in Cs2PbO3 than in its lighter alkali counterparts. Overall, the maximum piezoelectric constants attributed by each compound are higher than the α-quartz, a standard piezoelectric material, whose largest constant e11 is 0.15 C m−2 at room temperature and 0.07 C m−2 at 5 K.80 Also, compared to the analogous compounds such as Na2SiO3 and Na2GeO3, our results show better responses than for Na2SiO3 (e32 = 0.22 C m−2), however they are lower than for Na2GeO3 (e33 = 0.90 C m−2).12,28
The electromechanical (EM) coupling factors (kiν) calculated using eqn (26) are presented in Table 7.81 This determines the efficiency of a piezoelectric material i.e., the factor with which the materials convert mechanical energy into electrical energy or vice versa.
| |
 | (26) |
Here,
eiν are the piezoelectric constants,
C44 is the elastic constant (in Pa unit),
ε0 = 8.854 × 10
−12 F m
−1 is the absolute permittivity of free space and
ε1(0) is the real static dielectric constant.
Firstly, it can be noticed that the maximum kiν for each compound corresponds to the direction of their respective maximum piezoelectric constant. Even though the computed kiν shows its highest value for X = Cs with k33 = 0.69, the overall coupling factors when all the directions are taken into account is highest for X = K, with X = Rb serving as an intermediary. This reveals a better efficiency of the electromechanical transducer between the stated electric and elastic channels for X = K, and Rb. Since our results of the maximum kiν are higher than the quartz crystal82 with a highest electromechanical coupling coefficient of ∼0.29 in a direction which makes an angle of 73° with y axis in yz plane, the investigated Cmc21-X2PbO3 materials could be potential candidates which can serve as efficient piezoelectric materials.
3.7 Thermoelectric properties
The primary focus of this work is to identify the TE efficiency (ZT) of the investigated compounds, which is closely related to the electron transport properties such as Seebeck coefficient (S), electrical conductivity (σ), electron thermal conductivity (κe), and the lattice thermal conductivity (κL). For this particular calculation, we have considered not only the p-type and n-type doping, but also the TE properties along the x, y, and z-axes by employing four different functionals such as PBE-GGA, B3LYP, HSE06, and PBE0. Herein, calculations for the electron transport properties are performed using the Boltzmann transport equation (BTE) within the CRTA at fixed τ = 10 fs (10−14 s) using BoltzTraP.7 The employed formulae for thermoelectric parameter calculations are:83,84| |
 | (27) |
| |
 | (28) |
| |
 | (29) |
where, µ is the chemical potential or the Fermi level, E is the energy, f0 is the Fermi–Dirac distribution and Ξ is the kernel of the transport distribution function (TDF). Here, Ξ is further expressed as:| |
 | (30) |
where, vi,q(k) is the velocity of the ith band calculated along the Cartesian direction q, τ is the lifetime which is assumed to be constant according to the RTA. In the above equations, σ is the electrical conductivity, S is the Seebeck coefficient, and κe is the electronic thermal conductivity.
Here, the purpose for calculating the electronic transport properties is to obtain TE efficiency (figure of merit) ZT, given by
| |
 | (31) |
where,
κT is the total thermal conductivity and is equal to
κe +
κL. To determine the lattice contribution to the thermal conductivity (
κL), we employed the well-known Slack equation given by
85| |
 | (32) |
where, a constant

,
![[M with combining macron]](https://www.rsc.org/images/entities/i_char_004d_0304.gif)
is average atomic mass,
ΘD is the Debye temperature,
δ3 is the volume per atom,
γ is the Gruneisen parameter, and
n is the number of atoms per unit cell.
From the transport properties of electrons with respect to chemical potential (µ) presented in Fig. S2–S14, considering the direction-wise analysis, one can find that each of the transport properties for the investigated materials are highly anisotropic in nature with the z-axis the most preferable direction for achieving maximum TE efficiency except for in LPO where it is obtained along x-axis. Also, from these plots, it can be deduced that all of the compounds under investigation exhibit a p-type semi-conducting nature, with holes serving as the majority of carriers, regardless of the functionals employed. With hybrid functionals, each compound’s Eg increases which in turn raises the (E − µ) term of eqn (28). This subsequently maximizes the Seebeck coefficient (S) computed using hybrid-DFT when compared to the PBE-GGA results [see Fig. S9–S11]. Also, on analyzing and comparing the PBE-GGA and hybrid-DFT band structure profiles of the investigated compounds [see Fig. 5 and S1], it is evident that the incorporated hybrid functionals have had a notable impact, particularly with regard to the energy levels where the electronic band lines are positioned. Thus, these substantial variations in band profiles due to the functionals employed has led to considerable changes in the ensuing transport properties. The resultant change in band energy due to the different functionals being adopted has led to the change in density of states, being a key factor for which the term −δf0/δE of eqn (27)–(29), that defines the number of states mapped and offered information of the channel allowing the charges to flow, varies. This phenomenon leads to remarkable changes of each compound’s electrical conductivity (σ) and electron thermal conductivity (κe), when the PBE-GGA and hybrid-DFT computed transport properties are compared.
The primary aim for calculating transport properties is to obtain the figure of merit (ZT) which determines the material’s TE efficiency. In this regard, the TE power factor (PF = S2σ) is firstly computed that measures the TE performance of the materials. The PFs with respect to chemical potential plots are depicted in Fig. S12–S14. From these plots, it is revealed that the PF increased as temperature rises, suggesting the enhancement of TE efficiency of the materials with temperature. It is important to note that the first peak points of PF along the left and right sides of the zero chemical potential (Fermi energy) corresponds to the optimum chemical potentials for p-type and n-type doping at various temperatures, where the optimal ZT values are determined as a function of temperature. Obviously, the ZT [see eqn (31)] depends on the conflicting nature of σ and κe, S and also on the κL. Since, the transport properties from BoltzTraP does not generate κL, therefore an analytical Slack model given in eqn (32) is employed which shows reliable κL values for complex materials compared to κL estimated from the phonon BTE calculations.86 The obtained κL curves in Fig. 9 show continuously decreasing plots as the temperature rises due to the increasing phonon scattering. The larger atomic sizes as X goes from K → Cs for Cmc21-X2PbO3 materials result in a reduced possibility of phonon scattering down the group. Thus, the order of κL for Cmc21-X2PbO3 materials is KPO > RPO > CPO. However, our observation shows a conflicting nature for C2/c-X2PbO3 compounds where κL of NPO > κL of LPO. This might be due to the LPO attaining a higher density than NPO, which decreases heat transfer average distances, and therefore minimizes κL for LPO. Furthermore, the non-centrosymmetric distortions in the Cmc21-X2PbO3 phase contribute to enhanced phonon scattering, leading to lower κL values and improved thermoelectric performance relative to the centrosymmetric C2/c-X2PbO3 counterparts. Additionally, the calculated κL values for Cmc21-X2PbO3 compounds are lower than those of the structurally related Cmc21-Li2GeO3 compounds, which can be attributed to the presence of the heavy Pb atom.87 The increased atomic mass of Pb further suppresses phonon transport, reinforcing the observed reduction in κL. Evidently, from the ZT plot as a function of temperature shown in Fig. 10, it can be seen that each compound’s ZT value improves as the temperature increases. Furthermore, it can be determined that CPO has attained the best TE efficiency with ZT = 0.61 at T = 900 K along the z-direction for p-type doping with the PBE0 functional. Interestingly, each material’s computed ZT from hybrid-DFT shows better efficiency when compared to the PBE-GGA result, except for LPO where the PBE-GGA estimates the greatest ZT values. The present findings are noteworthy, even though the achieved TE efficiency remains moderate (given that the benchmark for high-performance thermoelectric materials is ZT ≥ 1). This study represents the first theoretical report on the TE properties of C2/c-X2PbO3 and Cmc21-X2PbO3 glass-like compounds, which exhibit appreciable ZT values at elevated temperatures. Nevertheless, further in-depth investigations are required to enhance the electrical conductivity, particularly for the Cmc21-X2PbO3 phase, to realize their potential applicability in future thermoelectric devices. In general, glass-like materials crystallizing in the orthorhombic Cmc21 phase are known to possess relatively low electrical conductivity, which intrinsically restricts their TE efficiency. Consequently, only limited studies have explored this class of compounds. Reported data indicate that pristine glass-like Li2GeO3 displays a maximum ZT of merely 0.35 at 1200 K, which is significantly lower than the values obtained in the present work, underscoring the comparative promise of the investigated systems.87 This finding suggests that, within the family of glass-like materials, X2PbO3 holds considerable promise as a next-generation thermoelectric candidate.
 |
| | Fig. 9 Calculated lattice thermal conductivity (κL) of X2PbO3 compounds using the Slack equation. | |
 |
| | Fig. 10 Calculated thermoelectric efficiency (ZT) as a function of temperature using PBE-GGA, B3LYP, HSE06, and PBE0 functionals: (a) p-type and (b) n-type for Li2PbO3, (c) p-type and (d) n-type for Na2PbO3, (e) p-type and (f) n-type for K2PbO3, (g) p-type and (h) n-type for Rb2PbO3, and (i) p-type and (j) n-type for Cs2PbO3. | |
4 Conclusion
We present a comprehensive investigation of the multi-functional properties of X2PbO3 (X = Li, Na, K, Rb, and Cs) using hybrid-DFT within the frameworks of B3LYP, HSE06, and PBE0 functionals. Our study reveals that X2PbO3 compounds crystallize in two distinct structural phases, namely the monoclinic (C2/c) and orthorhombic (Cmc21) symmetries, depending on the ionic radius of the X-site atoms. To ensure the practical feasibility of these materials, we conducted a series of stability assessments: (1) the room temperature stability (from MD-simulation), (2) mechanical stability confirmed using Born’s criteria, and (3) ground-state stability or energetic stability established from formation energy calculations. The electronic band structure analysis demonstrates a significant band gap increasing within the hybrid functionals, highlighting the semiconducting nature of X2PbO3. From the optical property calculations, we observed a strong absorption coefficient (α > 1 × 105 cm−1) within the ultraviolet (UV) region, suggesting their potential use as UV-radiation shielding materials. The piezoelectric properties of the Cmc21-X2PbO3 phase were evaluated using both the PB and CPHF/KS formalism. The calculated piezoelectric coefficients are comparable to those of benchmark piezoelectric materials such as α-quartz (α-SiO2), underscoring the promising electromechanical potential of X2PbO3. Nevertheless, the effective macroscopic performance in practical devices will depend on factors including crystallographic orientation, poling conditions, and domain engineering, which can modulate the intrinsic response predicted here. Complementary thermoelectric analyses further reveal that these compounds exhibit favorable high-temperature transport characteristics, indicating their suitability for waste-heat recovery and energy-conversion applications. Overall, this work demonstrates the multifunctional potential of X2PbO3 for piezoelectric, thermoelectric, and optoelectronic applications. Experimental validation is encouraged to substantiate the predicted responses. Moreover, the present findings offer valuable guidance for computational researchers in selecting hybrid functionals optimized for reproducing structural parameters in DFT-based studies. Future efforts incorporating intrinsic defects, vacancies, or intentional doping are expected to enhance the thermoelectric performance and advance these materials toward practical device-level implementation.
Author contributions
R. Zosiamliana: performed detail calculations, formal analysis, visualization, validation, literature review, writing – original draft, writing – review & editing. Lalhriat Zuala: formal analysis, visualization, validation, writing – review & editing. Lalrinthara Pachuau: formal analysis, visualization, validation, writing – review & editing. Lalmuanpuia Vanchhawng: formal analysis, visualization, validation, writing – review & editing. S. Gurung: formal analysis, visualization, validation, writing – review & editing. A. Laref: formal analysis, visualisation, validation, writing – review & editing. Shalika Ram Bhandari: formal analysis, visualisation, validation, writing – review & editing. D. P. Rai: project management, supervision, resources, software, formal analysis, visualisation, validation, writing – review & editing.
Conflicts of interest
The authors declare no competing financial interest
Data availability
All data supporting the findings of this study are available within the article and its supplementary information (SI). Additional datasets generated and/or analysed during the current study are available from the corresponding author on reasonable request.
Supplementary information is available. See DOI: https://doi.org/10.1039/d5ra07886e.
Acknowledgements
DPR acknowledges Anusandhan National Research Foundation (ANRF), Govt. of India, vide Sanction Order No.: CRG/2023/000310, & dated: 10 October, 2024. A. Laref acknowledges support from the “Research Center of the Female Scientific and Medical Colleges”, Deanship of Scientific Research, King Saud University.
References
- R. Martins, Prog. Nat. Sci. Mater. Int., 2021, 31, 785–791 CrossRef CAS
 .
. - T. M. Tritt and M. A. Subramanian, MRS Bull., 2006, 31, 188–198 CrossRef .
- R. Freer and A. V. Powell, J. Mater. Chem. C, 2020, 8, 441–463 RSC .
- Z. Soleimani, S. Zoras, B. Ceranic, S. Shahzad and Y. Cui, Sustain. Energy Technol. Assessments, 2020, 37, 100604 CrossRef .
- P. A. Finn, C. Asker, K. Wan, E. Bilotti, O. Fenwick and C. B. Nielsen, Front. Electron. Mater., 2021, 1, 677845 CrossRef .
- R. Singh, S. Dogra, S. Dixit, N. I. Vatin, R. Bhardwaj, A. K. Sundramoorthy, H. Perera, S. P. Patole, R. K. Mishra and S. Arya, Hybrid Adv., 2024, 5, 100176 CrossRef .
- G. K. Madsen and D. J. Singh, Comput. Phys. Commun., 2006, 175, 67–71 CrossRef CAS .
- R. Holomb, V. Mitsa, S. Akyuz and E. Akalin, Philos. Mag., 2013, 93, 2549–2562 CrossRef CAS .
- H. Gong, B. Song, Y. Yang, P. Wang, Z. Cao, X. Chen, G. Zhao, S. Peng, Y. Liu and G. Han, J. Am. Ceram. Soc., 2021, 104, 3198–3211 CrossRef CAS .
- Z. E. Biskri, H. Rached, M. Bouchear and D. Rached, J. Mech. Behav. Biomed. Mater., 2014, 32, 345–350 CrossRef CAS PubMed .
- J. Du and L. R. Corrales, J. Chem. Phys., 2006, 125, 114702 CrossRef PubMed .
- Z. Renthlei, M. Prasad, J. Sivakumar, L. Zuala, L. Pachuau, Y. R. Devi, N. S. Singh, G. Abdurakhmanov, A. Laref and D. P. Rai, ACS Omega, 2023, 8, 16869–16882 CrossRef CAS PubMed .
- R. Hoppe, H.-J. Rohrborn and H. Walker, Naturwissenschaften, 1964, 51, 86 CrossRef CAS .
- P. Panek and R. Hoppe, Z. Anorg. Allg. Chem., 1972, 393, 13–22 CrossRef CAS .
- R. Hoppe and H. Stöver, Z. Anorg. Allg. Chem., 1977, 437, 123–126 CrossRef CAS .
- B. Brazel and R. Hoppe, Z. Naturforsch., B: J. Chem. Sci., 1982, 37, 1369–1374 CrossRef .
- W. H. Zachariasen, J. Am. Chem. Soc., 1932, 54, 3841–3851 CrossRef CAS .
- O. Mezilet, A. Assali, S. Meskine, A. Boukortt and M. Halati, Mater. Today Commun., 2022, 31, 103371 CrossRef CAS .
- O. Sadouki, F. Khelfaoui, F. Fontaine-Vive, K. Boudia, H. Hocine, E. Sert, A. R. Benrekia, M. Hamlat, A. Slamani, F. Belkharroubi and K. Amara, J. Electron. Mater., 2023, 52, 6778–6790 CrossRef CAS .
- Y. Zhang, W. Qu, G. Peng, C. Zhang, Z. Liu, J. Liu, S. Li, H. Wu, L. Meng and L. Gao, Materials, 2022, 15, 487 CrossRef CAS PubMed .
- C. A. McKay, J. Med. Toxicol., 2013, 9, 339–343 CrossRef CAS PubMed .
- G. Flora, D. Gupta and A. Tiwari, Biol. Trace Elem. Res., 2013, 152, 31–40 CrossRef CAS PubMed .
- C. Yedjou and P. Tchounwou, Int. Res. J. Publ. Environ. Health, 2007, 4, 132–137 CrossRef CAS PubMed .
- F. Frongia, M. Pilloni, A. Scano, A. Ardu, C. Cannas, A. Musinu, G. Borzone, S. Delsante, R. Novakovic and G. Ennas, J. Alloys Compd., 2015, 623, 7–14 CrossRef CAS .
- A. B. F. Vitoreti, S. Agouram, M. Solis de la Fuente, V. Muñoz-Sanjosé, M. A. Schiavon and I. Mora-Seró, J. Phys. Chem. C, 2018, 122, 14222–14231 CrossRef CAS PubMed .
- Z. Renthlei, L. Celestine, L. Kima, L. Zuala, Z. Mawia, B. Chettri, Y. T. Singh, S. Abdullaev, M. Ezzeldien and D. P. Rai, Energy Fuels, 2023, 37, 19831–19844 CrossRef CAS .
- R. Zosiamliana, Lalrinkima, B. Chettri, G. Abdurakhmanov, M. P. Ghimire and D. P. Rai, RSC Adv., 2022, 12, 12453–12462 RSC .
- R. Zosiamliana, B. Chettri, G. S. L. Fabris, J. R. Sambrano, S. Abdullaev, G. Abdurakhmanov and D. P. Rai, RSC Adv., 2022, 12, 27666–27678 RSC .
- M. Chira, A. Hegyi, H. Szilagyi and H. Vermeşan, The 14th International Conference on Interdisciplinarity in Engineering—INTER-ENG 2020, Basel Switzerland, 2020, p. 35 Search PubMed .
- S. Gelin, N. E. Kirchner-Hall, R. R. Katzbaer, M. J. Theibault, Y. Xiong, W. Zhao, M. M. Khan, E. Andrewlavage, P. Orbe, S. M. Baksa, M. Cococcioni, I. Timrov, Q. Campbell, H. Abruña, R. E. Schaak and I. Dabo, PRX Energy, 2024, 3, 013007 CrossRef .
- R. Dovesi, A. Erba, R. Orlando, C. M. Zicovich-Wilson, B. Civalleri, L. Maschio, M. Rérat, S. Casassa, J. Baima, S. Salustro and B. Kirtman, Wiley Interdiscip. Rev.: Comput. Mol. Sci., 2018, 8, e1360 Search PubMed .
- D. Vilela Oliveira, J. Laun, M. F. Peintinger and T. Bredow, J. Comput. Chem., 2019, 40, 2364–2376 CrossRef CAS PubMed .
- J. Laun and T. Bredow, J. Comput. Chem., 2022, 43, 839–846 CrossRef CAS PubMed .
- J. P. Perdew, K. Burke and M. Ernzerhof, Phys. Rev. Lett., 1996, 77, 3865–3868 CrossRef CAS PubMed .
- A. D. Becke, Phys. Rev. A: At., Mol., Opt. Phys., 1988, 38, 3098–3100 CrossRef CAS .
- C. Lee, W. Yang and R. G. Parr, Phys. Rev. B: Condens. Matter Mater. Phys., 1988, 37, 785–789 CrossRef CAS PubMed .
- C. Adamo and V. Barone, J. Chem. Phys., 1999, 110, 6158–6170 CrossRef CAS .
- J. Heyd, G. E. Scuseria and M. Ernzerhof, J. Chem. Phys., 2003, 118, 8207–8215 CrossRef CAS .
- M. Y. Mehboob, R. Hussain, M. Adnan, Saira, U. Farwa, Z. Irshad and M. R. Saeed Ashraf Janjua, J. Phys. Chem. Solids, 2022, 162, 110508 CrossRef CAS .
- J. D. Head and M. C. Zerner, Chem. Phys. Lett., 1985, 122, 264–270 CrossRef CAS .
- N. Nawi, M. Ransing and R. Ransing, Sixth International Conference on Intelligent Systems Design and Applications, 2006, pp. 152–157 Search PubMed .
- H. J. Monkhorst and J. D. Pack, Phys. Rev. B, 1976, 13, 5188–5192 CrossRef .
- S. Nosé, Mol. Phys., 2002, 100, 191–198 CrossRef .
- H. C. Andersen, J. Chem. Phys., 1980, 72, 2384–2393 CrossRef CAS .
- S. Smidstrup, T. Markussen, P. Vancraeyveld, J. Wellendorff, J. Schneider, T. Gunst, B. Verstichel, D. Stradi, P. A. Khomyakov, U. G. Vej-Hansen, M.-E. Lee, S. T. Chill, F. Rasmussen, G. Penazzi, F. Corsetti, A. Ojanperä, K. Jensen, M. L. N. Palsgaard, U. Martinez, A. Blom, M. Brandbyge and K. Stokbro, J. Phys.: Condens. Matter, 2020, 32, 015901 CrossRef CAS PubMed .
- T. J. Scheidemantel, C. Ambrosch-Draxl, T. Thonhauser, J. V. Badding and J. O. Sofo, Phys. Rev. B: Condens. Matter Mater. Phys., 2003, 68, 125210 CrossRef .
- B. Ryu and M.-W. Oh, J. Korean Ceram. Soc., 2016, 53, 273–281 CrossRef CAS .
- K. Momma and F. Izumi, J. Appl. Crystallogr., 2008, 41, 653–658 CrossRef CAS .
- F. Birch, Phys. Rev., 1947, 71, 809–824 CrossRef CAS .
- F. D. Murnaghan, Am. J. Math., 1937, 59, 235 CrossRef .
- M. Parrinello and A. Rahman, J. Appl. Phys., 1981, 52, 7182–7190 CrossRef CAS .
- M. Parrinello and A. Rahman, Phys. Rev. Lett., 1980, 45, 1196–1199 CrossRef CAS .
- S. Nose, J. Phys.: Condens. Matter, 1990, 2, SA115–SA119 CrossRef .
- R. S. Mulliken, J. Chem. Phys., 1955, 23, 1833–1840 CrossRef CAS .
- N. T. Han, V. K. Dien, N. T. Thuy Tran, D. K. Nguyen, W.-P. Su and M.-F. Lin, RSC Adv., 2020, 10, 24721–24729 RSC .
- V. K. Dien, H. D. Pham, N. T. T. Tran, N. T. Han, T. M. D. Huynh, T. D. H. Nguyen and M. Fa-Lin, Sci. Rep., 2021, 11, 4939 CrossRef CAS PubMed .
- U. V. Waghmare and K. M. Rabe, Phys. Rev. B: Condens. Matter Mater. Phys., 1997, 55, 6161–6173 CrossRef CAS .
- Y. Mo, S. P. Ong and G. Ceder, Phys. Rev. B: Condens. Matter Mater. Phys., 2011, 84, 205446 CrossRef .
- C. Ambrosch-Draxl and J. O. Sofo, Comput. Phys. Commun., 2006, 175, 1–14 CrossRef CAS .
- M. Born, Math. Proc. Camb. Phil. Soc., 1940, 36, 160–172 CrossRef CAS .
- F. Mouhat and F.-X. Coudert, Phys. Rev. B: Condens. Matter Mater. Phys., 2014, 90, 224104 CrossRef .
- W. Voigt, Lehrbuch der Kristallphysik, Vieweg + Teubner Verlag, Wiesbaden, 1966 Search PubMed .
- A. Reuss, J. Appl. Math. Mech., 1929, 9, 49–58 CAS .
- R. Hill, Proc. Phys. Soc., London, Sect. A, 1952, 65, 349–354 CrossRef .
- L. Kleinman, Phys. Rev., 1962, 128, 2614–2621 CrossRef CAS .
- D. H. Chung and W. R. Buessem, J. Appl. Phys., 1968, 39, 2777–2782 CrossRef CAS .
- D. G. Cahill and R. Pohl, Solid State Commun., 1989, 70, 927–930 CrossRef .
- J.-i. Tani, M. Takahashi and H. Kido, Phys. B, 2010, 405, 4219–4225 CrossRef CAS .
- H. Chen and L. Yang, Phys. B, 2011, 406, 4489–4493 CrossRef CAS .
- Lalrinkima, C. E. Ekuma, T. C. Chibueze, L. A. Fomin, I. V. Malikov, L. Zadeng and D. P. Rai, Phys. Chem. Chem. Phys., 2021, 23, 11876–11885 RSC .
- S. Baroni, P. Giannozzi and E. Isaev, Rev. Mineral. Geochem., 2010, 71, 39–57 CrossRef CAS .
- M. Blanco, E. Francisco and V. Luaña, Comput. Phys. Commun., 2004, 158, 57–72 CrossRef CAS .
- M. Palumbo and A. Dal Corso, J. Phys.: Condens. Matter, 2017, 29, 395401 CrossRef PubMed .
- M. Palumbo and A. Dal Corso, Phys. Status Solidi B, 2017, 254, 1700101 CrossRef .
- A. C. Holt and M. Ross, Phys. Rev. B, 1970, 1, 2700–2705 CrossRef .
- D. Belmonte, C. Gatti, G. Ottonello, P. Richet and M. Vetuschi Zuccolini, J. Phys. Chem. A., 2016, 120, 8881–8895 CrossRef CAS PubMed .
- A. Erba, K. E. El-Kelany, M. Ferrero, I. Baraille and M. Rérat, Phys. Rev. B: Condens. Matter Mater. Phys., 2013, 88, 035102 CrossRef .
- J. Baima, A. Erba, L. Maschio, C. M. Zicovich-Wilson, R. Dovesi and B. Kirtman, Z. Phys. Chem., 2016, 230, 719–736 CrossRef CAS .
- A. Erba, Phys. Chem. Chem. Phys., 2016, 18, 13984–13992 RSC .
- R. Tarumi, K. Nakamura, H. Ogi and M. Hirao, J. Appl. Phys., 2007, 102, 113508 CrossRef .
- L. Celestine, R. Zosiamliana, L. Kima, B. Chettri, Y. T. Singh, S. Gururng, N. S. Singh, A. Laref and D. P. Rai, J. Phys.: Condens. Matter, 2024, 36, 325501 CrossRef CAS PubMed .
- K. Yu and T. Liu, Optoelectronic Devices and Integration III, 2010, p. 78471K Search PubMed .
- J. Linnera, G. Sansone, L. Maschio and A. J. Karttunen, J. Phys. Chem. C, 2018, 122, 15180–15189 CrossRef CAS PubMed .
- G. Sansone, A. Ferretti and L. Maschio, J. Chem. Phys., 2017, 147, 114101 CrossRef PubMed .
- G. A. Slack, Solid State Physics - Advances in Research and Applications, 1979, vol. 34, pp. 1–71 Search PubMed .
- P. Joshi, G. B. Acharya, I. B. Khadka, B. Srinivasan, S.-H. Kim and M. P. Ghimire, ACS Appl. Energy Mater., 2025, 8, 3217–3228 CrossRef CAS .
- R. Zosiamliana, L. Celestine, L. Zuala, B. Chettri, Z. Mawia, G. Abdurakhmanov, A. Laref, S. R. Bhandari and D. P. Rai, High Press. Res., 2024, 1–28 Search PubMed .
|
| This journal is © The Royal Society of Chemistry 2025 |
Click here to see how this site uses Cookies. View our privacy policy here. 
 Open Access Article
 This Open Access Article is licensed under a
  c,
Shalika R. Bhandari
c,
Shalika R. Bhandari


 and
and  . Here, ρ is density.


 ,
, 
