
 Open Access Article
 This Open Access Article is licensed under a
 Creative Commons Attribution 3.0 Unported Licence
Electron attachment to CH3COCl molecule and clusters†
Barbora Kocábková‡
 a,
Jozef Ďurana‡a,
Jozef Rakovskýa,
Viktoriya Poteryaa,
Michal Fárník*a,
Michael Gattb,
Gabriel Schöpferb,
Philipp Jungb and
Milan Ončák*b
a,
Jozef Ďurana‡a,
Jozef Rakovskýa,
Viktoriya Poteryaa,
Michal Fárník*a,
Michael Gattb,
Gabriel Schöpferb,
Philipp Jungb and
Milan Ončák*b
aJ. Heyrovský Institute of Physical Chemistry, v.v.i., The Czech Academy of Sciences, Dolejškova 2155/3, 182 23 Prague, Czech Republic. E-mail: michal.farnik@jh-inst.cas.cz
bInstitut für Ionenphysik und Angewandte Physik, Universität Innsbruck, Technikerstraße 25, 6020 Innsbruck, Austria. E-mail: Milan.Oncak@uibk.ac.at
First published on 10th July 2025
Abstract
We investigate the electron attachment of acetyl chloride CH3COCl (AC) molecules and clusters in a molecular beam experiment and by extensive theoretical calculations. The main product of dissociative electron attachment (DEA) to the AC molecule is Cl−, which leads to the main (AC)nCl− series in clusters. The weaker ion series identified in the cluster mass spectra correspond to (AC)nHCl2− and hydrogen abstraction fragments [(AC)n–H]−, in full agreement with calculated energetics. We compare the present results for AC with previously studied trifluoroacetyl chloride CF3COCl (TFAC) and trichloroacetic acid CCl3COOH (TCA) molecules and clusters. DEA of the three isolated molecules results in the main fragment Cl−; however, the electron attachment to their clusters produces distinctly different cluster ions. This demonstrates that the outcomes of reactions of electrons with molecules in an environment cannot easily be predicted from the DEA of isolated molecules, and the solvent plays a key role in the process.
1. Introduction
In the context of environmental policy, chlorinated molecules are now receiving serious attention from both industry and academia. For a long time, the origin of organochlorines in the atmosphere was believed to be mainly anthropogenic, with natural sources considered to be a minor contributor. It is interesting to note that, on the one hand, some chlorinated substances have a certain degree of toxicity,1–3 yet, on the other hand, chlorine is commonly found in molecules present in living organisms.4–6 Thus, in addition to anthropogenic sources of chlorine-containing substances in the atmosphere, some of these compounds also occur naturally within the biogeochemical cycle.For example, there is an ongoing debate regarding elevated levels of trichloroacetic acid (TCA) observed in soils.7–9 The proposed main mechanism for additional TCA formation begins with oxidation of C2Cl4 by a Cl radical with a reaction chain that produces trichloroacetyl chloride, which is hydrolysed to TCA in clouds.10 Other pathways for TCA formation have been proposed, but understanding of the atmospheric distribution and reactivity of organochlorine compounds is still lacking.10 Processes occurring at the air-surface interface are of increasing importance. Photoinduced surface activation, involving radical or electron chemistry with numerous intermediates, can further contribute to the atmospheric budget.
Chlorinated and fluorinated species, such as trifluoroacetyl chloride CF3COCl (TFAC), are formed by tropospheric photo-oxidative degradation of hydrochlorofluorocarbons,11 which are often used as replacements for ozone depleting chlorofluorocarbon compounds. The amount of these molecules in the atmosphere has increased in the last decades; therefore, it is important to understand their photochemistry12 and the processes induced by electrons.13
Beyond their role in atmospheric chemistry, electron-driven processes also have significant biological implications. For example, electron attachment and dissociative electron attachment are known to play a significant role in radiation damage to biomolecules, including amino acids.14,15 These processes can lead to the formation of reactive radicals and other species that can damage the molecular structure of biological systems.
Examples of electron activation include photosensitization reactions and solvent-induced charge delocalisation. For halogen-containing substances with high electron affinities, electron-induced reactions are another important process that contributes to the generation of reactive radicals. Research on electron attachment to molecules in different environments shows that the products of dissociative electron attachment (DEA) can be very different, going from gas-phase molecules to small clusters.16–18 For instance, CF3Cl clusters show enhancement of Cl− yield at electron energies below 2 eV; this is accompanied by the dominance of new negative complex ions, such as MnCl−, over spectra, suggesting an increase in autodetachment from the clusters.13 Halogenated organic acids, as studied in reactions with electrons, have been shown to cleave the available C–Cl bonds.13,19 In contrast to the predominant DEA channel in analogous organic acids, such as formic and acetic acids, where the dehydrogenation process leads to stable RCOO− formation,20,21 the halogenated derivatives typically produce negative complexes with a halogen anion attached. Along with the hydrogen abstraction channel, stabilised undissociated negative clusters were also observed. This was confirmed for CF3COOH clusters, studied at energies below 2 eV by Illenberger,22 where the formation of undissociated negative ions (CF3COOH)n− indicates the stabilisation effect of the cluster.
Electron attachment to halogenated acid molecules, such as trichloroacetic acid CCl3COOH, allows to study the competition between Cl− formation and the dehydrogenation process that leads to RCOO−. The DEA of TCA together with CClF2COOH and CF3CHNH2COOH was investigated by Kopyra,23,24 and we have recently shown how the cluster environment influences this process.19
From the theoretical side, modelling of atmospherically relevant molecular clusters poses two major challenges. Firstly, for large clusters with diameters of several nanometres, it is difficult to find a suitable quantum chemical method which provides a reasonable compromise between accuracy and computational cost. This is not the main problem here, as we are considering clusters only up to pentamers. Secondly, with increasing cluster size, the number of possible isomers increases dramatically. We are already facing this challenge for our relatively small clusters with tens of atoms. Finding the energetically lowest-lying isomer is a question of global optimisation, which is a well-known problem in mathematics, engineering, computer science, and other fields.25,26 Global optimisation is a so-called NP-hard problem,27 making it particularly difficult to find general algorithms. Therefore, specialized algorithms are developed for different use cases. For molecular cluster search, popular algorithms include metaheuristic optimisation algorithms inspired by nature,28 e.g., particle swarm optimisations,29 the artificial bee colony algorithm,30 and genetic algorithms.31 Often, combinations or variations of these methods are being employed.29 Also, machine learning methods are used successfully for automated configurational sampling and efficient modelling of molecular clusters.32 In addition to global optimisation algorithms, rare-event molecular dynamics simulations are performed to discover reaction mechanisms and reaction networks.33 Here, we employ our in-house genetic algorithm34 which is a combination of an evolutionary genetic algorithm to cover a large portion of the potential energy surface, and gradient-driven local optimisations for refinement. By using our structure clustering algorithm to divide our population into groups of similar structures and then performing selection based on this process, we increase genetic diversity within our population, and therefore enable a more efficient search of the chemical space.
In the present study, we extend previous electron attachment studies of halogenated species13,19 to acetyl chloride CH3COCl (AC) molecules and clusters. The formation of negative ions from AC was investigated in an early mass spectrometry experiment with a trochoidal electron monochromator.35 We compare the present results on the AC molecule with those from previously investigated TFAC and TCA. The DEA of all three molecules results in the main fragment Cl−; however, the electron attachment to their clusters produces distinctly different cluster ions. This demonstrates that the outcomes of reactions of electrons with molecules in a solvent environment cannot be easily deduced even from detailed knowledge of the DEA process with isolated molecules, in agreement with earlier investigations of DEA in clusters.18,36
2. Methods
2.1. Experiment
The experiment was carried out using the cluster-beam (CLUB) apparatus in Prague described in detail elsewhere.28,37 The CH3COCl (Sigma-Aldrich, 99% pur.) was evaporated in a custom-built reservoir at laboratory temperature (25 °C) to a stream of buffer gas at a stagnation pressure of 1 bar. The beam was created by supersonic expansion through a conical nozzle (90 μm pinhole diameter, 30° opening, 2 mm length). Helium was used as the buffer gas for the molecular beam; clusters were obtained by co-expansion with argon as the buffer.38The beam passed through a 1 mm skimmer located 18 mm downstream from the nozzle and continued through several differentially pumped vacuum chambers to the reflectron time-of-flight mass spectrometer. After a flight path of 1.5 m, the beam was ionised with a 1 μs pulse of low energy electrons (0–10 eV) from a heated tungsten filament. The detector was used in negative ion mode. Following a 0.1 μs delay (to remove any free electrons), ions were extracted by applying ±2 kV to repeller/extractor electrodes for 1 μs and further accelerated by 8 kV to the reflectron. The ions travelled approximately 95 cm in the reflectron region and were then detected with a microchannel plate.
To obtain the electron-energy-dependent ion yield, we measured the negative ion mass spectra at different electron energies scanned from 0 eV to 10 eV in steps of 0.5 eV which corresponds to our energy resolution. The ion yields were normalised by the electron current measured on a Faraday cup placed behind the ionisation region. Due to space charge and stray field effects, the measured current is expected to be lower than the actual number of electrons passing through the interaction region, and the electron energy calibration is not reliable at low energies below 2 eV. Therefore, we present here our spectra measured at the electron energies above 2 eV, as discussed also in our previous studies.39,40
The actual measured negative ion yields exhibit a maximum at lower electron energies and the actual resonances lay presumably close to zero, where, however, our data are not reliable. Nevertheless, the relative intensities of the reported fragments do not change significantly below 2 eV, and we assume that the electron beam at low energies contains also a significant number of near-zero energy electrons. Therefore, we assume that our low-energy spectra reflect to some extent also the resonances close to zero.
While the measured ion yields at low electron energies are underestimated due to the electron beam spread, the normalisation of the ion yield using the measured electron current overestimates the ion yields at low energies. Therefore, we show both the actually measured and the normalised ion-yield curves. These two values represent upper and lower boundaries, respectively, and the range between them corresponds to a conservative estimate of the error bars. We draw a line corresponding to average value. At higher energies, the measured and normalised values converge, since the total electron current is focused and measured on the Faraday cup.
The observed negative ions exhibit a maximum yield at low electron energies, presumably below 2 eV. Therefore, we present here the mass spectra recorded at a constant electron energy of 2 eV, where our ion signals are maximal, and the energy-dependent ion yields of the main ions are displayed in the range of 2–10 eV.
2.2. Calculations
For electron attachment to clusters consisting of multiple AC molecules, we employed our in-house genetic algorithm (GA),34 which has already been used successfully to find isomers of cluster molecules such as trichloroacetic acid clusters, hydrated silver ions, and C120+.19,41,42 Here, we extend the GA by natively integrating our graph-based structure clustering algorithm to enhance genetic diversity and originality of our structures. In each GA cycle, we divide our population into groups of similar structures and select the fittest structures based on their energy and group affiliation, obtaining an optimal balance between genetic diversity and energy-based fitness.For electron attachment to a single AC molecule, we manually searched the chemical space due to the limited number of chemically meaningful possibilities.
We optimised all molecules and ions using density functional theory (DFT) at the ωB97XD/def2TZVP level of theory43 with tight convergence criteria to obtain zero-point energy corrected reaction energies. Furthermore, we performed single-point recalculations at the coupled-cluster level, CCSD(T)/def2TZVP, to provide more reliable energies for reactions involving smaller clusters, as well as a rough estimate of the computational error of our DFT calculations. All DFT and coupled cluster calculations were performed using Gaussian 16.44 The Cartesian coordinates of all optimised molecules and ions, along with their zero-point corrected electronic energies, are provided in the ESI.†
Using the semi-empirical GFN2-xTB method45 from the xTB software package,46 we optimised the neutral or anionic structures and obtained their energies and nuclear repulsion energies. Our benchmark tests suggest poor parallelisability for our comparably small systems. Therefore, we use Python's multiprocessing approach to calculate multiple structures in parallel, each on a separate core.
During the GA selection step, the structure clustering algorithm divides the population into groups (clusters) of similar structures. The number of structures to be selected from each group is based on the median energy of the respective group, as illustrated in Fig. 1. This process ensures a balance between selecting the fittest (i.e., energetically lowest) structures and maintaining genetic diversity (i.e., taking structures from many different groups). For example, for (AC)2Cl−, in the first cycle, 100 structures from 627 different groups were selected to form the population for the next GA cycle.
 | ||
| Fig. 1 Illustration of the clustering-based selection process. After optimisation and clustering (i.e., dividing the population into groups of similar structures), the selection of structures to survive until the next cycle of the genetic algorithm is performed. Each of the three insets shows the group size (number of structures in each group) as a function of their mean energy. The goal is to find an ideal balance (centre plot) between selecting the energetically fittest structures and maximizing genetic diversity rather than selecting only the fittest ones (left plot) or not regarding the energy as a criterion at all (right plot). | ||
Next, a specified number of crossover operations, e.g., 100 for (AC)2Cl−, is performed which, respectively, creates one new structure out of two randomly picked parent structures, taking a randomly sized share of atom positions of each structure. In addition, two different mutation operators are applied independently to each structure with a probability of 20%. The mutation functions alter the structures either by swapping the positions of two randomly chosen atoms/fragments or by randomly moving an atom/fragment. During crossover and mutation, the intermolecular distance was restricted to be no less than 1.2 Å, preventing the generation of structures with electronic wave functions that are difficult to converge. Fragments such as AC, AC−, or CH3CO are marked during initialisation of the population to keep them intact throughout crossover and mutation. This restricts the chemical space, preventing us from obtaining kinetically inaccessible structures, reflecting the limited structural rearrangement under the experimental conditions. For example, during the position switch, the position of the entire fragment is changed rather than that of an individual atom of the fragment.
This entire procedure is repeated for a minimum of 25 genetic cycles, depending on the cluster complexity. Fig. 2 illustrates the convergence behaviour of the GA procedure. It can be seen that the minimum energy steadily decreases, whereas the spikes in the mean and maximum energy are not adverse but simply indicate that crossover/mutation operations produced high-energy structures, further increasing the genetic diversity. All relevant parameters for the genetic algorithm runs are detailed in Table S1 (ESI).†
 | ||
| Fig. 2 Convergence behaviour of our genetic algorithm for [(AC)4–H]−. The energy is obtained from semi-empirical optimisation using GFN2-xTB. The light blue shaded region represents the range between the minimum and maximum energy values around the mean (dark blue line). | ||
After completion of the GA, a final clustering of all emerged structures is performed to group similar ones. Next, all structures with an electronic energy difference of less than 0.01 eV and a nuclear repulsion energy difference of less than 0.5 hartree are considered duplicates and removed. From each group, typically three to ten of the lowest-lying or most interesting representatives are selected, depending on the size and complexity of the system. The selected candidates are then manually reviewed and, in some cases, modified based on chemical intuition before optimisation at the ωB97XD/def2TZVP level to identify minimum-energy structures. For large candidate sets, an additional intermediate optimisation at the BLYP-D3/6-31G* level helped reducing the computational cost.
| H | C | O | Cl | |
|---|---|---|---|---|
| H | 1.24 | |||
| C | 1.5 | 1.76 | ||
| O | 2.3 (*) | 1.76 | 1.76 | |
| Cl | 2.8 (*) | 3 (*) | 3 (*) | 2.38 |
Subsequently, groups are constructed by identifying all graphs that are isomorphic to each other. We use a backtracking algorithm from Boost Graph Library48 for this purpose. The worst-case time complexity of this implementation is  , where n expresses the number of graph vertices, i.e., the number of atoms in the structure. Isomorphism is tested for each pair of N structures with
  . Despite this unpleasant worst-case scaling of
  , the absolute time is only on the order of seconds to cluster thousands of structures. Typically, we only cluster fully connected graphs, since we are mostly not interested in broken structures. Fig. 3 shows example structures of [(AC)3–H]− and their corresponding graph representation.
 | ||
| Fig. 3 Structure clustering of an exemplary [(AC)3–H]− population showing one representative structure from three different groups optimised at the ωB97XD/def2TZVP level (right), together with its respective graph representation (left). Note that the connecting lines in the graphs are determined by the distance thresholds as given in Table 1. The energies are reported relative to the lowest-lying structure shown in the first row. 3D structures (right) are shown in perspective, i.e., closer objects appear larger. | ||
The structure clustering algorithm, implemented in C++ for improved performance, is integrated into the main GA code using a Python wrapper (pybind11), and available from a GitHub repository.49 An additional stand-alone command-line version allows users to cluster structure lists from conventional XYZ file formats. Custom covalent radii, specific pair distances, and other parameters can be defined via a configuration file.
3. Results
3.1. Experimental results
First, we briefly introduce our experimental results and then theoretically substantiate the observed anions. The negative ion mass spectrum of the AC molecule is shown in Fig. 4a. The DEA of AC yields only the Cl− fragment. The 20× magnified trace exhibits Br− peaks at m/z = 79 and 81 in the background of the TOF chamber due to previous long-term experiments with HBr. Only two minor peaks could not be assigned to the DEA of the monomer at the given electron energy of 2 eV and have been attributed to the presence of a small amount of (AC)2 dimers: m/z = 59 corresponding to CH3COO− and a minuscule signal at m/z = 78 probably due to the parent CH3COCl− which also originates from the dimer. The positive ion spectrum confirmed a small amount of (AC)2 dimers in the beam.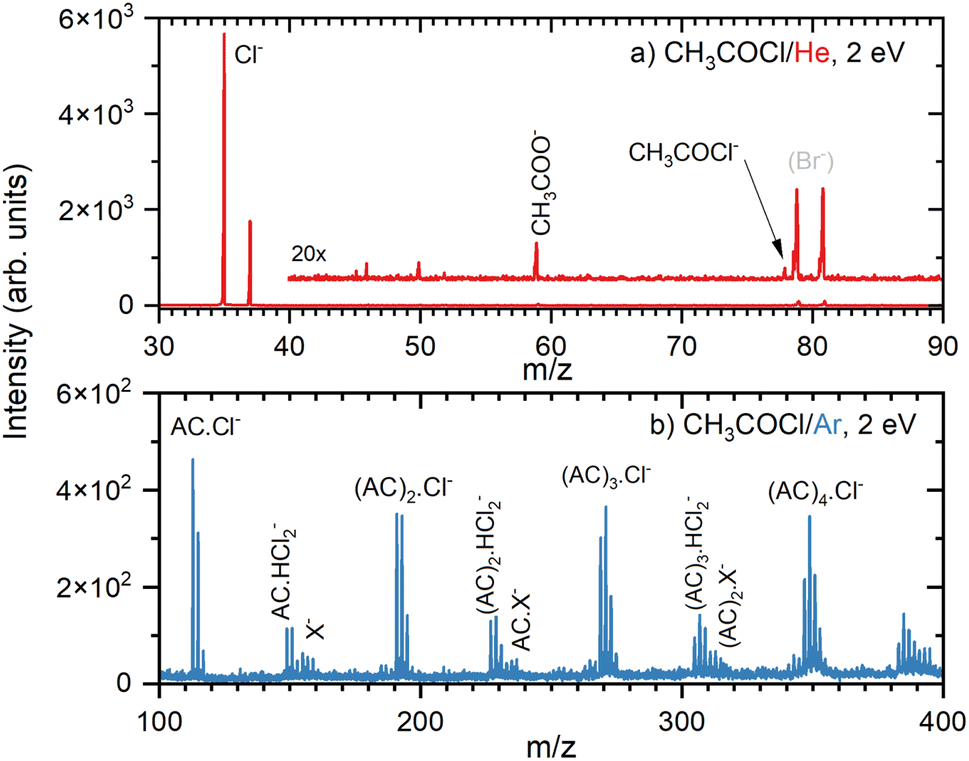 | ||
| Fig. 4 Negative ion mass spectra after the electron attachment to AC in co-expansion with He (a), and with Ar (b) at 2 eV electron energy. The possible nature of the X− species is discussed in the text. | ||
The clusters of AC molecules were generated in co-expansion with argon. Below the monomer mass, the cluster spectrum (Fig. S1 in ESI†) has a weaker signal, but it is essentially identical to the monomer spectrum (Fig. 4a). Above the monomer mass, the spectrum is dominated by the (AC)nCl− cluster ions, Fig. 4b. The (AC)nCl− peak multiplets correspond to isotopologues due to the natural abundance of 35Cl and 37Cl isotopes and their ratio confirms the assignment. Other fragment ion series can be assigned to (AC)nHCl2− multiplets overlapping with other weaker ions at higher masses. The first peak of the (AC)HCl2− multiplet at m/z = 149 is followed by two other peaks with Δm/z = 2 due to the 35Cl and 37Cl isotopologues in intensity ratio corresponding to the natural abundance of the isotopes. There are some weak peaks between the (AC)1HCl2− peaks spaced by Δm/z = 1 from them, possibly corresponding to (AC)Cl2−.
The following smaller multiplets starting at m/z = 155 labelled X− in Fig. 4b cannot be unambiguously assigned. The starting mass can correspond to the dimer after H abstraction [(AC)2–H]−. This ion contains 2 Cl atoms, which would yield the isotopologue abundance at m/z = 159 of about 10% of the main peak at m/z = 155. In the spectrum, the peak at m/z = 159 accounts for almost 80% of m/z = 155. Thus, we can assume that other ions contribute to m/z = 159. Possible candidates for the mass peak at m/z = 157 can be AC anions with an additional H-atom, i.e., [(AC)2+H]−. Our theoretical calculations suggest that the pathway from the AC trimer anion, (AC)3− → [(AC)2+H]− + [AC–H], requires only about 0.50 eV energy, which is easily available in our experiment (see below). Furthermore, peaks with lower intensity at even masses starting at m/z = 156 are also observable, and their identification implies a contribution of the unfragmented AC dimer anion, but as a minor product, since the peak intensity is less than 50% of m/z = 155. Thus, we suggest that the peaks labelled X− in our spectrum correspond to [(AC)2–H]−, [(AC)2]−, and [(AC)2+H]− anions. The corresponding fit of the peak intensities assuming the natural abundances of the isotopologues is not perfect (see Fig. S4†); yet the errors in the ion abundances might be quite large, considering the low intensities of the mass peaks in this region. In addition, other anions might contribute. We could propose a few anions that fit the observed m/z simply by combining the masses of the available atoms. However, our theoretical calculations do not provide any support for the structure of these ions, and therefore we mention them only in the ESI.†
Similar analysis can be performed for the next series of peaks starting with the (AC)2HCl2− multiplet at m/z = 227. Again, the peak at m/z = 233 corresponds to the H abstraction product [(AC)3–H]−, however, the ion corresponding to m/z = 237 seems to be more abundant than the corresponding isotopologue of [(AC)3–H]−. Thus, we could invoke here the [(AC)3+H]− series starting at m/z = 235. Further minor series at higher masses above (AC)3 were too weak and congested to be analysed in detail.
In summary, the negative ions are composed mainly of (AC)nCl− ion series, followed by (AC)nHCl2− (accompanied by weak (AC)nCl2− series). The weak mass peaks labelled as (AC)nX− in Fig. 4 are tentatively assigned to cluster ions with H atom subtraction and addition, i.e., [(AC)n–H]− and [(AC)n+H]−, respectively, (accompanied by weak (AC)n− series). Further ions could be involved, as discussed in the SI. Nevertheless, the weak abundances and mass congestion due to isotopologues prohibit an unambiguous assignment of these weak mass peaks.
The mass spectra were also measured at the higher electron energy of about 6 eV. At these higher energies, all intensities decrease significantly and only the major (AC)nCl− series is discernible above the noise (ESI, Fig. S2†). Fig. 5 shows the yield of the major (AC)nCl− fragment anions, n = 0–3, in dependence on the electron energy. The yields closely resemble the Cl− yield of isolated AC molecules measured in He and shown in ESI, Fig. S3.† They increase from 4.5 eV towards lower energies. As described in the Experimental section, the yields below 2 eV cannot be evaluated reliably as indicated by the increasing error bars for the Cl− ion. Thus, the electron attachment leading to the (AC)nCl− anions exhibits a maximum at a low electron energy below 2 eV. The slight increase in the intensity of the (AC)nCl−, n ≥ 1, anions towards higher energies of 10 eV may be due to insufficient background subtraction and is within our error bars. The abundances of the other anion fragments apart from (AC)nCl− are too small to evaluate the energy-dependent ion yield.
 | ||
| Fig. 5 Electron energy dependent yield for the (AC)nCl− clusters for n = 0–3. The Cl− fragment (green dashed line) corresponds to the right y axis, light green area represents conservative error bars for Cl−, which are explained in the experimental section. For n = 1–3 the error bars are omitted for picture clarity. They are proportionally similar for all other fragments. | ||
3.2. Theoretical results
To provide tentative structures for all observed fragments and further interpret the experimental findings, we performed calculations on the title clusters. The results of our calculations, in combination with the experimental results, allow us to suggest reaction pathways, gaining insights into the chemistry of acetyl chloride clusters. A summary of all reactions is given in Fig. 6, energetics of selected reactions are collected in Tables 2 and 3. | ||
| Fig. 6 Suggested fragmentation pathways before and after electron attachment to clusters and monomers of AC as calculated at the ωB97XD/def2TZVP level of theory. Reaction energies and adiabatic electron affinities in eV are denoted in brackets. | ||
| Reaction | E (eV) |
|---|---|
| AC + e− → (AC)− | −0.36 (−0.15) |
| Cl− + CH3CO | 0.23 (0.41) |
| (AC)2 + e− → (AC)2− | −0.81 (−0.54) |
| (AC)2 → AC + AC | 0.17 (0.18) |
| (AC)2− → (AC)Cl− + CH3CO | 0.50 (0.46) |
| (AC)− + AC | 0.62 (0.57) |
| (AC)3 + e− → (AC)3− | −1.07 (−0.78) |
| (AC)3 → (AC)2 + AC | 0.21 (0.21) |
| (AC)3− → (AC)2Cl− + CH3CO | 0.37 (0.35) |
| (AC)2− + AC | 0.47 (0.46) |
| (AC)2Cl− → (AC)Cl− + AC | 0.60 (0.57) |
| (AC)HCl2− + H2CCO | 0.56 (0.61) |
| Reaction | n = 5 | 4 | 3 | 2 | 1 |
|---|---|---|---|---|---|
| a Merged structures are marked with (m). | |||||
| (AC)n− → Cl− + (AC)n−1CH3CO | 2.00 | 1.69 | 1.36 | 1.08 | 0.60 |
| (AC)nCl− → Cl− + (AC)n | — | 1.66 | 1.44 | 1.15 | 0.71 |
| (AC)nHCl2− → Cl− + (AC)nHCl | — | — | 1.95 | 2.01 | 1.65 |
| [(AC)n–H]− → Cl− + (AC)n−1H2CCO | — | 1.65 | 1.42 | 1.08 | 0.56 |
| [(AC)n–H]− (m)a → Cl− + (AC)n−1H2CCO (m) | — | 2.22 | 1.95 | 1.81 | — |
Using the structures explored with our genetic algorithm, we computed the energies of reactions upon electron attachment to AC at the ωB97XD/def2TZVP level of theory. Single-point recalculations at the CCSD(T)/def2TZVP level for selected reactions confirm that DFT provides reliable results, as shown in Table 2, which justifies our reliance on DFT values for larger clusters, where coupled cluster calculations would be computationally prohibitive.
In the experiment, first, neutral AC clusters are produced. As shown in Fig. 6, losing an AC molecule from these (AC)n clusters is endothermic by only around 0.2 eV, making it possible for the clusters to shrink even before the attachment of an electron. Therefore, any fragment observed in the experiment might be originally derived from a larger cluster. After cluster production, an electron with an energy of 2 eV is attached to the clusters. Upon electron attachment, geometry optimisation suggests that the C–Cl bond breaks, and the Cl− anion migrates into the vicinity of the CH3 groups, with the excess electron residing at the Cl− anion. This structure can be denoted as [Cl−(AC)nCH3CO], indicating that the AC molecule prevails in a non-intact form. The adiabatic electron attachment is exothermic by 0.36 eV for a single AC molecule, and increases with cluster size to 1.57 eV for (AC)5 due to the favourable interaction of Cl− with the AC units. This leads to a total available energy in the clusters of about 2–4 eV for subsequent reactions. As CH3CO is not covalently bound to the rest of the cluster, the energy required for CH3CO to leave the cluster and produce (AC)nCl− is only 0.36–0.60 eV, depending on the cluster size. This explains why (AC)nCl− is the second most prominent peak in the experimental spectrum after the pure Cl− peak.
The central role of Cl− in the DEA of AC clusters can be clearly seen by the reaction pathways collected in Fig. 6. Although production of Cl− requires more energy than, e.g., formation of (AC)nCl−, it dominates in the mass spectrum (see Fig. 4 and ESI, S1†) as it is a sink ion with many pathways ending in this ion as documented by Table 3 that lists several reactions for formation of the chlorine ion from various anions. Besides, the cluster beam probably contains quite some number of non-clustered isolated monomers that yield Cl− as the main DEA product.
Looking again at the (AC)nCl− clusters in Fig. 6, we can identify three more dissociation pathways for this cluster besides loss of Cl−: loss of AC, H2CCO or HCl. The first one is the trivial loss of an AC molecule, reducing the cluster size by one AC unit. This loss is endothermic by 0.47–0.71 eV, making it easily accessible and opening another pathway to shrink the cluster size. The second pathway is arguably more interesting, describing the production of (AC)nHCl2− by dissociation of H2CCO. This reaction is endothermic by only 0.47–0.81 eV, explaining why (AC)nHCl2− is the third most prominent peak in the experimental spectrum (Fig. 4). This pathway also seems quite easily accessible from a kinetic perspective: The Cl− anion in (AC)nCl− takes an H atom from the CH3 group, leading to the formation of a C![[double bond, length as m-dash]](https://www.rsc.org/images/entities/char_e001.gif) C double bond and subsequent C–Cl bond cleavage. The arising Cl− anion then interacts with the HCl molecule, leading to the formation of (AC)nHCl2−. The resulting neutral H2CCO simply leaves the cluster. In our calculations, clusters including the HCl2− moiety were found to be preferred both energetically and kinetically compared to other isomers of (AC)nHCl2− stoichiometry. It should be mentioned here that the single HCl2− anion has also been observed in the experiment (see ESI, Fig. S1†). The HCl2− ion is missing in Fig. 4a as this is the spectrum of the AC monomer.
C double bond and subsequent C–Cl bond cleavage. The arising Cl− anion then interacts with the HCl molecule, leading to the formation of (AC)nHCl2−. The resulting neutral H2CCO simply leaves the cluster. In our calculations, clusters including the HCl2− moiety were found to be preferred both energetically and kinetically compared to other isomers of (AC)nHCl2− stoichiometry. It should be mentioned here that the single HCl2− anion has also been observed in the experiment (see ESI, Fig. S1†). The HCl2− ion is missing in Fig. 4a as this is the spectrum of the AC monomer.
The third dissociation pathway for (AC)nCl− is the loss of HCl, producing [(AC)n–H]− anions. We suggest here two qualitatively different reaction products, which are shown in the last two columns of Fig. 6. The first structure corresponds to the simple HCl dissociation without significant reorganisation inside the cluster. This reaction is kinetically and energetically easily accessible, explaining the occurrence of [(AC)n–H]− in the spectrum. However, since this reaction is energetically higher than the loss of H2CCO, it explains why the [(AC)n–H]− peaks are less abundant than the ones of (AC)nHCl2− in the experiment. The alternative possibility for HCl loss with formation of a new carbon–carbon bond is given in the last column of Fig. 6. On the one hand, this pathway is around 1 eV lower in energy than the first one; on the other hand, it seems kinetically much harder. It is thus unclear which of the two alternative pathways is dominant in the experiment.
A similar discussion can be conducted for the experimental observation of [(AC)n+H]−. Possible pathways are shown in Fig. 7 for the example of [(AC)2+H]−. All pathways would be energetically accessible in the experiment. However, the upper two pathways are energetically higher, whereas the bottom pathway is kinetically more difficult to follow, leaving the uncertainty with respect to the isomer distribution of [(AC)n+H]− in the experiment. Even though production of [(AC)n+H]− is energetically more favourable than that of (AC)nHCl2−, we can tentatively explain the lower experimental abundance by more complicated kinetics.
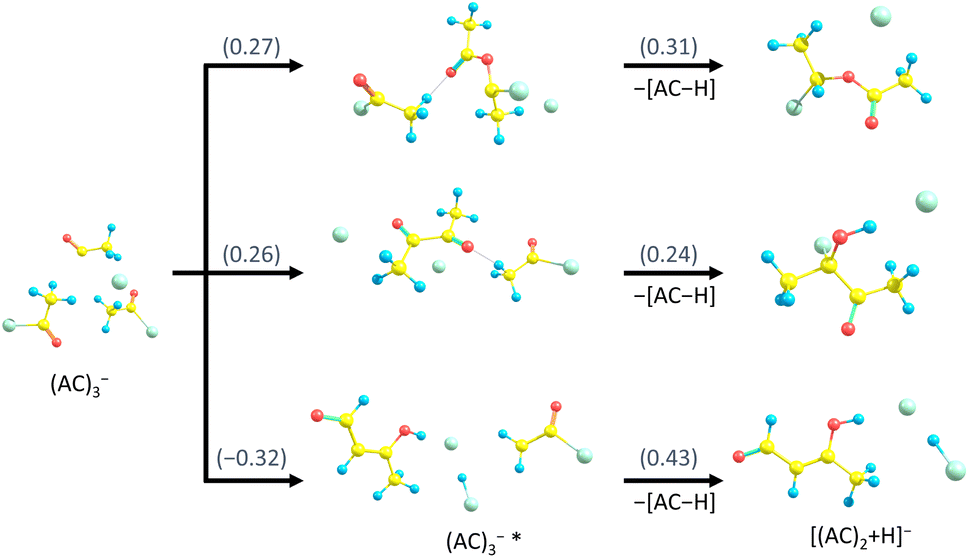 | ||
| Fig. 7 Suggested fragmentation channels from (AC)3− to [(AC)2+H]−, with reaction energies in eV calculated at the ωB97XD/def2TZVP level of theory. The bottom structure of [(AC)2+H]− is energetically more stable, while the two top structures are likely more easily accessible kinetically. | ||
Overall, our theoretical calculations match quite well with the experimental results, giving further insight into the involved structures and reaction mechanisms. The Cl− anion can be identified as the driving force for basically all observed reactions.
4. Discussion
The electron attachment to AC molecules was previously investigated in an early mass spectrometry experiment with a trochoidal electron monochromator.35 Cl− was produced with zero kinetic energy electrons, and the resonance extended to about 2.5 eV (with 0.2 eV resolution). However, the authors also observed other minor DEA channels, e.g., CH2COCl− at ≈0 eV, C2H3O− at ≈1 eV, and O− at ≈9 eV. In our present study, we observe only the Cl− anion. The abundance of the other ions in our experiment is probably too low to be detected, referring to their lower signal-to-noise ratio compared to Cl− as observed in ref. 35. We concentrate on the electron attachment to the clusters.The major anion series (AC)nCl− is well substantiated by our calculations. They show that the electron attachment to (AC)n cluster generates a transient negative ion (TNI) and the released energy leads to the change in the structure of the cluster and subsequent CH3CO release yielding (AC)n−1Cl−. These processes are energetically easily accessible. Further evaporation of H2CCO from the cluster anion, leading to the next weaker observed series (AC)nHCl2−, which is energetically more demanding, yet still possible at our electron energy of 2 eV. Further very weak [(AC)n–H]− series originates from the H abstraction. Two different pathways are proposed. In comparison to the (AC)nHCl2− ion formation, one channel is energetically higher, whereas the other one is kinetically less accessible, explaining the lower abundance of the [(AC)n–H]− series. In addition, contributions to the [(AC)nH]− series are suggested. However, the abundances of these ions in our experiment are too low for an unambiguous analysis. Nevertheless, the formation of the main (AC)nCl− ions and two minor series (AC)nHCl2− and [(AC)n–H]− observed in the experiment is well explained by our calculations.
Finally, we focus on differences and similarities of chemical patterns with respect to previous studies on similar molecules. First, we compare the electron attachment to the present acetyl chloride molecule, CH3COCl, with that to trichloroacetic acid (TCA, CCl3COOH). The electron attachment to TCA was previously investigated for isolated molecules23,24 and clusters.19 Both the AC and TCA molecules produce Cl− as by far the major product upon DEA. In both cases, the cluster anion mass spectra are also dominated by a strong Cl− peak at low electron energies around 2 eV. However, it is not possible to distinguish between the contribution of Cl− escaping from the clusters and the Cl− contribution originating from the DEA of the isolated molecules present in the beam.
The main cluster ions in the part of the AC spectrum beyond the monomer mass are the (AC)nCl− fragments. On the other hand, in (TCA)n clusters, there are no (TCA)nCl− ions. Instead, the H abstraction channel yielding [(TCA)n–H]− dominates the cluster spectrum. This demonstrates a quite different fragmentation of these molecules in an environment despite the common most abundant Cl− fragment for both isolated molecules. However, it should be noted that the Cl− fragment originates from C–Cl at different positions in the two molecules.
Furthermore, we can compare the present AC with the previously studied trifluoroacetyl chloride (TFAC, CF3COCl),13 where the Cl atom is in the same position and CH3 is replaced with the electronegative CF3 group. Again, Cl− is the main fragment of the TFAC molecule at low electron energies around 2 eV (at higher energies above 4 eV, CF3− dominates). Once again, TFAC fragments differ upon complexation in clusters. At low electron energies around 2 eV, essentially intact (TFAC)n− ions dominate the spectrum with a small contribution of (TFAC)nCl− fragments. However, at higher electron energies above approximately 5 eV, (TFAC)nCl− become dominant and (TFAC)nCl2− occur, while (TFAC)n− remain as minor peaks in the spectrum.
The take-home message from this comparison is that assumptions about molecular fragmentation upon DEA in an environment cannot generally be based upon the fragmentation observed for isolated molecules. Here, we have examples of three similar molecules (AC, TCA and TFAC) yielding Cl− as the major DEA product, yet they all exhibit a different fragmentation pattern in clusters (at the same electron energies). This is illustrated schematically in Fig. 8.
 | ||
| Fig. 8 Fragmentation pathways upon attachment of 2 eV electrons to similar molecules (AC, TCA and TFAC) and their clusters. All three molecules have as isolated molecule Cl− as the major product of dissociative electron attachment (left-pointing arrows), while in an environment, their fragmentation patterns are unique (arrows pointing right). | ||
5. Conclusions
We investigated the electron attachment of acetyl chloride molecules and clusters in a molecular beam experiment and by extensive theoretical calculations. The main DEA product of the AC molecule is Cl−, which leads to a prominent (AC)nCl− series in clusters. This is well substantiated by our calculations. Further unambiguous weaker ion series (AC)nHCl2− and [(AC)n–H]− in the mass spectra were identified and computationally justified. A possible minor contribution of other ions has been discussed. Our global optimisation effort using genetic algorithm search revealed a rich potential energy surface of the weakly bound clusters.The main conclusion of our present investigation concerns a comparison with similar other molecules summarised in Fig. 8. The DEA of the three isolated molecules AC, TFAC, and TCA, results mainly in the Cl− anion. However, the electron attachment to their clusters yields distinctly different cluster anions. This finding underlines the main message of our present study: outcomes of reactions of electrons with molecules in solvent cannot be easily predicted from the DEA process in the gas phase. The study emphasizes the significance of cluster investigations in understanding the effects of solvents at the molecular level.
Data availability
The data that support the findings of this study are available within the article and its ESI.† Further data are available from the public repository DOI: https://doi.org/10.48700/datst.yqs1c-ekp89.Author contributions
Barbora Kocábková: data curation (lead); formal analysis (equal); investigation (equal); visualization (equal); writing – review & editing (supporting). Jozef Ďurana: data curation (supporting); formal analysis (supporting); investigation (supporting). Jozef Rakovský: investigation (supporting); methodology (supporting); supervision (supporting). Viktoriya Poterya: investigation (supporting); methodology (supporting); supervision (supporting); formal analysis (equal); writing – review & editing (supporting). Michal Fárník: conceptualization (lead); formal analysis (equal); funding acquisition (lead); investigation (equal); methodology (equal); project administration (lead); supervision (equal); validation (lead); visualization (supporting); writing – original draft (lead); writing – review & editing (equal). Michael Gatt: data curation (lead); formal analysis (equal); investigation (equal); visualization (equal); writing – original draft (equal). Gabriel Schöpfer: formal analysis (equal); investigation (equal); writing – original draft (equal). Philipp Jung: investigation (supporting); methodology (equal). Milan Ončák: conceptualization (lead); formal analysis (equal); investigation (equal); methodology (equal); project administration (lead); supervision (equal); validation (lead); writing – review & editing (equal).Conflicts of interest
The authors have no conflicts to disclose.Acknowledgements
The authors BK, JD, VP and MF thank the Czech Science Foundation (GAČR) project no. 24-11390S, and JR thanks MEYS, OP JAK project CZ.02.01.01/00/22_008/0004558 “AMULET”. This research was funded in part by the Austrian Science Fund (FWF), Grant DOI https://doi.org/10.55776/P35013 (MG, GS, MO). GS acknowledges receipt of a DOC Fellowship of the Austrian Academy of Sciences. The computational results presented here have been achieved using the LEO HPC infrastructure of the University of Innsbruck.References
- R. D. Kimbrough, Toxicity of chlorinated hydrocarbons and related compounds, Arch. Environ. Health, 1972, 25, 125 CrossRef CAS PubMed.
- U. G. Ahlborg, T. M. Thunberg and H. C. Spencer, Chlorinated phenols: Occurrence, toxicity, metabolism, and environmental impact, Crit. Rev. Toxicol., 1980, 7, 1 CrossRef CAS PubMed.
- Q. Song, F. Kong, B.-F. Liu, X. Song and H.-Y. Ren, Biochar-based composites for removing chlorinated organic pollutants: Applications, mechanisms, and perspectives, Environ. Sci. Technol., 2024, 21, 100420 CAS.
- T. P. Barnum and J. D. Coates, The biogeochemical cycling of chlorine, Geobiology, 2022, 20, 634 CrossRef CAS PubMed.
- G. Gribble, The diversity of natural organochlorines in living organisms, Pure Appl. Chem., 1996, 68, 1699 CrossRef CAS.
- K. C. Engvild, Chlorine-containing natural compounds in higher plants, Phytochemistry, 1986, 25, 781 CrossRef CAS.
- M. R. Heal, N. M. Reeves and J. N. Cape, Atmospheric concentrations and deposition of trichloroacetic acid in Scotland: Results from a 2-year sampling campaign, Environ. Sci. Technol., 2003, 37, 2627 CrossRef CAS PubMed.
- E. J. Hoekstra, Review of concentrations and chemistry of trichloroacetate in the environment, Chemosphere, 2003, 52, 355 CrossRef CAS PubMed.
- J. N. Cape 1, S. T. Forczek, G. Gullner, G. Mena-Benitez, P. Schröder and M. Matucha, Progress in understanding the sources, deposition and above-ground fate of trichloroacetic acid, Environ. Sci. Pollut. Res., 2006, 13, 276 CrossRef PubMed.
- N. Winterton, Chlorine: the only green element – towards a wider acceptance of its role in natural cycles, Green Chem., 2000, 2, 173 RSC.
- J. B. Burkholder, R. Cox and A. Ravishankara, Atmospheric degradation of ozone depleting substances, their substitutes, and related species, Chem. Rev., 2015, 115, 3704 CrossRef CAS PubMed.
- J. Janoš, I. S. Vinklárek, J. Rakovský, D. P. Mukhopadhyay, B. F. E. Curchod, M. Fárník and P. Slavíček, On the wavelength-dependent photochemistry of the atmospheric molecule CF3COCl, ACS Earth Space Chem., 2023, 7, 2275 CrossRef PubMed.
- B. Kocábková, J. Ďurana, J. Rakovský, A. Pysanenko, J. Fedor, M. Ončák and M. Fárník, Electron-triggered processes in halogenated carboxylates: Dissociation pathways in CF3COCl and its clusters, Phys. Chem. Chem. Phys., 2024, 26, 5640 RSC.
- L. Sanche, Beyond radical thinking, Nature, 2009, 461, 358 CrossRef CAS PubMed.
- L. Sanche, Low energy electron-driven damage in biomolecules, Eur. Phys. J. D, 2005, 35, 367 CrossRef CAS.
- O. Ingólfsson, F. Weik and E. Illenberger, The reactivity of slow electrons with molecules at different degrees of aggregation: gas phase, clusters and condensed phase, Int. J. Mass Spectrom., 1996, 155, 1 CrossRef.
- I. Bald, J. Langer, P. Tegeder and O. Ingólfsson, From isolated molecules through clusters and condensates to the building blocks of life. A short tribute to Prof. Eugen Illenberger's work in the field of negative ion chemistry, Int. J. Mass Spectrom., 2008, 277, 4 CrossRef CAS.
- I. I. Fabrikant, Electron attachment to molecules in a cluster environment: suppression and enhancement effects, Eur. Phys. J. D, 2018, 72, 96 CrossRef.
- B. Kocábková, G. Schöpfer, J. Ďurana, J. Rakovský, V. Poterya, M. Gatt, D. Jank, M. Ončák and M. Fárník, Electron attachment to CCl3COOH molecule and clusters, Phys. Scr., 2024, 99, 125410 CrossRef.
- A. Pelc, W. Sailer, P. Scheier, M. Probst, N. J. Mason, E. Illenberger and T. D. Märk, Dissociative electron attachment to formic acid (HCOOH), Chem. Phys. Lett., 2002, 361, 277 CrossRef CAS.
- W. Sailer, A. Pelc, M. Probst, J. Limtrakul, P. Scheier, E. Illenberger and T. D. Märk, Dissociative electron attachment to acetic acid (CH3COOH), Chem. Phys. Lett., 2003, 378, 250 CrossRef CAS.
- J. Langer, I. Martin, G. Karwasz and E. Illenberger, Chemical reactions in clusters of trifluoroacetic acid (CF3COOH) triggered by electrons at sub-excitation energy (<2 eV), Int. J. Mass Spectrom., 2006, 249–250, 477 CrossRef.
- J. Kopyra, C. König-Lehmann and E. Illenberger, Low energy (0–10 eV) electron driven reactions in the halogenated organic acids CCl3COOH, CClF2COOH, and CF3CHNH2COOH (trifluoroalanine), J. Chem. Phys., 2011, 135, 124307 CrossRef PubMed.
- J. Kopyra, C. König-Lehmann, I. Szamrej and E. Illenberger, Unusual features in electron attachment to chlorodifluoroacetic acid (CClF2COOH): Strong dissociative electron attachment near 0 eV and associative attachment at 0.75 eV, Int. J. Mass Spectrom., 2009, 285, 131 CrossRef CAS.
- B. Hartke, Global optimization, Wiley Interdiscip. Rev.: Comput. Mol. Sci., 2011, 1, 879 CAS.
- A. Žilinskas, A review of statistical models for global optimization, J. Global Oncol., 1992, 2, 145 Search PubMed.
- S. H. Choi, J. W. Ko and V. Manousiouthakis, A stochastic approach to global optimization of chemical processes, Comput. Chem. Eng., 1999, 23, 1351 CrossRef CAS.
- B. Hartke, Application of evolutionary algorithms to global cluster geometry optimization, in Applications of Evolutionary Computation in Chemistry, Structure and Bonding, ed. R. Johnson, 2004, vol. 110, pp. 33–53 Search PubMed.
- R. Thangaraj, M. Pant, A. Abraham and P. Bouvry, Particle swarm optimization: Hybridization perspectives and experimental illustrations, Appl. Math. Comput., 2011, 217, 5208 CrossRef.
- J. Zhang and M. Dolg, ABCluster: the artificial bee colony algorithm for cluster global optimization, Phys. Chem. Chem. Phys., 2015, 17, 24173 RSC.
- B. Hartke, Global geometry optimization of clusters using genetic algorithms, J. Phys. Chem., 1993, 97, 9973 CrossRef CAS.
- J. Kubečka, V. Besel, I. Neefjes, Y. Knattrup, T. Kurtén, H. Vehkamäki and J. Elm, Computational tools for handling molecular clusters: Configurational sampling, storage, analysis, and machine learning, ACS Omega, 2023, 8, 45115 CrossRef PubMed.
- E. Martínez-Núñez, G. L. Barnes, D. R. Glowacki, S. Kopec, D. Peláez, A. Rodríguez, R. Rodríguez-Fernández, R. J. Shannon, J. J. P. Stewart, P. G. Tahoces and S. A. Vazquez, AutoMeKin2021: An open-source program for automated reaction discovery, J. Comput. Chem., 2021, 42, 2036 CrossRef PubMed.
- G. Schöpfer, M. Gatt, and M. Ončák, Genetic algorithms, 2024, https://git.uibk.ac.at/c7441332/genetic-algorithms.
- J. Hacaloglu, A. Gokmen and S. Suzer, Mass spectrometric study of negative ions from acetyl derivatives, J. Phys. Chem., 1989, 93, 3418 CrossRef CAS.
- I. I. Fabrikant, S. Caprasecca, G. A. Gallup and J. D. Gorfinkiel, Electron attachment to molecules in a cluster environment, J. Chem. Phys., 2012, 136, 184301 CrossRef CAS PubMed.
- M. Fárník, J. Fedor, J. Kočišek, J. Lengyel, E. Pluhařová, V. Poterya and A. Pysanenko, Pickup and reactions of molecules on clusters relevant for atmospheric and interstellar processes, Phys. Chem. Chem. Phys., 2021, 23, 3195 RSC.
- M. Fárník and J. Lengyel, Mass spectrometry of aerosol particle analogues in molecular beam experiments, Mass Spectrom. Rev., 2018, 37, 630 CrossRef PubMed.
- J. Lengyel, J. Kočišek, M. Fárník and J. Fedor, Self-scavenging of electrons in Fe(CO)5 aggregates deposited on argon nanoparticles, J. Phys. Chem. C, 2016, 120, 7397 CrossRef CAS.
- J. Kočišek, A. Pysanenko, M. Fárník and J. Fedor, Microhydration prevents fragmentation of uracil and thymine by low-energy electrons, J. Phys. Chem. Lett., 2016, 7, 3401 CrossRef.
- M. Kappe, A. Schiller, E. Gruber, D. Jank, M. Gatt, G. Schöpfer, M. Ončák, A. M. Ellis and P. Scheier, Spectroscopy of C60+ and C120+in the mid-infrared, J. Chem. Phys., 2023, 159, 204302 CrossRef CAS PubMed.
- M. Hütter, G. Schöpfer, M. Salzburger, M. K. Beyer and M. Ončák, Master equation modeling of water dissociation in small ionic water clusters: Ag+(H2O)n, n = 4–6, RSC Adv., 2024, 14, 22185 RSC.
- J.-D. Chai and M. Head-Gordon, Long-range corrected hybrid density functionals with damped atom-atom dispersion corrections, Phys. Chem. Chem. Phys., 2008, 10, 6615 RSC.
- M. J. Frisch, G. W. Trucks, H. B. Schlegel, G. E. Scuseria, M. A. Robb, J. R. Cheeseman, G. Scalmani, V. Barone, G. A. Petersson, H. Nakatsuji, X. Li, M. Caricato, A. V. Marenich, J. Bloino, B. G. Janesko, R. Gomperts, B. Mennucci, H. P. Hratchian, J. V. Ortiz, A. F. Izmaylov, J. L. Sonnenberg, D. Williams-Young, F. Ding, F. Lipparini, F. Egidi, J. Goings, B. Peng, A. Petrone, T. Henderson, D. Ranasinghe, V. G. Zakrzewski, J. Gao, N. Rega, G. Zheng, W. Liang, M. Hada, M. Ehara, K. Toyota, R. Fukuda, J. Hasegawa, M. Ishida, T. Nakajima, Y. Honda, O. Kitao, H. Nakai, T. Vreven, K. Throssell, J. A. Montgomery Jr, J. E. Peralta, F. Ogliaro, M. J. Bearpark, J. J. Heyd, E. N. Brothers, K. N. Kudin, V. N. Staroverov, T. A. Keith, R. Kobayashi, J. Normand, K. Raghavachari, A. P. Rendell, J. C. Burant, S. S. Iyengar, J. Tomasi, M. Cossi, J. M. Millam, M. Klene, C. Adamo, R. Cammi, J. W. Ochterski, R. L. Martin, K. Morokuma, O. Farkas, J. B. Foresman, and D. J. Fox, Gaussian 16 Revision A.03, Gaussian Inc. Wallingford CT, 2016 Search PubMed.
- C. Bannwarth, S. Ehlert and S. Grimme, GFN2-xTB—An accurate and broadly parametrized self-consistent tight-binding quantum chemical method with multipole electrostatics and density-dependent dispersion contributions, J. Chem. Theory Comput., 2019, 15, 1652 CrossRef CAS PubMed.
- C. Bannwarth, E. Caldeweyher, S. Ehlert, A. Hansen, P. Pracht, J. Seibert, S. Spicher and S. Grimme, Extended tight-binding quantum chemistry methods, Wiley Interdiscip. Rev.: Comput. Mol. Sci., 2020, 11, e01493 Search PubMed.
- Q. Zhang, W. Zhang, Y. Li, J. Wang, L. Zhang and T. Hou, A rule-based algorithm for automatic bond type perception, J. Cheminf., 2012, 4, 26 CAS.
- J. Siek, An implementation of graph isomorphism testing, 2001, https://www.boost.org/doc/libs/release/libs/graph/doc/isomorphism.html.
- M. Gatt, G. Schöpfer, and M. Ončák, structure_clustering – cluster molecular structures into groups of similar ones, 2024, https://github.com/photophys/structure_clustering.
Footnotes |
| † Electronic supplementary information (ESI) available: Experimental data and structure and energies of all calculated isomers. See DOI: https://doi.org/10.1039/d5ra02679b |
| ‡ Also at: Institute of Physical Chemistry, University of Chemistry and Technology, Technická 5, Prague 6, 166 28, Czech Republic. |
| This journal is © The Royal Society of Chemistry 2025 |