DOI:
10.1039/D5RA02410B
(Paper)
RSC Adv., 2025,
15, 16433-16444
Ag-based delafossite structure prepared by solid-state reaction: investigation of optical, electrical, and dielectric properties
Received
7th April 2025
, Accepted 5th May 2025
First published on 19th May 2025
Abstract
AIBIIIO2 delafossite-type oxide materials have garnered considerable attention due to their significant physical and chemical characteristics, which have expanded their applications across various devices. This research examines AgCrO2, highlighting its advantageous optical and electrical properties. X-ray diffraction (XRD) analysis confirms that the studied sample is well-crystallized in an orthorhombic structure with an R![[3 with combining macron]](https://www.rsc.org/images/entities/char_0033_0304.gif) m space group. The studied compound with a particle size of 1.75 μm was identified using transmission electron microscopy (TEM). The band gap energy was determined through UV-visible spectroscopy and was found to be 2.8 eV. A detailed analysis of Nyquist plots demonstrates the sensitivity of the material's electrical characteristics to variations in frequency and temperature. Applying Jonscher's power law to the AC conductivity as a function of temperature suggests that the conduction mechanism in the temperature range of 313 K to 613 K can be explained by the correlated barrier hopping (CBH) model, with an activation energy of 0.47 eV from 313 K to 493 K and 1.03 eV from 523 K to 613 K. Parameters such as the hopping distance Rω and the density of localized states N(EF) were determined. The Kohlrausch–Williams–Watts (KWW) equation was employed to analyze the asymmetric curves of the electrical modulus. Additionally, the thermal variation of permittivity was interpreted using the Maxwell–Wagner effect as described by Koop's theory. Moreover, its high capacity and electrical conductivity highlight its potential for application in optoelectronic devices.
m space group. The studied compound with a particle size of 1.75 μm was identified using transmission electron microscopy (TEM). The band gap energy was determined through UV-visible spectroscopy and was found to be 2.8 eV. A detailed analysis of Nyquist plots demonstrates the sensitivity of the material's electrical characteristics to variations in frequency and temperature. Applying Jonscher's power law to the AC conductivity as a function of temperature suggests that the conduction mechanism in the temperature range of 313 K to 613 K can be explained by the correlated barrier hopping (CBH) model, with an activation energy of 0.47 eV from 313 K to 493 K and 1.03 eV from 523 K to 613 K. Parameters such as the hopping distance Rω and the density of localized states N(EF) were determined. The Kohlrausch–Williams–Watts (KWW) equation was employed to analyze the asymmetric curves of the electrical modulus. Additionally, the thermal variation of permittivity was interpreted using the Maxwell–Wagner effect as described by Koop's theory. Moreover, its high capacity and electrical conductivity highlight its potential for application in optoelectronic devices.
1 Introduction
In recent years, oxides crystallizing in the delafossite structure, with the general formula ABO2, (where A is a cation (Ag, Li, Na…) and B is a trivalent metal such as Cr, Al or Co), have emerged as technologically promising materials due to their structural, optical, and photocatalytic properties.1 These compounds are suitable for a wide range of applications in photovoltaics,2 transparent photodiodes, catalysts, and batteries,.3 Silver as a metal has various physical and chemical properties beneficial for advancing silver-based solid oxide fuel cell (SOFC) applications, including interconnect alloys, and composite cathodes.4–12 Its interesting properties, such as high electrical conductivity, hydrogen dissociation, oxidation catalysis, resistance to oxidation as a noble metal, chemical stability, and relatively low cost, also offer advantages when used in contact pastes for the fabrication and developmental testing of SOFC components.13,14 Furthermore, silver oxide, a p-type semiconductor with a bandgap energy of 1.2 eV, exhibits strong light absorption in the visible spectrum region15 and excellent electronic transport properties. Chromium, as a transition metal, enhances AgCrO2 potential for use in catalysts, batteries, transparent conducting devices, and spin-induced ferroelectricity. This study presents the synthesis and structural characteristics of the AgCrO2 compound. This material has not been extensively studied previously; the current study offers a comprehensive investigation of its optical properties, analyzed using UV-visible spectroscopy, as well as its electrical and dielectric properties. To examine the dielectric properties, we employed impedance spectroscopy, which serves as an effective tool. The dielectric study, dependent on frequency and temperature, provides valuable insights into the conduction mechanism, permittivity, and localized charge carriers. Despite limited existing literature on AC conductivity and dielectric relaxation, this study carefully explores these aspects by considering conductivity, electrical modulus, and impedance. The results obtained are thoroughly analyzed using various theoretical models. The findings are discussed in relation to various theoretical models, with detailed discussions of the ac and dc conductivity, the electric modulus and impedance characteristics of the AgCrO2 sample.
2 Experimental details
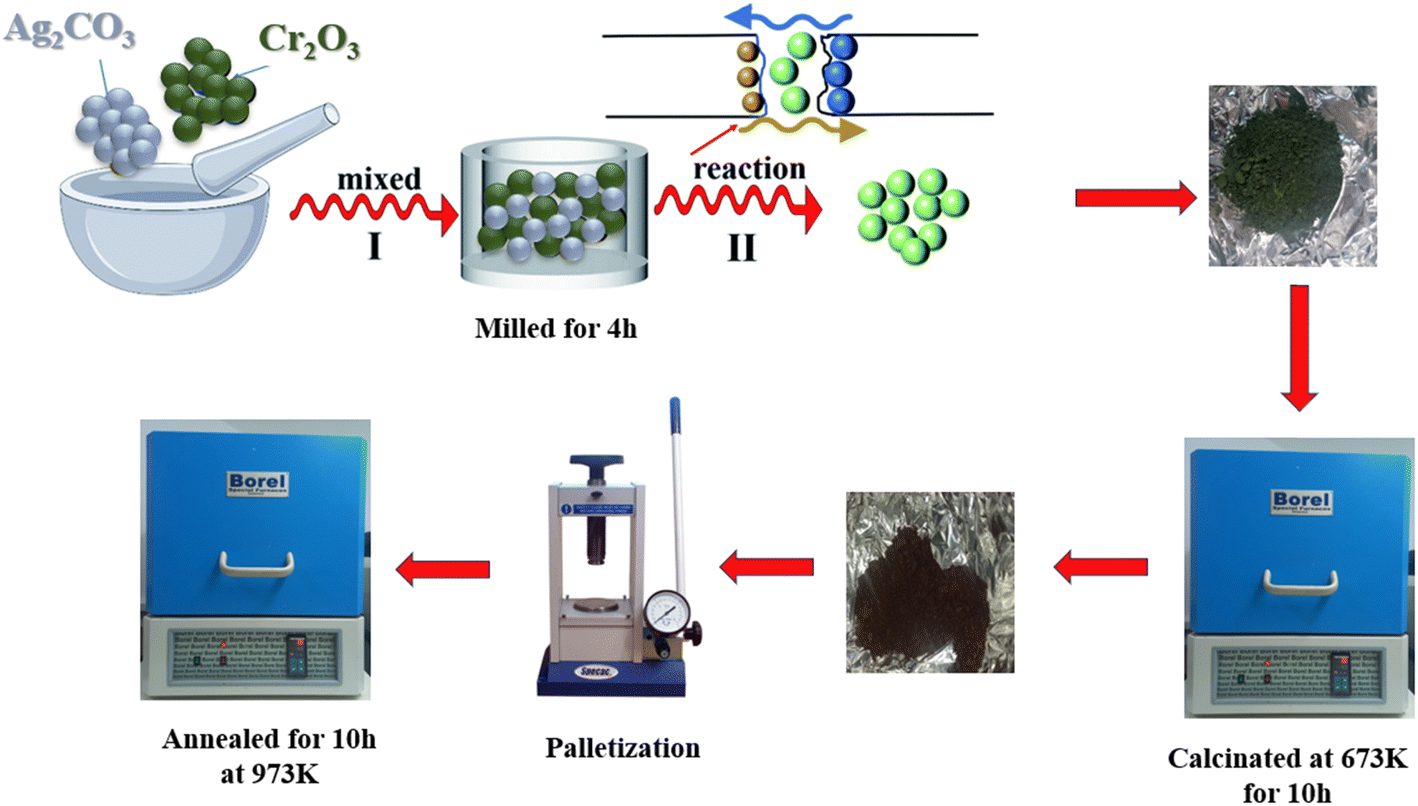
The AgCrO2 compound was prepared using the solid-state reaction method, as illustrated in Fig. 1. The high-purity Ag2CO3 (99.99%; Sigma-Aldrich) and Cr2O3 (99.99%; Sigma-Aldrich) powders were weighed in stoichiometric proportions according to the following reaction:| |
 | (1) |
 |
| | Fig. 1 Schematic diagram showing the different steps of the solid-state reaction method followed for the synthesis of AgCrO2 compound. | |
These powder amounts are blended thoroughly for one hour using an agate mortar. The obtained powder was then calcined in an alumina crucible at 673 K for 10 hours to ensure the complete release of carbon dioxide from the product. Following a second grinding and drying process, the powders compacted into a pellet of 1 mm in thickness and 8 mm in diameter using uniaxial pressure of 4000 Psi. Finally, the compound was sintered at 973 K for 10 hours. The phase purity and crystallinity were determined using X-ray diffraction (XRD) analysis with a Bruker AXS D8 ADVANCE A25 equipped with copper radiation (λcui = 1.54056 Å) at room temperature. The space group and the lattice parameters were refined using the FullProf software via the Rietveld method. The morphological analysis of the title compound was evaluated using the scanning electron microscope (SEM) and Transmission electron microscopy (TEM), equipped with an Energy Dispersive X-ray Spectroscopy (EDX). The optical absorption spectrum was recorded using a UV-Vis-NIR Shimadzu 3100 PC spectrophotometer at room temperature over a wavelength range of 200 to 1200 nm, with excitation provided by a xenon and halogen lamp. The emission property of the studied compound was studied using fluorescence spectra.
The Electrical measurements were performed using a Solartron 1260 impedance analyzer controlled via a microcomputer, was utilized with an applied voltage of 100 mV covering a frequency range from 0.1 Hz to 1 MHz and a temperature range between 313 K and 613 K. The compound was pressed into a pellet using a uniaxial hydraulic press, and for reliable electrical contact, the pellet surfaces were coated with a thin layer of silver on both sides, placed between two copper electrodes using a customized sample holder.
3 Results and discussion
3.1 X-ray diffraction and crystal structure
The X-ray powder diffraction pattern at room temperature of AgCrO2 is shown in Fig. 2a. The absence of impurity peaks and secondary phases indicates the successful synthesis of a high-quality sample. The XRD pattern of AgCrO2 matched with ICDD card No. 70-1703. In fact, all diffraction peaks corresponding to the 2θ values have been accurately indexed within the orthorhombic system, specifically in the Rm space group. The refined lattice parameters and reliability factors were determined and are presented in Table 1. The experimental findings regarding the unit cell parameters of the AgCrO2 compound align well with the data reported in the literature.16–18 The crystal structure of AgCrO2, created using VESTA,19 is depicted inset Fig. 2a. This structure consists of a layer comprising Ag atoms intercalated between layers composed of CrO6 surrounded by oxygen atoms, sharing their edges to form triangular layers of CrO2 stacked along the c-direction.
 |
| | Fig. 2 (a) Observed, and calculated X-ray powder diffraction patterns and reflection positions are marked for the phase. Inset projection crystal structure c-axis. (b) Selection of the highest peak in the X-ray diffraction pattern for the determination of crystallite size using the Scherrer equation. | |
Table 1 Crystal data for AgCrO2 compounds
| Space group |
Rm |
| a (Å) |
2.983(8) |
| b (Å) |
2.983(8) |
| c (Å) |
18.499(7) |
| α, β |
90 |
| γ |
120 |
| Rp |
36 |
| Rwp |
40 |
| Rexp |
26.93 |
| χ2 |
2.18 |
| Volume |
142.638 |
The size of the crystallites of the studied compound was computed utilizing Debye Scherrer's formula:20
| |
 | (2) |
where
λ is the wavelength of CuKα radiation (
λ = 1.54056 Å),
k is the shape factor (
k = 0.9), and
β represents the full width at half maximum (FWHM). The average crystallite size was determined to be
DSC = 44 nm. (
Fig. 2b). The crystallite size is smaller than the result with the flash auto-combustion reaction method (
DSC = 77 nm).
21
3.2 Morphological description and particle size distribution
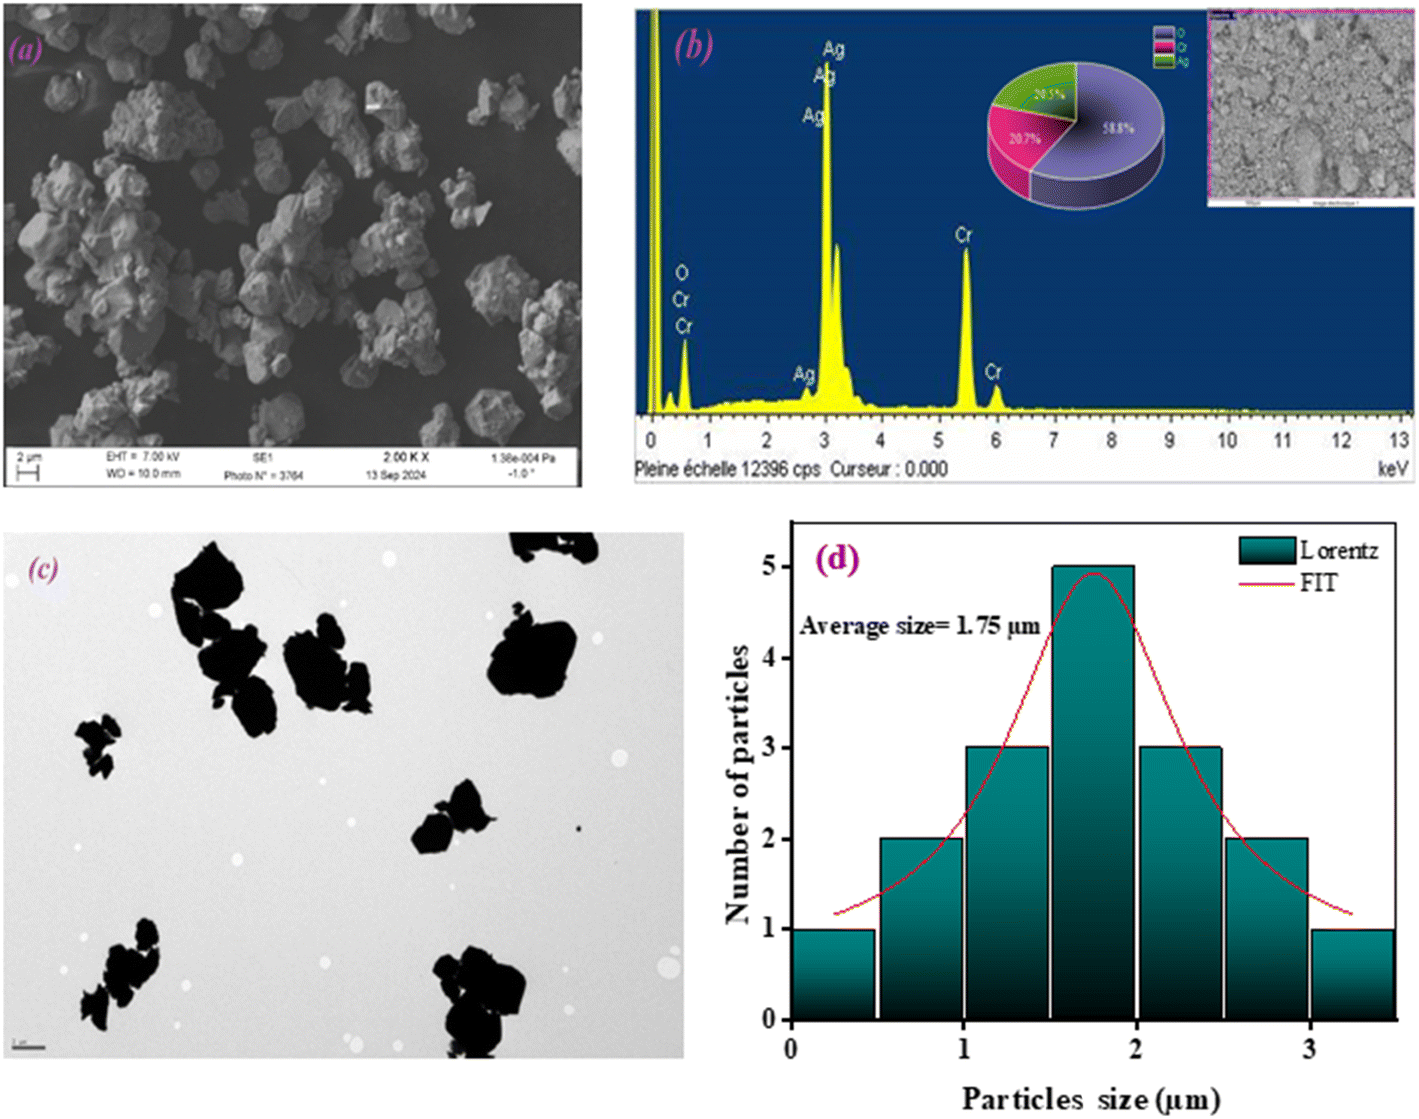
The SEM image in Fig. 3a clearly indicates that this sample features a homogeneous distribution of grains in both small and large sizes. The elemental distribution of the AgCrO2 compound is analyzed using EDX, as shown in Fig. 3b. This result shows that Ag, Cr, and O are present in the material, providing clear evidence that no loss occurred during the formation of this compound. To estimate the particle size distribution, transmission electron microscopy (TEM) analysis was performed, and the results are shown in Fig. 3c. Grain sizes were manually counted on the TEM images using ImageJ software.22 The results are presented as histograms in Fig. 3d, showing counts (number of grains) plotted against particle size. This histogram indicates that the particle sizes mainly range from 0.2 μm to 3 μm, with an average size of 1.7 μm. This suggests that the grains or the secondary particles exhibit a polycrystalline structure, consisting of numerous smaller primary crystallites determined by the XRD analysis.23
 |
| | Fig. 3 (a) SEM image of AgCrO2, (b) the elemental analysis by EDX, (c) TEM image of AgCrO2, (d) the particle size distribution. | |
3.3 Optical properties
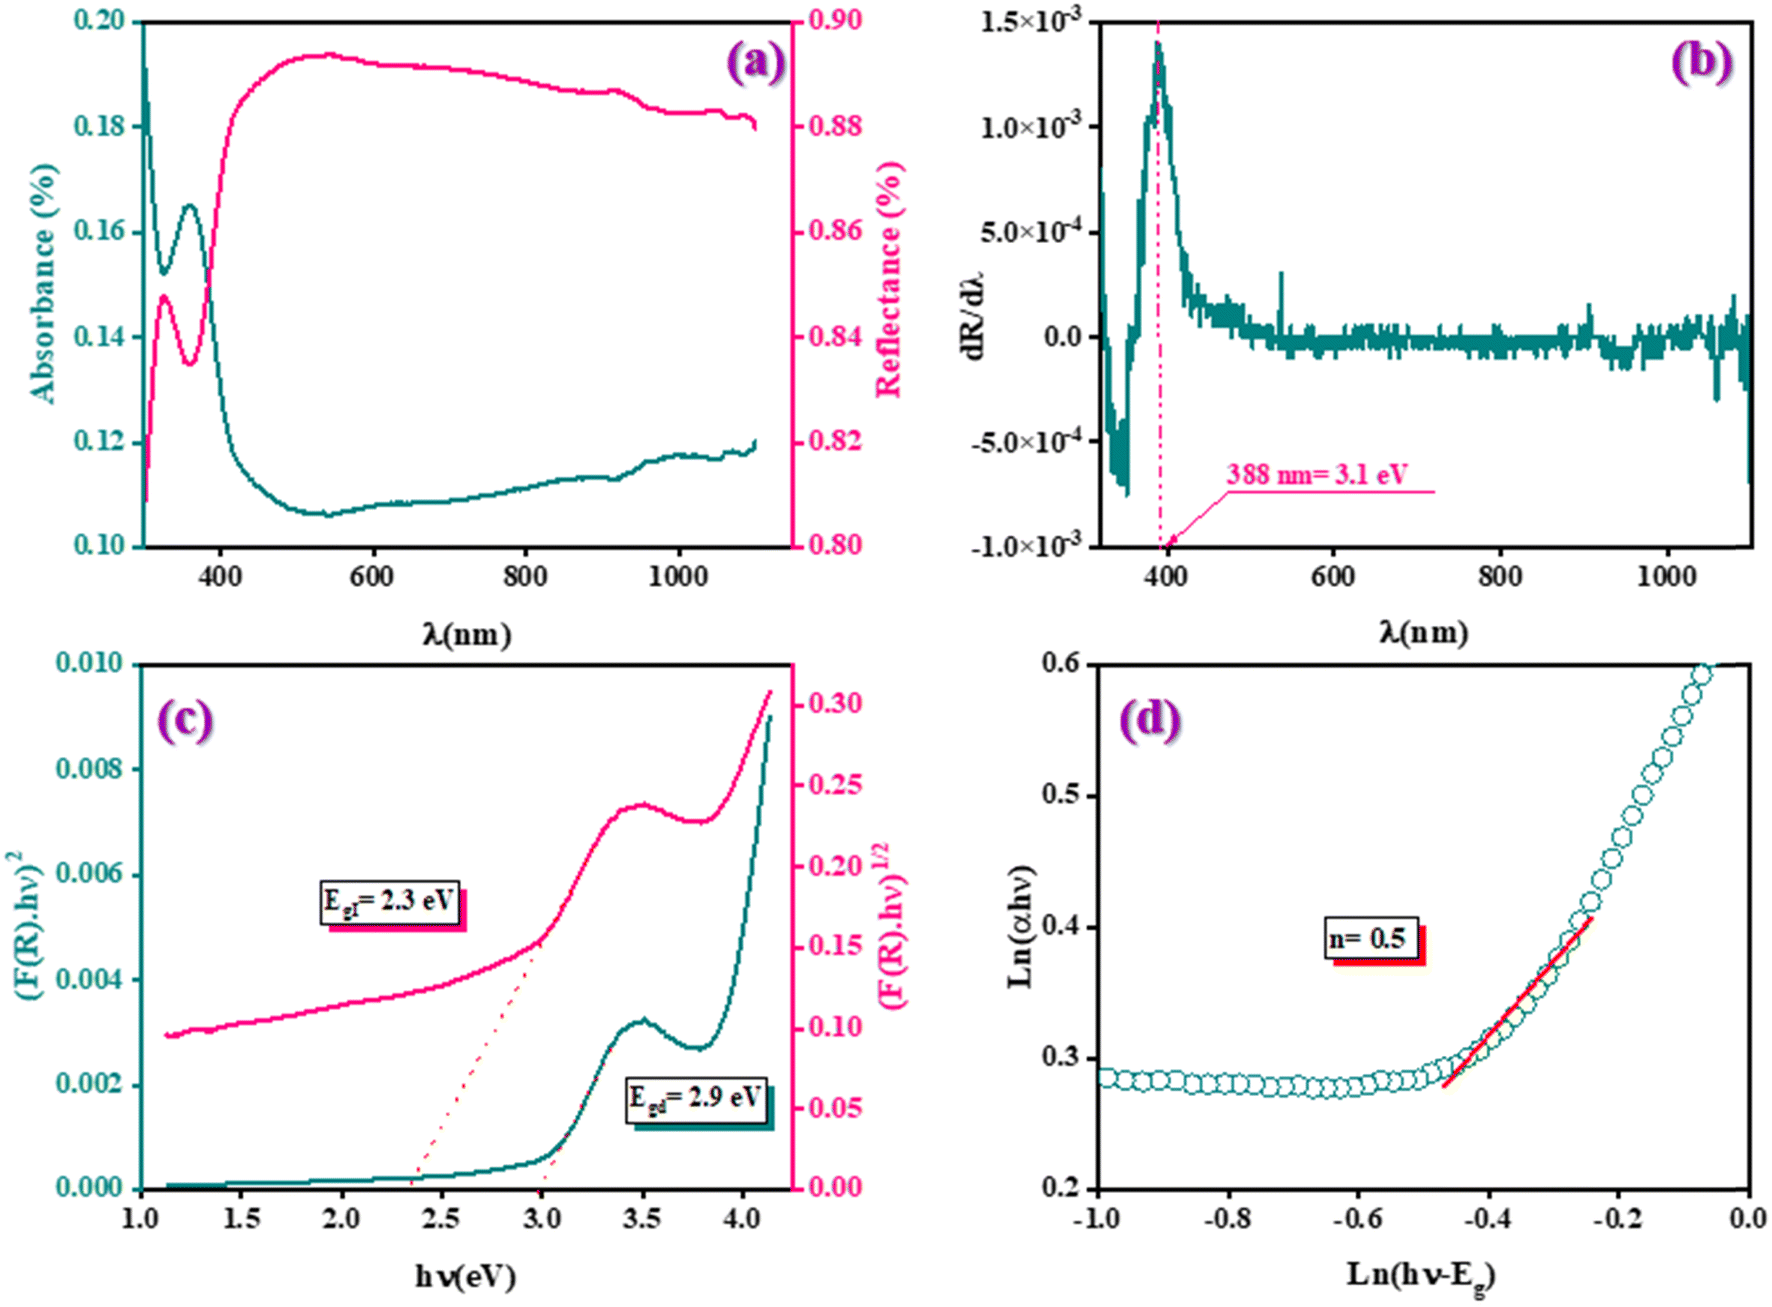
In this section, we aim to evaluate the light efficiency and quality of our prepared delafossite compound by presenting and discussing its key optical properties. Fig. 4a depicts the UV-Vis absorption and reflectance spectrum of the title compound in the range of wavelength from 200 nm to 1200 nm. The presence of a peak at 360 nm indicates high absorbance related to the transition of electrons from the valence band to the conduction band.24 The high absorbance in the visible range indicates that our studied compound presented as a good candidate for developing photovoltaic solar cells.25,26 The optical band gap Eg represents the minimum photon energy required for an electron to transition from the valence band (VB) to the conduction band (CB). In our study, this value was estimated using the Marotti method.27,28 As shown in Fig. 4b, the derivative of the reflectance spectrum (dR/dλ) is plotted as a function of wavelength λ. The band gap energy corresponds to the wavelength at which the maximum of the dR/dλ curve occurs, yielding an estimated value of Eg = 3.1 eV.
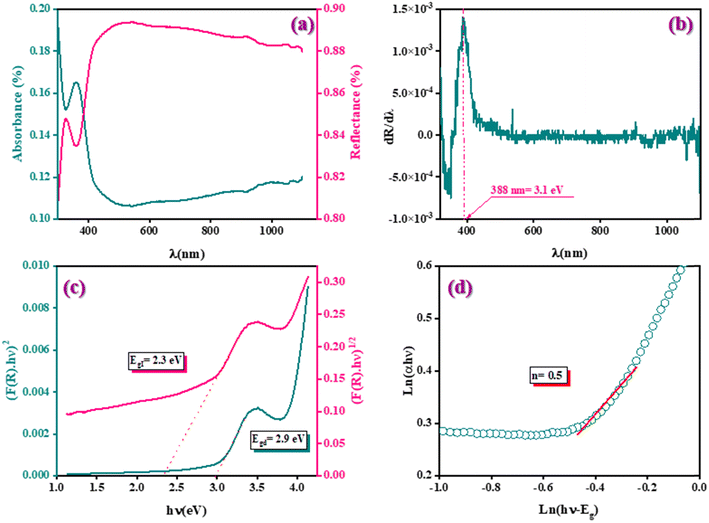 |
| | Fig. 4 (a) UV-Vis absorbance and reflectance spectrum at room temperature, (b) evolution of dR/dλ as a function of λ, (c) the evolution of ln(αhν) against ln(hν − Eg), (d) plot of n(F(R) × hν)2 and (F(R) × hν)1/2 versus hν. | |
This result is further supported by analysis using the Kubelka–Munk function:29
| | |
[F(R) × hν]1/n = A(hν − Eg)
| (3) |
where
hν is the photon energy,
n = 1/2 for direct allowed transitions,
n = 2 for indirect allowed transitions,
Eg presents the optical band gap and
F(
R∞) is the Kubelka–Munk function, which is proportional to the absorption coefficient when the scattering is constant and it's defined as following:
| |
 | (4) |
here,
R∞ represents the diffuse reflectance of an optically thick sample.
K denotes the absorption coefficient, which indicates the amount of light absorbed by the material, while
S is the scattering coefficient, describing the extent to which light is scattered within the sample.
Fig. 4c depicts the variation (
F(
R) ×
hν)
1/n versus the energy photon
E =
hν with
n = 1/2 and 2 for direct and indirect band gap, respectively. Thus, band gap energy
Egd = 2.9 eV and
EgI = 2.3 eV for direct and indirect transitions, respectively. In order to confirm whether the optical band transition mode of our compound is direct or indirect, the plot ln(
αhν) against ln(
hν −
Eg) is illustrated in
Fig. 4d. We have used the
Eg = 3.1 eV that was obtained from the Marotti method. We have obtained straight lines whose slope gives the power factor (
n). Therefore,
n is closer to 1/2, confirming the direct transition behaviour in the studied compound.
The band gap energy is crucial for determining the electrical and optical properties of materials, the Urbach energy presents the dislocation and the imperfection of the studied material as explained in Fig. 5a using the following relation:30
| |
 | (5) |
where
α0 is a constant and
Eu is the Urbach energy (eV). Therefore,
Fig. 5b depicts the variation of ln(
α)
versus hν, to obtain the Urbach energy value from the straight line to be 0.9 eV, which presents 30% of the band gap energy of the compound AgCrO
2.
 |
| | Fig. 5 (a). Schematic representation of transitions between valence band (VB) and conduction band (CB), (b). a plot of ln(α) versus hν (eV) to determine Urbach energy. | |
Fluorescence spectroscopy was used to confirm the direct bandgap transition in AgCrO2.31,32 The emission spectrum, obtained at an excitation wavelength of 360 nm, is presented in Fig. 6. The prominent emission peak at 406 nm corresponds to the direct transition, which is consistent with the 2.9 eV bandgap determined from the UV-VIS results shown in Fig. 4c.
 |
| | Fig. 6 Fluorescence emission spectrum of the AgCrO2 compound. | |
This value is lower compared to those found in AgInO2 (4.2 eV) and AgGaO2 (4.1 eV).33 Substituting In and Ga with Al alters the interatomic distances within the crystal lattice, which in turn shifts the locations of the valence and conduction bands. As a result, the bandgap decreases from 4.2 eV and 4.1 eV to 2.9 eV. Therefore, the compound AgCrO2 is a good candidate for several applications such as solar cells, optoelectronic devices, and photodetectors.34–36
3.4 Electrical properties
3.4.1 Complex impedance spectroscopy. Complex impedance spectroscopy (CIS) is a valuable technique for studying the electrical properties of materials. It allows for the separation of electrical responses related to grains and grain boundaries, each characterized by distinct relaxation times. Fig. 7 displays the Nyquist plots for the AgCrO2 compound, measured at different frequencies and various temperatures. These plots exhibit semicircles with their centers positioned below the real impedance axis. The analysis of the complex plane reveals two broad semicircles. The first, observed on the low-frequency side, corresponds to the grains' contribution, while the second, on the high-frequency side, is attributed to the grain boundaries. The presence of these depressed semicircles suggests a non-Debye-type relaxation process, indicative of a distribution of relaxation times37,38 that may be attributed to various factors, such as the arbitrary distribution and growth of grain sizes, variations in grain shapes and orientations, or the influence of electromagnetic scattering effects.39 The complex impedance spectra clearly show that the resistance decreases with increasing temperature, which can be attributed to thermal activation and the release of localized charge carriers as the temperature rises. This behavior verifies the semiconducting nature of the AgCrO2 sample.
 |
| | Fig. 7 Complex impedance plots in the Nyquist at several temperatures of the AgCrO2 compound, inset the equivalent circuit. | |
The Nyquist plots for the studied compound were analyzed with Z-View software40 using an equivalent circuit. The diameter of each semicircle in the Nyquist (Cole–Cole) plot corresponds to the resistance of the material components. The specific electrical properties of grains and grain boundaries are represented by an electrical circuit comprising two series-connected branches. This series combination of two parallel circuits distinguishes the effects of grain boundaries and grains, respectively. The first component is composed of a parallel arrangement of the grain resistance Rg, the capacitance C, and the constant phase element (CPE). The second component features a parallel combination of grain boundary resistance Rbg and the grain boundary constant phase element (CPE) (Rg//C//CPE + Rgb//CPE). The inclusion of constant phase elements (CPE) in both grains and grain boundaries indicates a non-ideal capacitive behavior, which may arise from multiple relaxation processes occurring within the grains and grain boundaries.41 The good fit confirms distinct contributions from both regions to the material's electrical response.
3.4.2 AC conductivity. Fig. 8 shows the variation of AC conductivity as a function of frequency at different temperatures, ranging from 313 K to 613 K. In the low-frequency plateau, the conductivity remains nearly constant and independent of frequencies, aligning closely with dc conductivity. As frequency rises into the high-frequency region, conductivity proportionally increases. This frequency-dependent behavior reflects a universal dynamic response (UDR) in ionic conductivity, refinedly described by the Jonscher power law:42where σac represents the ac conductivity, σdc denotes the dc conductivity, A is the pre-exponential constant, ω is the angular frequency, and s is the power law exponent, where 0 < s < 1. Fig. 9 depicts the temperature-dependent behavior of conductivity, presented as ln(σdc × T) versus 1000/T. The logarithm of σdc × T decreases linearly as temperature decreases, indicating its correlation with the Arrhenius law governing conduction in the material:43| |
 | (7) |
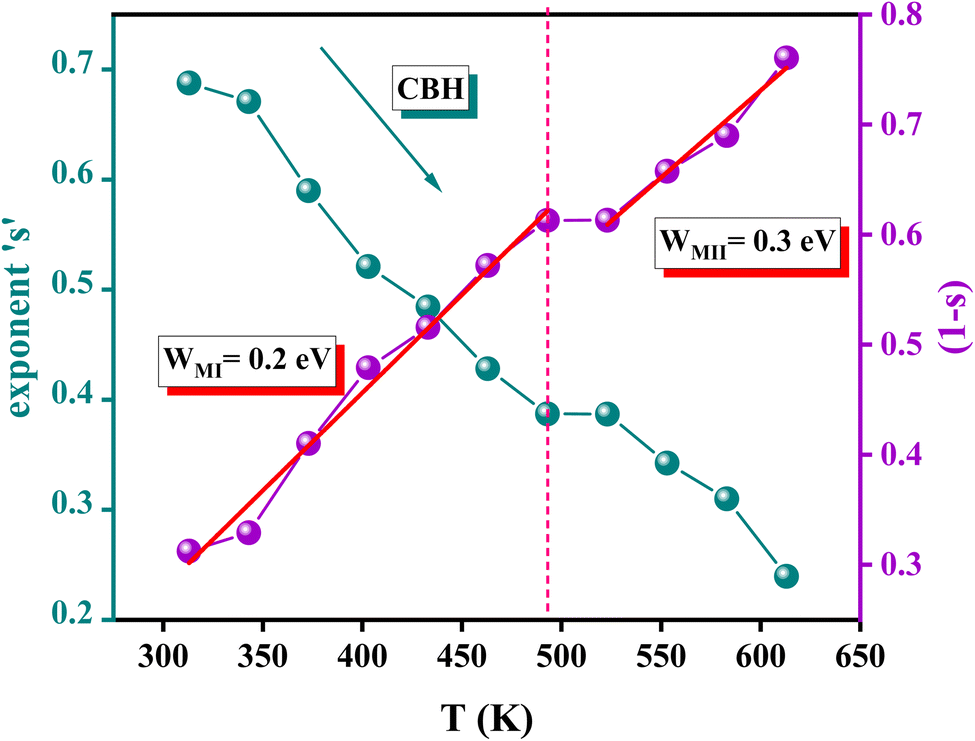
where, A is a constant, kB is the Boltzmann constant, and Ea presents the activation energy of the moving charge carriers. Notably, the curve exhibits two clear linear regions, with a noticeable change in slope occurring at approximately 493 K. The calculated activation energies for regions I and II are Ea (I) = (1.03 ± 0.05) eV and Ea (II) = (0.47 ± 0.03) eV, respectively.44 This observation suggests that the change in the activation energy is due to the change in the conduction charge transport process. Fig. 10 illustrates the behavior of ‘s’ estimated from the fitting of AC conductivity. The variation of the exponent ‘s’ with temperature allowed us to understand the conduction mechanism model. However, four models have been proposed, which are the quantum mechanical tunneling (QMT), the small polaron tunneling (NSPT), the overlapping large polaron tunneling (OLPT) models, and the correlated barrier hopping (CBH).42,43 The plot in Fig. 10 reveals a decrease in the exponent ‘s’ with rising temperature, suggesting the applicability of the Correlated Barrier Hopping (CBH) model. In this model, the movement of individual carriers influences neighboring carriers due to barriers between sites, highlighting the correlated nature of carrier hopping within the material.
 |
| | Fig. 8 Variation of σac with frequency at different temperatures. | |
 |
| | Fig. 9 Variation of the ln(σdc × T) as a function of the inverse of the temperature of the AgCrO2 compound. | |
 |
| | Fig. 10 Variation of exponent ‘s’ and (1 − s) with temperature. | |
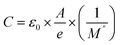
According to the CBH model, the exponent (s) can be identified by the following relation:45
| |
 | (8) |
with
WM represents the binding energy of the carrier in its focused sites, and
τ0 is a characteristic relaxation time, assumed to be 10
−13 s. For the large values of
WM/
kBT, the exponent ‘
s’ is defined as approximated by the subsequent expression:
| |
 | (9) |
The AC conductivity is expressed as:46
| |
 | (10) |
with
n is defined as the number of ions participating in the hopping process, where
n = 1 corresponds to single-polaron hopping and
n = 2 corresponds to bi-polaron hopping. NN
p is proportional to the square of the density of states, with
N representing the states occupied by charge carriers,
Np referring to the states to which the carriers transition, and
Rω represents the tunneling distance. For a given frequency,
Rω can be determined by solving the equation below:
45| |
 | (11) |
From the fit of the plot (1 − s) illustrated in Fig. 10 the value of WM is estimated to be 1/2 Ea at region I (313–493 K) and 1/4 Ea for region II (523–613 K). The result indicates that both bi-polaron and single polaron provides this CBH model for the region I and region II, respectively. Fig. 11 illustrates the plot of ln(σac) as a function of 1000/T for the AgCrO2 compound. A strong correlation is found between the experimental data and the theoretical values derived from the fitting procedure across different frequencies (10 Hz, 100 Hz, 250 Hz, and 1000 Hz). The parameters utilized in the fitting process are summarized in Table 2. Furthermore, the presence of a negative effective energy in the single polaron CBH model indicates a strong interaction between photons and electrons. The value increases with frequency, indicating that the barrier height for charge carriers hopping between localized states decreases. This reduction facilitates easier transitions for the charge carriers among these states.
 |
| | Fig. 11 Temperature dependences of σac at different frequencies of AgCrO2. | |
Table 2 Parameters used for adjustment of the CBH model
| F (Hz) |
T < 493 |
T > 493 |
| NT(EF) (eV−1 cm−3) |
Ueff (eV) |
WM (eV) |
NT (eV−1 cm−3) |
Ueff (eV) |
WM (eV) |
| 1000 |
4 × 10²² |
−0.0039 |
0.2 |
3.89 × 10²² |
−0.00543 |
0.3 |
| 250 |
1.72 × 10²² |
−0.0045 |
|
2.42 × 10²² |
−0.00574 |
|
| 100 |
9.38 × 10²¹ |
−0.0049 |
|
9.07 × 10²¹ |
−0.00581 |
|
| 10 |
7.89 × 10²¹ |
−0.006 |
|
8.96 × 10²¹ |
−0.00617 |
|
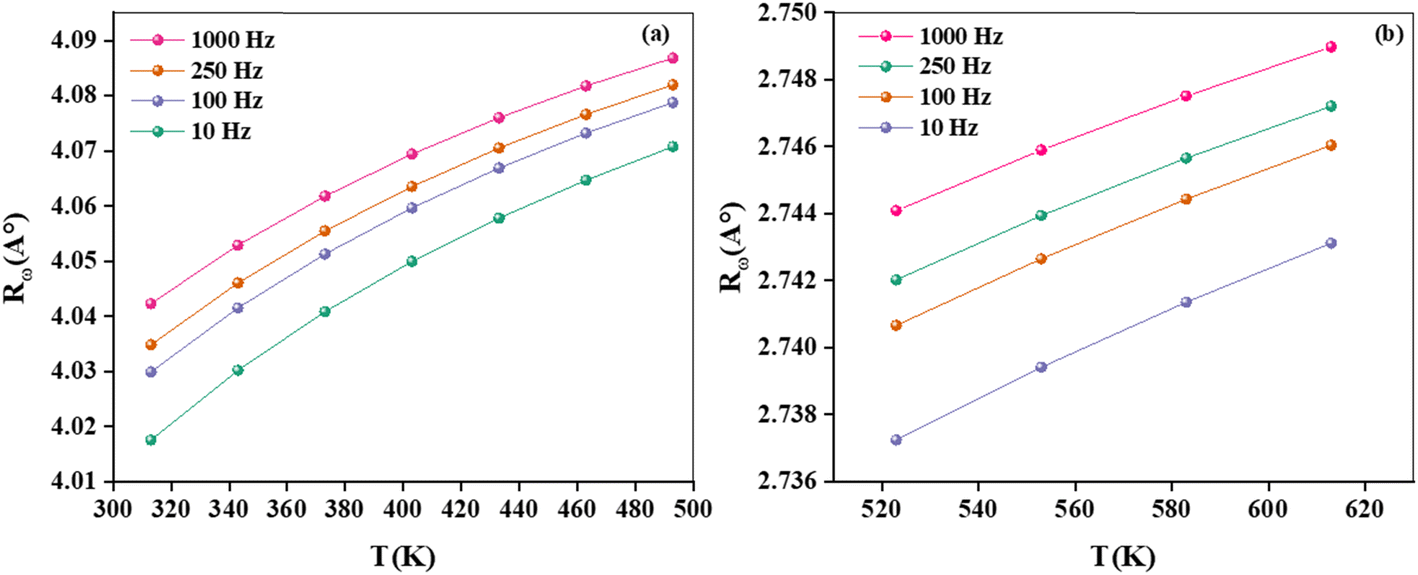
Fig. 12(a and b) illustrates the variation of Rω as a function of frequency across different temperatures. Notably, within the CBH model, the hopping distance grows with increasing temperature. This behavior is attributed to the fact that, as the temperature rises, polarons acquire more thermal energy, which enhances interchain interactions and promotes electric charge hopping.45
 |
| | Fig. 12 Variation of AC conductivity parameter Rω according to the frequency, (a) bipolaron (b) single polaron. | |
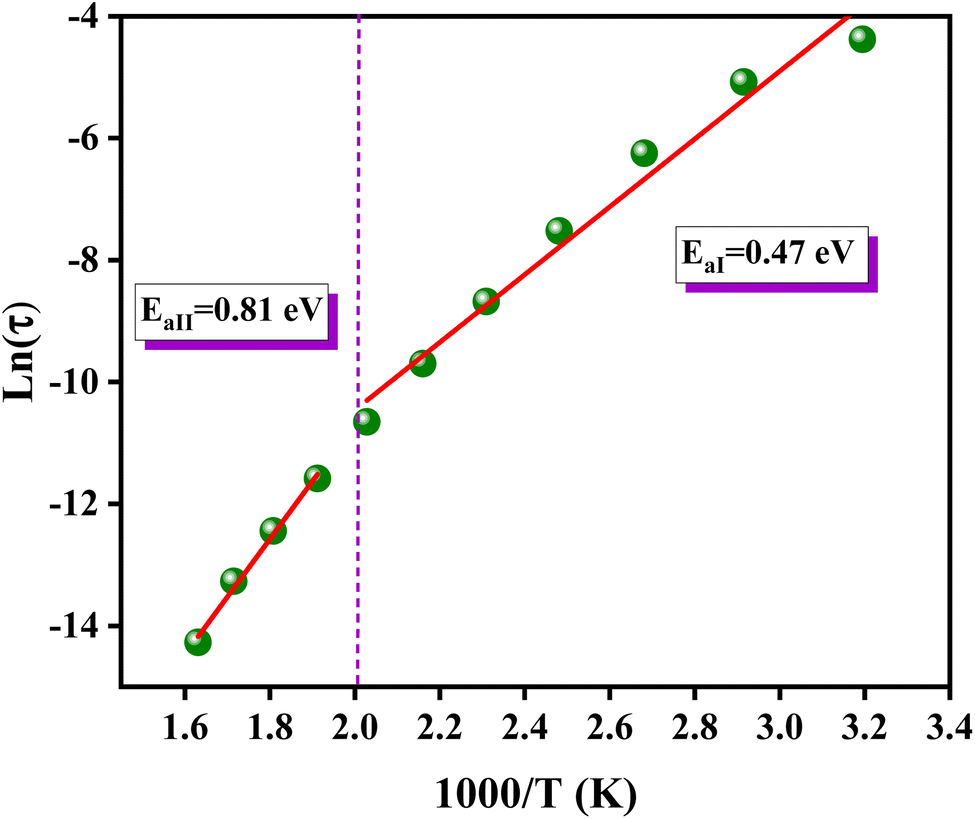
3.4.3 Modulus. The frequency-dependent variation of M′′ at different temperatures is displayed in Fig. 13. The plot shows that M′′ increases with frequency, reaching a maximum value (Mmax), which confirms the presence of relaxation. The temperature-dependent relaxation process is evidenced by the shift of the  peak toward higher frequencies. This shift may be associated with capacitance variations, as indicated by the temperature-dependent change in the magnitude of Mmax. The presence of a non-Debye-type.47 The asymmetric peak broadening suggests a non-Debye-type conduction mechanism in the AgCrO2 material,47 implying relaxation dispersion with different time constants. The simulation of the imaginary part M′′ was carried out by using the following Bergman equation:48
| |
 | (12) |
where  is the modulus, ωmax is the frequency maximum, and the value of β is positioned in the range 0 < β < 1, reflecting the importance of the coupling between mobile ions in the conduct. Fig. 14 shows the variation of ln(τ) versus temperature, which follows the Arrhenius relation. The values of activation energy estimated from the slopes of lines in the plot are 0.81 eV at the range 493–613 K and 0.47 eV from 313 to 463 K. The observed decrease in relaxation time with rising temperature confirms the existence of a thermally dependent hopping process within the material. This suggests short-path conductions. On the other hand, the close Ea value implies the participation of identical charges in the conductions.49,50
 |
| | Fig. 13 The variation of the imaginary part of the electrical modulus M′′ as a function of the frequencies of AgCrO2 at different temperatures. | |
 |
| | Fig. 14 Variation of ln(τ) as a function of 1000/T for the compound AgCrO2. | |
The analysis of imaginary electric modulus (M′′) and imaginary impedance (−Z′′) plots allows for the determination of charge carrier dynamics and the nature of relaxation processes in a material. These plots can reveal whether the relaxation is non-Debye (localized) or Debye-like (delocalized). A mismatch between the peak frequencies of Z′′ and M′′ typically indicates short-range charge carrier movement, while their coincidence suggests the long-range motion of charge carriers.51 Fig. 15, depicted an important mismatch between  and
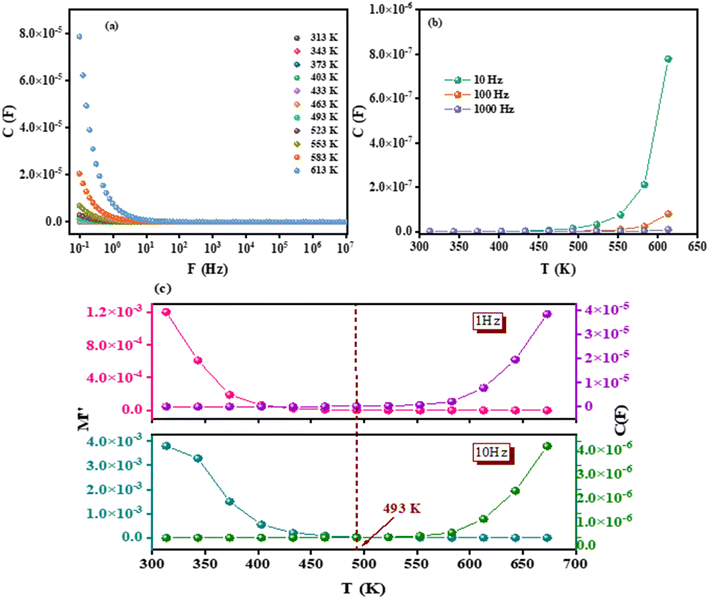
and  peaks observed at temperature 463 K. This discrepancy suggests a short-range motion of polarons within AgCrO2, deviating from the ideal Debye response. The behavior of capacitance as the range of frequency from 1 Hz to 1 MHz at temperatures ranging from 313 to 613 K and its evolution with temperature at selective frequencies (10 Hz,100 Hz, 1000 Hz) was plotted in Fig. 16((a) and (b)) respectively. Thus, at low frequencies, the capacitance attaints its maximum (5 μF) and then decreases with increasing frequency.52 These suggest the formation of a non-uniform barrier at the interface, likely resulting from the presence of interfacial electronic states resulting from the creation of an interfacial space charge at the interface.53 While the AgCrO2 material is heated, the capacitance decreases until the frequency 10 Hz, and the plot is merged and saturated, which may be related to the dielectric behavior. On the other hand, a high capacitance could generally enhance the performance of Field-Effect Transistors devices and for storage energy applications.54 As the modulus of a material directly influences its load-bearing or energy-storage capabilities, as expressed through the following proportionality:55
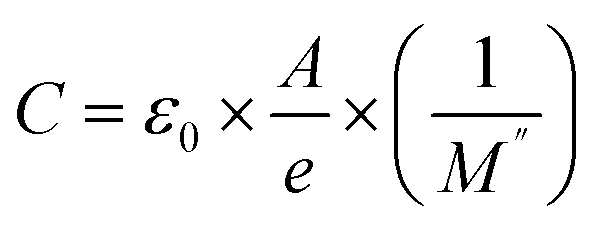
| |
 | (13) |
where
ε0 is the permittivity of free space,
A is the area of the electrodes, and
e is the thickness of the dielectric material.
 |
| | Fig. 15 Normalized imaginary part of impedance Z′′ and of electric modulus M′′ spectrum at 463 K of AgCrO2 compound. | |
 |
| | Fig. 16 Variation capacitance with frequencies (a), evolution of capacitance versus temperature for selective frequencies (b). Variation both of imaginary part of the electrical modulus M′′ and capacitance versus temperature for selective frequencies (c). | |
Therefore, Fig. 16(c) depicts the variation of both the imaginary part and the capacitance with temperature in the range of 313 to 673 K at selected frequencies (1 Hz and 10 Hz). It is clear from the plot that the imaginary part M′′ and capacitance C are inversely proportional. In fact, at low temperatures, M′′ decreases with the heating of our studied compound AgCrO2 until it reaches a constant value at 463 K. Consequently, the capacitance remains stable until 463 K and depends on temperature after that. This fact can be attributed to a noticeable change in the conduction mechanism.
4 Conclusion
In summary, the present investigation emphasized the AgCrO2 compound successfully fabricated via a solid–solid technique. The X-ray diffraction (XRD) measurements revealed that the structural study for the prepared compound confirms the phase purity crystallized in an orthorhombic system with a space group of Rm. Morphological analysis of the AgCrO2 compound demonstrated a homogeneous grain distribution and minimal surface porosity, with an average grain size of 1.7 μm. Energy-dispersive X-ray spectroscopy (EDX) confirmed the presence of Ag, Cr, and O elements and ensured phase homogeneity. The optical properties of the material were investigated using UV-Vis spectroscopy, which indicated that it exhibits a direct band gap energy of 2.8 eV and an Urbach energy of 0.9 eV, indicative of the material's optoelectronic potential. The electrical analysis of the AgCrO2 compound has been explained by Nyquist plot analysis, indicating a non-Debye relaxation behavior, with the equivalent circuit modeled as (Rg//C//CPE + Rbg//CPE). Detailed investigations of the ac conductivity, based on the correlated barrier hopping (CBH) model, provided insights into the material's electrical performance. The activation energy was determined from both dc conductivity and modulus plots. AgCrO2 exhibits significant capacitance and strong electrical conductivity, making it a promising candidate for energy storage applications. These findings offer hope for the development of new chromium-based materials that could serve as eco-friendly alternatives for optical and electronic capacitors, contributing to cleaner and more sustainable technologies. Furthermore, doping the AgCrO2 compound with other elements, such as Al3+, and studying its optical and electrical properties, along with its magnetic and dielectric behavior as a function of temperature, are promising avenues for future research to build on this work.
Data availability
The datasets used and/or analyzed during the current study are available from the corresponding author upon reasonable request.
Author contributions
Minyar Mnakri: Writing – original draft, validation, software, methodology, investigation. Sourour Ben Yahya: Writing – original draft, visualization, formal analysis. Mohamed Tliha. Writing – original draft, validation, methodology. Regis Barillé Writing – review & editing, visualization, validation, investigation, formal analysis, data curation. Abderrazek Oueslati: Writing – review & editing, visualization, validation, investigation, formal analysis.
Conflicts of interest
The authors declare no competing interests.
Acknowledgements
The authors extend their appreciation to Umm Al-Qura University, Saudi Arabia for funding this research work through grant number: 25UQU4331138GSSR03. This research work was funded by Umm Al-Qura University, Saudi Arabia under grant number: 25UQU4331138GSSR03.
References
- H. N. Abdelhamid, Mater. Sci. Forum, 2015, 832, 28–53, DOI:10.4028/www.scientific.net/msf.832.28.
- M. Moreira, J. Afonso, J. Crepelliere, D. Lenoble and P. Lunca-Popa, J. Mater. Sci., 2022, 57(5), 3114–3142, DOI:10.1007/s10853-021-06815-z.
- T. Zhao, Q.-L. Liu and Z.-Y. Zhao, J. Phys. Chem. C, 2019, 123(23), 14292–14302, DOI:10.1021/acs.jpcc.9b04481.
- S. P. Simner, M. D. Anderson, J. E. Coleman and J. W. Stevenson, J. Power Sources, 2006, 161(1), 115–122 CrossRef CAS.
- K. S. Weil, J. Y. Kim and J. S. Hardy, Electrochem. Solid-State Lett., 2005, 8(2), A133–A136 CrossRef CAS.
- C. C. Beatty, Proceedings-Electrochemical Society, v PV 2005–07, 2005, pp. 1949–1956 Search PubMed.
- M. C. Tucker, C. P. Jacobson, L. C. De Jonghe and S. J. Visco, J. Power Sources, 2006, 160(2), 1049–1057 CrossRef CAS.
- S. Huang, Z. Zong and C. Peng, J. Power Sources, 2007, 173(1), 415–419 CrossRef CAS.
- J. Duquette and A. Petric, J. Power Sources, 2004, 137(1), 71–75 CrossRef CAS.
- M. Camaratta and E. Wachsman, Solid State Ionics, 2007, 178(19–20), 1242–1247 CrossRef CAS.
- M. Camaratta and E. Wachsman, Solid State Ionics, 2007, 178(23–24), 1411–1418 CrossRef CAS.
- J. Y. Kim, J. Hardy and K. S. Weil, Int. J. Hydrogen Energy, 2007, 32(16), 3655–3663 CrossRef CAS.
- W. A. Meulenberg, O. Teller, U. Flesch, H. P. Buchkremer and D. Stover, J. Mater. Sci., 2001, 36(13), 3189–3195 CrossRef CAS.
- J. Liu, Y. Lu, S. A. Barnett, A. Ji and W. Su, Proceedings-Electrochemical Society, v PV2005-07, Solid Oxide Fuel Cells IX, SOFC IX, 2005, pp. 1976–1980 Search PubMed.
- M. Wu, J.-M. Yan, X.-W. Zhang, M. Zhao and Q. Jiang, J. Mater. Chem. A, 2015, 358, 15710 RSC.
- K. Murugan, A. T. Sathyanarayana, P. Govindaraj, S. Paulraj, A. Mani and K. Venugopal, J. Electron. Mater., 2022, 52(3), 1652–1661, DOI:10.1007/s11664-022-10014-0.
- A. Lopes, G. Oliveira, T. Mendonça, J. A. Moreira, A. Almeida, J. Araújo, V. Amaral and J. Correia, Phys. Rev. B, 2011, 84, 014434 CrossRef.
- S. Kumar, M. Miclau and C. Martin, Chem. Mater., 2013, 25(10), 2083–2088, DOI:10.1021/cm400420e.
- K. Momma and F. Izumi, J. Appl. Crystallogr., 2008, 41(3), 653–658, DOI:10.1107/s0021889808012016.
- A. A. H. El-Bassuony, J. Mater. Sci.: Mater. Electron., 2017, 28(19), 14489–14498, DOI:10.1007/s10854-017-7312-9.
- A. A. H. El-Bassuony and H. K. Abdelsalam, J. Mater. Sci.: Mater. Electron., 2018, 29(7), 5401–5412, DOI:10.1007/s10854-017-8506-x.
- W. S. Rasband, ImageJ, U. S. National Institutes of Health, Bethesda, Maryland, USA, https://www.imagej.net/ij/ Search PubMed.
- I. Soudani, K. Ben Brahim, A. Oueslati, H. Slimi, A. Aydi and K. Khirouni, RSC Adv., 2022, 12(29), 18697–18708, 10.1039/d2ra02757g.
- A. Ghoudi, K. ben brahim, H. Ghalla, J. Lhoste, S. Auguste, K. Khirouni, A. Aydi and A. Oueslati, RSC Adv., 2023, 13(19) 10.1039/d3ra01239e.
- F. Hcini, J. Khelifi, S. Hcini and K. Khirouni, J. Mater. Sci.: Mater. Electron., 2024, 35(10) DOI:10.1007/s10854-024-12452-4.
- J. Wang, C. Zhang, H. Liu, R. McLaughlin, Y. Zhai, S. R. Vardeny, X. Liu, S. McGill, D. Semenov, H. Guo, R. Tsuchikawa, V. V. Deshpande, D. Sun and Z. V. Vardeny, Nat. Commun., 2019, 10, 129 CrossRef.
- R. Mguedla, A. Ben Jazia Kharrat, O. Taktak, H. Souissi, S. Kammoun, K. Khirouni and W. Boujelben, Experimental and theoretical investigations on optical properties of multiferroic PrCrO3 ortho-chromite compound, Opt. Mater., 2020, 101, 109742, DOI:10.1016/j.optmat.2020.109742.
- W. Boujelbene, A. B. J. Kharrat, S. Kammoun, N. Chniba-Boudjada, K. Khirouni and W. Boujelben, Investigation of structural and optical properties of SmCrO3 orthochromite compound prepared via sol–gel process, Ionics, 2025, 31(3), 3037–3052, DOI:10.1007/s11581-025-06078-7.
- W. E. Vargas and G. A. Niklasson, Appl. Opt., 1997, 36, 5580–5586 CrossRef CAS ) https://www.opg.optica.org/ao/abstract.cfm?URI=ao-36-22-5580.
- R. P. Sreekanth Chakradhar, J. Lakshmana Rao, G. Sivaramaiah and N. O. Gopal, Phys. Status Solidi B, 2005, 242(14), 2919–2929, DOI:10.1002/pssb.200540100.
- T. Prakash, K. Padma Prasad, S. Ramasamy and B. S. Murty, J. Nanosci. Nanotechnol., 2008, 8(8), 4273–4278, DOI:10.1166/jnn.2008.an23.
- C. Ruttanapun, J. Appl. Phys., 2013, 114(11), 113108, DOI:10.1063/1.4821960.
- M. Kumar, H. Zhao and C. Persson, Semicond. Sci. Technol., 2013, 28(6), 065003, DOI:10.1088/0268-1242/28/6/065003.
- M. Mnakri, I. Gharbi, M. Enneffati and A. Oueslati, Mater. Today Commun., 2024, 38, 107714, DOI:10.1016/j.mtcomm.2023.107714.
- D. Xiong, H. Wang, W. Zhang, X. Zeng, H. Chang, X. Zhao, W. Chen and Y. Cheng, J. Alloys Compd., 2015, 642, 104–110, DOI:10.1016/j.jallcom.2015.04.072.
- D. Klimm, IUCrJ, 2014, 1(5), 281–290, DOI:10.1107/s2052252514017229.
- T. Badapanda, S. Sarangi, B. Behera, S. Anwar, T. Sinha, R. Ranjan, G. Luz, E. Longo and L. Cavalcante, J. Mater. Sci.: Mater. Electron., 2014, 25, 3427–3439 CrossRef CAS.
- K. S. Cole and R. H. Cole, Chem Phys B, 1941, 41, 9 Search PubMed.
- D. B. Chandra, M. Matin and H. A. Akther, J. Mater. Sci. Mater. Electron., 2021, 32, 4916–4936 CrossRef CAS; K. N. D. K. Muhsen, R. A. M. Osman and M. S. Idris, J. Mater. Sci.: Mater. Electron., 2019, 30, 20673–20686 CrossRef.
- D. Johnson, Z-View, Impedance Software, Version 2.1a, Scribner Associates Inc Search PubMed.
- J. R. Macdonald, J. Phys. Chem. Solids, 2009, 70(3–4), 546–554, DOI:10.1016/j.jpcs.2008.12.012.
- A. Dhahri, A. Zaouali, A. Benali, N. Abdelmoulla, J. Massoudi, K. Nouri, L. Bessais, M. P. F. Graça, M. A. Valente and B. F. O. Costa, J. Mater. Sci.: Mater. Electron., 2021, 32(6), 7926–7942, DOI:10.1007/s10854-021-05516-2.
- A. Djemal, B. Louati and K. Guidara, J. Alloy. Compd., 2016, 683, 610–618, DOI:10.1016/j.jallcom.2016.05.107.
- M. Boukthir, N. Chakchouk, S. Dammak, S. M. Altarifi, K. Karoui, A. Mahmoud, F. Boschini and A. B. Rhaiem, Optical and electrical conduction mechanisms of the ceramic LiMnO2 as cathode active materials for lithium-ion batteries, Ionics, 2024, 31(2), 1299–1313, DOI:10.1007/s11581-024-06009-y.
- I. Gharbi, A. Oueslati, K. Guidara and B. Louati, Ionics, 2019, 25(8), 3991–4001, DOI:10.1007/s11581-019-02954-1.
- A. Zaafouri, M. B. Gzaiel, I. Gharbi, B. Bakri and A. Oueslati, J. Mater. Sci.: Mater. Electron., 2024, 35(12) DOI:10.1007/s10854-024-12475-x.
- A. Zolanvari, N. Goyal and S. K. Tripathi, Pramana, 2004, 63(3), 617–625, DOI:10.1007/bf02704488.
- P. Behera and S. Ravi, Solid State Sci., 2019, 89, 139–149 CrossRef CAS.
- S. R. Elliott, Adv. Phys., 1987, 36(2), 135–217, DOI:10.1080/00018738700101971.
- L. Miladi, A. Oueslati and K. Guidara, RSC Adv., 2016, 6, 83280–83287 RSC.
- L. Sahoo, S. Sahoo, S. Mishra, N. C. Nayak, B. N. Parida and R. K. Parida, J. Mater. Sci.: Mater. Electron., 2024, 35(34) DOI:10.1007/s10854-024-13867-9.
- N. Turan, P. Oruç, Y. Demirölmez, A. Seçkin, A. O. Çağırtekin, S. Cavdar, H. Koralay and N. Tuğluoğlu, Investigation of temperature dependent electrical and impedance characteristics of bulk Zn0.95Co0.05O, J. Sol-Gel Sci. Technol., 2021, 100(1), 147–159, DOI:10.1007/s10971-021-05623-w.
- B. Yadav, R. Kumar, K. K. Kar and M. K. Ghorai, Study of Small Polaronic, Variable Hopping Conduction and Its Exploration By Impedance Analysis in I- Substituted CaCu3Ti4O12 at O- Ion Site By Fine-Tuning The Electrical Properties, Grains and Grain Boundaries, 2021, DOI:10.21203/rs.3.rs-197861/v1.
- C. R. Crowell and G. I. Roberts, J. Appl. Phys., 1969, 40(9), 3726–3730, DOI:10.1063/1.1658262.
- D. K. Pradhan, R. N. P. Choudhary and B. K. Samantaray, eXPRESS Polym. Lett., 2008, 2(9), 630–638, DOI:10.3144/expresspolymlett.2008.76.
|
| This journal is © The Royal Society of Chemistry 2025 |
Click here to see how this site uses Cookies. View our privacy policy here. 
 Open Access Article
 This Open Access Article is licensed under a Creative Commons Attribution-Non Commercial 3.0 Unported Licence
 *a,
Sourour Ben yahya
*a,
Sourour Ben yahya


 peak toward higher frequencies. This shift may be associated with capacitance variations, as indicated by the temperature-dependent change in the magnitude of Mmax. The presence of a non-Debye-type.47 The asymmetric peak broadening suggests a non-Debye-type conduction mechanism in the AgCrO2 material,47 implying relaxation dispersion with different time constants. The simulation of the imaginary part M′′ was carried out by using the following Bergman equation:48
 is the modulus, ωmax is the frequency maximum, and the value of β is positioned in the range 0 < β < 1, reflecting the importance of the coupling between mobile ions in the conduct. Fig. 14 shows the variation of ln(τ) versus temperature, which follows the Arrhenius relation. The values of activation energy estimated from the slopes of lines in the plot are 0.81 eV at the range 493–613 K and 0.47 eV from 313 to 463 K. The observed decrease in relaxation time with rising temperature confirms the existence of a thermally dependent hopping process within the material. This suggests short-path conductions. On the other hand, the close Ea value implies the participation of identical charges in the conductions.49,50

 and
and  peaks observed at temperature 463 K. This discrepancy suggests a short-range motion of polarons within AgCrO2, deviating from the ideal Debye response. The behavior of capacitance as the range of frequency from 1 Hz to 1 MHz at temperatures ranging from 313 to 613 K and its evolution with temperature at selective frequencies (10 Hz,100 Hz, 1000 Hz) was plotted in Fig. 16((a) and (b)) respectively. Thus, at low frequencies, the capacitance attaints its maximum (5 μF) and then decreases with increasing frequency.52 These suggest the formation of a non-uniform barrier at the interface, likely resulting from the presence of interfacial electronic states resulting from the creation of an interfacial space charge at the interface.53 While the AgCrO2 material is heated, the capacitance decreases until the frequency 10 Hz, and the plot is merged and saturated, which may be related to the dielectric behavior. On the other hand, a high capacitance could generally enhance the performance of Field-Effect Transistors devices and for storage energy applications.54 As the modulus of a material directly influences its load-bearing or energy-storage capabilities, as expressed through the following proportionality:55