
 Open Access Article
 This Open Access Article is licensed under a Creative Commons Attribution-Non Commercial 3.0 Unported Licence
Controlling mechanisms of CO2 sequestration efficiency in tight carbonate gas reservoirs: experimental insights into pore-throat constraints and mineralogical responses
Jinsheng Zhao ab,
Ziyi Zhanga,
Yuanxiang Xiaoc,
Shan Houd,
Pan Lie and
Sipeng Zhangf
ab,
Ziyi Zhanga,
Yuanxiang Xiaoc,
Shan Houd,
Pan Lie and
Sipeng Zhangf
aSchool of Petroleum Engineering, Xi'an Shiyou University, 18 Dianzi Road, Yanta, Xi'an, Shaanxi 710065, China. E-mail: jingsheng79317@163.com; Tel: +86 15809227022
bResearch Institute of Carbon Neutrality Future Technology, Xi'an Shiyou University, Xi'an, Shaanxi 710065, China
cOil and Gas Technology Research Institute of Changqing Oilfield Branch, Xi'an, Shaanxi 710018, China
dNo. 4 Gas Production Plant, PetroChina Changqing Oilfield Company, Wushenqi, Inner Mongolia 017300, China
eNo. 3 Gas Production Plant, PetroChina Changqing Oilfield Company, Wushenqi, Inner Mongolia 017300, China
fCNPC XIBU Drilling Engineering Company Limited, Urumqi, Xinjiang 830000, China
First published on 2nd July 2025
Abstract
The injection of CO2 into low-pressure tight gas reservoirs can achieve the purposes of enhancing reservoir energy, increasing gas reservoir recovery and reducing carbon emissions. For the CO2 energized fracturing process, it can also improve the fracturing fluid flowback efficiency and reduce water blocking effects. In the context of “dual carbon” strategy, studying the CO2 storage behavior during CO2 injection in tight carbonate gas reservoirs is of great significance. In this paper, the CO2 storage effect and influencing factors of CO2 injection in tight carbonate core samples are experimentally investigated. The main factors affecting the bound CO2 storage are analyzed by means of nuclear magnetic resonance (NMR), threshold pressure gradient testing, and X-ray diffraction. Additionally, the influence of dissolved-solidified CO2 storage on mineral composition and pore size distribution is also investigated. The results show that the CO2 injection pressure has a significant impact on the bound CO2 storage. When the pressure is higher than the supercritical pressure, the bound CO2 storage rate can reach over 60%. And the dissolved-solidified CO2 storage rate is at its peak of 10–15% when the pressure is between 5 MPa and 7 MPa. With the decreasing core permeability and the increasing threshold pressure gradient, the bound CO2 storage rate increases. For tight carbonate gas reservoirs, the dissolution and solidification storage of CO2 mainly occurs in small pores, medium pores and large pores. The dissolved-solidified CO2 storage rate is affected by the mineral composition. Dolomite and calcite are the main dissolution minerals of CO2 in water, thereby changing the pore throat distribution of the reservoir. This study can provide theoretical guidance for optimizing CO2 injection technology, predicting storage effects, and optimizing gas well production in tight carbonate gas reservoirs.
1. Introduction
Carbon Capture, Utilization, and Storage (CCUS) technology is an important way to achieve global carbon emission reduction, and also an important means to ensure China's energy security and promote coordinated economic development.1–3 The tight gas reservoir is one of the three major unconventional gases (tight gas, shale gas, and coalbed methane),4 and its low permeability and natural productivity require fracturing transformation before it can be effectively developed. The injection of CO2 into low-pressure tight gas reservoirs can achieve the purposes of enhancing reservoir energy, increasing gas reservoir recovery rate and reducing carbon emissions. For the CO2 energized fracturing process, it can also improve the fracturing fluid flowback efficiency and reduce water lock effects, thereby increasing the production of gas wells after fracturing.5,6At present, there are four widely recognized CO2 storage mechanisms, including structural storage, bound CO2 storage (residual gas storage), dissolution storage and mineral storage, for CO2 injection to enhance oil recovery methods such as CO2 flooding, CO2 huff-n-puff, and CO2 geological storage for abandoned oil and gas reservoirs and saline aquifers.7–10 Bound CO2 storage refers to the process in which CO2 saturation decreases as it migrates through the reservoir. Due to variations in pore throat structures and capillary pressures within the reservoir rocks, a portion of the CO2 is trapped in the pore spaces and effectively trapped.11–14
Many scholars have carried out studies on the mechanism of CO2 storage during CO2 flooding, CO2 huff-n-puff, and CO2 geological storage. Malik et al. studied the optimal parameters of CO2 flooding and storage by comparing different CO2 concentrations, injection methods, and reservoir conditions.15 Kalra et al. evaluated the effectiveness of CO2 to enhance shale oil recovery and the mechanism of CO2 storage capacity in shale reservoirs.16 Chen Xiulin et al. studied the CO2 storage morphology and distribution characteristics of different core saturated oil after gas flooding using nuclear magnetic resonance and numerical simulation.17 The results showed that CO2 in large pores mainly exists in the form of continuous free gas, while CO2 in small pores is first retained in dissolved form. There was no CO2 completely stored in free gas or dissolved gas in both large and small pores. Based on the experimental apparatus for high-pressure hydrothermal reactions and a series of characterization tests, Dai Xuguang et al. analyzed the laws of mineral dissolution, ion release and precipitation in shale under CO2 sequestration conditions.18 The results showed that during the short-term reaction process, shale mainly exhibits dissolution characteristics. In the long-term reaction process, shale still mainly shows dissolution effects, and in some local areas, carbonate precipitation phenomena occur. Takashi et al. presented numerical modelling of long-term CO2 storage in saline aquifers.19 The results show that structural storage is the main storage mechanism in the process of CO2 injection, and the amount of residual gas trapping started to increase in 20 years after the end of CO2 injection. At 100 years and onward, solubility trapping took effect with the decrease of residually trapped CO2.
In general, most studies on CO2 storage in oil and gas reservoirs have primarily relied on numerical simulation methods, with relatively few in-depth investigations into the mechanisms of CO2 storage, such as bound storage and dissolution-solidification storage, during CO2 injection in gas reservoirs. In this paper, the influencing factors of bound storage and dissolved-solidified storage during CO2 injection are investigated through laboratory experiments. And the variations in CO2 storage rate in tight carbonate gas reservoirs under different experimental conditions are obtained, revealing the storage behaviors during the CO2 injection process.
2. Experimental part
2.1 Experimental equipment and experimental materials
The multi-functional integrated displacement system (Jiangsu Shili Petroleum Instrument Co., Ltd) mainly composed of a constant-flux pump, thermal incubator, pressure vessel, core holder, hand pump and back pressure valve was used in bound carbon storage experiment and dissolved-solidified carbon storage experiment. The system is heated to a predetermined temperature by the thermal incubator, then the constant-flux pump is used to increase the pressure in the pressure vessel, thereby pressurizing the CO2 in the pressure vessel and injecting it into the core holder. The back pressure valve is used to set the back pressure. The schematic diagram of the CO2 storage experiment setup is shown in Fig. 1. | ||
| Fig. 1 Schematic diagram of the CO2 storage experiment setup. | ||
The seven cores were come from Majiagou Formation of Sulige Gas field. The core physical property parameters are shown in Table 1.
| Core no. | Length (cm) | Diameter (cm) | Porosity (%) | Permeability (10−3 μm2) | Threshold pressure gradient (MPa m−1) |
|---|---|---|---|---|---|
| 1# | 3.847 | 2.473 | 0.92 | 0.2556 | 0.61 |
| 2# | 6.448 | 2.532 | 4.91 | 0.0501 | 5.60 |
| 3# | 3.321 | 2.426 | 2.92 | 1.0835 | 0.91 |
| 4# | 3.472 | 2.519 | 0.88 | 0.0733 | 3.10 |
| 5# | 5.657 | 2.519 | 1.22 | 2.6570 | 1.76 |
| 6# | 5.454 | 2.515 | 2.56 | 0.2972 | 3.09 |
| 7# | 3.658 | 2.535 | 4.81 | 0.4797 | 0.69 |
2.2 Experimental method
In order to study the bound CO2 storage mechanism of CO2 injection process of tight carbonate gas reservoir, dry core without water was used from Majiagou gas reservoir of Sulige gas field. Since bound CO2 storage primarily relies on capillary forces to store CO2 in porous media, the pore-throat size and distribution within the core significantly influence the efficiency of bound CO2 storage. Based on the test of bound CO2 storage rate, the effects of minimum starting pressure gradient and microscopic pore-throat size distribution on bound CO2 storage in tight carbonate gas reservoirs were analyzed. After the experiment of bound CO2 storage, the same cores are saturated with formation water and used in the dissolved-solidified CO2 storage experiment. The bound CO2 storage experimental steps are as follows:(1) Cores are dried in constant temperature box at 80 °C for 48 h, and then the porosity and gas permeability are measured.
(2) The starting pressure gradient of cores is tested by unsteady state differential pressure-flow method.
(3) Injecting CO2 into the pressure vessel until the pressure reaches 20 MPa and the temperature of is constant temperature box set to a gas reservoir temperature of 65 °C.
(4) Connecting the experiment system, and the core is placed into the core holder with a confining pressure of 25 MPa and back pressure of 20 MPa.
(5) The CO2 is continuously injected into core until the CO2 flow rate at the core outlet is stable, and then the outlet and inlet valves of core holder are closed. The amount of CO2 in the core is calculated.
(6) Connecting the back pressure valve at the injection port of the core holder, and reducing the back pressure to 12 MPa, 10 MPa, 8 MPa, 6 MPa, 4 MPa and atmospheric pressure respectively. And then the inlet valve is opened to collect the amount of CO2 produced and calculate the CO2 storage rate under different pressures. The calculation method for CO2 storage is based on the mass balance method. After recording the injected and produced CO2 volumes, the density data of CO2 under different temperature and pressure conditions can be obtained from the website of the National Institute of Standards and Technology (NIST). This allows for the calculation of the injected and produced CO2 mass, which is then used to calculate the CO2 storage rate.
(7) Core is saturated with water, and then the T2 spectrum is measured with nuclear magnetic resonance (NMR) technology to obtain the core pore throat size distribution. The influence of core starting pressure gradient and micro-pore throat distribution on bound carbon storage in tight sandstone gas reservoirs are analyzed.
The dissolved-solidified CO2 storage experimental steps are as follows:
(1) After the bound CO2 storage experiment are completed, the same core samples are saturated with formation water, and then nitrogen drives water to establish irreducible water saturation.
(2) After connecting the experimental system, adjust the temperature and pressure conditions to match those of the bound CO2 storage experiment. Then, CO2 is continuously injected into the core until the CO2 flow rate at the core outlet stabilizes. Afterward, the outlet and inlet valves of the core holder are closed and soaking for 48 hours.
(3) After the soaking period, connect the core holder and back pressure valve, and reduce the back pressure to 12 MPa, 10 MPa, 8 MPa, 6 MPa, 4 MPa, and atmospheric pressure. The amount of CO2 gas produced is collected, and the CO2 storage rate at different pressures is calculated.
(4) After the dissolved-solidified CO2 storage experiment, NMR testing is continued to obtain the core pore throat size distribution.
3. Conclusion and discussion
3.1 The results analysis of bound CO2 storage experiment
According to the variation trend of the storage rate with the release pressure in Fig. 2, the bound CO2 storage rate of tight carbonate gas reservoirs decreases with the decreasing release pressure, showing a trend of first slow decline, then sharp decline and then stable. When the release pressure is lower than the supercritical pressure of 7.38 MPa, CO2 changes from supercritical state to gaseous state, and the bound CO2 storage rate decreases rapidly. The reason is when CO2 transitions from the supercritical state to the gaseous state, the CO2 volume expands rapidly, and due to the fixed pore volume in the core, the rapidly expanding CO2 is produced in large quantities. When CO2 is in supercritical state, the overall bound CO2 storage rate is above 70%, and when the release pressure drops below supercritical state, the bound CO2 storage rate will drop below 60%. It can be seen that the storage rate of CO2 is higher when it is maintained in supercritical state.
 | ||
| Fig. 2 Variations in the bound CO2 storage rate with pressure. | ||
For a gas reservoir with an original formation pressure of 20 MPa, the release pressure of 16 MPa, 12 MPa and 10 MPa can be regarded as the bottom-hole flow pressure of the gas well in the early and middle period of gas well production. At this time, the formation pressure is above the CO2 supercritical pressure, and the corresponding bound CO2 storage rate is higher. The bound CO2 storage rates of the seven cores are 96.97%, 86.55% and 78.05% on average. At the later stage of gas well production, the average bound CO2 storage rate of the seven cores is 27.00% as the bottom-hole flow pressure continues to decrease to 5 MPa.
 | ||
| Fig. 3 The fitted relationship between bound CO2 storage rate and permeability. | ||
 | ||
| Fig. 4 The fitted relationship between bound CO2 storage rate and threshold pressure gradient. | ||
As can be seen from Fig. 3, the relationship between the bound CO2 storage rate and permeability presents a negative correlation. Generally, the smaller the pore throat size of the core or the poorer the pore throat connectivity, the lower the corresponding core permeability. CO2 can be injected in gas reservoir under a higher pressure gradient, but under the action of capillary force, only part of CO2 will be extracted under the normal production pressure gradient. The smaller the pore throat size of the core or the more complex the pore throat distribution, the more CO2 trapped, which shows that the lower the permeability of the core, the higher the bound CO2 storage rate.
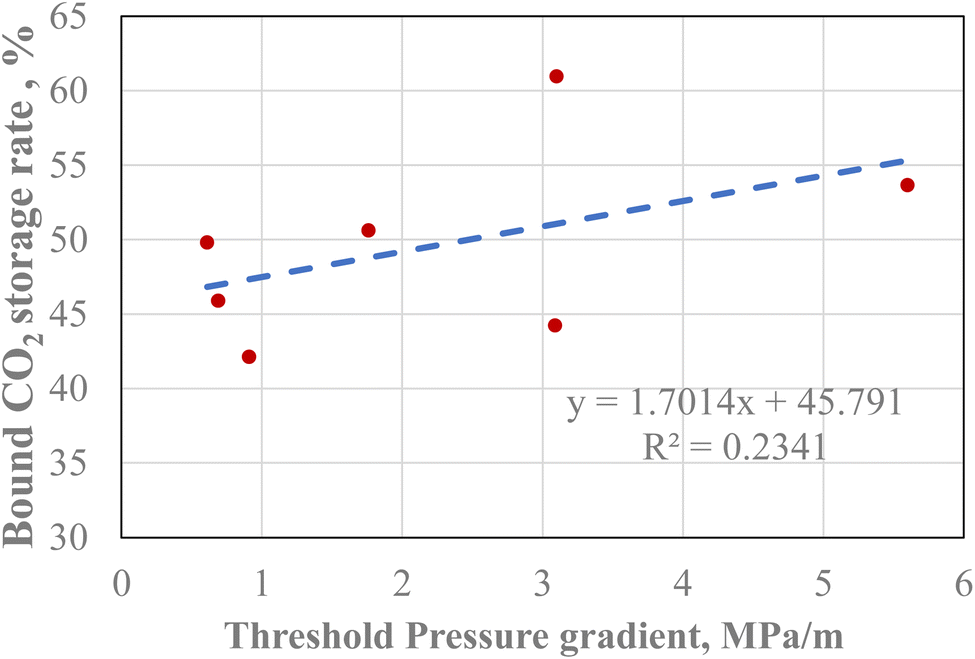
As shown in Fig. 4, the relationship between bound CO2 storage rate and threshold pressure gradient presents a positive correlation, and the correlation coefficient is significantly higher than the fitting curve between bound CO2 storage rate and permeability. The threshold pressure gradient is a parameter affected by many factors such as core permeability, tortuosity, porosity, form factor and fluid surface tension,21,22 which can better reflect the impact on bound CO2 storage rate. For tight carbonatite gas reservoirs, the larger the threshold pressure gradient, the more difficult it is to recover CO2 injected by CO2 energized fracturing, the higher the bound CO2 storage rate, and the longer the effect of energy enhancement. With the reduction of production pressure, more and more CO2 will be produced along with natural gas, and the reduction of pressure will release the expansion energy of CO2, which also plays an effect of energy enhancement.
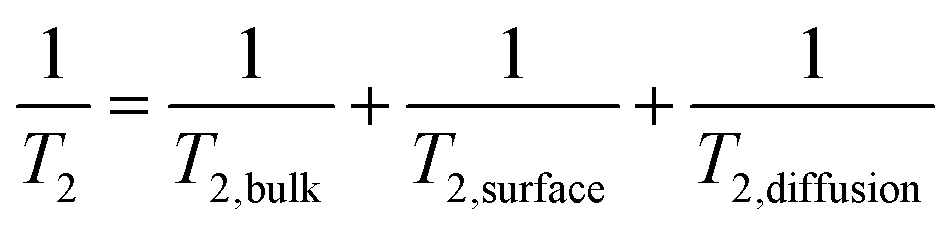 | (1) |
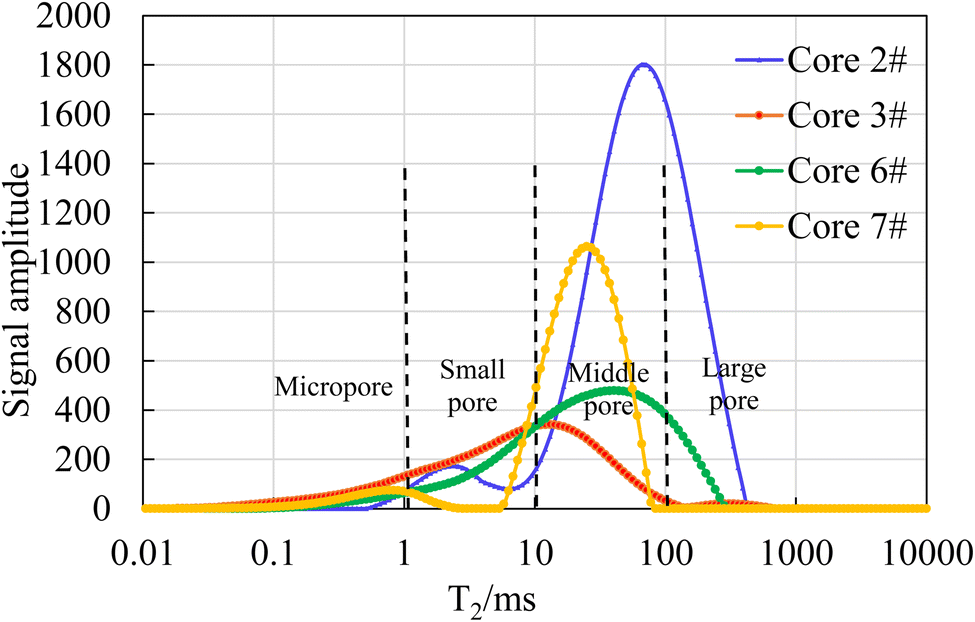
Thus, The T2 spectra also represent the pore throat size distribution of the core. According to the principle of NMR, the longer the transverse relaxation time, the larger the pore size. The horizontal axis of T2 spectrum curve can be divided into four intervals: the micropore interval (T2 < 1 ms), the small pore interval (1 ms < T2 < 10 ms), the middle pore interval (10 ms < T2 < 100 ms), and the large pore interval (T2 > 100 ms). Based on the results of NMR tests, the seven core samples were classified into two categories. Among them, the T2 spectral curve peaks of core samples 1#, 4# and 5# were located on the left side of T2 axis, and the pore throat distribution of these core samples was dominated by micropores with relatively small pore throat sizes. The results are shown in Fig. 5. The core samples 2#, 3#, 6#, and 7# had their T2 spectral curve peaks located on the right side of T2 axis, and the pore throat distribution of these core samples was dominated by middle pores and large pores with relatively larger pore throat sizes. The results are shown in Fig. 6.
 | ||
| Fig. 5 The T2 spectra curves of core 1#, 4# and 5# by nuclear magnetic resonance. | ||
 | ||
| Fig. 6 The T2 spectra curves of core 2#, 3#, 6# and 7# by nuclear magnetic resonance. | ||
As shown in Fig. 5, the T2 spectral distribution curves of core samples 1#, 4# and 5# all exhibit a three-peak distribution pattern. However, the peak on the leftmost side is significantly higher than the two peaks on the right side, and the peak on the leftmost side is located in the micropore region, indicating that the pore sizes of these three cores are mainly micropores. On the contrary, it can be seen from Fig. 6, the T2 spectral distribution curves of core samples 3# and 6# are in a single-peak distribution pattern, and the peak is located in the middle pore region. The T2 spectral distribution curves of core samples 2# and 7# are in a double-peak distribution pattern, and the right peak is significantly higher than the left peak, and the peak is located in the middle pore region. The four cores in Fig. 6 are mainly middle pores, and contain some large pores, with a relatively small amount of small pores and almost no micropores.
The differences in pore throat size distribution result in variations in the bound CO2 storage rate. As shown in Table 2, it can be observed that the CO2 storage rates of core samples 1#, 4# and 5# with smaller pore sizes at each release pressure are higher than those of core samples 2#, 3#, 6# and 7#. Taking the release pressure of 12 MPa as an example, the average bound CO2 storage rate of 1#, 4# and 5# cores is 87.93%, while that of 2#, 3#, 6# and 7# cores is 85.51%. The difference is 2.42%. Moreover, the smaller the release pressure, the greater the difference in the bound CO2 storage rate between the small-pore-size cores and the large-pore-size cores. When the release pressure is 10 MPa, the difference is 2.54%. When the release pressure is 7 MPa, the difference is 4.23%. When the release pressure is 5 MPa, the difference is 7.1%. It can be seen that the pore size distribution of the core will affect the bound CO2 storage effect. The better the pore throat development or the more uniform the pore throat size distribution, the better the pore throat connectivity, and the lower the bound CO2 storage rate. For CO2 enhanced fracturing in tight sandstone gas reservoirs, due to the small microscopic pore throat size and complex pore throat distribution of the reservoir, it often has a better bound CO2 storage effect. As long as the pressure gradient during production is kept within a small range, the enhanced effect can be achieved for a long time.
| Release pressure (MPa) | Bound CO2 storage rate of every core sample/% | ||||||||
|---|---|---|---|---|---|---|---|---|---|
| Cores with micropores | Cores with middle pores and large pores | ||||||||
| 1# | 4# | 5# | Average value | 2# | 3# | 6# | 7# | Average value | |
| 12 | 87.45 | 89.13 | 87.21 | 87.93 | 87.61 | 84.56 | 83.75 | 86.12 | 85.51 |
| 10 | 78.49 | 80.99 | 79.04 | 79.51 | 80.06 | 76.46 | 75.26 | 76.07 | 76.96 |
| 7 | 66.31 | 70.8 | 68.03 | 68.38 | 69.02 | 61.03 | 61.59 | 64.97 | 64.15 |
| 5 | 28.32 | 34.48 | 30.39 | 31.06 | 34.81 | 20.52 | 20.98 | 19.54 | 23.96 |
3.2 The results analysis of dissolved-solidified CO2 storage experiment
To clarify the influence of the existence of bound water in gas reservoirs on the CO2 storage effect, the experiment uses core samples with bound water. The core samples are 1#, 2#, 3#, 5#, 6# and 7# cores that have undergone bound CO2 storage experiments. Due to the presence of bound water in these core samples, after CO2 injection, in addition to the bound CO2 storage formed by the capillary action of pore throats, there will also be CO2 storage formed due to the dissolution and solidification reaction between CO2, water, and minerals. Therefore, the CO2 storage experiment results of cores with bound water should include both bound CO2 storage and dissolved–solidified CO2 storage. The experimental results are shown in Fig. 7 and 8.
 | ||
| Fig. 7 The change curve of overall CO2 storage rate with pressure. | ||
 | ||
| Fig. 8 The change curve of dissolved-solidified CO2 storage rate with pressure. | ||
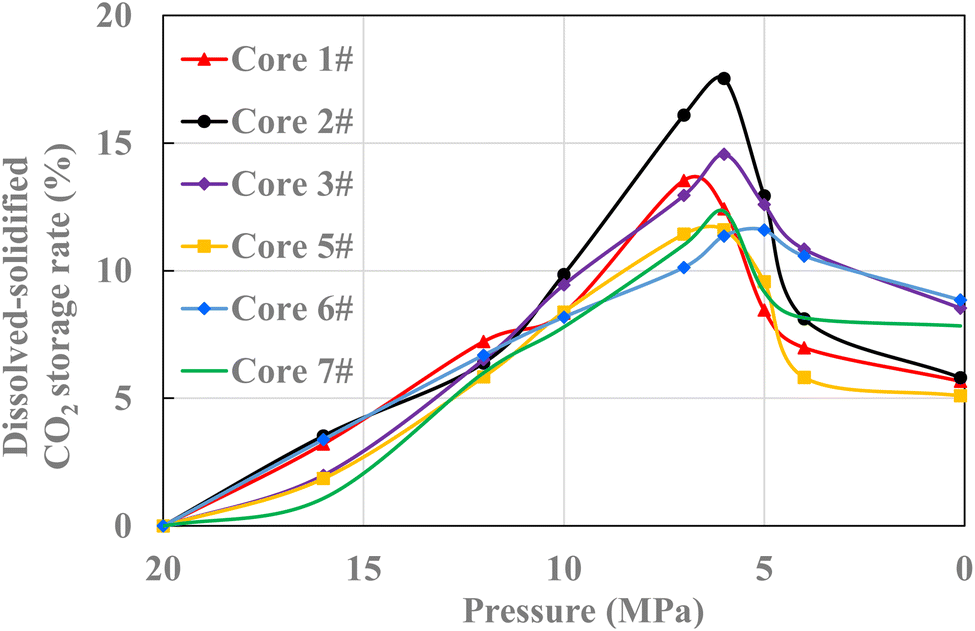
We can find from Fig. 7, the overall CO2 storage rate curve of the core containing bound water is similar to that of the bound CO2 storage rate curve of dry core in Fig. 2, both showing a sharp decline in CO2 storage rate near the supercritical pressure. Through the comparison of CO2 storage rate data, it is found that for each core, the CO2 storage rate of the core containing bound water is greater than that of the dry core at every pressure. This is because the CO2 storage rate of the core containing bound water is the sum of the bound CO2 storage rate and the dissolved-solidified CO2 storage rate, while the CO2 storage rate of the dry core is the bound CO2 storage rate only because there is no water present. By subtracting the bound CO2 sequestration rate data in Fig. 2 from the overall CO2 storage rate data in Fig. 7, the dissolved-solidified CO2 storage rate of each core at different pressures can be obtained. The results are shown in Fig. 8.
As shown in Fig. 8, the dissolved-solidified CO2 storage rate increases first and then decreases with the decrease of pressure. It reaches the maximum value near the supercritical pressure. The maximum value of the dissolved-solidified CO2 storage rate for the six core samples is between 11.59% and 17.52%. When the pressure is slightly lower than the supercritical pressure, that is, 5–7 MPa, the dissolved-solidified CO2 storage rate is about 10–15% and under other pressures is basically between 5–10%. Overall, for tight sandstone gas reservoirs, the CO2 storage rate by dissolution and solidification is much smaller than the bound CO2 storage rate formed by capillary force. With the extension of gas well production time, the reaction time between the CO2 aqueous solution and the rock minerals is long, and the solidified CO2 storage amount will increase. However, with the decrease of pressure, the amount of dissolved CO2 in water will decrease, and some CO2 will be become free gas, thereby achieving an enhancement effect.
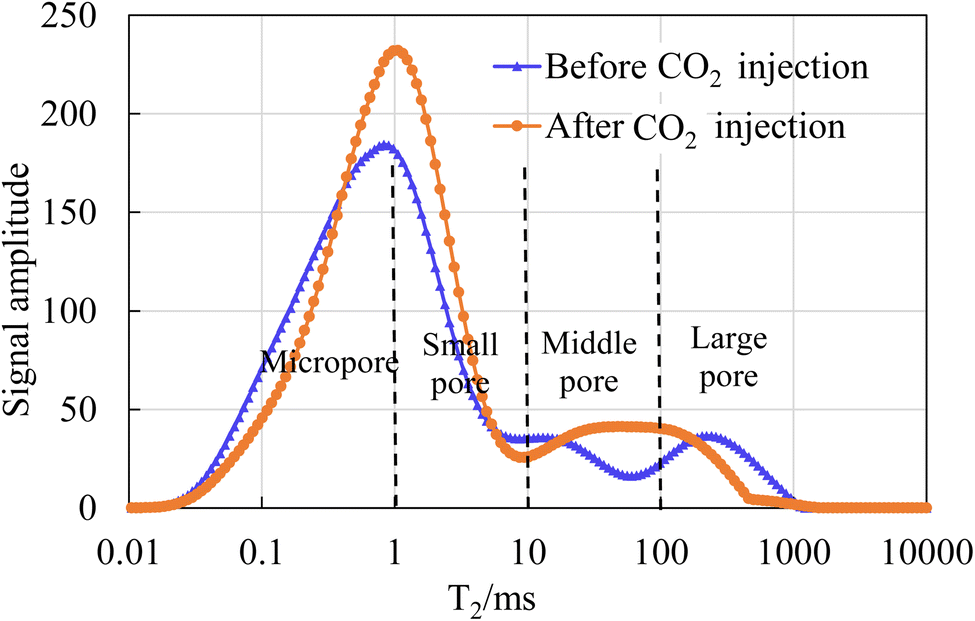 | ||
| Fig. 9 The pore size distribution curve of core 1# before and after CO2 injection. | ||
 | ||
| Fig. 10 The pore size distribution curve of core 2# before and after CO2 injection. | ||
The T2 spectra curves of core samples 1# and 2# before and after CO2 injection show obvious differences. For core sample 1#, after CO2 injection, various pore size intervals including micropores, small pores, medium pores and large pores have significant changes. By calculating the areas of the T2 spectra curves before and after CO2 injection, it can be known that the pore volume occupied by medium and large pores has increased by 30.23% and 42.65% respectively after CO2 injection, while the pore volume of micropores and small pores has decreased by 6.5% and 27.33% respectively. For core sample 2#, after CO2 injection, the pore volumes of micropores, small pores, medium pores and large pores have all increased, and it can be calculated that they have increased by 104.63%, 22.89%, 7.74% and 68.47% respectively. It can be seen that the injected CO2 dissolves in formation water to form weak acids and reacts with clay and calcite-like minerals in the rock core to form kaolinite, carbonate and other precipitates. The dissolution effect increases the pore volume of some pores while blocking some pores due to the precipitates, thus causing the difference in pore size distribution before and after CO2 injection.
The two contrast core samples of each experimental group were selected nearby on the tight carbonate core sample. It can be considered that the mineral compositions of these two core samples are consistent. One sample was taken as a blank sample, and the other sample was immersed in the CO2 aqueous solution for the immersion experiment with temperature of 65 °C and pressure of 20 MPa, and the immersion time was 15 days. After immersion, X-ray diffraction tests were conducted on the two samples to analyze the changes in rock mineral composition under the effect of CO2 dissolution and solidification. The test results are shown in Table 3.
| Core no. | Note | Whole rock content (%) | Relative content of clay minerals (%) | ||||||
|---|---|---|---|---|---|---|---|---|---|
| Total clay content | Quartz | Calcite | Dolomite | Kaolinite | Chlorite | Illite | Illite-smectite mixed-layer | ||
| 1-1 | Before immersion | 1.4 | 2.6 | 4.5 | 91.5 | 1.2 | 1.8 | 57.6 | 39.4 |
| 1-2 | After immersion | 2.3 | 4.5 | 2.7 | 90.5 | 1 | 2.3 | 48.4 | 48.3 |
| Rate of change | 64.3 | 73.1 | −40 | −1.1 | −16.7 | 27.8 | −16 | 22.6 | |
| 2-1 | Before immersion | 0.7 | 4.2 | 8.3 | 86.8 | 7.8 | 19.5 | 32.7 | 40 |
| 2-2 | After immersion | 0.5 | 8.1 | 5.8 | 85.6 | 6.6 | 11.5 | 36.2 | 45.7 |
| Rate of change | −28.6 | 92.9 | −30.1 | −1.4 | −15.4 | −41 | 10.7 | 14.3 | |
As can be seen from Table 3, the mineral composition of carbonate rocks is mainly composed of dolomite, calcite, quartz and clay minerals. Among them, dolomite accounts for more than 85%, and the clay minerals mainly consist of kaolinite, chlorite, illite and illite/smectite mixed layers. After the samples were soaked in CO2 aqueous solution for 15 days, the mineral composition still showed significant changes. The content of calcite and dolomite-like minerals in both groups of samples decrease significantly. The dolomite and calcite in the carbonate rocks dissolve under the influence of carbonic acid, with calcite dissolving to a greater extent than dolomite under the experimental conditions. As the proportion of dolomite and calcite in the mineral composition decreases, and since quartz is essentially unreactive, the relative percentage of quartz increases.23
For clay minerals, the change patterns of the two groups of samples are not consistent. The possible reason for this is the complex chemical reaction relationships among kaolinite, chlorite and illite in clay minerals. Studies have shown that illite minerals can dissolve in carbonate solutions when the temperature reaches above 65 °C, forming kaolinite precipitates. And the dissolution of feldspar can promote the formation of authigenic kaolinite.24,25 In addition, chlorite can dissolve in acidic environments and generate illite.26 Some literature also indicates that illite and carbonate minerals can form chlorite within a certain temperature range.27
4. Conclusion
(1) When CO2 injection in tight carbonate gas reservoirs, it can achieve a better CO2 storage effect, and the mechanism is mainly based on the bound CO2 storage. CO2 injection pressure has a significant impact on the bound CO2 storage, and when the pressure is higher than the supercritical pressure, the bound CO2 storage rate can reach over 60%. The dissolved-solidified CO2 storage rate is at its peak of 10–15% when the pressure is between 5 MPa and 7 MPa, and is basically between 5–10% at other pressures.(2) The bound CO2 storage rate is greatly affected by the threshold pressure gradient. For tight carbonate gas reservoirs, with the increasing threshold pressure gradient, the bound CO2 storage rate increases. The microscopic pore throat distribution of the core also affects the bound CO2 storage effect. With the decreasing core permeability, the bound CO2 storage rate increases.
(3) For tight carbonate gas reservoirs, the dissolution and solidification storage of CO2 mainly occurs in small pores, medium pores and large pores regions. The dissolved-solidified CO2 storage rate is affected by the mineral composition. Dolomite and calcite are the main dissolution minerals of CO2 in water, thereby changing the pore throat distribution of the reservoir.
Data availability
All data included in this study are available upon request by contact with the corresponding author.Conflicts of interest
There are no conflicts to declare.Acknowledgements
This research is supported by the National Natural Science Foundation of China(No. 52174031)and the Youth Innovation Team of Shaanxi Universities.References
- E. Agartan, M. Gaddipati, Y. Yip, B. Savage and C. Ozgen, CO2 storage in depleted oil and gas fields in the Gulf of Mexico, Int. J. Greenhouse Gas Control, 2018, 72, 38–48 CrossRef CAS
.
- E. G. Al-Sakkari, A. Ragab, H. Dagdougui, D. C. Boffito and M. Amazouz, Carbon capture, utilization and sequestration systems design and operation optimization: assessment and perspectives of artificial intelligence opportunities, Sci. Total Environ., 2024, 917, 170085 CrossRef CAS
- H. Enobong, N. Chukwuebuka and O. H. Victor, Carbon capture, utilization, and storage (CCUS) technologies: Evaluating the effectiveness of advanced CCUS solutions for reducing CO2 emissions, Results Surf. Interfaces, 2025, 2025(18), 100381 Search PubMed
- J. B. Li, Y. H. Cui and Y. G. Huang, et al., Technologies and prospect of full-cycle development of low-permeability tight gas reservoirs with horizontal wells, Ordos Basin, Oil Gas Geol., 2023, 44(2), 480–494 Search PubMed
- Y. D. Jiang, C. Qin and Z. P. Kang, et al., Experimental study of supercritical CO2 fracturing on initiation pressure and fracture propagation in shale under different triaxial stress conditions, J. Nat. Gas Sci. Eng., 2018, 55, 382–394 CrossRef CAS
- J. P. Zhou, N. Hu and X. F. Xian, et al., Supercritical CO2 fracking for enhanced shale gas recovery and CO2 sequestration: Results, status and future challenges, Adv. Geo-Energy Res., 2019, 3(2), 207–224 CrossRef
- C. Zhang, L. Hu and Z. Niu, et al., Application of CO2-EOR in low permeability beach-bar sand reservoir-taking Shengli oilfield Gao 89 block as an example, Sci. Technol. Eng., 2023, 23(15), 6393–6401 Search PubMed
- T. Wang, H. Y. Yu and X. C. Zhu, et al., Numerical simulation study on geological storage of CO2 in saline aquifers assisted by water alternating gas, China Offshore Oil Gas, 2023, 35(4), 198–204 Search PubMed
- J. Bradshaw, S. Baehu and D. Bonijoly, CO2 storage Capacity estimation: issues and development of standards, Int. J. Greenhouse Gas Control, 2007, 1(1), 62–68 CrossRef CAS
- S. Mo, P. Zweigel, E. Lindeberg and et al., Effect of Geologic Parameters on CO2 Storage in Deep Saline Aquifers, SPE 93952, 2005 Search PubMed
- Z. Chen, L. Li and Y. Su, et al., Investigation of CO2-EOR and storage mechanism in Injection-Production coupling technology considering reservoir heterogeneity, Fuel, 2024, 368, 131595 CrossRef CAS
- R. Romal, P. Khomchan and T. Vorasate, et al., Geomechanics contribution to CO2 storage containment and trapping mechanisms in tight sandstone complexes: A case study on Mae Moh Basin, Sci. Total Environ., 2024, 928, 172326 CrossRef
- X. Wang, H. Yang and Y. Huang, et al., Evolution of CO2 Storage Mechanisms in Low-Permeability Tight Sandstone Reservoirs, Engineering, 2024, 48, 107–120, DOI:10.1016/j.eng.2024.05.013
- D. Hou, F. Gong and B. Chen, et al., Gas recovery enhancement and CO2 storage effects by CO2 flooding in bottom-water sandstone gas reservoir, Nat. Gas Ind., 2024, 44(4), 93–103 CAS
- Q. M. Malik and M. R. Islam, CO2 injection in the Weyburn field of Canada:Optimization of enhanced oil recovery and greenhouse gas storage with horizontal wells [R], SPE 59327, 2000 Search PubMed
- S. Kalra, W. Tian and X. Wu, A numerical simulation study of CO2 injection for enhancing hydrocarbon recovery and sequestration in liquid-rich shales, Pet. Sci., 2018, 15(1), 103–115 CrossRef CAS
- X. Chen, X. Wang and X. U. Changmin, et al., CO2 sequestration morphology and distribution characteristics based on NMR technology and microscopic numerical simulation, Pet. Reservoir Eval. Dev., 2023, 13(3), 296–304 Search PubMed
- X. Dai, S. Sang and M. Wang, et al., Mineral corrosion/precipitation characteristic sand regularities during CO2 sequestration in shale, Acta Pet. Sin, 2024, 45(12), 1833–1850 Search PubMed
- A. Takashi, K. Takashi and K. Shigeru, et al., Numerical modelling of long-term CO2 storage mechanisms in saline aquifers using the Sleipner benchmark dataset, Int. J. Greenhouse Gas Control, 2021, 110, 103405 CrossRef
- J. Song and D. Zhang, Comprehensive Review of Caprock-Sealing Mechanisms for Geologic Carbon Sequestration, J. Environ. Sci. Technol., 2013, 47, 9–22 CrossRef CAS PubMed
- L. K. Thomas, D. L. Katz and M. R. Tek, Threshold pressure phenomena in porous media, Soc. Pet. Eng. J., 1967, 8(2), 174–184 CrossRef
- J. Zhao, P. Wang, Y. Zhang, L. Ye and Y. Shi, Influence of CO2 injection on the pore size distribution and petrophysical properties of tight sandstone cores using nuclear magnetic resonance, Energy Sci. Eng., 2020, 8, 2286–2296 CrossRef CAS
- L. Ying, M. Hansong and L. Haitao, et al., Dissolution of supercritical CO2 on carbonate reservoirs, Pet. Reservoir Eval. Dev., 2023, 13(3), 288–295 Search PubMed
- L. Bing, L. Leilei and H. Jianfeng, Experimental study on chemical damage and mechanical property degradation of reservoir rocks in the process of CO2 geological storage in a saline aquifer, Chin. J. Geotech. Eng., 2025, 47(6), 1123–1131 Search PubMed
- Q. Wang, C. Zang and W. Zhu, et al., The impact of mantle source CO2 on clay minerals of clastic reservoirs in the east part of Shijiutuo symon fault Bozhong depression, Acta Petrol. Mineral., 2012, 31(5), 674–680 CAS
- M. Shaoxing, L. Xingjiao and L. Ying, et al., Numerical Modeling of CO2 Sequestration in the Saline Aquifer of Yancheng Formation in Subei Basin Using TOUGHREACT-MP, J. Jilin Univ., Earth Sci. Ed., 2014, 44(5), 1647–1658 Search PubMed
- C. Q. Chen, J. X. He and X. Tao, Possible CO2 Genesis by Petrochemical Reaction in Shallow Formation of Yinggehai Basin, Nat. Gas Geosci., 2004, 15(4), 418–421 Search PubMed
| This journal is © The Royal Society of Chemistry 2025 |