
 Open Access Article
 This Open Access Article is licensed under a Creative Commons Attribution-Non Commercial 3.0 Unported Licence
A comprehensive study on the gemological and mineralogical characteristics and coloration mechanisms of four color varieties of natural topaz†
Xin Zhang,
Nai Wang * and
Yifan Gong
* and
Yifan Gong
School of Gemmology, China University of Geosciences, Beijing, 100083, China. E-mail: 2003011807@cugb.edu.cn
First published on 28th May 2025
Abstract
Topaz, a mineral with variable composition, is commonly utilized as a gemstone. Its extensive distribution and diverse coloration have attracted considerable academic interest. This study systematically investigates the mineralogical characteristics and coloration mechanisms of natural topaz with four color types (colorless, yellow, blue, and brown) by analyzing their structural features, chemical composition, and spectroscopic properties. The results indicate that the different colors of topaz arise from the substitution of Al3+ by impurity ions, and the presence and concentration of O− centers. Blue topaz exhibits stable coloration through superhyperfine interactions between sufficient O− centers and two equivalent Al3+, while the concentration of O− centers in colorless topaz is insufficient to induce coloration. Yellow topaz contains substantial Fe impurities, and the O2− → Fe3+ charge transfer and the 6A1g → 4Eg + 4A1g d–d electron transitions of Fe3+ jointly contribute to the coloration of yellow topaz. Compared to topaz of other colors, yellow topaz exhibits a notably higher concentration of OH groups, and coupled with its coloration mechanism, we propose that the yellow coloration of topaz serves as a robust indicator of hydrothermal or metamorphic mineralization processes. Brown topaz is associated with the 6A1g → 4T2g d–d electron transitions of Fe3+ and a combination of trapped-electron and O− centers. This study improves the theoretical research on natural topaz coloration mechanisms, provides comprehensive comparative analysis of the mineralogical characteristics of four color varieties of natural topaz and suggests a potential correlation between the yellow hue of topaz and its deposit genesis.
1 Introduction
Topaz is an aluminum silicate mineral with the general chemical formula Al2SiO4(F, OH)2. It crystallizes within the orthorhombic crystal system and belongs to the space group Pbnm.1 Fluoride ions (F−) can be partially replaced by hydroxide ions (OH−), but the extent of this substitution is limited. The ratio of OH to (OH + F) ranges from nearly zero to approximately thirty percent.2 The ratio of F to OH in topaz varies with its formation temperature, which can be utilized to infer the genesis and occurrence of topaz. This variation directly influences its physical properties. For example, the refractive index of topaz is typically inversely proportional to the F content, whereas the density of topaz increases as the F content rises. When the OH content reaches a sufficient level, the structure undergoes distortion to either triclinic or monoclinic symmetry.2,3 As shown in Fig. 1, the structure of topaz comprises isolated [SiO4] tetrahedra linked in a zigzag arrangement parallel to the c-axis of the crystal, along with chains of octahedra formed by [AlO4(F,OH)2]. Among the six anions surrounding each Al3+ ion, four are part of the [SiO4] tetrahedron, while the remaining two anions consist of either F− or OH− groups.4 Topaz usually forms in granitic pegmatites and can also be found in hydrothermal vein deposits. It is an accessory mineral in fluorine-rich granitic rocks (or clastic sediments near acidic intrusive rocks) and ultrahigh-pressure rocks associated with gas–liquid or hydrothermal events.5–7 As it is often associated with cassiterite, topaz is considered a valuable indicator of tin ore.8 | ||
| Fig. 1 (a–c) The crystal structures of topaz in the direction of three crystal axes, a, b, and c, respectively. | ||
Currently, the enhancement of color, the mechanism of coloration, and the mineral physics of topaz are focal points in scholarly research. Silva et al. analyzed natural and neutron-irradiated blue topaz samples using electron paramagnetic resonance and optical absorption.9 Electron Paramagnetic Resonance (EPR) analysis of O− centers shows superhyperfine interactions with two equivalent Al neighbors in four inequivalent positions. The O− center concentration correlates linearly with optical absorption at 620 nm. Several studies have demonstrated, through EPR and UV-vis spectroscopy analyses, that the concentration of O− centers in natural blue topaz is significantly higher compared to that in topaz of other colors (colorless, yellow and brown).2,9–11 Skvortsova et al. indicated that the 620 nm absorption band in topaz is related to the substitution of Al3+ sites by Cr3+, Fe2+ and Mn2+ impurity ions.2 In addition, the broad band observed at 650 cm−1 in the Raman spectrum after rapid neutron irradiation may be associated with lattice disorder. Dickinson et al. recognized distinct EPR centers, four from impurities (two Fe3+, V4+ and Cr3+), and six from defect centers.12 The Cr3+ center was identified as pink. Taran et al. suggested that, in addition to Cr3+ imparting a pink to purple hue to topaz, chromium occurs in topaz as Cr4+.13 This form of chromium is responsible for the red-orange coloration in imperial topaz. In varieties containing both Cr3+ and Cr4+, a mixed coloration of pink and orange is observed. Song et al. suggested that the coloration element for yellow topaz is iron, and the OH content of yellow topaz is abnormally high.14 In the spectroscopic studies by Pinheiro et al. and Londo et al. on topaz, yellow topaz samples showed the characteristic of having a higher OH content than colorless and blue samples.3,15 Komatsu examined the effects of temperature and pressure on the crystal structure of topaz and discovered that as the temperature increased, the average Al–O bond distance expanded considerably, whereas the Al–F and Si–O bond distances exhibited only minor increments.16 Correcher found that both cathodoluminescence (CL) and thermoluminescence (TL) emissions of topaz are strongly dependent on temperature.17 Cryogenic treatments induce a significant decrease in the CL and TL intensity above 400 nm, which is associated with intrinsic OAl* defects and iron point defects. Furthermore, Correcher also confirmed the existence of a continuous trap distribution system in topaz.17 In addition, the coloration of gem minerals is increasingly recognized as a critical geochemical tracer, offering insights into fluid compositions, redox conditions, and tectonic settings during mineral formation. For instance, in emeralds, chromophore ratios (Cr/V) distinguish metamorphic from hydrothermal origins, while tourmaline color zonation reflects evolving fluid chemistries in pegmatitic systems.18,19 Similarly, topaz color variations may encode signatures of its genetic environment. Hydrothermal systems, characterized by fluid–rock interactions and volatile-rich conditions, often favor OH− incorporation and trace element substitution, whereas high-temperature magmatic settings typically stabilize F-rich compositions.7,20,21 Previous studies on the genesis types of topaz and their correlations with chemical composition have been relatively clear, but the connection between the color of topaz and genesis types has not yet been established. In addition, the understanding of the causes of the various colors in natural topaz is still not well-developed. The only unambiguous assignment is that of chromium, which causes pink and red. There is still a lack of comparative research on the spectroscopic features and coloration mechanism of natural topaz of different colors.
In this study, a total of thirteen natural topaz samples of four colors were selected. Conventional gemological tests were used to study the gemological characteristics, surface morphology and internal features of the samples. The chemical composition of the samples of different colors was characterized using X-ray fluorescence spectrometry (XRF) and electron probe microanalysis (EPMA). The spectral characteristics and crystal structure of the samples were studied using infrared spectroscopy (IR), Raman spectroscopy (Raman) and powder X-ray diffraction (XRD). The coloration mechanism of topaz of different colors was explored using ultraviolet-visible spectrophotometer (UV-vis). This study advances the theoretical framework for understanding natural topaz coloration mechanisms and establishes a systematic experimental foundation for its gemological and mineralogical characteristics. Furthermore, we propose a novel hypothesis linking topaz color to deposit genesis, offering critical insights into the formation processes of yellow topaz.
2 Materials and methods
2.1. Materials
As presented in Fig. 2, thirteen natural topaz samples were analyzed in this study and numbered according to their colors. The samples include colorless topaz from Brazil (W-1, W-2, W-3), yellow topaz from Yaogangxian, Hunan Province, China (Y-1, Y-2, Y-3, Y-4), blue topaz from Brazil (B-1, B-2, B-3) and brown topaz from Mexico (BR-1, BR-2, BR-3), which are water-eroded pebbles with frosted surfaces. The rest of the samples are in irregular crystal forms.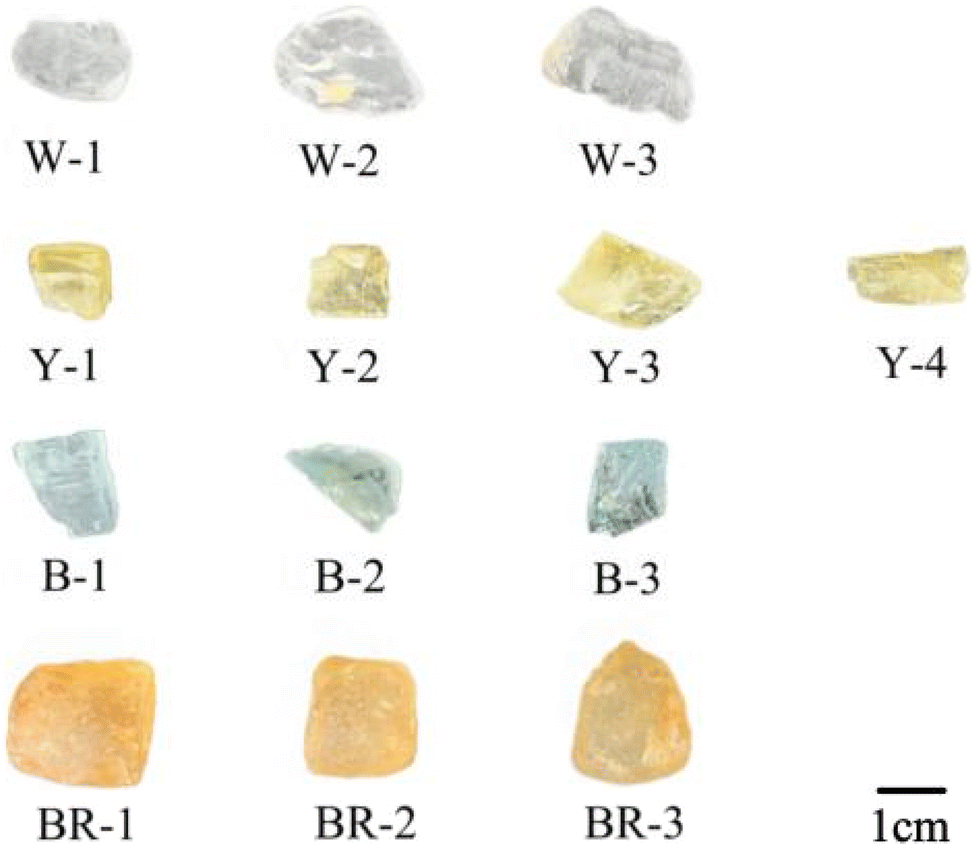 | ||
| Fig. 2 A picture of the topaz samples. | ||
2.2. Methods
Routine gemological characterization tests were performed using gemological microscopes, refractometers, electronic balances, dichroscopes, polariscopes, gemological handheld spectroscopes, and UV fluorescent lamps. Among these instruments, the handheld gemological spectrometer generates continuous spectra throughout the visible light wavelength range through dispersion, presenting the absorption and emission characteristic spectral lines of gemstones. However, its accuracy is far inferior to that of the UV-visible spectrometer. Routine gemological characterization tests were conducted at the China University of Geosciences (Beijing) Gemological Experimental Teaching Center.The composition and structure were characterized by X-ray fluorescence spectroscopy, electron probe micro-analysis and X-ray powder diffraction. The X-ray fluorescence spectra for component characterization were collected by an EDX-7000 energy spectrometer produced in Tsushima, Japan, measured at China University of Geosciences (Beijing) Gem Testing Laboratory. The experimental test conditions were an element analysis range of (13)Al–(92)U, and detection limits of 0.1%. Background correction was carried out using circular aluminum plates. The EPMA analysis was conducted using an EPMA-1720 instrument manufactured by Shimadzu, Japan. The detection limit was set at 500 ppm, and the test conditions included an accelerating voltage of 15 kV, a current of 10 nA, and an electron beam spot diameter of 5 μm, measured at China University of Geosciences (Beijing) Geoscience Test Center. The X-ray powder diffraction analysis for structural characterization was performed using a Smart Lab X-ray diffractometer (D8 Focus, Bruker, Germany) of the School of Materials, China University of Geosciences (Beijing, China). The instrument utilized CuKα radiation with a scanning speed of 10° per min, a scanning range of 5 to 80° and a sampling step width of 0.02°(2θ). The sample was prepared as a 300-mesh powder.
Spectroscopic characterization includes infrared spectroscopy, Raman spectroscopy, and UV-vis absorption spectroscopy. The remaining spectroscopic tests were all performed at the Gem Testing Laboratory, the School of Gemmology, China University of Geosciences (Beijing). Infrared spectroscopic data were acquired utilizing a TENSOR 27 Fourier transform infrared spectrometer manufactured in Germany. The measurements were conducted in reflectance mode with a spectral scanning range spanning from 400 cm−1 to 4000 cm−1. The resolution was 2 cm−1, the scan count ranged from 50 to 100, the test voltage was 220 V and the scanning speed was 10 kHz. Aluminium sheets were used for background correction. Raman spectra were acquired using an HR Evolution micro-Raman spectrometer (HORIBA, Japan). The experimental voltage was 220 V, the current was 10 A, the spectral resolution was 1 cm−1, and the laser wavelength was 532 nm with a scanning range of 200–4000 cm−1. Background correction was performed utilizing silicon wafers. UV-vis absorption spectra were recorded using a UV-3600 UV-vis spectrophotometer (Shimadzu, Japan). The experimental conditions were as follows: the sampling interval was 1.0 nm, the testing method was the diffuse reflection method, the measurement wavelength range was 200–800 nm, the light source conversion wavelength was 300 nm, and the grating conversion wavelength was 850 nm. Background correction was performed using a barium sulfate whiteboard.
3 Results and discussion
3.1. Basic gemological characteristics
Comprehensive conventional gemological characterization analyses were per-formed on all thirteen topaz samples (Table 1). The colorless, yellow and blue topaz samples were all transparent with a vitreous luster, while the brown topaz sample was opaque. Under cross-polarized illumination, the samples undergo full rotational orientation (360°), exhibiting alternating bright and dark extinction patterns at 90° intervals, which is a uniaxial crystal heterogeneity. All topaz samples can be observed to have absorption spectra under a gemological handheld spectroscope, but they are not characteristic and cannot reflect the specific coloring elements within them, that is, they have no characteristic absorption spectra. The sample shows weak fluorescence or no fluorescence under ultraviolet light. The refractive index ranges from 1.613 to 1.631, and the refractive index of topaz samples with different colors is slightly different, with the refractive index of yellow topaz slightly larger than that of other colors. In general, the refractive index of topaz is inversely proportional to the content of F.3 The birefringence is 0.008–0.010. The specific gravity of the topaz samples was determined to range between 3.41 and 3.69, demonstrating close alignment with the characteristic theoretical range documented for natural topaz minerals.8| Sample | W-1 | W-2 | Y-1 | Y-2 | B-1 | B-2 | BR-1 | BR-2 |
|---|---|---|---|---|---|---|---|---|
| Color | Colorless | Yellow | Blue | Brown | ||||
| Transparency | Transparent | Transparent | Transparent | Opaque | ||||
| Refractive index | 1.614–1.624 | 1.615–1.624 | 1.621–1.629 | 1.620–1.629 | 1.619–1.628 | 1.620–1.628 | 1.616–1.625 | 1.62 |
| Relative density | 3.49 | 3.41 | 3.53 | 3.47 | 3.69 | 3.51 | 3.59 | 3.57 |
| Polariscope | Four bright and four dark phenomena | |||||||
| Spectroscope | No characteristic absorption band | |||||||
| UV fluorescent lamps | Long wave: no | Long wave: no | Long wave: weak yellow-green | Long wave: no | ||||
| Short wave: no | Short wave: weak orange-yellow | Short wave: no | Short wave: weak orange-yellow | |||||
The colorless sample has the best transparency. Under magnification, a set of complete cleavages parallel to {001} and conchoidal fractures can be observed (Fig. 3a). A yellowish-brown staining substance is observed in the near-surface regions of samples W-2 and W-3 (Fig. 3b). Parallel gas–liquid two-phase inclusions (Fig. 3c) and a large number of oriented needle-shaped inclusions (Fig. 3d) were observed inside the samples. Negative crystals can be seen inside the blue sample B-3 (Fig. 3e). The cylindrical longitudinal striations of the yellow sample Y-4 are well developed and occur in association with tourmaline (Fig. 3f). The surface of the brown sample is frosted and has poor transparency, with almost no internal features visible.
 | ||
| Fig. 3 Surface and internal characteristics of topaz. (a) Cleavage and fracture (W-3); (b) yellowish-brown staining substance (W-2); (c) gas–liquid two-phase inclusions (W-1); (d) a needle-shaped inclusion (W-3); (e) a negative crystal (B-3); (f) cylindrical longitudinal striations and associated minerals (Y-4). | ||
3.2. Composition and structure analysis of topaz
| W-1 | W-2 | Y-1 | Y-2 | B-1 | B-2 | BR-1 | BR-2 | |
|---|---|---|---|---|---|---|---|---|
| Al | 51.430 | 50.963 | 49.890 | 49.597 | 50.320 | 50.417 | 50.949 | 51.244 |
| Si | 47.916 | 48.999 | 49.769 | 49.066 | 49.116 | 49.325 | 48.855 | 47.436 |
| S | 0.565 | 0.000 | 0.000 | 0.666 | 0.000 | 0.000 | 0.000 | 0.712 |
| Rb | 0.029 | 0.000 | 0.000 | 0.000 | 0.000 | 0.006 | 0.000 | 0.000 |
| Fe | 0.024 | 0.000 | 0.051 | 0.064 | 0.028 | 0.040 | 0.046 | 0.025 |
| Y | 0.016 | 0.000 | 0.000 | 0.000 | 0.000 | 0.000 | 0.000 | 0.000 |
| Ge | 0.011 | 0.038 | 0.024 | 0.026 | 0.051 | 0.049 | 0.049 | 0.000 |
| Sr | 0.010 | 0.000 | 0.000 | 0.000 | 0.000 | 0.000 | 0.009 | 0.000 |
| Ca | 0.000 | 0.000 | 0.203 | 0.111 | 0.405 | 0.000 | 0.000 | 0.000 |
| Ti | 0.000 | 0.000 | 0.037 | 0.033 | 0.000 | 0.000 | 0.000 | 0.000 |
| Mo | 0.000 | 0.000 | 0.018 | 0.000 | 0.000 | 0.000 | 0.006 | 0.000 |
| Cu | 0.000 | 0.000 | 0.008 | 0.008 | 0.013 | 0.011 | 0.000 | 0.000 |
| K | 0.000 | 0.000 | 0.000 | 0.381 | 0.000 | 0.000 | 0.000 | 0.000 |
| Hf | 0.000 | 0.000 | 0.000 | 0.048 | 0.000 | 0.000 | 0.000 | 0.000 |
| Er | 0.000 | 0.000 | 0.000 | 0.000 | 0.068 | 0.000 | 0.000 | 0.000 |
| Cr | 0.000 | 0.000 | 0.000 | 0.000 | 0.000 | 0.080 | 0.000 | 0.000 |
| Pr | 0.000 | 0.000 | 0.000 | 0.000 | 0.000 | 0.062 | 0.000 | 0.000 |
| Th | 0.000 | 0.000 | 0.000 | 0.000 | 0.000 | 0.009 | 0.000 | 0.000 |
| Ag | 0.000 | 0.000 | 0.000 | 0.000 | 0.000 | 0.000 | 0.065 | 0.054 |
| Zr | 0.000 | 0.000 | 0.000 | 0.000 | 0.000 | 0.000 | 0.013 | 0.000 |
| Br | 0.000 | 0.000 | 0.000 | 0.000 | 0.000 | 0.000 | 0.009 | 0.000 |
| Re | 0.000 | 0.000 | 0.000 | 0.000 | 0.000 | 0.000 | 0.000 | 0.529 |
We further carried out electron probe micro-analysis to clarify the differences in F content among the topaz samples of different colors and to improve the characterization of their compositional profiles. Two points were randomly selected from each sample for electron microprobe analysis, and the average value was taken as the data of that sample. As shown in Table 3, the average concentrations of Al2O3 and SiO2 were 55.827 wt% and 32.387 wt%, respectively, which are in close agreement with the theoretical values. The mean F contents in the colorless, yellow, blue, and brown topaz samples were 10.587 wt%, 10.079 wt%, 10.402 wt%, and 10.276 wt%, respectively. Notably, the F content in yellow topaz is significantly lower compared to other varieties, suggesting a higher degree of OH− substitution for F− in yellow topaz relative to the other colors. Apart from the colorless topaz samples, the Zn element was detected in all of the other topaz samples, indicating that Zn might play a role in influencing the coloration of topaz. Although Zn2+ is larger than Al3+, its low concentration likely prohibits its direct substitution for Al3+ in the crystal lattice. Instead, Zn might occupy interstitial sites or form complexes with OH− groups, potentially stabilizing hydroxyl-rich environments, as observed in hydrothermal/metamorphic systems.23 Nevertheless, the impact of Zn on the color of topaz is merely secondary, as its fully filled d orbitals (3d10) are incapable of undergoing d–d electron transitions and lack the redox activity required for charge transfer. Hence, Zn cannot be regarded as a chromogenic element in gemology.
| Data | F | TiO2 | SiO2 | Cr2O3 | Na2O | V2O5 | Cl | MnO | MgO | FeO | K2O | ZnO | Al2O3 | NiO | CaO | P2O5 | Total |
|---|---|---|---|---|---|---|---|---|---|---|---|---|---|---|---|---|---|
| W-1 | 10.85 | 0.00 | 32.56 | 0.01 | 0.00 | 0.00 | 0.01 | 0.02 | 0.00 | 0.01 | 0.00 | 0.00 | 55.29 | 0.01 | 0.01 | 0.00 | 98.77 |
| W-2 | 11.48 | 0.01 | 32.05 | 0.03 | 0.00 | 0.04 | 0.01 | 0.01 | 0.00 | 0.00 | 0.00 | 0.00 | 55.25 | 0.05 | 0.01 | 0.00 | 98.95 |
| W-3 | 9.43 | 0.00 | 33.48 | 0.00 | 0.00 | 0.02 | 0.01 | 0.01 | 0.00 | 0.00 | 0.01 | 0.00 | 56.05 | 0.02 | 0.02 | 0.01 | 99.06 |
| Y-1 | 10.66 | 0.04 | 32.69 | 0.00 | 0.01 | 0.00 | 0.00 | 0.01 | 0.00 | 0.03 | 0.01 | 0.10 | 55.95 | 0.07 | 0.01 | 0.03 | 99.61 |
| Y-2 | 10.11 | 0.02 | 32.91 | 0.01 | 0.01 | 0.01 | 0.01 | 0.02 | 0.01 | 0.02 | 0.00 | 0.12 | 56.06 | 0.00 | 0.00 | 0.02 | 99.34 |
| Y-3 | 9.47 | 0.01 | 32.45 | 0.01 | 0.01 | 0.00 | 0.00 | 0.01 | 0.00 | 0.01 | 0.01 | 0.03 | 56.77 | 0.02 | 0.01 | 0.00 | 98.80 |
| B-1 | 10.12 | 0.02 | 32.07 | 0.01 | 0.01 | 0.02 | 0.01 | 0.00 | 0.00 | 0.02 | 0.01 | 0.05 | 56.68 | 0.02 | 0.01 | 0.02 | 99.08 |
| B-2 | 10.05 | 0.02 | 32.58 | 0.01 | 0.01 | 0.01 | 0.01 | 0.01 | 0.00 | 0.03 | 0.00 | 0.00 | 56.32 | 0.03 | 0.01 | 0.05 | 99.15 |
| B-3 | 11.04 | 0.07 | 32.30 | 0.01 | 0.00 | 0.00 | 0.00 | 0.00 | 0.01 | 0.04 | 0.00 | 0.03 | 52.84 | 0.02 | 0.01 | 0.01 | 96.38 |
| BR-1 | 10.71 | 0.02 | 31.99 | 0.01 | 0.03 | 0.01 | 0.00 | 0.02 | 0.00 | 0.01 | 0.00 | 0.03 | 55.92 | 0.00 | 0.01 | 0.00 | 98.76 |
| BR-2 | 9.96 | 0.00 | 32.18 | 0.00 | 0.01 | 0.03 | 0.00 | 0.03 | 0.01 | 0.00 | 0.01 | 0.03 | 56.24 | 0.02 | 0.01 | 0.03 | 98.56 |
| BR-3 | 10.15 | 0.04 | 31.38 | 0.02 | 0.01 | 0.03 | 0.00 | 0.01 | 0.00 | 0.01 | 0.00 | 0.03 | 56.56 | 0.01 | 0.00 | 0.02 | 98.28 |
 | ||
| Fig. 4 X-ray diffraction patterns of topaz samples W-1, Y-1, B-2, and BR-1. | ||
| Sample number | a (Å) | b (Å) | c (Å) | Cell volume (Å3) | α = β = γ (°) | Density (g cm−3) | Rwp (%) |
|---|---|---|---|---|---|---|---|
| W-1 | 8.7930 | 8.3868 | 4.6483 | 342.79 | 90 | 4.19 | 9.18 |
| Y-1 | 8.8085 | 8.3945 | 4.6557 | 344.26 | 90 | 4.17 | 9.22 |
| B-2 | 8.7918 | 8.3871 | 4.6475 | 342.70 | 90 | 4.19 | 9.47 |
| BR-1 | 8.7866 | 8.3823 | 4.6448 | 342.10 | 90 | 4.19 | 9.06 |
3.3. Spectroscopy analysis of topaz
 | ||
| Fig. 5 (a) Infrared reflection spectra of the topaz samples (400–1200 cm−1); (b) infrared reflection spectra of the topaz samples (2000–4000 cm−1). | ||
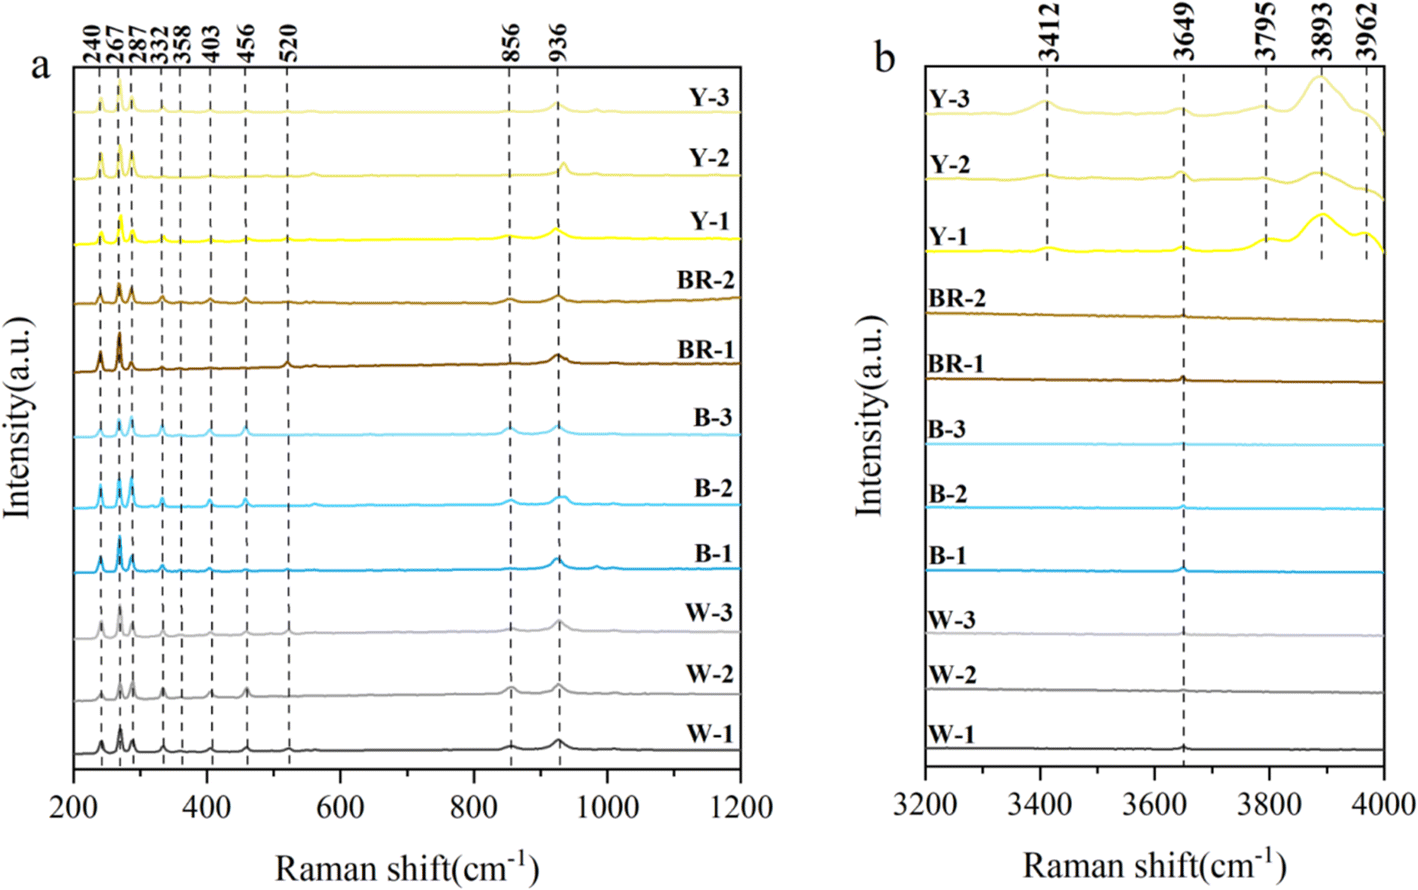 | ||
| Fig. 6 (a) Raman spectra of the topaz samples (200–1200 cm−1); (b) Raman spectra of the topaz samples (3200–4000 cm−1). | ||
 | ||
| Fig. 7 UV-vis spectra of colorless, yellow, blue and brown topaz samples. | ||
| Color type | Peak positions (nm) | Peak assignments31,32,34,35,37 |
|---|---|---|
| Colorless | 250 | Al![[double bond, length as m-dash]](https://www.rsc.org/images/entities/char_e001.gif) Si=O structure Si=O structure |
| 620 | O− centers | |
| Yellow | 280 | Combined effect of O2− → Fe3+ charge transfer and AlSi=O structure |
| 425 | 6A1g → 4Eg + 4A1g d–d electron transitions of Fe3+ | |
| Blue | 268 | AlSi=O structure |
| 620 | O− centers | |
| Brown | 265 | AlSi=O structure |
| 369 | 6A1g → 4T2g d–d electron transitions of Fe3+ | |
| 417 | Combination of trapped-electron and O− centers |
Each topaz sample exhibited significant absorbance in the 230–305 nm range, likely attributable to the AlSi=O structure. This absorbance feature is also observed in spodumene.31
The coloration of yellow topaz is attributed to the absorption bands at 280 nm and 425 nm. The 280 nm absorption band is a combined effect of the O2− → Fe3+ charge transfer and the AlSi=O structure. In hydroxyl radicals, the O2− serves as a ligand, and its lone pair of electrons undergoes a transition to the vacant d-orbitals of Fe3+. This transition demands a relatively high energy and absorbs ultraviolet to violet light within the visible spectrum. The absorption band at 425 nm is caused by the 6A1g → 4Eg + 4A1g d–d electron transitions of Fe3+ (ref. 32) The combined effect of the O2− → Fe3+ charge transfer and the 6A1g → 4Eg + 4A1g d–d electron transitions of Fe3+ is to absorb blue and violet light, causing topaz to display the complementary color of blue and violet light, that is, yellow. Furthermore, the intensity of the yellow color increases with higher concentrations of Fe.14 The XRF analysis indicates that yellow topaz contains significantly higher levels of Fe compared to topaz of other colors, strongly supporting the proposed coloration mechanism. Meanwhile, the coloration mechanism explains the reason why yellow topaz is rich in hydroxyl groups, that is, the O2− → Fe3+ charge transfer requires sufficient hydroxyl radical ligands. By synthesizing the features of low fluorine content (10.079 wt% average) and high hydroxyl concentration in yellow topaz, coupled with its coloration mechanism, we propose that the yellow coloration of topaz serves as a robust indicator of hydrothermal or metamorphic mineralization processes. It is probably linked to post-magmatic fluid activity, metamorphic dehydration, or hydrothermal alteration.20
The coloration of brown topaz is attributed to the small broad bands centered at 369 nm and 417 nm, which is different from the small broad band in the 460–480 nm range reported in previous studies.33 The absorption at 369 nm is caused by the 6A1g → 4T2g d–d electron transitions of Fe3+ (ref. 32). The 417 nm absorption is attributed to a combination of trapped-electron and O− centers, which are potential defect structures responsible for this spectral feature.34,35 The combined effect of these two minor absorption bands results in topaz exhibiting a brown hue.
The coloration of blue topaz is related to a broad absorption band centered at 620 nm. This band has been attributed to the presence of Cr3+, Fe2+, and Mn2+ impurities by many authors.2,36 Given the absence of Mn ions (Table 2) and discernible absorption signatures corresponding to Cr3+ and Fe2+ in blue topaz, the absorption band centered at approximately 620 nm can be deemed to originate from O− centers.37 We propose that by natural light irradiation, these O− centers are formed by taking a hydrogen atom away from hydroxyl radicals OH−. The liberated hydrogen atoms can form diamagnetic H2 molecules or become immobilized through interactions with impurity sites.9 The O− centers can absorb light at specific wavelengths, creating an absorption band in the visible region, specifically forming a broad absorption band around 620 nm. This band primarily absorbs orange light, resulting in the complementary color blue being exhibited by the topaz.
Notably, colorless topaz exhibits a broad absorption band centered at 620 nm, which contrasts with the absence of absorption bands in the visible light range reported in prior studies.38 As colorless topaz contains only trace amounts of Mn ions and exhibits no absorption peaks for Cr3+ or Fe2+, we conclude that the broad absorption band is also attributed to O− centers. Previous studies have reported that the EPR spectra of natural colorless topaz and natural blue topaz are very similar, both characterized by a peak at g = 2 caused by the O− centers. The only difference lies in the peak intensity, with the peak intensity at g = 2 in natural blue topaz being significantly higher than that in natural colorless topaz.12 In addition, the absorption band at 620 nm correlates linearly with the EPR signal intensity of the O− centers.9 Therefore, we propose that the specific reason for the absence of coloration in natural colorless topaz, despite the presence of O− centers, is likely attributed to an insufficient concentration of O− centers to induce observable coloration.
Conclusions
This study is based on the investigation of the composition, structure and spectral characteristics of four different colors (colorless, yellow, blue and brown) of natural topaz, and through comparative analysis, their gemological and mineralogical characteristics and coloration mechanisms were concluded. The color of topaz is different because of the substitution of impurity ions for Al3+, and the presence and concentration of color centers. The blue hue in natural topaz is due to a high concentration of O− centers, which interact with two equivalent structural Al3+. This interaction results in a stable blue color and causes a shift in the bending vibration peak position of the Al–O–Si bond in the infrared spectrum. Colorless topaz appears colorless because the concentration of O− centers that it contains is too low to cause a change in its body color. Yellow topaz contains substantial Fe impurities, and the O2− → Fe3+ charge transfer and the 6A1g → 4Eg + 4A1g d–d electron transitions of Fe3+ jointly contribute to the coloration of yellow topaz. Compared to topaz of other colors, yellow topaz exhibits a notably higher concentration of OH groups, and coupled with its coloration mechanism, we propose that the yellow coloration of topaz serves as a robust indicator of hydrothermal or metamorphic mineralization processes. Brown topaz is associated with the 6A1g → 4T2g d–d electron transitions of Fe3+ and a combination of trapped-electron and O− centers. This study deepens the theoretical understanding of natural topaz coloration mechanisms and offers a robust experimental basis for elucidating its gemological and mineralogical characteristics. Additionally, it proposes a potential correlation between the yellow hue of topaz and its deposit genesis.Data availability
All relevant data are within the manuscript.Author contributions
Xin Zhang: data collection, analysis, writing the original draft; Nai Wang: review and editing, supervision; Yifan Gong: investigation. All authors have read and approved the final manuscript.Conflicts of interest
The authors declare that they have no known competing financial interests or personal relationships that could have appeared to influence the work reported in this paper.Acknowledgements
We would like to thank the laboratory of the School of Gemmology, China University of Geosciences, Beijing, for their help with this experiment. The authors are particularly grateful to Yujun Shi for his help in analyzing the experiment, and to Biao Yang for his support in the experiment.References
- G. D. Gatta, F. Nestola, G. Bromiley and A. Loose, Am. Mineral., 2006, 91, 1839–1846 CrossRef CAS.
- V. Skvortsova, N. Mironova-Ulmane, L. Trinkler and G. Chikvaidze, IOP Conf. Ser.: Mater. Sci. Eng., 2013, 49, 012051 CAS.
- M. Pinheiro, C. Fantini, K. Krambrock, A. Persiano, M. Dantas and M. Pimenta, Phys. Rev. B, 2002, 65, 104301 CrossRef.
- P. Ribbe and G. Gibbs, Am. Mineral., 1971, 56, 24–30 CAS.
- M. Pichavant and D. Manning, Phys. Earth Planet. Inter., 1984, 35, 31–50 CrossRef CAS.
- R. P. Taylor and A. E. Fallick, Terra Nova, 1997, 9, 105–108 CrossRef.
- R. Y. Zhang, J. G. Liou and J. F. Shu, Am. Mineral., 2002, 87, 445–453 CrossRef CAS.
- J. W. Howard, J. Chem. Educ., 1935, 12, 153 CrossRef CAS.
- D. d. Silva, K. Guedes, M. Pinheiro, J. Spaeth and K. Krambrock, Phys. Chem. Miner., 2005, 32, 436–441 CrossRef.
- D. Da Silva, K. Guedes, M. Pinheiro, S. Schweizer, J. M. Spaeth and K. Krambrock, Phys. Status Solidi C, 2005, 2, 397–400 CrossRef CAS.
- R. Bassoo, D. Eames, M. F. Hardman and K. Befus, Gems Gemol., 2023, 59 Search PubMed.
- A. C. Dickinson and W. J. Moore, J. Phys. Chem., 1967, 71, 231–240 CrossRef CAS.
- M. Taran, A. Tarashchan, H. Rager, S. Schott, K. Schürmann and W. Iwanuch, Phys. Chem. Miner., 2003, 30, 546–555 CrossRef CAS.
- Z. Song, Q. Guo and L. Liao, Crystals, 2022, 12, 1746 CrossRef CAS.
- C. Londos, A. Vassilikou-Dova, G. Georgiou and L. Fytros, Phys. Status Solidi, 1992, 133, 473–479 CrossRef CAS.
- K. Komatsu, T. Kuribayashi and Y. Kudoh, J. Mineral. Petrol. Sci., 2003, 98, 167–180 CrossRef CAS.
- V. Correcher, J. Garcia-Guinea, C. Martin-Fernandez and N. Can, Spectrosc. Lett., 2011, 44, 486–489 CrossRef CAS.
- Y. Zheng, X. Yu and H. Guo, Minerals, 2019, 9, 777 CrossRef CAS.
- M. A. Marks, H. R. Marschall, P. Schühle, A. Guth, T. Wenzel, D. E. Jacob, M. Barth and G. Markl, Chem. Geol., 2013, 344, 73–90 CrossRef CAS.
- M. Soufi, Earth-Sci. Rev., 2021, 213, 103467 CrossRef CAS.
- M. L. Frezzotti, S. Ferrando, L. Dallai and R. Compagnoni, J. Petrol., 2007, 48, 1219–1241 CrossRef CAS.
- G. R. Rossman, Elements, 2009, 5, 159–162 CrossRef CAS.
- H. Sun, H. Li, N. J. Evans, H. Yang and P. Wu, Ore Geol. Rev., 2017, 88, 289–303 CrossRef.
- V. C. Farmer, The Infrared Spectra of Minerals, Mineralogical Society, London, 1974, vol. 4, pp. 51–67 Search PubMed.
- J. A. Gadsden, Infrared spectra of minerals and related inorganic compounds, Butterworths, 1975 Search PubMed.
- K. Komatsu, H. Kagi, T. Okada, T. Kuribayashi, J. B. Parise and Y. Kudoh, Am. Mineral., 2005, 90, 266–270 CrossRef CAS.
- J. Beny and B. Piriou, Phys. Chem. Miner., 1987, 15, 148–159 CrossRef CAS.
- B. Wang and J. Tu, Guang Pu Xue Yu Guang Pu Fen Xi, 2000, 20, 40–43 CAS.
- S. Churakov and B. Wunder, Phys. Chem. Miner., 2004, 31, 131–141 CrossRef CAS.
- R. D. Aines and G. R. Rossman, Am. Mineral., 1986, 71, 1186–1193 CAS.
- W. Bonventi Jr, S. Isotani and A. R. P. Albuquerque, Adv. Condens. Matter Phys., 2012, 2012, 873804 Search PubMed.
- H. Wang, Q. Guan, Y. Liu and Y. Guo, Minerals, 2022, 12, 86 CrossRef CAS.
- R. Bassoo, D. Eames, M. F. Hardman, K. Befus and Z. Sun, Gems Gemol., 2023, 59 Search PubMed.
- S. Schott, H. Rager, K. SCHÜRMANN and M. Taran, Eur. J. Mineral., 2003, 15, 701–706 CrossRef CAS.
- M. Gaft, R. Reisfeld and G. Panczer, Modern Luminescence Spectroscopy of Minerals and Materials, Springer, 2015 Search PubMed.
- V. Skvortsova, N. Mironova-Ulmane and L. Trinkler, IOP Conf. Ser.: Mater. Sci. Eng., 2015, 80, 012008 Search PubMed.
- K. Krambrock, L. Ribeiro, M. Pinheiro, A. Leal, M. d. B. C. Menezes and J.-M. Spaeth, Phys. Chem. Miner., 2007, 34, 437–444 CrossRef CAS.
- A. Ittipongse, A. Maneewong and I. M. W. Ekaputra, Mater. Today: Proc., 2018, 5, 15092–15097 CAS.
Footnote |
| † Electronic supplementary information (ESI) available. See DOI: https://doi.org/10.1039/d5ra02029h |
| This journal is © The Royal Society of Chemistry 2025 |