
 Open Access Article
 This Open Access Article is licensed under a Creative Commons Attribution-Non Commercial 3.0 Unported Licence
A highly selective colorimetric sensor of mercury(II) ions and hydrogen peroxide by biosynthesized silver nanoparticles in water and investigations of the interaction between silver and mercury†
Md. Toufiqul Islama,
Saurav Kumar Dasa,
Md. Ahad Mahamud Nahima,
Md. Rabiul Karimb,
Rumpa Kunduc,
Md. Abu Rayhan Khand,
Shofiur Rahman *ef,
Mahmoud Al-Gawatief,
Abdullah N. Alodhaybefg and
Habib Md. Ahsan*a
*ef,
Mahmoud Al-Gawatief,
Abdullah N. Alodhaybefg and
Habib Md. Ahsan*a
aChemistry Discipline, Khulna University, Khulna-9208, Bangladesh. E-mail: ahsanhru@chem.ku.ac.bd
bDepartment of Chemistry, University of Rajshahi, Rajshahi-6205, Bangladesh
cDepartment of Environmental Studies for Advanced Society, Graduate School of Environmental Studies, Tohoku University, Sendai, Japan
dDepartment of Chemistry, Mississippi State University, 310 President Cir, Mississippi State, USA
eBiological and Environmental Sensing Research Unit, King Abdullah Institute for Nanotechnology, King Saud University, Riyadh 11451, Saudi Arabia. E-mail: mrahman1@ksu.edu.sa
fKing Salman Center for Disability Research, Riyadh 11614, Saudi Arabia
gDepartment of Physics and Astronomy, College of Science, King Saud University, Riyadh 11451, Saudi Arabia
First published on 2nd April 2025
Abstract
Silver nanoparticles (AgNPs) are promising for their exceptional properties for various applications. This study applied a facile and green method to synthesize AgNPs in an aqueous medium using Averrhoa bilimbi fruit extract as a reducing and stabilizing agent. The formation of AgNPs was confirmed by using UV-visible spectroscopy, X-ray diffraction pattern (XRD), and High-resolution transmission electron microscopy (HRTEM). The synthesized AgNPs consist of face-centered cubic crystals and exhibit homogeneous spherical morphology with an average size of 11 nm. Heavy metals like mercury contamination in water and food pose global health risks, leading to disability issues, even at trace levels. Beside, H2O2 is a reactive oxygen species. Thus, elevated H2O2 levels can harm cell membranes, proteins, and DNA in aquatic creatures, resulting in oxidative stress that may affect physiological processes. Therefore, there is an urgent need for effective monitoring and prevention. The synthesized AgNPs were utilized as a colorimetric probe for the detection of mercury (Hg2+) ions in water at room temperature and found to be highly sensitive and selective with a limit of detection (LOD) of 1.58 μM and a limit of quantification (LOQ) of 5.27 μM. Furthermore, the detection of Hg2+ was unaffected in the presence of other pertinent metal ions. The prepared AgNPs probe can also enable detection of Hg2+ with the naked eye. In addition, the AgNPs probe was investigated for detecting Hg2+ ions in real water samples, which offered satisfying recovery rates ranging from 90.60 ± 2.60 to 96.73 ± 2.83%, confirming the probe's practicability. The capping agent stabilized on the surface of AgNPs can effectively pre-concentrate Hg2+ ions through the chemical interaction between AgNPs and Hg2+ ions to form Ag–Hg amalgam. This leads to a decrease in the SPR peak from AgNPs. The interaction between Ag and Hg was investigated using synchrotron radiation-induced X-ray photoelectron spectroscopy (SR-XPS). In addition, the AgNPs probe effectively detected hydrogen peroxide (H2O2) in an aqueous medium with a LOD of 3.21 μM and LOQ of 10.70 μM. This study aimed to develop a rapid, easy-to-use, eco-friendly, and reliable colorimetric sensor that may quickly identify dangerous pollutants in aqueous samples.
Introduction
Nanoparticles (NPs) are an incredible material due to their ultra-small size, greater surface area-to-volume ratio, and unique thermal, physiochemical, and biological properties, leading to potential applications in many scientific fields.1–5 In this regard, metal nanoparticles such as gold nanoparticles (AuNPs) and AgNPs have received great attention recently due to their application in sensing various analytes.6–8 SPR has unique optical properties, which have led to the development of nanoparticle-based sensing devices to measure the concentration of ions and biomolecules in environmental and biological samples.9 The particle size, shape, and inter-particle spacing significantly influence the SPR band. In the presence of any form of ions, this SPR band may interact with the NPs efficiently. There might be a color change from dispersion to aggregation due to the coupling of plasmon absorbance.10 Metal NPs are becoming important colorimetric sensors for different cations and anions because they can monitor ion recognition events through color change and shifting of the absorption spectrum.7,11–13 To employ a metal sensing probe, NPs are usually functionalized with a capping agent, which may interact with the incoming metal ions by forming a covalent connection in the surface of NPs.14 The electrostatic repulsion of the negative capping agent opposes the van der Waals attraction between the NPs, keeping the nanoparticles stable. As a result, when sufficient foreign cations are added, the repulsion between nanoparticles is reduced, causing the nanoparticle to aggregate and change color accordingly.15–17 Functionalized nanoparticle-based sensors can identify environmentally harmful ions that threaten human health.18Heavy metals like lead, mercury, and arsenic pose serious risks to both the environment and human health, leading to disability issues, even in small amounts. Long-term exposure to these metals through water and food can result in bioaccumulation in the body, leading to developmental delays, organ damage, cognitive decline, neurological disorders, cancer, and mental health issues.19–23 Among various toxic metal ions, mercury (Hg2+) is known to be extremely dangerous to humans and other living things, even at low concentrations. Because mercury is not biodegradable, it may accumulate in the food chain and become the most hazardous element.24,25 Mercury is usually released into the different environmental segments via various natural phenomena, including earthquakes, volcanic eruptions, and crustal leakage.26 Mercury compounds prepared for industrial uses are present almost everywhere in the environment. Even at low concentrations, mercury is extremely harmful to human health, leading to major illnesses of the heart, liver, kidneys, endocrine, brain, and neurological systems.27,28 Therefore, mercury is recognized as a hazardous pollutant for the environment and human health. Thus, developing a low-cost, high-selectivity, and sensitive mercury detection probe is essential to protecting both. A variety of detection methods, including surface-enhanced Raman scattering (SERS),29 atomic absorption/emission spectrometry (AAS/AES),30,31 inductively coupled plasma atomic emission spectroscopy (ICP-AES),32 high-performance liquid chromatography (HPLC),33 electrochemical sensors,34 chemiluminescent (CL) immune chromatographic assay strip (ICAS),35 have been used. Although these techniques offer exceptional sensitivity and selectivity for detecting Hg2+, they are expensive, sophisticated, and non-portable.
Therefore, it isn't easy to use in field applications. To address the problems mentioned earlier, additional test techniques should be quick, accurate, visible, and reasonably priced.36–38 Therefore, colorimetric probes offer a significant benefit in that real-time detection may be achieved using a basic spectrophotometer or the naked eye.39–41
On the other hand, hydrogen peroxide (H2O2) is a crucial biological material and mediator employed in many areas, including biology, environmental protection, medicine, diagnostics, and food security.42–45 The use of H2O2 has tremendously increased due to the advancement of civilization. However, the mishandling of H2O2 might negatively affect the environment and public health. H2O2 can induce mild mucosal irritation, vomiting, and significant gastrointestinal discomfort at small concentrations (about 3% solution) as well as biological harm such as cancer, aging, and neurodegeneration.46–50 As a result, extremely sensitive H2O2 determination is essential for safeguarding the environment and public health. Numerous analytical techniques, including colorimetry, fluorescence, chromatography, chemiluminescence, and electrochemistry, have been used to investigate several H2O2 sensors.51–54
The goal of the study is colorimetric and spectroscopic detection of Hg2+ and H2O2 using green synthesized AgNPs. Many researchers are interested in the green synthesis of AgNPs since they are environmentally safe, convenient to use, and eco-friendly.55,56 Various plant extracts, such as Piper chiba, Citrus macroptera, Cinnamon zeylanicum, Lantana camara leaf, have been applied as reducing and capping agents for the green synthesis of AgNPs.57–61 The current work used fruit extract from Averrhoa bilimbi and employed the green synthesis approach to synthesize AgNPs. While several studies have been conducted on the green synthesis of AgNPs using Averrhoa bilimbi fruit and leaf extract, colorimetric probes utilizing AgNPs have not been examined.62–67 A phytochemical study has shown that Averrhoa bilimbi contains various bioactive compounds, such as ascorbic phenolic compounds, alkaloids, flavonoids, saponins, terpenoids, and tannins, which are eco-friendly reducing and stabilizing agents for nanoparticle synthesis.68 Using conventional chemicals like sodium borohydride (NaBH4) as reducing agents to synthesize AgNPs could be harmful to health and the environment due to their toxicity. On the other hand, the fruit extract from Averrhoa bilimbi is environmentally friendly. The fruit extract, a natural, biodegradable substance, reduces the risk associated with harmful chemicals and provides a far safer substitute. Additionally, the fruit is easily accessible in Bangladesh, which lowers the total cost. In this work, we investigated the colorimetric detection of Hg2+ and H2O2 for theoretical simplicity and low technical demands. AgNPs have an advantage over other metal nanoparticles in colorimetric assays because of their greater extinction coefficients.14 Furthermore, Ag is more readily available and less expensive than other metals, but it also exhibits strong SPR performance, making it a viable option for use as a colorimetric probe.
Hence, this study aimed to utilize an environment-friendly and simple synthetic route to prepare AgNPs using Averrhoa bilimbi fruit extract for colorimetric and spectroscopic detection of Hg2+ ions and H2O2.
Results and discussion
In this study, Averrhoa bilimbi fruit extract was utilized with an aqueous silver nitrate solution at 60 °C to swiftly and safely synthesize AgNPs in an eco-friendly manner. After 30 minutes of mixing the two solutions, the color changed from colorless to brownish, signifying the formation of AgNPs. It was believed that the phytochemicals included in the Averrhoa bilimbi fruit extract led to color changes in the solution by reducing the silver ions (Ag+) to silver nanoparticles (Ag0)63,65 followed by AgNPs growth and stabilized by phytochemicals shown in Fig. 1(a) shows the UV-vis spectra of AgNPs and Averrhoa bilimbi fruit extract. The result showed two absorption peaks at 276 nm and 330 nm attributed to the π to π* electronic transition in phytochemicals in the Averrhoa bilimbi fruit extract. These absorption bands may be due to phytochemicals such as ascorbic acid, phenols, alkaloids, saponins, flavonoids, and terpenoids, as mentioned in previous studies.65 However, the UV-vis spectrum of AgNPs shows a strong absorption peak at 400 nm, which may be assigned to the SPR peak of AgNPs, and a shoulder appears at 276 nm due to the Averrhoa bilimbi fruit extract.67 The disappearance of the peak at ∼330 nm from the spectrum of AgNPs indicates that phytochemicals functioned as a capping agent to prevent the aggregation of AgNPs. In addition, a lower SPR band was observed for AgNPs compared to the previous report, suggesting a reduced particle size. The advantage of sensing is emphasized by the fact that small particles positively affect sensing resolution.10 | ||
| Fig. 1 (a) Schematic representation AgNPs formation using Averrhoa bilimbi fruit extract as reducing and stabilizing agents. (b) UV-visible spectra for Averrhoa bilimbi fruit extract and AgNPs. (c) FT-IR spectra for Averrhoa bilimbi fruit extract and AgNPs and (d) X-ray Diffraction (XRD) pattern of AgNPs synthesized using AgNO3 (1 mM, 40 mL) and Averrhoa bilimbi fruit extract (200 g L−1, 1 mL) at 60 °C and pH = 10 for 30 min. | ||
The FT-IR spectra of Averrhoa bilimbi fruit extract and AgNPs are presented in Fig. 1c. It is clear from Fig. 1c that the Averrhoa bilimbi fruit extract exhibits well-defined vibrational peaks at 3158, 2998, 1556, 1401, 1247, 1087, 761, and 553 cm−1. These bands are attributed to the O–H stretching, aliphatic C–H stretching, C![[double bond, length as m-dash]](https://www.rsc.org/images/entities/char_e001.gif) O stretching, CC stretching, C–H bending, C–O carboxylic acid, C–O esters, and aromatic rings.65 A comparison of FT-IR spectra of AgNPs and Averrhoa bilimbi fruit extract reveals crucial information on the stabilization of AgNPs by phytochemicals in the fruit extract.
O stretching, CC stretching, C–H bending, C–O carboxylic acid, C–O esters, and aromatic rings.65 A comparison of FT-IR spectra of AgNPs and Averrhoa bilimbi fruit extract reveals crucial information on the stabilization of AgNPs by phytochemicals in the fruit extract.
The Averrhoa bilimbi fruit extract exhibited two distinct peaks at 553 and 761 cm−1, which shifted to 540 and 758 cm−1, respectively, for stable AgNPs. Similarly, stretching vibrational bands for the C–O group in carbohydrate and carboxylic acid of fruit extract were observed at 1081 and 1287 cm−1, respectively. However, these peaks were shifted at 1087 and 1247 cm−1, respectively, in the spectrum of stabilized AgNPs. Additionally, the broadband appeared for the stretching vibration of the –OH group in carbohydrates and polyphenols of fruit extract at 3158 cm−1, which shifted to a shorter wavelength in the capped AgNPs at 3124 cm−1. All these changes demonstrated that phytochemicals stabilized the NPs and polyphenolic compounds reduced the Ag+ ions into AgNPs.61 Thus, the FT-IR investigations indicate that Averrhoa bilimbi fruit extract and the functional groups present in AgNPs provide compelling evidence for the capping agent action of phytochemicals in preventing AgNPs from aggregating.
The crystallinity of the produced AgNPs was examined using XRD spectroscopy; the findings are shown in Fig. 1d. Sharp XRD peaks at 2θ values of 38.19°, 44.33°, 64.54°, and 77.46° in the spectrum, which correspond to reflections of the (111), (200, (220), and (311) planes from a face-cantered cubic structure, clearly demonstrate the crystallinity of the AgNPs. The XRD profile data of AgNPs matched with the standard JCPDS file no. 04-0783 and was compatible with the crystal planes. The average size of the crystallites was estimated to be 10.55 nm, which is smaller than reported AgNPs using Averrhoa bilimbi fruit and leaf extract.62–67
The thermal stability of the AgNPs was examined using TGA (see ESI Fig. S1†). The thermogram shows two thermal degradation steps in the temperature range from 40 to 160 °C and 160 to 410 °C, with corresponding weight losses of 1.4% and 8.1%, respectively.69 The losses of surface water, volatile molecules, organic biomolecules, and heat-resistant aromatic compounds can be connected to these degradations. Consequently, the TGA findings suggest that the phytochemicals functioned as a capping agent, which agrees well with the FT-IR, UV-vis, and XRD results.
The synthesized AgNPs were examined using SEM and TEM microscopes to determine their sizes and morphologies. The AgNPs have a uniformly spherical structure in a highly aggregated state, as seen by the FE-SEM images in Fig. 2a. The phytochemicals serve as capping agents, covering the surface of the particles with an organic layer. The approximate size of the particles was estimated to be between 26 to 60 nm, even though strong aggregation makes it impossible to assess the sizes of the particles from SEM images. In addition, the HR-TEM image in Fig. 2c and TEM images in Fig. 2b help to clarify the shape and size of the synthesized AgNPs. The AgNPs were found to have a spherical shape and an average size of 11 nm, as revealed by the TEM images. Small clusters of particles were also identified, likely the result of accumulation during sample preparation. Furthermore, the size of AgNPs was determined using the Debye–Scherrer equation and TEM image. The findings demonstrated that the particle sizes were almost identical. The elemental composition of the AgNPs was investigated by EDX analysis (please see ESI Fig. S2†) and the study revealed 78.05% silver, 14.76% O, and 6.35% C in the sample.
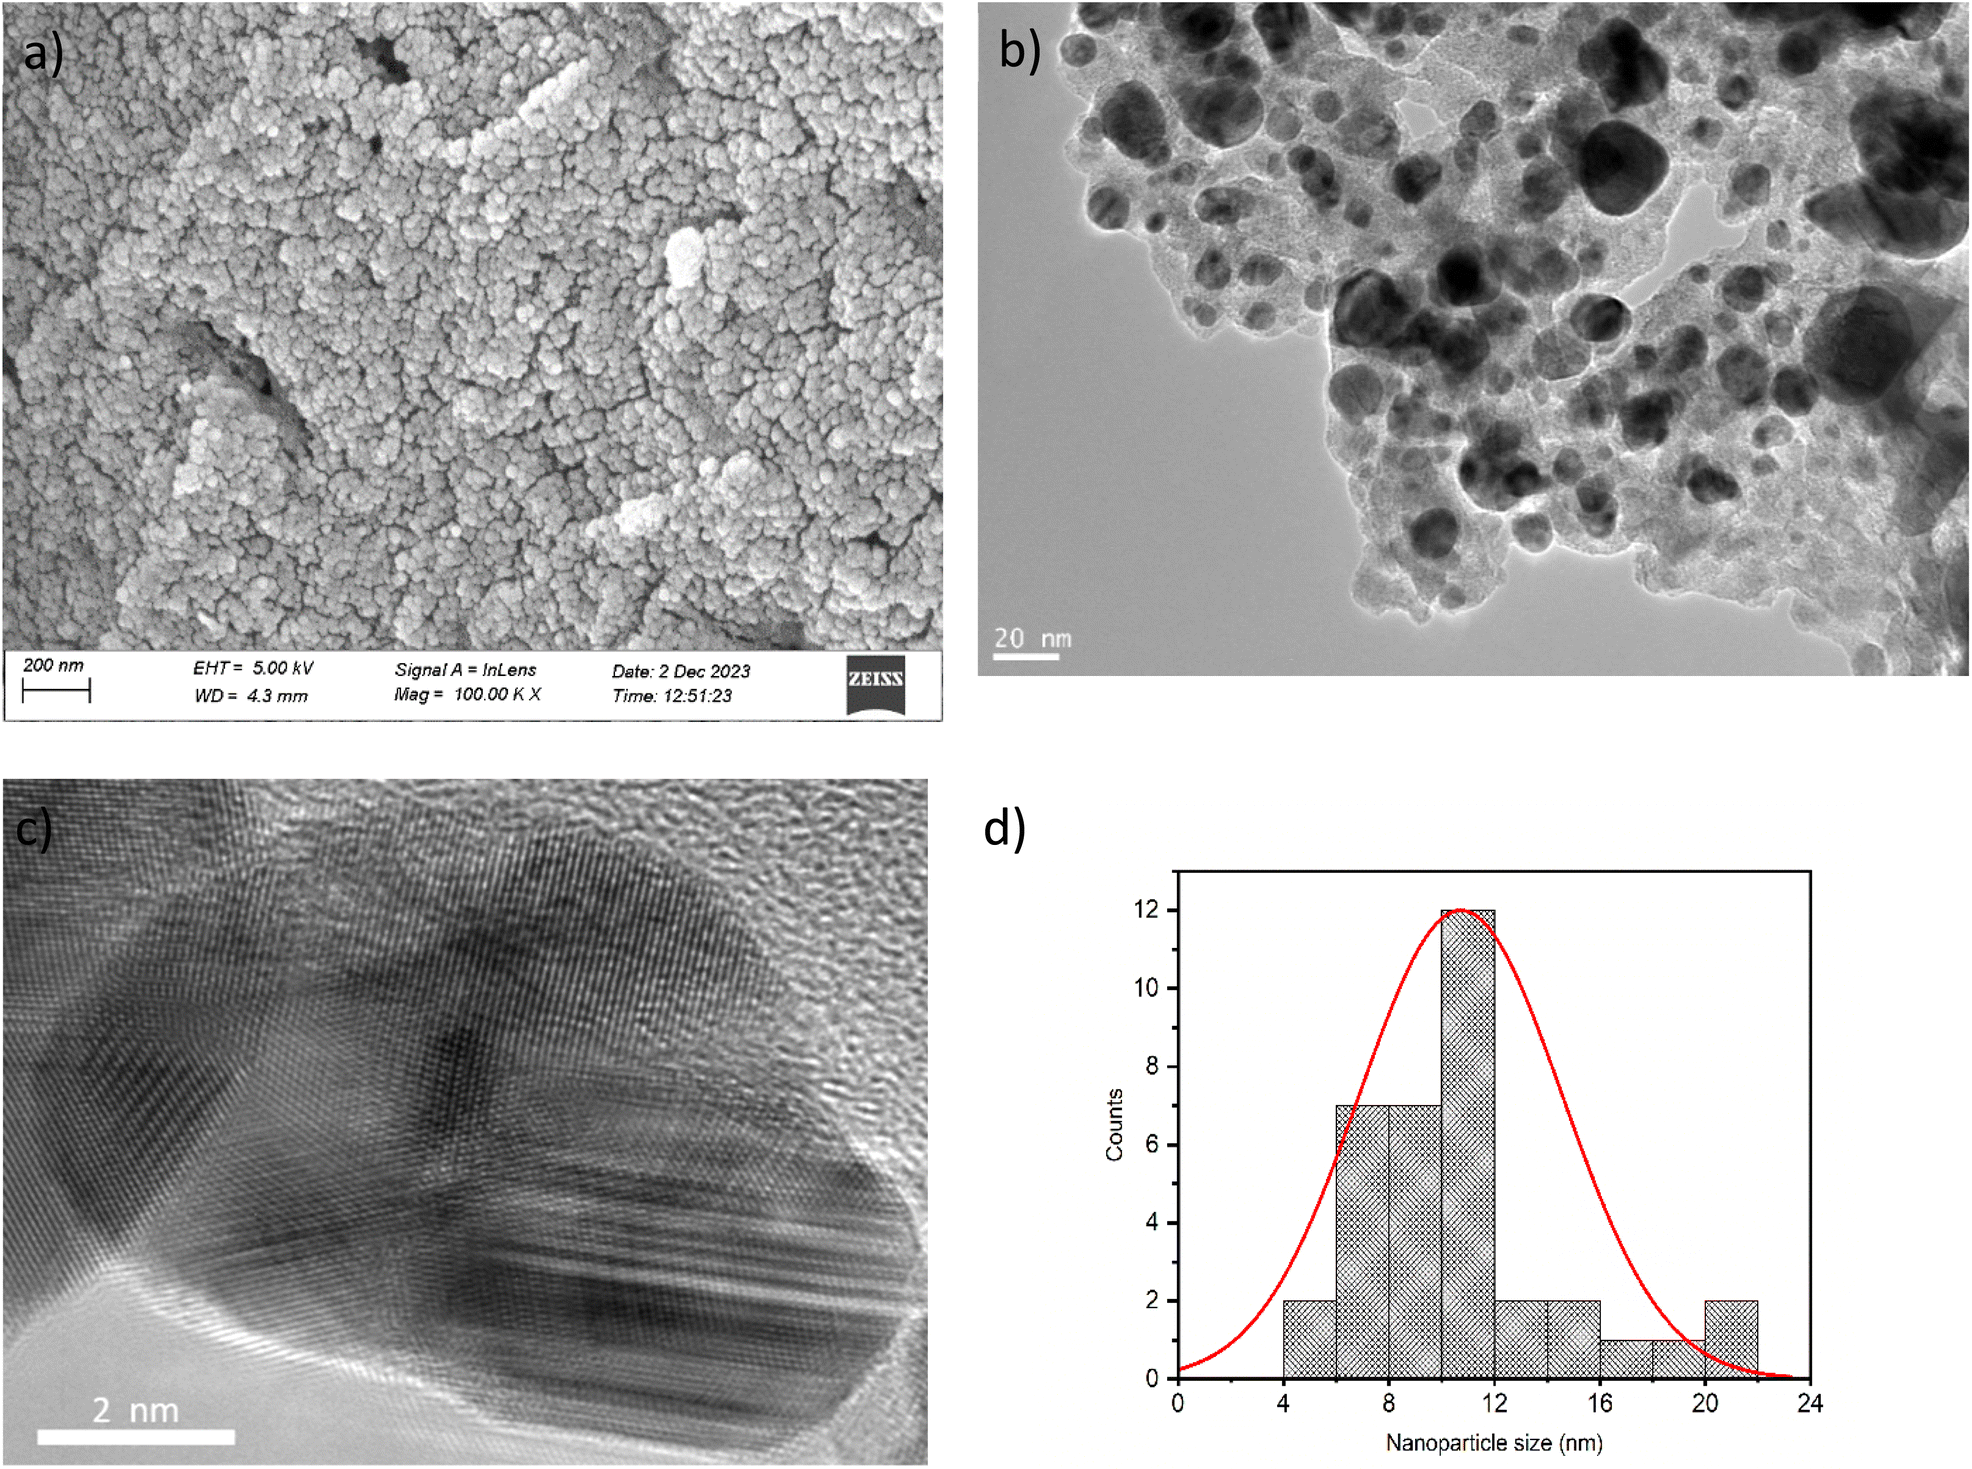 | ||
| Fig. 2 (a) SEM, (b) TEM, (c) HR-TEM images of AgNPs and (d) size distribution plot of AgNPs obtained from TEM result. | ||
The maximum weight percentage of Ag in the sample and the lowest levels of other elements indicate that phytochemicals are likely involved as capping agents. Therefore, it can be concluded from every characterization that AgNPs capped with phytochemicals are present in the fruit extract of Averrhoa bilimbi.
Proposed mechanism for Hg2+ and Ag–Hg interaction investigation
In this work, synthesized AgNPs exhibit a dark brown color with an average particle size of 11 nm and act as promising colorimetric probes to establish a visual approach for Hg2+ detection in environmental water. AgNPs-based colorimetric detection of Hg2+ ions is a practical and understandable strategic approach as it is straightforward, fast, and gives visible results (Fig. 3).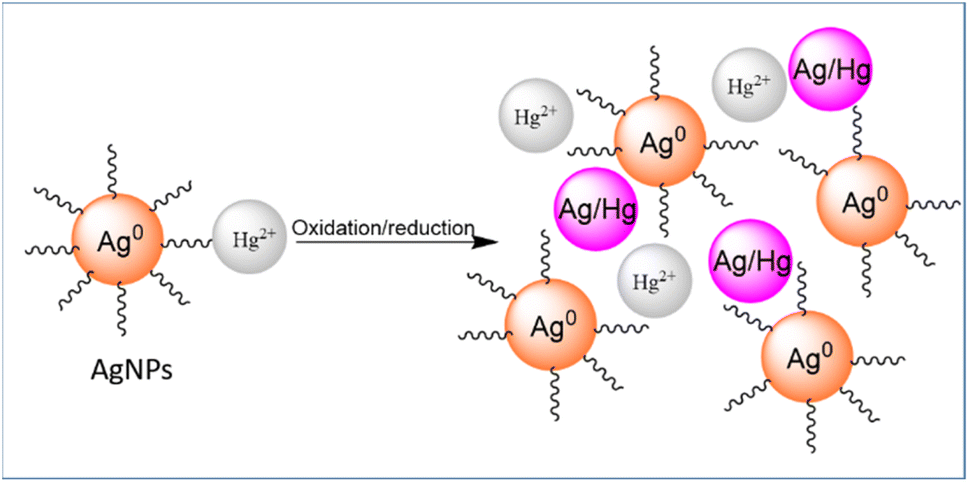 | ||
| Fig. 3 Schematic representation of Ag and Hg interaction during Hg2+ detection using AgNPs due to oxidation reduction reaction. | ||
When Hg2+ was introduced, the originally generated AgNPs underwent a significant color shift. The solution's color changed from brownish to transparent, showing that AgNPs were a unique indication of Hg2+ detection. As a result, Hg2+ ions are visible to the unaided eye, and AgNPs offer a viable colorimetric sensor for Hg2+ detection. This observation was further supported by UV-vis spectral analysis, in which the presence of Hg2+ eliminated the absorption peak at 400 nm (see Fig. 4a), a characteristic SPR peak of AgNPs. The disappearance of the SPR peak of AgNPs may be due to the interaction of AgNPs and Hg2+, where NPs' oxidation occurred.70 As previously reported, Hg2+ can interact with the capping agent stabilizers on the surface of AgNPs.71–73 Therefore, the proposed mechanism can explain the colour change from brown to colourless AgNPs-Hg+. First, the Hg2+ interacts with the capping agents bound to AgNPs. Then, Hg2+ reacts with Ag atoms and a redox reaction occurs due to the standard potential of Ag being lower than that of Hg (E0 of Ag+/Ag = 0.80 V and E0 of Hg2+/Hg = 0.85 V).74 Therefore, an Ag–Hg amalgam alloy is formed in the solution that can no longer absorb light, making the AgNPs and the solution colourless. Furthermore, AgNPs and Hg2+ ions interactions were investigated employing synchrotron radiation-induced X-ray photoelectron spectroscopy (SR-XPS) measurements (Fig. 4b). The suggested signal assignments, relative intensity values, binding energy (BE) (eV), full width at half maximum (FWHM), and core-level spectrum collection findings for C 1s, O 1s, Ag 3d, and Hg 4f are provided. C 1s, O 1s, Ag 3d, and Hg 4f core level spectra were collected on AgNPs stabilized by Averrhoa bilimbi fruit extract. The stability of AgNPs was improved by the stabilizing agent of Averrhoa bilimbi fruit extract's capping efficacy.75,76 The major element at 285.0 eV, is attributed to the C–C group. The contamination of samples always occurs in an aqueous solution and during drying in the air (286.6, 288.3, and 289.8 eV are associated with aliphatic carbon) (see ESI Fig. S3†).77
 | ||
| Fig. 4 Absorption spectra showing (a) SPR bands of AgNPs and AgNPs-Hg2+. Inset image showing colorimetric picture AgNPs (brown colour solution) and AgNPs-Hg2+ (colourless). (b) SR-XPS survey spectra of AgNPs-Hg. (c) XPS Ag 3d core level spectra (d) XPS Hg 4f spectra. | ||
O 1s spectra also reveal the presence of four different kinds of oxygen atoms with increasing BE. Along with the CO contaminants at 531.99 eV, C–O groups contaminants at 533.04 eV, and physisorbed water, a small contribution at about 534.6 eV BE.75 After interaction with Hg2+ ions, the C 1s, and O 1s curve-fitting results confirm the stability of the Averrhoa bilimbi fruit extract on the surface of AgNPs Ag 3d spectra are asymmetric at high BE, which is a characteristic of capped NPs, indicating that the NPs are composed of at least two distinct types of Ag atoms.77,78 The smallest signal at a higher BE is often linked to positively charged silver atoms at the NPs surface interacting with the capping molecule. The spin–orbit pair at lower BE (Ag 3d5/2 = 368.09 eV BE) is ascribed to metallic silver atoms of the nanoparticle core (Fig. 4c).75,77,78 The presence of Hg2+ was detected in both samples, and the interaction between mercury and AgNP-capping molecule was measured at the Hg4f core level. The spectra of Hg 4f are shown in Fig. 4d. Notably, two distinct pairings of spin–orbit components result from the asymmetry of the Hg4f spectra in each sample. The primary element (Hg 4f7/2 BE = 99.9 eV) is consistent with Hg0 atoms, as in amalgams; for example, Hg2+ ions in oxides or coordination compounds are responsible for the lesser intensity signal (about 10% of the total Hg 4f signal) at a higher BE (around 101 eV).78–80 This behaviour is expected for Hg2+ ions interacting with silver nanoparticles; in fact, Hg2+ ions tend to react with silver atoms at the NPs surface, giving rise to Ag–Hg alloys.78,79 even though other heavy metals, like Ni(II) and Co(II), interact with silver nanoparticles by coordinating them through the ligands, giving rise to complex agglomerates with different shapes induced by the metals. It has been proposed that this kind of interaction may result in smaller AgNPs or core–shell nanoparticles with a metallic silver core encircled by an Ag–Hg alloy shell.79
Selectivity of the detection system for Hg2+
The selectivity is one important element that has to be examined. Therefore, to assess the selectivity of the detection system for Hg2+ under optimal experimental conditions, the sensor responses to Hg2+ were compared with those of 14 other metal ions, such as Zn2+, Pb2+, Ni2+, Na+, Mn2+, K+, Fe3+, Fe2+, Cu2+, Cr3+, Co2+, Cd2+, Ca2+, Ba2+. The analytical performance of AgNPs as a colorimetric probe was investigated with those metal ions, and the result showed that only Hg2+ ions could change the colors of AgNPs solution from brown to colorless (see ESI S4†). By measuring SPR absorbance, the reactions of AgNPs with different metal ions were investigated independently. The distinctive peak of AgNPs is located at 400 nm, as shown in Fig. 5a, and a detailed comparison of the SPR of AgNPs with all samples was conducted. The majority of the 50 μM cations combined with equal AgNPs individually had a little change in absorbance intensity. Still, the peak position remained constant, indicating that the AgNPs condition was unaffected. However, AgNPs SPR seemed to alter upon exposure to Hg2+, and in sharp contrast to other ions, their absorbance completely disappeared.81 The colorimetric response and the absorbance intensity of AgNPs with all other ions both intuitively showed a strong contrast to the Hg2+ sample, suggesting significant Hg2+ aggregation.74 These data indicated that the AgNPs colorimetric probe provided specificity for Hg2+ detection. | ||
| Fig. 5 (a) UV-vis absorption spectra of AgNPs solutions incubated with Hg2+ and other 14 metal ions at the same concentration (50 μM) (b) UV-vis absorption spectra AgNPs solution adding various concentrations of Hg2+ ions in the range 0 to 200 μM. The inset image showed the linear relationship between the absorbance ratios (A/A0) versus Hg2+ ion concentration. | ||
Anti-interference of the detection system for Hg2+
Optical AgNPs sensors demonstrated both a strong anti-interference to other ions and a high selectivity for detecting Hg2+ following the various criteria of practical detection. As a result, experiments were conducted to determine if other ions may interfere with detecting Hg2+ Fig. S5† displays the colorimetric image of the AgNPs solution including Hg2+ and other ions. It was found that when Hg2+ was present with other ions, the colors of the AgNPs solutions changed from brown to colorless.72 However, AgNPs solution color does not change with other ions. Fig. S5† shows the UV-vis absorbance of AgNPs in the presence of Hg2+ and interfering ions, which distinctly disappeared. Furthermore, the UV-vis absorbance ratios of AgNPs with Hg2+ and other interfering ions showed that AgNPs solution with Hg2+ had more excellent absorbance ratios than other ions. In addition, AgNPs can be recognized even in the presence of 14 different ions (see ESI Fig. S6†).82 The results demonstrate that the AgNPs colorimetric sensor held good anti-interference performance for the detection of Hg2+.Sensitivity of the detection system for Hg2+
To assess the sensitivity of AgNPs toward Hg2+ ions, a series of solutions with varying Hg2+ concentrations were added to the AgNPs solutions under optimal experimental conditions. Then, the absorbance of the solutions was recorded. The SPR absorbance spectra of AgNPs at various Hg2+ concentrations are displayed in Fig. 5b. The SPR peak of AgNPs drastically reduced when the quantity of Hg2+ increased from 0 to 200 μM. The associated image is shown in ESI Fig. S7† that when the concentration of Hg2+ increased, the color of the AgNPs changed from brown to colorless. This observation illustrated the concentration-dependent colorimetric behaviour of AgNPs and confirmed the SPR spectra. AgNPs can be utilized as a colorimetric probe for quantitative detection of Hg2+ because of the strong relationship between the absorbance ratio and the Hg2+ concentration. A strong linear association (R2 = 0.9965) was found between the absorbance change ratio at 400 nm (A0/A) and Hg2+ concentrations (0–50 μmol L−1). According to 3σ/k, where σ is the standard deviation of the blank specimens and k represents the slope of the linear fitting curve.74 The limit of detection (LOD) of AgNPs colorimetric probe toward Hg2+ ions was 1.58 μM within the concentration range of 0.1 μM to 50 μM. The colorimetric probe was also used in the Hg2+ quantification. The limit of quantification (LOQ) was found to be 5.27 μM.Detection of Hg2+ in real water sample
First, the feasibility and environmental tolerance of AgNPs colorimetric probes were assessed. The absorbance ratio (A/A0) of AgNPs demonstrates remarkable stability on a large scale, with minimal fluctuation. Next, the detection performance of AgNPs toward Hg2+ in water samples was investigated. The standard addition method was employed to calculate the concentration and recovery percentages of Hg2+ using known concentrations (20, 30, 40, and 50 μM) of Hg2+ and other pertinent ions.82 Commercial drinking water was used to obtain the real water samples. AgNPs SPR absorbance in drinking water with all metal ions dropped noticeably. AgNPs strong anti-interference capacity for Hg2+ detection is demonstrated by their proven specificity for Hg2+ drinking water. The probe's relative standard deviation (RSD) was 1.21–2.93%, and recovery rate ranged from 90.60 ± 2.60 to 96.73 ± 2.83%, as shown in Table 1. These findings support the appropriateness of the probe for Hg2+ detection.| Water sample | Hg2+ added (μM) | Hg2+ found (μM) | % recovery ± SD | RSD (%) |
|---|---|---|---|---|
| Commercial drinking water | 20 | 18.12 ± 0.52 | 90.60 ± 2.60 | 2.87 |
| 30 | 29.02 ± 0.85 | 96.73 ± 2.83 | 2.93 | |
| 40 | 38.52 ± 0.47 | 96.30 ± 1.17 | 1.21 | |
| 50 | 48.21 ± 1.19 | 96.42 ± 2.38 | 2.46 |
H2O2 detection
AgNPs-based colorimetric detection is a clear and realistic strategic approach as it is straightforward to apply, gives results quickly, and is visible to the naked eye. Therefore, the synthesized AgNPs probe was used for the colorimetric visual detection of H2O2 in water. Adding the H2O2 into the AgNPs solution caused visual color changes from brownish to transparent, indicating AgNPs acted as a unique probe for H2O2 detection. This observation was further validated by UV-vis spectra analysis, in which the presence of H2O2 eliminated the SPR absorption peak at 400 nm (see Fig. 6a) of AgNPs due to the interaction of AgNPs and H2O2.83 A catalytic redox reaction between H2O2 and AgNPs may have occurred through the phytochemical capping layer around the NPs. When H2O2 was added to the reaction mixture, a reactive radical was produced that initiated the breakdown of AgNPs. In the presence of H2O2, the following oxidation process of AgNPs occurred: Ag0 + H2O2 → Ag+ + 2HO−.84 The concentration of AgNPs was diminished as H2O2 concentration increased through oxidation from Ag0 to Ag+. As a result, the intensity of the SPR band of AgNPs was reduced, suggesting that AgNPs were likely involved in the breakdown process of H2O2.83,85,86 | ||
| Fig. 6 (a) Absorption spectra showing (a) SPR bands of AgNPs and after addition of H2O2 solution; inside showing the colorimetric image. (b) UV-vis absorption spectra AgNPs solution adding various concentrations of H2O2 ions in the range o to 250 μM. The inset image showed the linear relationship between the absorbance ratios (A/A0) versus H2O2 ion concentration. | ||
Furthermore, the sensitivity of the AgNPs probe was investigated for the detection of H2O2. The AgNP solution was mixed with a series of H2O2 solutions at varying concentrations, and the mixture was incubated for 30 minutes at room temperature. Fig. 6b shows how the SPR band of AgNPs decreases with increasing H2O2 concentration. In the control AgNPs solution, the 400 nm SPR peak gradually decreased and reached a saturation value at 250 μM H2O2. A good linear relationship (R2 = 0.9967) was observed between the absorbance ratio (A/A0) and the concentration of H2O2 ranging from 0 μM to 100 μM. The LOD and LOQ of AgNPs colorimetric probe toward H2O2 was found to be 3.21 μM and 10.70 μM, respectively, within the concentration range from 0 μM to 100 μM.
Experimental
Materials and reagents
Silver nitrate (AgNO3) (ACS reagent, ≥99.0%), mercury(II) chloride (HgCl2) (ACS reagent, ≥99.0%) were purchased from Merck India, zinc chloride (ZnCl2) (≥98%), lead(II) chloride (PbCl2) (≥98%), nickel chloride hexahydrate (NiCl2·6H2O), sodium chloride (NaCl) (≥99.5%), manganese(II) chloride tetrahydrate (MnCl2·4H2O) (≥97%), potassium chloride (KCl) (≥99.5%), ferrous (II) chloride (FeCl2) (≥98%), ferric (III) chloride (FeCl3) (≥99%), cupric chloride dihydrate(II) chloride (CuCl2·2H2O) (≥99%), chromium(III) chloride hexahydrate (III) (CrCl3·6H2O) (≥93%), cobalt(II) chloride hexahydrate (CoCl2·6H2O) (≥98%), cadmium(II)chloride monohydrate (CdCl2·H2O) (≥99%), calcium(II) chloride dihydrate (CaCl2·2H2O) (≥99%), barium(II) chloride dihydrate (BaCl2·2H2O) (≥99%), sodium hydroxide (NaOH) (≥97%) were obtained from LOBA Chemicals, India. Analytical-grade chemical reagents were all utilized without further purification. Deionized water was used throughout the study.Measurements
The resulting Averrhoa bilimbi fruit extract capped AgNPs solution was analyzed by UV-vis absorption spectrophotometer (Model: UV-1900I, SHIMADZU, Japan) in the range of 200–800 nm. FT-IR spectra were collected at 25 °C using an IRSpirit Fourier transform infrared spectrophotometer manufactured by SHIMADZU (Tokyo, Japan) using a KBr pellet at a scan rate of about four cm−1 s−1. The XRD analysis was conducted with a Rigaku SmartLab spectrometer and Cu-Kα radiation. The Scherrer equation and the XRD pattern may be used to calculate the average crystallite size of AgNPs using eqn (1).
 | (1) |
A SHIMADZU (Tokyo, Japan) TGA-50 was used for TGA, heated at a rate of 10 °C min−1 under N2. SEM measurements and EDX analysis were conducted on a Hitachi SU-8000 microscope at accelerating voltages of 10 and 15 kV. TEM measurements were conducted on a TEM-2100F (JEOL, Tokyo, Japan) field emission electron microscope. SR-XPS.
Preparation of fruit extract
The fresh Averrhoa bilimbi fruit was collected from Khulna, Bangladesh. The collected fruit was washed and chopped into small pieces. Averrhoa bilimbi fruit extracts used in the present study were prepared as follows. Briefly, 10 g of the chopped fruit was added into a round bottom flask containing 50 mL of ultra-pure water and heated at 80 °C for 45 minutes and the solution was left to cool down. The Averrhoa bilimbi fruit extract was then separated from the solid part and collected after filtration using filter paper. Finally, the fruit extracts were centrifuged at 10![[thin space (1/6-em)]](https://www.rsc.org/images/entities/char_2009.gif) 000 rpm, and the liquid phase was recovered and then stored in a freezer at 4 °C for further use.
000 rpm, and the liquid phase was recovered and then stored in a freezer at 4 °C for further use.
Green synthesis of AgNPs
The AgNPs were prepared according to the previously reported literature with slight modifications.65 1 mL of Averrhoa bilimbi fruit extract was added to 50 mL of an aqueous solution of 1 mM AgNO3. Then the solution mixture pH was adjusted to 10 using NaOH (0.5 M) solution. Initially, the solution mixture was colorless. The solution mixture was heated at 60 °C for about 30 minutes and its color turned brownish, indicating the formation of AgNPs. The obtained AgNPs suspension was stored at 4 °C.Visual colorimetric detection for Hg2+ ions using AgNPs probe
AgNPs were used as detection probes for the colorimetric sensing of Hg2+ at room temperature. First, 1 mL of AgNPs was added to a clear glass vial, followed by the addition of 1 mL of different concentrations of Hg2+ solution. Finally, the color change was observed in AgNPs probe with the naked eye.Selectivity studies
Stock solutions of different metal ions (Zn2+, Pb2+, Ni2+, Na+, Mn2+, K+, Fe3+, Fe2+, Cu2+, Cr3+, Co2+, Cd2+, Ca2+, Ba2+, and Hg2+) with a concentration of 1.0 mM were prepared by using the corresponding salts in a vial. AgNPs solution added individually with different metal ions (Zn2+, Pb2+, Ni2+, Na+, Mn2+, K+, Fe3+, Fe2+, Cu2+, Cr3+, Co2+, Cd2+, Ca2+, Ba2+, and Hg2+) and the absorption spectra were recorded using a UV-vis spectrophotometer.Anti-interference studies
AgNPs probe demonstrated a strong anti-interference to other ions and a high selectivity for the detection of Hg2+ ions. Therefore, Hg2+ ion detection was conducted in the presence of various metal ions. AgNPs solution was added individually with each metal ion along with the Hg2+ ion equivalently, and the absorbance spectra were recorded using a UV-vis spectrophotometer. Also, absorbance spectra were recorded by adding all metal ions including Hg2+ ions, equivalently in AgNPs probe.Sensitivity studies
To evaluate the sensitivity of the Hg2+ assay process, a series of solutions with varying Hg2+ concentrations from 0 to 200 μM were added to the AgNPs solutions under optimal experimental conditions successively, and the absorbance was recorded successively.Detection of Hg2+ in real water sample
To calculate the concentration of Hg2+ and the recovery percentages, the real water sample, commercial drinking water was spiked with 20, 30, 40, and 50 μM of Hg2+ solution. The standard addition method used known spiked samples of 20, 30, 40, and 50 μM of Hg2+ solution. The detection process was conducted to develop a standard curve for estimating Hg2+ ions in unknown samples.Colorimetric sensors for H2O2
H2O2 colorimetric detection was investigated using a synthesized AgNPs probe for visual detection in water using the naked eye at room temperature. First, 1 mL of AgNPs was added to a clear glass vial, followed by the addition of 1 mL of different concentrations of H2O2 solution, and the observed color change of the solution mixture was with the naked eye.The sensitivity of the AgNPs probe for H2O2 detection was conducted by adding a series of solutions with varying concentrations of H2O2 solution from 0 to 250 μM to the AgNPs solutions under optimal experimental conditions, and the absorbance was recorded successively.
Conclusions
In this study, the AgNPs colorimetric probe was successfully synthesized using green approaches and employed to detect Hg2+ and H2O2. The fabricated probe quickly and preciously sensed Hg2+ and H2O2 by changing colour from brownish to colourless, which was observed with the naked eye, and the intensity of the colour change depended on the concentration of Hg2+ and H2O2. The LOD and LOQ of Hg2+ were determined throughout a linear range of concentration 0–50 μM, and the estimated results were 1.58 and 5.27 μM, respectively. Similarly, LOD and LOQ of H2O2 were found to be 3.21 and 10.70 μM, respectively, throughout a linear range of 0–100 μM. The AgNPs probe preferentially detected Hg2+ by competing with Zn2+, Pb2+, Ni2+, Na+, Mn2+, K+, Fe3+, Fe2+, Cu2+, Cr3+, Co2+, Cd2+, Ca2+, Ba2+ ions. The presence of Hg2+ was easily quantified with the probe in real water samples, and the results were acceptable. More importantly, SR-XPS analysis confirmed the interactions between AgNPs and Hg2+ ions and demonstrated the partial reduction of Hg2+ ions to metallic Hg0 as well as the partial oxidation of Ag0 to Agδ+ and the overall stability of the capping agents in AgNPs surface. Thus, the analysis revealed a direct interaction between mercury and silver, indicating the possibility of a mixed AgNP-Ag/Hg amalgam system. Therefore, the prepared AgNPs probe could be an environmentally benign, cost-effective, and easy detector for Hg2+ and H2O2 in water samples. This investigation enhances the early detection of heavy metal contamination, such as Hg2+ ion in water, helping prevent health disabilities and reducing the risks of pathogens associated with various diseases.Data availability
The data supporting this article have been included as part of the ESI.†Author contributions
Md. Toufiqul Islam, Saurav Kumar Das, Md. Ahad Mahmud: validation formal analysis and data collection. Md. Rabiul Karim: writing – review & editing, Rumpa Kundu and Md. Abu Rayhan Khan: data analysis and methodology. Shofiur Rahman: writing – review & editing, writing original draft, funding acquisition, validation, investigation, Mahmoud Al-Gawati and Abdullah N. Alodhayb, data analysis and Habib Md. Ahsan: review & editing, writing – original draft, supervision, methodology, investigation, conceptualization.Conflicts of interest
There are no conflicts to declare.Acknowledgements
The authors extend their appreciation to the King Salman Center for Disability Research for funding this work through Research Group No. KSRG-2024-448. Furthermore, we acknowledge with thanks to the Chemistry Discipline, Khulna University, Bangladesh for conducting this research.Notes and references
- N. Joudeh and D. Linke, J. Nanobiotechnol., 2022, 20, 262 CrossRef.
- Y. Khan, H. Sadia, S. Z. Ali Shah, M. N. Khan, A. A. Shah, N. Ullah, M. F. Ullah, H. Bibi, O. T. Bafakeeh, N. Ben Khedher, S. M. Eldin, B. M. Fadhl and M. I. Khan, Catalysts, 2022, 12, 1386 CrossRef CAS.
- S. N. Hawar, H. S. Al-Shmgani, Z. A. Al-Kubaisi, G. M. Sulaiman, Y. H. Dewir and J. J. Rikisahedew, J. Nanomater., 2022, 1058119 Search PubMed.
- S. S. Salem, E. N. Hammad, A. A. Mohamed and W. El-Dougdoug, Biointerface Res. Appl. Chem., 2023, 13, 41 CAS.
- Y. Yao, N. Li, X. Zhang, J. Ong'Achwa Machuki, D. Yang, Y. Yu, J. Li, D. Tang, J. Tian and F. Gao, ACS Appl. Mater. Interfaces, 2019, 11, 13991–14003 CrossRef CAS PubMed.
- I. S. Che Sulaiman, B. W. Chieng, M. J. Osman, K. K. Ong, J. I. A. Rashid, W. M. Z. Wan Yunus, S. A. M. Noor, N. A. M. Kasim, N. A. Halim and A. Mohamad, Microchim. Acta, 2020, 187, 131 CrossRef CAS PubMed.
- G. Li, L. Liu, X. Liu, J. Han, T. Hao, C. Wang, J. Sun, H. Du and X. Li, ChemNanoMat, 2023, 9, e202300203 CrossRef CAS.
- L. Zhang and L. Li, Anal. Methods, 2016, 8, 6691–6695 RSC.
- M. H. Tu, T. Sun and K. T. V. Grattan, Sens. Actuators, B, 2012, 164, 43–53 CrossRef CAS.
- K. S. Lee and M. A. El-Sayed, J. Phys. Chem. B, 2006, 110, 19220–19225 CrossRef CAS.
- J. Krajczewski, K. Kołątaj and A. Kudelski, RSC Adv., 2017, 7, 17559–17576 RSC.
- F. Gao, J. Lei and H. Ju, Anal. Chem., 2013, 85, 11788–11793 CrossRef CAS PubMed.
- M. Zannotti, S. Piras, L. Remia, D. Appignanesi and R. Giovannetti, Chemosensors, 2024, 12, 33 Search PubMed.
- Y. Wang, F. Yang and X. Yang, ACS Appl. Mater. Interfaces, 2010, 2, 339–342 CAS.
- S. D. Solomon, M. Bahadory, A. V. Jeyarajasingam, S. A. Rutkowsky, C. Boritz and L. Mulfinger, J. Chem. Educ., 2007, 84, 322–325 CAS.
- Z. Yu, C. Hu, L. Guan, W. Zhang and J. Gu, ACS Sustain. Chem. Eng., 2020, 8, 12713–12721 CAS.
- J. Duan, H. Yin, R. Wei and W. Wang, Biosens. Bioelectron., 2014, 57, 139–142 CAS.
- R. Dave, K. Pandey, S. Jain, V. Kshtriya, P. Sengupta, S. Kumar Verma, N. Gour and D. Bhatia, ChemistrySelect, 2024, 9, e202402477 CAS.
- Z. Rahman and V. P. Singh, Environ. Monit. Assess., 2019, 191, 419 Search PubMed.
- A. T. Jan, M. Azam, K. Siddiqui, A. Ali, I. Choi and Q. M. R. Haq, Int. J. Mol. Sci., 2015, 16, 29592–29630 CAS.
- L. Parida and T. N. Patel, Environ. Monit. Assess., 2023, 195, 766 CAS.
- S. S. Sonone, S. Jadhav, M. S. Sankhla and R. Kumar, Lett. Appl. NanoBioScience., 2021, 10, 2148–2166 Search PubMed.
- A. Akinleye, O. Oremade and X. Xu, PLoS One, 2024, 19, e0288190 CAS.
- Z. Yan, M. F. Yuen, L. Hu, P. Sun and C. S. Lee, RSC Adv., 2014, 4, 48373–48388 CAS.
- B. K. Bansod, T. Kumar, R. Thakur, S. Rana and I. Singh, Biosens. Bioelectron., 2017, 94, 443–455 CAS.
- L. Magos and T. W. Clarkson, Overview of the clinical toxicity of mercury, Ann. Clin. Biochem., 2006, 43, 257–268 CAS.
- E. M. Wells, J. B. Herbstman, Y. H. Lin, J. R. Hibbeln, R. U. Halden, F. R. Witter and L. R. Goldman, Environ. Res., 2017, 154, 247–252 CrossRef CAS.
- J. Aaseth, B. Hilt and G. Bjørklund, Environ. Res., 2018, 164, 65–69 CrossRef CAS.
- G. Qi, C. Fu, G. Chen, S. Xu and W. Xu, RSC Adv., 2015, 5, 49759–49764 Search PubMed.
- F. Liu, C. Ding, M. Jin and Y. Tian, Analyst, 2015, 140, 3285–3289 Search PubMed.
- J. Švehla, R. Žídek, T. Ružovič, K. Svoboda and J. Kratzer, Spectrochim. Acta, Part B, 2019, 156, 51–58 Search PubMed.
- H. Shoaee, M. Roshdi, N. Khanlarzadeh and A. Beiraghi, Spectrochim. Acta, Part A, 2012, 98, 70–75 CAS.
- F. Pena-Pereira, I. Lavilla, C. Bendicho, L. Vidal and A. Canals, Talanta, 2009, 78, 537–541 CAS.
- M. R. Mahmoudian, Y. Alias, P. Meng Woi, R. Yousefi and W. J. Basirun, Adv. Powder Technol., 2020, 31, 3372–3380 CAS.
- X. Wang, F. Liu, Q. Shao, Z. Yin, L. Wang and Z. Fu, Anal. Methods, 2017, 9, 2401–2406 CAS.
- S. Malik, J. Singh, K. Saini, V. Chaudhary, A. Umar, A. A. Ibrahim, S. Akbar and S. Baskoutas, Anal. Methods, 2024, 16, 2777–2809 CAS.
- A. Dhawale and D. R. Trivedi, ChemistrySelect, 2024, 9, e202403774 CAS.
- Y. Soda and E. Bakker, ACS Sens., 2019, 4(12), 3093–3101 CrossRef CAS.
- M. Srivastava, S. K. Srivastava, R. P. Ojha and R. Prakash, Microchem. J., 2022, 182, 107850 CrossRef CAS.
- K. N. Han, J. S. Choi and J. Kwon, Sci. Rep., 2017, 7, 2806 CrossRef PubMed.
- X. Chen, Y. Sun, X. Mo, Q. Gao, Y. Deng, M. Hu, J. Zou, J. Nie and Y. Zhang, RSC Adv., 2021, 11, 36859–36865 RSC.
- J. R. Stone and S. Yang, Antioxid. Redox Signaling, 2006, 8, 243–270 CrossRef CAS.
- S. DiMauro and E. A. Schon, Annu. Rev. Neurosci., 2008, 31, 91–123 CrossRef CAS PubMed.
- R. Buffenstein, Y. H. Edrey, T. Yang and J. Mele, Age, 2008, 30, 99–109 CrossRef CAS PubMed.
- D. J. Rossi, C. H. M. Jamieson and I. L. Weissman, Cell, 2008, 132(4), 681–696 CrossRef CAS.
- N. Jia, B. Huang, L. Chen, L. Tan and S. Yao, Sens. Actuators, B, 2014, 195, 165–170 Search PubMed.
- S. Yang, A. Verdaguer-Casadevall, L. Arnarson, L. Silvioli, V. Čolić, R. Frydendal, J. Rossmeisl, I. Chorkendorff and I. E. L. Stephens, ACS Catal., 2018, 8(5), 4064–4081 Search PubMed.
- R. Ciriminna, L. Albanese, F. Meneguzzo and M. Pagliaro, ChemSusChem, 2016, 9, 3374–3381 Search PubMed.
- F. B. Şen, M. Bener, B. Bekdeşer and R. Apak, Spectrochim. Acta, Part A, 2021, 248, 119266 Search PubMed.
- D. Ghafoor, Z. Khan, A. Khan, D. Ualiyeva and N. Zaman, Curr. Res. Toxicol., 2021, 2, 159–168 Search PubMed.
- N. Lu, M. Zhang, L. Ding, J. Zheng, C. Zeng, Y. Wen, G. Liu, A. Aldalbahi, J. Shi, S. Song, X. Zuo and L. Wang, Nanoscale, 2017, 9, 4508–4515 CAS.
- X. Chen, X. Chen, B. Su, Z. Cai and M. Oyama, Sens. Actuators, B, 2014, 201, 286–292 CAS.
- M. Lan, Y. Di, X. Zhu, T. W. Ng, J. Xia, W. Liu, X. Meng, P. Wang, C. S. Lee and W. Zhang, Chem. Commun., 2015, 51, 15574–15577 Search PubMed.
- Z. Bai, W. Dong, Y. Ren, C. Zhang and Q. Chen, Langmuir, 2018, 34, 2235–2244 CAS.
- J. S. Lee, A. K. R. Lytton-Jean, S. J. Hurst and C. A. Mirkin, Nano Lett., 2007, 7, 2112–2115 CrossRef CAS PubMed.
- M. T. Yassin, F. O. Al-Otibi, A. A. F. Mostafa and A. A. Al-Askar, Crystals, 2022, 12, 603 CrossRef CAS.
- B. Kumar, K. Smita, L. Cumbal and A. Debut, Asian Pac. J. Trop. Biomed., 2015, 5(3), 192–195 CrossRef CAS.
- P. Saha, M. Mahiuddin, A. B. M. N. Islam and B. Ochiai, ACS Omega, 2021, 6, 18260–18268 CrossRef CAS.
- M. Mahiuddin, P. Saha and B. Ochiai, Nanomaterials, 2020, 10, 1–15 CrossRef PubMed.
- M. Sathishkumar, K. Sneha, S. W. Won, C. W. Cho, S. Kim and Y. S. Yun, Colloids Surf., B, 2009, 73, 332–338 CrossRef CAS PubMed.
- M. M. H. Khalil, E. H. Ismail, K. Z. El-Baghdady and D. Mohamed, Arabian J. Chem., 2014, 7, 1131–1139 CrossRef CAS.
- S. Dhanya, K. N. Jayaprabha and S. J. Anupama, J. Propuls. Technol., 2023, 44, 2014–2020 Search PubMed.
- K. Jayawardane, H. Hettiarachchi and K. Gunathilake, J. Med. Plants Stud., 2022, 10, 05–12 CrossRef.
- S. Sagadevan, S. Vennila, P. Singh, J. A. Lett, M. R. Johan, A. R. Marlinda, B. Muthiah and M. Lakshmipathy, Green Process. Synth., 2019, 8, 873–884 CAS.
- R. S. R. Isaac, G. Sakthivel and C. Murthy, J. Nanotechnol., 2013, 906592 Search PubMed.
- L. V. Hublikar, S. V. Ganachari and V. B. Patil, Nanoscale Adv., 2023, 5, 4149–4157 RSC.
- V. D. Mendhulkar, S. N. Kharat and S. R. Mahadik, Pharma Chem., 2018, 10, 24–33 CAS.
- D. Widiastuti, S. Elisahbet Sinaga, S. Warnasih, Y. Syahputri, N. Bella Saputri and W. Eka Putra, Indones. J. Pharm., 2024, 35, 282–291 Search PubMed.
- S. Sampaio and J. C. Viana, Adv. Nat. Sci.:Nanosci. Nanotechnol., 2018, 9, 045002 CAS.
- E. Murugan, S. Santhoshkumar, S. Govindaraju and M. Palanichamy, Spectrochim. Acta, Part A, 2021, 5(246), 119036 CrossRef.
- L. Chen, N. Qi, X. Wang, L. Chan, H. You and J. Li, RSC Adv., 2014, 4, 15055–15060 RSC.
- S. Y. Sharaf Zeebaree, O. I. Haji, A. Y. S. Zeebaree, D. A. Hussein and E. H. Hanna, Catalysts, 2022, 12, 1464 CrossRef CAS.
- W. Ren, C. Zhu and E. Wang, Nanoscale, 2012, 4, 5902–5909 RSC.
- C. Talodthaisong, P. Sangiamkittikul, P. Chongwichai, A. Saenchoopa, S. Thammawithan, R. Patramanon, S. Kosolwattana and S. Kulchat, ACS Omega, 2023, 8, 41134–41144 CrossRef CAS PubMed.
- I. Schiesaro, L. Burratti, C. Meneghini, I. Fratoddi, P. Prosposito, J. Lim, C. Scheu, I. Venditti, G. Iucci and C. Battocchio, J. Phys. Chem. C, 2020, 124, 25975–25983 CrossRef CAS.
- L. Burratti, F. Bertelà, M. Sisani, I. Di Guida, C. Battocchio, G. Iucci, P. Prosposito and I. Venditti, Polymers, 2024, 16, 1034 CrossRef CAS PubMed.
- P. Prosposito, L. Burratti, A. Bellingeri, G. Protano, C. Faleri, I. Corsi, C. Battocchio, G. Iucci, L. Tortora, V. Secchi, S. Franchi and I. Venditti, Nanomaterials, 2019, 9, 1353 CrossRef CAS PubMed.
- F. Mochi, L. Burratti, I. Fratoddi, I. Venditti, C. Battocchio, L. Carlini, G. Iucci, M. Casalboni, F. De Matteis, S. Casciardi, S. Nappini, I. Pis and P. Prosposito, Nanomaterials, 2018, 8, 488 CrossRef PubMed.
- S. Manivannan, Y. Seo, D. K. Kang and K. Kim, New J. Chem., 2018, 42, 20007–20014 RSC.
- I. Schiesaro, C. Battocchio, I. Venditti, P. Prosposito, L. Burratti, P. Centomo and C. Meneghini, Phys. E, 2020, 123, 114162 CrossRef CAS.
- V. Kumar, D. K. Singh, S. Mohan, D. Bano, R. K. Gundampati and S. H. Hasan, J. Photochem. Photobiol., B, 2017, 168, 67–77 CAS.
- Y. Zou, J. Pang, F. Zhang and F. Chai, ChemistrySelect, 2021, 6, 6077–6082 CAS.
- L. Zhang and L. Li, Anal. Methods, 2016, 8, 6691–6695 CAS.
- N. D. Nguyen, T. Van Nguyen, A. D. Chu, H. V. Tran, L. T. Tran and C. D. Huynh, Arabian J. Chem., 2018, 11, 1134–1143 CAS.
- K. R. Aadil, A. Barapatre, A. S. Meena and H. Jha, Int. J. Biol. Macromol., 2016, 82, 39–47 CAS.
- M. S. Mehata and S. Biswas, Ceram. Int., 2021, 47, 19063–19072 CrossRef CAS.
Footnote |
| † Electronic supplementary information (ESI) available. See DOI: https://doi.org/10.1039/d5ra01733e |
| This journal is © The Royal Society of Chemistry 2025 |