
 Open Access Article
 This Open Access Article is licensed under a Creative Commons Attribution-Non Commercial 3.0 Unported Licence
Luminescent porous silicon decorated with iron oxide nanoparticles synthesized by pulsed laser ablation†
Alessia Sambugaro a,
Guilherme C. Concasb,
Mariana Gisbertb,
Tahirb,
Geronimo Perezc,
Bruno G. da Silvad,
Rubem L. Sommerd,
Andre L. Rossid,
Jefferson F. D. F. Araujob,
Anna Safonovaa,
Francesco Enrichia,
Tommaso Del Rossob and
Nicola Daldosso*a
a,
Guilherme C. Concasb,
Mariana Gisbertb,
Tahirb,
Geronimo Perezc,
Bruno G. da Silvad,
Rubem L. Sommerd,
Andre L. Rossid,
Jefferson F. D. F. Araujob,
Anna Safonovaa,
Francesco Enrichia,
Tommaso Del Rossob and
Nicola Daldosso*a
aDepartment of Engineering for Innovation Medicine, University of Verona, Strada le Grazie 15, 37134 Verona, Italy. E-mail: nicola.daldosso@univr.it; alessia.sambugaro@univr.it; francesco.enrichi@univr.it; anna.safonova@univr.it
bDepartment of Physics, Pontifical Catholic University of Rio de Janeiro, Rua Marques de São Vicente 225, 22451-900, Rio de Janeiro, Brazil. E-mail: tahirjanqau@gmail.com; guilherme_concas@aluno.puc-rio.br; mariana@aluno.puc-rio.br; jferraz@puc-rio.br; tommaso@puc-rio.br
cDepartment of Mechanical Engineering, Universidade Federal Fluminense, Rua Passo da Pátria, 156, 24210-240 São Domingos, Niterói, Brazil. E-mail: geronimoperez@id.uff.br
dCentro Brasileiro de Pesquisas Físicas, 22290-180 Rio de Janeiro, RJ, Brazil. E-mail: brosiv@gmail.com; sommer@cbpf.br; andrelinharesrossi@gmail.com
First published on 5th June 2025
Abstract
Nanomaterials are playing an increasingly prominent role in recent biomedical applications, particularly due to their promising potential to combine diagnostic and therapeutic functions within a single multifunctional carrier. In this context, intrinsically luminescent silicon nanostructures offer a compelling alternative to conventional fluorophores. Their integration with magnetic nanoparticles could pave the way for the development of a traceable, multimodal platform in the field of nanomedicine. With this objective, we investigated the decoration/infiltration of light-emitting porous silicon (pSi) with iron oxide nanoparticles (FeOxNPs) synthesized by pulsed laser ablation at two different liquid–gas interfaces: water–air (FeOxNPs–Air), and water–argon (FeOxNPs–Ar). This kind of polydispersed NPs are well-suited to filling the wide pore size range of the porous network. Moreover, their intrinsic positive surface charge enables straightforward and direct interaction with negatively charged carboxyl-functionalized porous silicon, without requiring additional surface modifications, chemical agents, or time-consuming intermediate processing steps such as the thermal oxidation or dehydration procedures reported in previous studies. The effectiveness of this simple infiltration/decoration approach—achieved through basic chemical mixing in a standard container—was successfully demonstrated by electron microscopies, Z-potential, optical, and magnetization experiments, which indicate a ferromagnetic behavior of the porous Si FeOx nanocomposites (pSi + FeOx NCs). The optical emission properties of the pSi + FeOx NCs were maintained with respect to the bare ones, although slightly less intense and blue-shifted (about 15 nm), in agreement with the change of radiative lifetime from about 30 μs to 20 μs. Magnetic measurements reveal that pSi + FeOx NCs obtained using FeOxNPs synthesized at the air–water interface exhibit a weaker, noisier signal with ∼80 Oe coercivity and lower remanence. Conversely, those produced at the argon–water interface show a stronger magnetic response, with ∼170 Oe coercivity and higher remanence. Notably, the magnetic properties of the Ar-synthesized sample remained stable for months without affecting its intrinsic photoluminescence, offering a stable micro–nano optical and magnetic system for theranostics applications.
1. Introduction
Magnetic nanoparticles have been extensively studied for diagnostic purposes due to their unique properties, particularly their applicability in magnetic resonance imaging (MRI). Additionally, their ability to be guided by an external magnetic field makes them promising candidates for drug delivery systems and cell tracking.1,2 Furthermore, their ability to be heated following the action of an oscillating magnetic field can be exploited for anticancer photodynamic and magnetic hyperthermia therapies. In addition, they are biocompatible with low-cost manufacturing.3 Among all, iron oxide nanoparticles (FeOxNPs) have gained attention over the years in the magnetic-diagnostic field because of their paramagnetic nature combined to the easy fabrication methods and their low toxicity. Indeed, several formulations have already been approved by the Food and Drug Administration (FDA) for clinics.4,5FeOxNPs can be produced by physical methods such as Pulsed Laser Ablation in Liquids,6 ball milling,7 and gas-phase deposition,8 chemical approaches such as co-precipitation,9 hydrothermal synthesis,10 and micro-emulsions,11 or even by biological synthesis with the use of plants12 or bacteria.13 Depending on the choice of method, they will have different properties such as size, shape, stability, structure, and magnetic features that will then decide their future field of application.4 Even though successful preparation methods are available, magnetic NPs are not yet extensively employed because of their instability in various environment, hydrophobic insolubility, and toxicity.14,15 Therefore, they are commonly administered after proper surface modifications and/or coatings with organic and inorganic materials.16,17 The transport of FeOxNPs through an appropriate carrier can exert several benefits for both the vector and the payload: the issues related to surface modification of the loaded magnetic NPs are solved, while the addition of magnetic features to the carrier enables its application as a comprehensive tool in diagnostics, e.g. by combining optical and magnetic properties. In this regard, porous silicon (pSi), thanks to its intrinsic visible photoluminescence combined with its large and tunable porosity, biocompatibility, biodegradability, and the possibility of easy and “tunable” surface functionalization,18 stands as a suitable platform to be improved with magnetic features by decoration of FeOx nanoparticles.
Porous silicon is produced from crystalline silicon by electrochemical etching and a successive hydroxylation procedure leading to pSi microparticles with a negatively charged surface terminated with carboxyl-groups, with photoluminescence (PL) in the orange-red portion of the visible spectrum and with variable pores according with the etching parameters.19–22
Some successful studies about the coupling of pSi and iron oxide nanoparticles have been already reported: Gu et al. trapped magnetite NPs in the porous structure of the silicon-derived nanoparticles by means of a thermal oxidation/dehydration procedure followed by the loading of the anticancer drug doxorubicin.23 Serda et al. managed to entrap a large amount of super paramagnetic iron oxide nanoparticles (SPIONs) inside the protective nanopores of discoidal pSi microparticles and discovered that not only the relaxation times became shorter, depending on the iron oxide NPs concentration, but also the delivery to target sites was facilitated.24 In another case, pSi nanorods were successfully coated with SPIONs for magnetic guidance and decorated with a peptide to enable targeting and improve their internalization by the cancer cells.25
To overcome the issues related to the administration of bare magnetic nanoparticles we previously assessed a protocol to infiltrate commercial SPIONs, which presented a natural negative surface charge, within the pores of pSi bearing negatively charged –COOH groups on the surface.26,27 Once properly treated and positively charged, FeOxNPs could easily enter the pores (about 20 nm in size) because of their small dimension (about 6 nm) and attached to the porous silicon surface by electrostatic interaction. By electron microscopy analysis, we proved that the magnetic nanospheres attached to the pSi surface, whereas no attachment was observed in the case of non-porous functionalized surfaces (i.e., the small crystalline silicon portion). The main drawback of that approach is related to the intrinsic negative surface charge of the NPs and the chemical protocol used to get them positively charged, based on their functionalization with cyclohexane diamine molecules.
In the present work, we investigate for the first time the use of iron oxide nanoparticles produced by PLAL to add magnetic features to the light emitting pSi.
PLAL is a quite versatile synthesis technique, which allows the production of dielectric,28 metal, or metal-oxide nanoparticles,29 and nanocomposites30 by the interaction of high fluence laser pulses with the surface of a proper target immersed in water, hence avoiding the necessity of specific and often time-consuming chemical protocols.31–35 In the case of iron oxide NPs produced by PLAL in water, several experimental parameters affects the dimension of the resulting colloidal nanomaterial, such the pulse length, wavelength and fluence.31,35–37
Independently on the experimental parameters, a common feature of the iron oxide NPs produced by PLAL in water is the coexistence of different oxidation and magnetic phases of the products. Magnetite is the major part (i.e., ∼75%) of them, which present a positively charged NPs surface and a large polydispersity, if compared to the colloidal systems synthesized by chemical wet methods.31,38–41
In this study, we investigate the decoration of porous silicon (pSi) with two sets of iron oxide nanoparticles (NPs) produced by pulsed laser ablation in liquid (PLAL) in water, differing in average size. To achieve this size variation, PLAL was performed in water at equilibrium with different gaseous atmospheres, specifically pure argon (Ar) and ambient air (Air). Unlike commercial iron oxide NPs, those obtained via PLAL in deionized water exhibit an inherent positive surface charge.42 This evidence combined with their wide size distribution, making them well-suited to the heterogeneous pore structure of pSi, enables direct electrostatic interaction with carboxyl-functionalized pSi by just chemical mixing in a simple bucket. This eliminates the need for chemical agents and time-consuming intermediate processing steps as in previous approaches27 and avoids the use of thermal oxidation/dehydration procedure after infusion in an aqueous solution as reported in Ref. 23. In fact, after an appropriate ultrasonication treatment, we proved, by means of TEM and by magnetic response of the decorated pSi microparticles, that they can easily enter the different sizes of the pores and/or covered the negatively charged surface of the silicon microparticle by electrostatic interaction. As a result, the functionalization process is streamlined, very fast and simple thus reducing preparatory steps and enhancing the system's overall efficiency and maintaining the optical properties of the bare light-emitting por-Si offering a stable micro–nano optical and magnetic system for theranostics applications.
2. Materials and methods
2.1 Porous silicon microparticles fabrication and functionalization
Anodization of a boron doped p-type crystalline Si wafer (〈100〉 oriented, 10–20 Ω cm−2 resistivity, purchased from University wafers, Boston MA) was performed in a PTFE cell filled with an electrolytic solution of ethanol with 16% HF and etched at a constant current of 80 mA cm−2 for 15 minutes. The porous layer was removed from the wafer surface, transferred into toluene and fragmented into microparticles by 20 min of sonication in a thermal bath. Light-driven hydrosilylation by acrylic acid was performed in toluene at 80 °C and stirred for five hours to introduce –COOH groups at the porous surface. After that, the suspension was washed ten times with ethanol to remove the toluene containing the non-reacted acrylic acid. The introduction of carboxylic groups allows the sample to be stored in ethanol at room temperature for years without degradation or loss of luminescence.2.2 Synthesis of FeOxNPs by PLAL in water
Iron oxide nanoparticles were synthesized by PLAL in deionized water at equilibrium with different gaseous atmosphere, ambient air (FeOxNPs–Air) or argon (FeOxNPs–Ar). The target material was a disk of pure iron (99.99% purity), purchased from Kurt J. Lesker (U.S.A). To remove surface oxides before PLAL, the disk was gently scrubbed with sandpaper and then rinsed with deionized water. To remove eventual organic material, the disk was subject to subsequent ultrasonic treatments in different liquid environment: 10 minutes in ethanol, 10 minutes in acetone and 10 minutes in deionized water. After, the iron disk was dried using nitrogen and stored in vacuum.PLAL was performed using a Nd:YAG laser source model Q-Smart 850 (Quantel, U.S.A), equipped with a second harmonic generator module, emitting pulses with an energy of 7 mJ at the wavelength of 532 nm and a temporal duration of 5.8 ns (repetition rate = 10 Hz). The laser pulses were focused onto the surface of the target under a column of water of 10 mm using a lens with a focal distance of 14.9 cm. To calculate the spot size and fluence F of the laser pulse on the target we used the same approach reported in our previous work,35 where we developed a code based on the ABCD matrix method,43 which simulates the propagation of circular Gaussian beams passing through experimental setup components. In particular, the code uses as input information the wavelength of the pulse, the focal length of the lens, the distance between the lens and the target, and also the height of the column of water over the target. According to the laser's manufacturer specifications, the laser pulse is characterized by an elliptical Gaussian profile (TEM00) with minor differences between the major and minor axes (<5%). Based on these considerations, the laser spot was approximated as circular in the optical simulations, with a beam waist value of 2.6 mm in radius at the wavelength of 532 nm.
The fluence F of the laser pulse was adjusted by changing the height of the lens over the target and was set to a value 8 J cm−2 for ablation performed in water at equilibrium with both air or argon. In the two different ablation environments, the total ablation time was 5 hours and 3.5 hours for water–air and water–argon interfaces, respectively. The difference in the time of the ablation cycles is due to the difference in the volume size of the container used for each ablation (12 ml for water–air interface and 5 ml for water–argon interface). The volume of the water in the two different cases was in fact adjusted to maintain the same height of the column of water, which is known to be an important experimental parameter to control the properties of the nanoparticles obtained by PLAL.44 For these reasons, the ablation time was dependent on the synthesis environment, in order to obtain colloidal dispersions of nanoparticles with similar metal concentration.
To perform PLAL at the water–argon interface, we applied a vacuum for about 100 s in a dedicated ablation glass chamber containing the deionized water. Subsequently, pure argon was fluxed inside chamber, and let diffuse into the water at a pressure of about 1.2 atm for about 4 hours.
After the synthesis of the NPs, the samples were placed near a permanent magnet for 4 days to selectively collect the iron oxide nanoparticles presenting a stronger magnetic behavior. For each ablation cycle, the concentration of NPs attracted by the magnet as measured by inductively coupled plasma mass spectrometry (ICP-MS), was (8 ± 1) ppm and (32 ± 3) ppm for water in equilibrium with air and argon, respectively.
Before the decoration of the NPs into the pSi, the concentration of the FeOxNPs was raised by collecting the nanoparticles with the permanent magnet and suspending the material in a lower volume of deionized water, which is also a useful and simple step to eliminate the non-magnetic amorphous iron oxides formed during PLAL of iron targets in water. Hence, the final concentration of the colloidal suspension of FeOxNPs before the decoration was 220 ppm (air) and 360 ppm (argon).
2.3 UV-Vis absorption and emission spectroscopy
The stability of the colloidal dispersion of FeOxNPs was verified by monitoring the UV-Vis spectra along 48 hours, which corresponds to the time used to allow the interaction between the p-Si and the nanoparticles, as described in the next sub-sections. For this aim, we used a double beam spectrophotometer of PerkinElmer (USA) model Lambda 950.Optical measurements were performed by Horiba Jobin-Yvon Nanolog spectrofluorometer. The configuration setup for the PhotoLuminescene spectra acquisition was: excitation at 325 nm, 3 nm slit size, 1200 gratings per mm density grating (blazed at 500 nm). Photoluminescence decay curve were analysed by time correlated single photon counting (TCSPC) method. The lifetime (lifetime in the μs range) was investigated by a xenon pulsed lamp (with λex = 325 nm and pulse width 1.1 μs). The lifetime values τ were obtained by fitting the decay curve.
2.4 Morphological and dimensional characterization
After the synthesis, the samples were characterized using TEM (Transmission Electron Microscopy) for the structural and morphological analysis and DLS (Dynamic Light Scattering) to determine average hydrodynamic size and surface charge.TEM analysis was performed using an FEI Tecnai G2 F20 operating at 200 kV. The samples were prepared diluting the pristine colloidal dispersion of nanoparticles as obtained by PLAL about approximately 30 times and depositing a 20 μl drop on TEM Formvar-Carbon grids (Ni, 200 mesh).
The microscope was equipped with two windowless silicon drift (SDD) EDS detectors (Energy Dispersive X-rays Spectroscopy). S-TEM (Scanning Transmission Electron Microscopy) mode was used to determine elemental distribution in samples by collecting EDS maps and gaining insights about FeOxNPs average size and possible incorporation within the pSi microparticles.
The surface charge (ζ-potential) and the size distribution of the samples, were determined by Zetasizer Nano-SZ (Malvern) instrument, by dynamic light scattering (DLS) with a 633 nm laser beam. The measurements were conducted in water at 25 °C after a 10 minute sonication bath.
A common approach used for the analysis of the TEM images is the fit the average size distribution using a monomodal log–normal function.45 The latter can be expressed as:
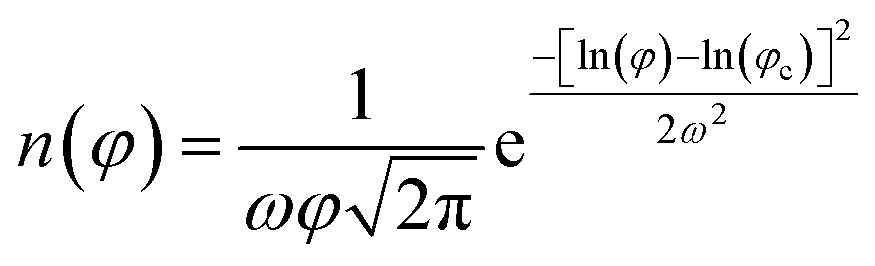
Herein, the parameters ω and φc are related to nanoparticle average diameter quantity φ and standard deviation σ by the relations  and
and  , in which M = ln(φ).45
In order to measure the distribution of the linear dimension of the NPs, an average spherical shape was assumed. In this case, using the software ImageJ, we zoomed in on the TEM images and drew circles or ellipses representing the contour of each NP. After this, the diameter φ of the NPs was obtained using the equation A = πφ2/4, where A was calculated by the software.
2.5 Decoration/infiltration of porous silicon pores
Prior to decoration the iron oxide NPs were disaggregated by a treatment composed of sonication bath for 20 minutes (Bandelin Sonorex 52H) with a frequency of 45 kHz, and power of 135 W and ultrasonication (US) for 1 minute with frequency of 20 kHz and power of 180 W (Bandelin Sonopuls Ultrasonic Homogenizer HD 2070, 2 mm diameter probe, amplitude 200 μmss), repeated for 5 cycles and resuspended in water.Carboxyl-functionalized pSi microparticles were dried for 5 hours in a 50 °C oven to remove the ethanol and resuspended in the iron oxide NPs water suspensions (0.3 mg mL−1) for two days at room temperature to allow electrostatic interaction, then washed twice with ultrapure water to remove the non-bound NPs. A schematic view of the experimental procedure is shown in Fig. SI_1.†
A first proof of the success of the decoration was checked by simply placing a magnet on the side of the suspension to observe the attraction.
2.6 Magnetic characterization
The magnetic properties of the porous silicon samples decorated with FeOxNPs were measured through magnetization curves obtained using a vibrating sample magnetometer module of the Quantum Design PPMS Versalab, under a DC magnetic field in the range of ±1 T at room temperature.Due to the limited amount of material available for the magnetization measurements, which led to a low magnetic signal, a background subtraction procedure was performed to account for the diamagnetic contribution of the sample holder. The magnetic response of the empty holder, measured under the same conditions, was used for this correction. The subtraction was carried out using a linear interpolation function, applied to match the magnetic field values of the sample measurement and ensure accurate point-by-point subtraction of the background moment.
3. Results and discussion
3.1 pSi microparticles and iron oxide NPs structural characterization
The carboxylic functionalization method of pSi microparticles, previously developed,44 was aimed at preserving the intrinsic photoluminescence at room temperature of pSi and allowing the binding of different molecules with the porous network.In this study, we exploited both the compatibility between silicon pore size and the iron oxide NPs size, and the negative surface charge – derived from the carboxylic groups – to bind iron oxide NPs, which present a positive surface charge.
In fact, pSi microparticle size and Z-potential were measured by DLS, obtaining values of 350 ± 80 nm and −26.5 ± 5 mV, respectively. From TEM images (see Fig. SI_2†), it is possible to estimate a pore size distribution of 9 ± 5 nm. Moreover, the intrinsic photoluminescence at room temperature of porous silicon was checked by fluorescence spectroscopy, obtaining a spectrum characterized by a broad emission band centered at about 688 nm, by excitation at 325 nm.
The iron oxide NPs fabricated by PLAL in water have been investigated by TEM (Fig. 1) to analyze the morphological aspects and the size distribution, while DLS was used to confirm the average size, and to evaluate the agglomeration state and surface charge.
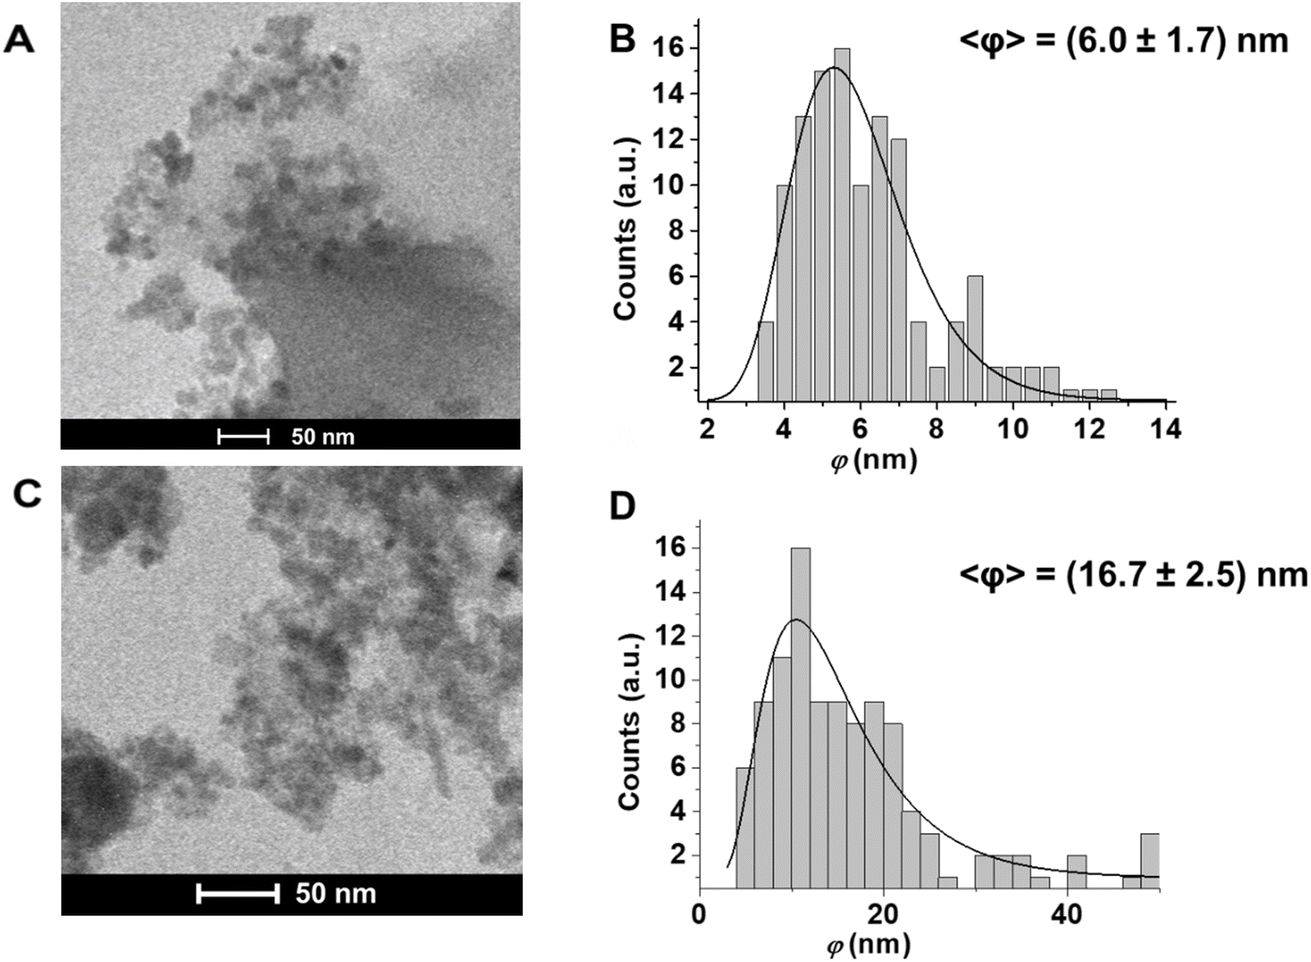 | ||
| Fig. 1 TEM Images and size distribution of (A and B) FeOxNPs–Air and (C and D) FeOxNPs–Ar. | ||
From the analysis of TEM images (Fig. 1), we observe that the FeOxNPs morphology is not uniform: aggregation is a phenomenon frequently observed when working with iron oxide nanoparticles. It is often solved by using some additive to prevent the NPs from aggregating, but this often results in a negative surface charge, preventing easy and immediate electrostatic bonding to the COOH-terminated porous silicon surface. In our sample, the tendency to agglomerate in structures with average dimensions between 100–400 nm is observed. The majority of the NPs in the agglomerates has an average statistical diameter of (6.0 ± 1.7) nm and (16.7 ± 2.5) nm for FeOxNPs–Air and FeOxNPs–Ar, respectively. These results are well aligned with those reported in the literature for PLAL at water–air interface of iron targets without the use of surfactants and without post irradiation processes, which are listed in Table 1. As well known, the use of ultrashort fs laser pulses leads to broader size distribution of nanoparticles by PLAL, and bigger average diameters are obtained by the use of a higher fluence of the laser pulse.46 In the case of FeOxNPs, the wavelength seems to play a fundamental role for the dimension only in the case of post-irradiation treatments,36 but it controls the threshold value of PLAL independently on the nature of the metallic target.47 It is worth noting that not all of the works found in literature report the method of calculation of the fluence, and very few consider the effect of the column of water, which can be very significant depending on the case.44
| λ (nm) | τ | F (J cm−2) | Diameter (nm) | Interface | Ref. |
|---|---|---|---|---|---|
| 355 | ns | 1.3 | 12.5 ± 4.7 | Water–air | 27 |
| 1064 | ns | 0.7–7 | 5.0 | Water–air | 46 |
| 1064 | ns | 3.2 | 1.0–10.0 | Water–air | 47 |
| 532 | ns | 4.5–6.1 | 14 ± 8–18 ±- 12 | Water–air | 48 |
| 532 | ns | 8 | 6.0 ± 1.7 | Water–air | This work |
| 532 | ns | 8 | 16.7 ± 2.5 | Water–argon | This work |
| 532 | ns | 15 | 25 ± 11 | Water–air | 49 |
| 532 | ns | 16–22 | 24 ± 6.1 | Water–air | 50 |
| 527 | fs | 15 | 9.0–25.0 | Water–air | 45 |
| 527 | fs | 59.2 | 39.0–78.0 | Water–air | 51 |
DLS measurements confirmed the size of the agglomerates, which was between 100 and 400 nm for both samples.52 We attribute the absence of the population of smaller FeOxNPs (average diameter ∼ 6 nm) in the DLS results to the fact that the scattering cross-section of spherical particles is proportional to the sixth power of the linear dimension (i.e., r6), so smaller nanoparticles cannot be detected in the presence of larger agglomerates, even at low concentrations.
In summary, although both TEM and DLS results confirm the presence of agglomerates of NPs both in liquid and solid form, the dimensional analysis of the colloidal dispersion of single nanoparticles by TEM shows a good match between the polydispersity of the nanopores of the pSi and the size distribution of FeOxNPs.
As for the surface charge of the FeOxNPs, the Z-potentials were almost neutral: −3 ± 5 mV for FeOxNPs–Air and +4 ± 5 mV for FeOxNPs–Ar. Iron oxide NPs, as previously seen, have a tendency to aggregate, and given that we expected to have positively charged samples, the almost neutral Z-potential might be an indication of their aggregation state.53,54 Therefore, it was necessary to induce a detachment before the decoration process inside the pSi pores.
3.2 Stability of the FeOxNPs in water
The eventual instability of the colloidal dispersion of FeOxNPs in water can limit the interaction with the p-Si microstructures. For this reason, we monitored the stability of the extinction spectra of the iron oxide nanoparticles along 48 hours, which is the time used to allow the interaction with the p-Si. The results, reported in Fig. 2, show a decrease in optical density of approximately 12% and 34% for the FeOxNPs–Air and FeOxNPs–Ar samples, respectively. This observation confirms that the majority of the FeOxNPs can interact with the p-Si before the eventual precipitation in the water environment. | ||
| Fig. 2 Monitoring of the UV-Vis extinction spectra of the FeOxNPs–Air (A) and FeOxNPs–Ar (B) along 48 hours. | ||
3.3 Sonication treatments
Samples were sonicated with different procedures, and their size was measured by DLS after each of the following steps: a sonication bath for 20 minutes (1st sonication) and ultrasonication (US), 5 cycles of 1 minute each (2nd sonication). The main difference between the two methods is the mode of transmission of ultrasonic energy to the sample: for the first method, it is the water bath; for the second, it is the sonication probe. The probe is in direct contact with the sample, allowing the transmission of higher energy, which is expected to lead to more efficient disaggregation.55Fig. SI_3† shows the comparison of the size distributions after the two sonication processes performed on three samples. After the first sonication treatment, the average size went from initial values of 100–400 nm to 90 ± 50 nm with a narrow distribution for FeOxNPs–Air (panel A) and two broad peaks at about 90 and 390 nm appeared for FeOxNPs–Ar (panel B). Therefore, we proceeded by applying a second more energetically sonication: the ultrasonication.
The second sonication step compared to first did not exert a consistent disaggregation effect in the case of FeOxNPs–Air, the size distribution indeed resulted almost identical and centered at 100 ± 50 nm. However, after the second treatment of FeOxNPs–Ar, the population centered at 390 nm diminished while the other increased and became narrower and centered at 120 nm. Consequently, we can deduct that to disaggregate FeOxNPs–Air it is sufficient to use a lower ultrasonic energy, while FeOxNPs–Ar necessitates of a higher energetic process such as probe ultrasonication.
Moreover, highly positive surface charges were measured for both the samples (+22 ± 5 mV for FeOxNPs–Air and +25 ± 5 for FeOxNPs–Ar) indicating that the NPs were effectively better dispersed than before. The reason of the positive charge, is due to the presence of hydroxyl surface groups on the surface of the FeOxNPs, which can react with H+ and OH− ions. Depending on the pH of the water environment, the oxidized surface can either undergo protonation (with acidic behavior) or deprotonation (with basic behavior).56 In particular, magnetite (Fe3O4) nanoparticles typically have an isoelectric point (IEP) with pH from 6.5 to 7.0,57,58 while hematite (Fe2O3) nanoparticles have an IEP closer to a pH of 6.59 Considering that the pH of the synthesized colloidal dispersions of FeOxNPs was around 6.2, our results are coherent with the literature, where a Z-potential of about +30 mV was measured for iron oxide nanoparticles synthesized by PLAL in water with a slightly acidic pH.42
3.4 Infiltration/decoration of porous silicon pores
Ultrasonically treated iron oxide nanoparticles (NPs) were characterized by a positive surface charge (+22 ± 5 mV and +25 ± 5 mV for FeOxNPs–Air and FeOxNPs–Ar, respectively), while pSi microparticles exhibited a negative surface charge (−26.5 ± 5 mV). The decoration was performed using the simple immersion method previously described. The presence of opposite surface charges at the silicon inorganic matrix and the iron oxide NPs, coupled with their broad size distribution, allows for the loading of the first through capillary action by means of electrostatic interaction, as successfully achieved by Lundquist et al. and Kinsella et al.60,61The first proof of the success of this simple procedure was demonstrated by placing a magnet on the side of the suspension. The incorporation of FeOxNPs within the silicon porous matrix resulted in the ability to easily manipulate the pSi + FeOx NCs with an external magnetic field. The presence of a magnet in proximity, indeed, applied an external magnetic field which induces the alignment of the domains with the field, even when entrapped within the silicon pores or attached to the surface, leading to the exhibition of the magnetic features as clearly seen in Fig. 3, the pSi microparticles are attracted by the magnet only after decoration with FeOxNPs–Ar (panel B). Moreover, if the FeOxNPs were not linked with the pSi, the latter would remain in the bottom of the cuvette.
 | ||
| Fig. 3 Effect of a magnet on the pSi microparticles before (A) and after (B) decoration/infiltration with FeOxNPs–Ar. Effect of a magnet and UV lamp (365 nm, 6 W) irradiation on the pSi microparticles after decoration with FeOxNPs–Ar (C). The arrow in yellow indicate the presence of the pSi. | ||
In panel C of the same figure, we report an image of the infiltrated particles taken in the presence of both the magnet and the UV lamp, which clearly shows that the material attracted by the magnet is both magnetic and luminescent. It should also be emphasized that porous silicon itself does not possess intrinsic magnetic properties; therefore, the observed magnetic response is solely due to the presence of the iron oxide nanoparticles incorporated within the porous silicon. Hence the contemporary presence of the luminescent pSi and the magnetic iron oxide nanoparticles in the same spot that is a first demonstration of the success of the infiltration/decoration procedure.
It is worth noting that only a portion of the pSi microparticles functionalized by iron oxide NPs was attracted by the magnet and that portion is clearly luminescent. This can be attributed either to the non-uniform decoration or infiltration of the sample, or to an insufficient amount of FeOxNPs to functionalize all the pSi microparticles. Moreover, we cannot claim for a complete “incorporation” of the magnetic nanoparticles. Part of them is also attached to the external surface of the micro aggregates of pSi. This does not change the fact that they result in a “magnetic feature” of the whole pSi + FeOx NCs system.
However, to assess how much magnetite nanoparticles are within the pores or at the surface of the pSi microparticles, we performed further structural investigations also to get a comprehensive view on the morphology (see Fig. 4), where the comparison between pSi and pSi + FeOxNPs–Ar is shown). It is clear that iron oxide nanoparticles (yellow circles and arrows) superpose pSi morphology and are filling the pores and/or decorating the structure of pSi.
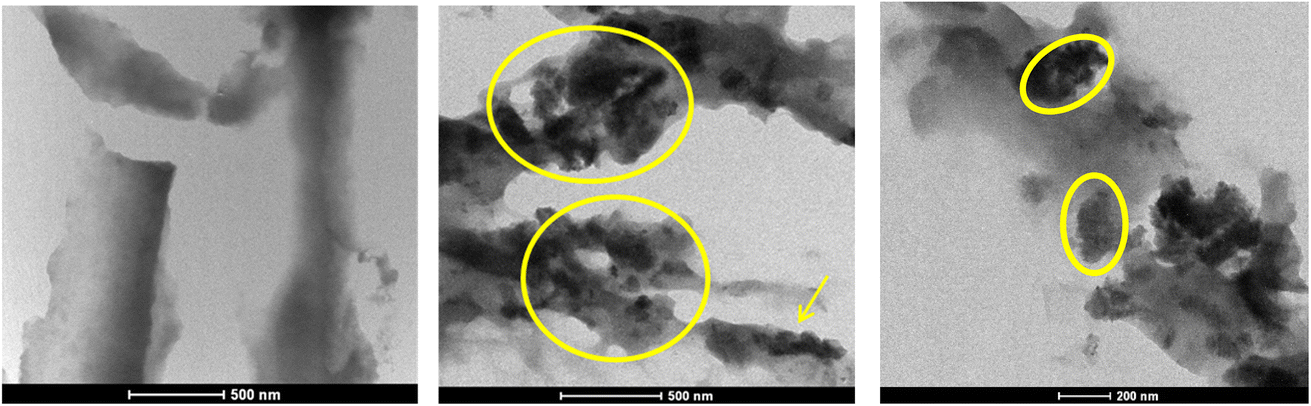 | ||
| Fig. 4 TEM images. Left panel: pSi portion (500 nm scale). Middle (500 m scale) and right (200 m scale) panel: pSi after infiltration with FeOxNPs–Ar nanoparticles. Circles and arrows point out the presence of iron oxide nanoparticles. | ||
DLS results for the total surface charge of the decorated samples together with TEM images of both FeOxNPs–Ar and FeOxNPs–Air samples are reported in Fig. 5.
 | ||
| Fig. 5 Morphological characterization of pSi microparticles decorated with iron oxide NPs. TEM image of (A) pSi + FeOxNPs–Air (100 nm scale) and (B) pSi + FeOxNPs–Ar (200 nm scale). (C) Size distributions and (D) surface charge modifications of pSi microparticles before and after decoration with FeOxNPs (DLS measurements). | ||
By observing the TEM images, it is possible to deduce that the FeOxNPs are partially infiltrated into the pSi network, as pointed out in the highlighted areas of Fig. 5B. This is consistent with Fig. 3B that shows that part of the pSi it is not attracted by the magnet because it is not filled or decorated by the iron oxide NPs.
From the DLS measurements (Fig. 5C), it is clear that the pSi size was not significantly affected by the decoration with FeOxNPs–Air, however, when decorated by FeOxNPs–Ar, the mean size increased by about 100 nm, without significant modifications of the size distribution. Furthermore, by comparing the surface charges before and after the decoration (Fig. 5D), we can observe that pSi Z-potential after decoration is still negative for both iron oxide NPs made in air or argon, although partially reduced in its values (from about −25 mV to about −20 and −15 mV, respectively). In fact, the presence of iron oxide NPs with their positive charge are able to make the pSi surface less negative. This is, at the same time, evidence that the decoration is not complete and/or that the quantity of iron oxide NPs was not sufficient for a full passivation of the negative surface charge of the pSi microparticles.
The average size of pSi microparticles remains largely unchanged upon combination with FeOxNPs–Air. As shown in Fig. 5A, the infiltrated FeOxNPs conform to the porous structure. However, when considering FeOxNPs–Ar (Fig. 5B), the FeOxNPs do not always follow the morphology of pSi but extend beyond the pSi structure. This is likely due to the agglomeration of FeOxNPs, which attach to the pSi surface, slightly increasing the overall diameter. These findings suggest that FeOxNPs produced in air predominantly infiltrate the pores, whereas those produced in argon tend to decorate the surface rather than fully penetrating the porous network.
Fig. 6 shows EDS maps for Fe, O, and Si, and a STEM-HAADF image from which spectra were collected. In the STEM-HAADF image FeOxNPs (brighter spots) of different size can be observed superposed onto a Si matrix (less bright).
 | ||
| Fig. 6 Elemental analyses of FeOxNPs–Ar sample. Gray: STEM-HAADF image; green: iron map; red: oxygen map; blue: silicon map. | ||
Considering that the photoluminescence is an important and useful feature of pSi, emission spectra and decay curves (λex 325 nm) were acquired after decoration and compared with the ones of the bare pSi particles (Fig. 7, panel A and B, respectively) to highlight possible modifications.
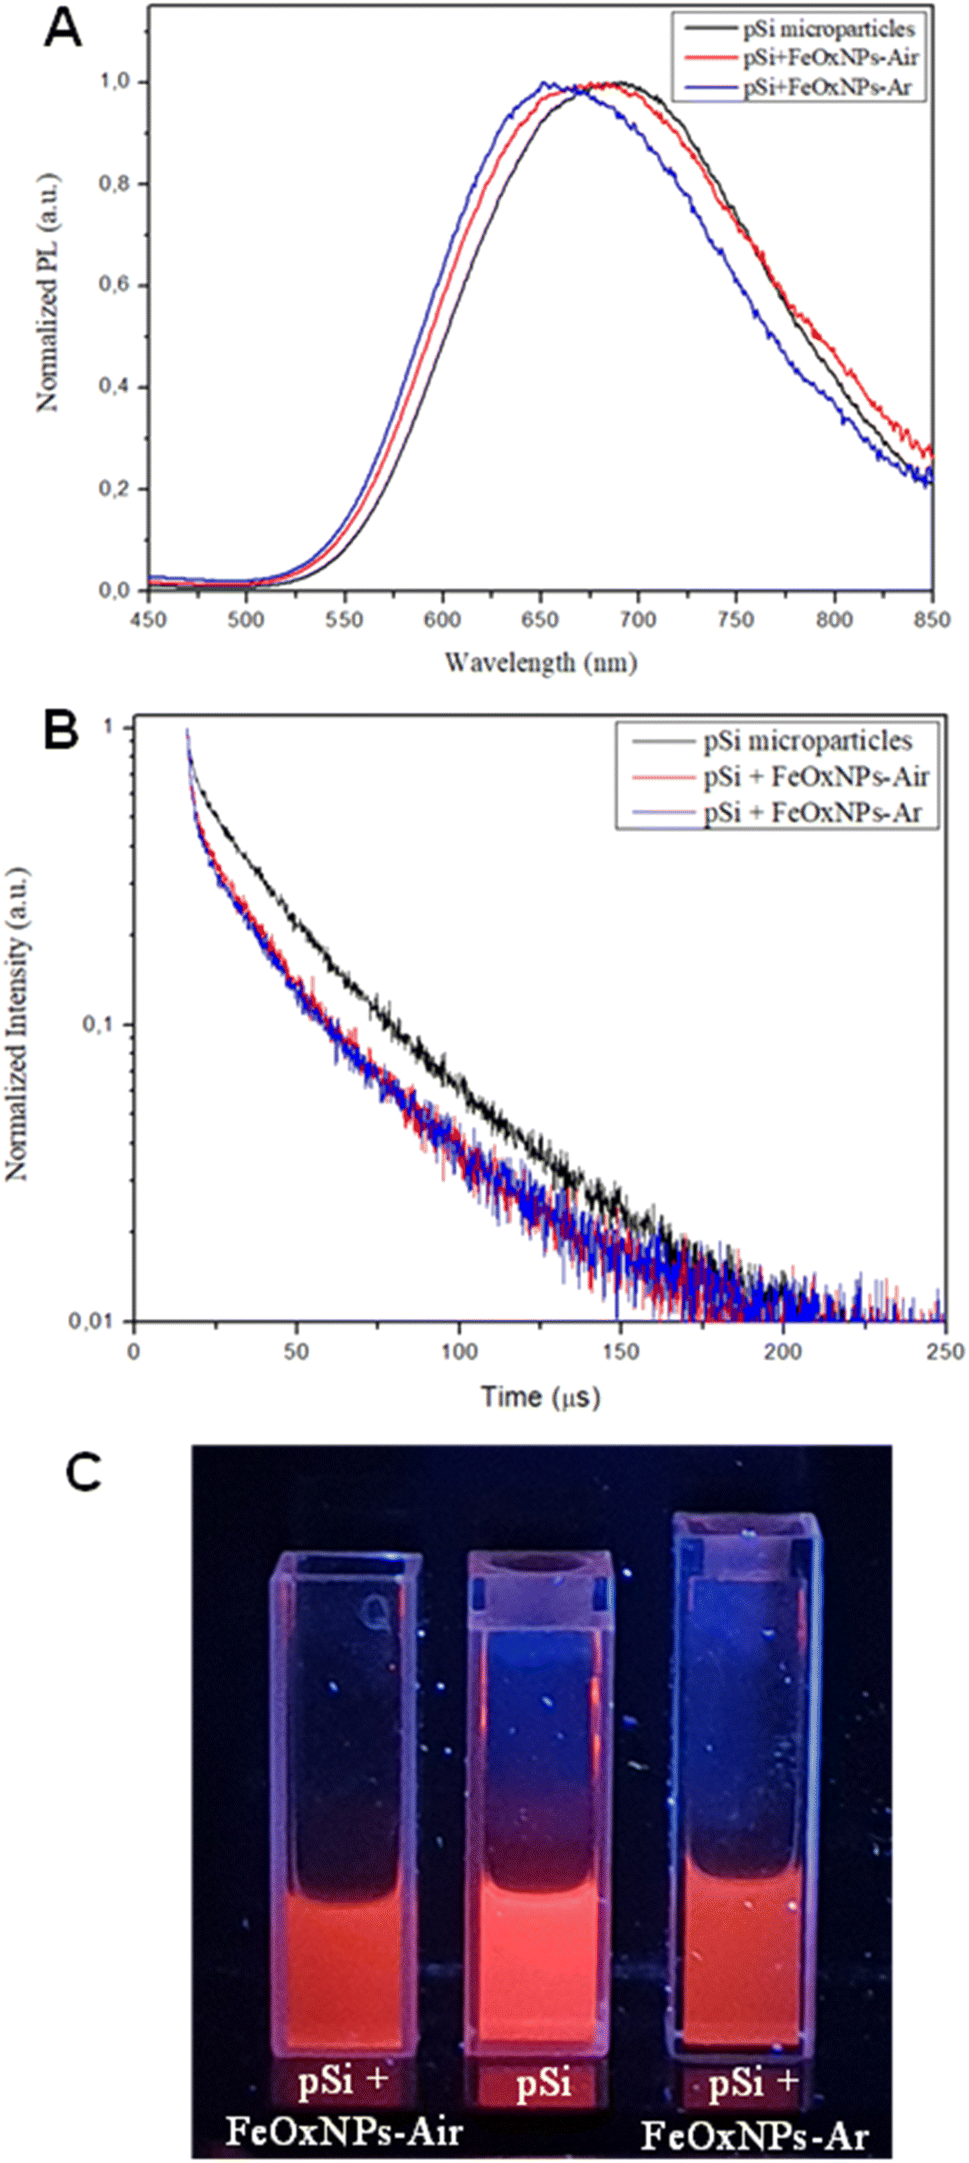 | ||
| Fig. 7 Photoluminescence properties of pSi microparticles before and after decoration with iron oxide NPs: PL spectra (A) and decay curves (B) at λex 325 nm of bare pSi, pSi + FeOxNPs–Air and pSi + FeOxNPs–Ar. In panel C the 3 cuvettes with the samples under UV lamp excitation. | ||
The PL bands of the “magnetic” pSi particles are similar to the bare ones, although less intense and slightly shifted towards 676 nm and 663 nm (from 688 nm), for iron oxide NPs produced in water at equilibrium with ambient air or argon atmosphere, respectively. The blue-shift might be attributed to the partial oxidation, due to the presence of water, that the porous silicon goes through during the decoration process, as proposed by Gu et al.23 Moreover, the radiative lifetime is slightly reduced from a value of about 30 μs to 20 μs. The data found are in agreement with previous findings.62 In general, filling of porous silicon has been reported to modify the optical properties.63 Indeed, the lifetime reduction can be attributed to the presence of the iron oxide NPs inside porous silicon pores, as found by Gardelis et al. when filling the pores of silicon nanocrystals embedded in a matrix of silicon dioxide with silver nanoparticles.64
By comparing the behavior of iron oxide NPs produced in presence or absence of argon we noticed that when a magnetic stimulus is exerted (e.g., approximate presence of a magnet) to the decorated pSi particles, pSi + FeOxNPs–Ar showed a faster response compared to pSi + FeOxNPs–Air. The first, indeed, are suddenly attracted by the magnetic field while the second took at least 30 seconds more to move towards the magnet. This different behavior was observed also in the FeOxNPs alone before the decoration and may be explained by the larger average dimension of the FeOxNPs–Ar.65
Another interesting fact is the duration of this magnetic effect over time. We tested the stability of the magnetism after being kept in ethanol at room temperature for 6 months (Fig. SI_4†). pSi + FeOxNPs–Ar is still attracted to the magnet while pSi + FeOxNPs–Air has completely lost its magnetic ability. This indicates that pSi + FeOxNPs–Ar have a higher stability to redox reactions. In fact, iron oxides may be used as catalysts for the oxidation of ethanol and production of molecular hydrogen, with a higher efficiency of hematite compared to other phases.66 Although the process is thermo-catalytic, we suppose that effects at ambient temperature can be visible after storage over months, and that the different behavior with respect to FeOxNPs–Ar may be attributed to the different percentage of NPs in the phases of magnetite, hematite and wurtzite. Anyway, the origin of these different behaviors is not the objective of the present research and will be addressed in future investigations.
Since the pSi microparticles were not completely decorated with the iron oxide NPs (as indicated by the DLS analysis), we investigated whether a higher concentration of magnetic NPs would improve the decoration. Considering the higher stability of pSi + FeOxNPs–Ar, the experiment was repeated only with FeOxNPs–Ar by doubling the amount of iron oxide NPs incubated with pSi and applying the same procedure. After the second decoration, the size of pSi microparticles is maintained more or less the same (530 ± 80 nm), whereas Z-potential is much less negative (from −27 to −12 mV) compared to the bare pSi microparticles and slightly lower compared to the first decoration (from −15 to −12 mV), see Fig. SI_5† that shows the comparison between bare pSi and pSi after the first (pSi + FeOx NCs–Ar_1) and the second (pSi + FeOx NCs–Ar_2) experiment, panel (A) and (B) respectively.
The reduction of Z-potential can be attributed to the increase of the amount of infiltrated iron oxide NPs within the pores of pSi as expected with an increased quantity of incubated NPs, while it does not substantially affect the mean diameter.
During this second experiment we also aimed at observing, by means of electron microscopy, if the distribution of the iron oxide NPs over the pSi structure was more homogeneous if the successfully decorated pSi microparticles were separated from the non-decorated through a magnetic separation. The remaining magnetic particles (Fig. 8, panel A), visible to the naked eye, were around 20% of the whole treated sample. Their attraction to the magnet confirmed, once again, the success of the decoration method. Moreover, as for the other samples, pSi + FeOxNPs–Ar_2 was analyzed by TEM (Fig. 8, panel B and C).
 | ||
| Fig. 8 pSi + FeOxNPs–Ar_2 characterization. (A) Magnetic pSi in absence and presence of a magnet. (B) and (C) TEM images of pSi + FeOxNPs–Ar_2 (500 nm scale and 100 nm scale, respectively). | ||
From TEM image of panel (B) the presence of iron NPs (darker areas) seems to be spread all over the structure of pSi microparticles. On the magnified image of panel (C) there is a clear presence of a high quantity of iron NPs that covers all the pSi surface. This suggests that the relatively wide size distribution of iron oxide NPs paired with the widespread size distribution of the pSi particles' pores is an ideal approach to obtain a large coverage of the pSi inner surface, leading to a more magnetized resulting material.
Fig. 9 presents the magnetic response curves of pSi decorated with FeOxNPs–Air (black curve) and FeOxNPs–Ar (red curve), showing the magnetic moment (emu) as a function of the applied magnetic field (H). An inset is included in the figure, providing a zoomed-in view of the low-field region, which highlights the coercivity and remanence of both samples. Although the samples could not be weighed due to insufficient material (masses below 0.1 mg), the magnetic measurements were still performed. As a result, the magnetic moment is presented instead of the magnetization. However, since the sample volumes were likely very similar, a reasonable comparison between the two was still possible.
 | ||
| Fig. 9 Magnetic response curves comparing similar masses of pSi decorated with FeOxNPs–Air (black curve) and pSi decorated with FeOxNPs–Ar (red curve). These curves display the magnetic moment as a function of the applied magnetic field. The inset provides a zoomed-in view of the low-field region, emphasizing the differences in coercivity and remanence between the two samples. | ||
Both samples possibly exhibit ferrimagnetic behavior, as indicated by the presence of coercivity and remanence in the magnetic response curves (see inset). Given the particle sizes of the FeOxNPs measured in this study through TEM and DLC, they likely have a single-domain structure. As expected for such particles, smaller sizes lead to lower coercivity, remanence, and signal intensity,67 which is consistent with the results. The magnetic response of the composite pSi + FeOx–Air NCs is weaker and noisier, likely due to either the smaller FeOx NPs size or a different quantity of NPs entering and/or decorating the porous silicon. It exhibits a coercive field of around 80 Oe and lower remanence, while the FeOxNPs–Ar sample, with larger particles, shows a stronger magnetic response, with a coercivity of approximately 170 Oe and higher remanence. Ultimately, the atmosphere used during synthesis plays a key role in determining the magnetic properties: the argon atmosphere (FeOxNPs–Ar) promotes the formation of larger particles and enhances magnetic behavior, while the air atmosphere (FeOxNPs–Air) leads to weaker magnetic response, likely due to the formation of smaller particles. This highlights the importance of synthesis conditions in controlling particle size and, consequently, magnetic performance.
Conclusions
This study explores an innovative approach to combine luminescent porous silicon (pSi) microparticles with magnetic properties by decorating them with iron oxide nanoparticles (NPs). These were created using pulsed laser ablation in water with different gaseous atmospheres (i.e., air and argon), followed by sonication treatments aimed at separating the agglomerated particles. The two sets of nanoparticles present similar positive charge and polydispersity but different average size and long-term magnetic behaviors.Structural analysis demonstrated effective pore filling, showing that FeOxNPs synthesized in air predominantly infiltrate the porous network, while those produced in an argon atmosphere tend to decorate the surface without fully penetrating the pores. We confirmed the successful magnetization of the silicon-derived material, with both samples exhibiting ferrimagnetic behavior, as evidenced by the presence of coercivity and remanence in the magnetic hysteresis curves. Notably, the magnetic properties of the argon-treated sample remained stable even after several months, indicating long-term retention of its magnetic functionality. Fluorescence spectroscopy assessed the stability of the optical properties of the new “magnetic” silicon-derived composite.
Compared to the previously developed methods, this technique offers distinct advantages. Specifically, the nanoparticles exhibit a broad size distribution, which aligns well with the varying pore sizes of the pSi. Furthermore, the positive surface charge of the NPs facilitates direct electrostatic interactions with carboxyl-functionalized pSi, eliminating the need for additional surface modifications. This approach simplifies the functionalization process, reducing the complexity of preparation steps and enhancing the overall efficiency of the system.
These updated outcomes demonstrate the potential of the combination of luminescent pSi microparticles with pulsed laser ablation-derived iron oxide nanoparticles in the theranostics field.
Conflicts of interest
There are no conflicts of interest to declare.Acknowledgements
Authors acknowledge CPT (Centro Piattaforme Tecnologiche) of the University of Verona for the access and support to the instrumentations. This study was financed in part by RIBA2022 project (“Assegnazione per Ricerca di Base” – Delibera CdA 22/02/2022 e SA 24/10/2023) of the University of Verona. This work has been partially supported by #NEXTGENERATIONEU (NGEU) and funded by the Italian Ministry of University and Research (MUR), National Recovery and Resilience Plan (NRRP), project MNESYS (PE0000006) – A Multiscale integrated approach to the study of the nervous system in health (Spoke 7). This study was financed in part by the Coordenação de Aperfeiçoamento de Pessoal de Nível Superior-Brasil (CAPES) – Finance Code 001, and CNPq productivity grant. Funding from the Conselho Nacional de Desenvolvimento Científico e Tecnológico (CNPq) with grant number 403572-2023-1 is acknowledged. We also acknowledge FAPERJ (Brasil) for processes E-26/211.540/2021, E-26/211.279/2021, E-26/010.002138/2019, E-26/010.000980/2019, E-26/200.810/2021, E-26/210.104/2020, and E-26/210.726/2021. Authors are grateful to Prof. M. Scarpa (Department of Physics, Laboratory of Nanoscience, University of Trento) for the help and support during the fabrication of porous silicon samples.References
- H. Bin Na, I. C. Song and T. Hyeon, Adv. Mater., 2009, 21, 2133–2148 CrossRef.
- H. Huang, X. Du, Z. He, Z. Yan and W. Han, Front. Cell Dev. Biol., 2021, 9, 662406 CrossRef PubMed.
- H.-V. Tran, N. M. Ngo, R. Medhi, P. Srinoi, T. Liu, S. Rittikulsittichai and T. R. Lee, Materials, 2022, 15, 503 Search PubMed.
- A. V. Samrot, C. S. Sahithya, J. Selvarani A, S. K. Purayil and P. Ponnaiah, Curr. Res. Green Sustain. Chem., 2021, 4, 100042 Search PubMed.
- R. Vakili-Ghartavol, A. A. Momtazi-Borojeni, Z. Vakili-Ghartavol, H. T. Aiyelabegan, M. R. Jaafari, S. M. Rezayat and S. Arbabi Bidgoli, Artif. Cells Nanomed. Biotechnol., 2020, 48, 443–451 CrossRef CAS PubMed.
- E. Fazio, M. Santoro, G. Lentini, D. Franco, S. P. P. Guglielmino and F. Neri, Colloids Surf., A, 2016, 490, 98–103 CrossRef CAS.
- A. Erwin, S. Salomo, P. Adhy, N. Utari, W. Ayu, Y. Wita and S. Nani, IOP Conf. Ser. Mater. Sci. Eng., 2020, 845, 012051 CrossRef CAS.
- B. R. Cuenya, Thin Solid Films, 2010, 518, 3127–3150 CrossRef CAS.
- S. Wu, A. Sun, F. Zhai, J. Wang, W. Xu, Q. Zhang and A. A. Volinsky, Mater. Lett., 2011, 65, 1882–1884 CrossRef CAS.
- W. Wu, Q. He and C. Jiang, Nanoscale Res. Lett., 2008, 3, 397 CrossRef CAS PubMed.
- C. Okoli, M. Sanchez-Dominguez, M. Boutonnet, S. Järås, C. Civera, C. Solans and G. R. Kuttuva, Langmuir, 2012, 28, 8479–8485 Search PubMed.
- D. Aksu Demirezen, Y. Ş. Yıldız, Ş. Yılmaz and D. Demirezen Yılmaz, J. Biosci. Bioeng., 2019, 127, 241–245 Search PubMed.
- A. P. Philipse and D. Maas, Langmuir, 2002, 18, 9977–9984 CrossRef CAS.
- M. I. Anik, M. K. Hossain, I. Hossain, I. Ahmed and R. M. Doha, in Magnetic Nanoparticle-Based Hybrid Materials, Elsevier, 2021, pp. 463–497 Search PubMed.
- Z. Chen, C. Wu, Z. Zhang, W. Wu, X. Wang and Z. Yu, Chin. Chem. Lett., 2018, 29, 1601–1608 CrossRef CAS.
- R. A. Bohara, N. D. Thorat and S. H. Pawar, RSC Adv., 2016, 6, 43989–44012 RSC.
- P. Farinha, J. M. P. Coelho, C. P. Reis and M. M. Gaspar, Nanomaterials, 2021, 11, 3432 CrossRef CAS PubMed.
- J. Salonen and V.-P. Lehto, Chem. Eng. J., 2008, 137, 162–172 CrossRef CAS.
- K. J. Nash, P. D. J. Calcott, L. T. Canham, M. J. Kane and D. Brumhead, J. Lumin., 1994, 60–61, 297–301 CrossRef CAS.
- J. R. Henstock, L. T. Canham and S. I. Anderson, Acta Biomater., 2015, 11, 17–26 CrossRef CAS PubMed.
- V. Parkhutik, Solid. State Electron., 1999, 43, 1121–1141 CrossRef CAS.
- N. Daldosso, A. Ghafarinazari, P. Cortelletti, L. Marongiu, M. Donini, V. Paterlini, P. Bettotti, R. Guider, E. Froner, S. Dusi and M. Scarpa, J. Mater. Chem. B, 2014, 2, 6345 RSC.
- L. Gu, J. Park, K. H. Duong, E. Ruoslahti and M. J. Sailor, Small, 2010, 6, 2546–2552 CrossRef CAS PubMed.
- R. E. Serda, A. Mack, M. Pulikkathara, A. M. Zaske, C. Chiappini, J. R. Fakhoury, D. Webb, B. Godin, J. L. Conyers, X. W. Liu, J. A. Bankson and M. Ferrari, Small, 2010, 6, 1329–1340 CrossRef CAS PubMed.
- A. Chaix, A. Griveau, T. Defforge, V. Grimal, B. Le Borgne, G. Gautier and J. Eyer, RSC Adv., 2022, 12, 11708–11714 RSC.
- A. Ghafarinazari, M. Scarpa, G. Zoccatelli, M. Comes Franchini, E. Locatelli and N. Daldosso, RSC Adv., 2017, 7, 6724–6734 RSC.
- E. Chistè, G. Ischia, M. Gerosa, P. Marzola, M. Scarpa and N. Daldosso, Nanomaterials, 2020, 10, 463 CrossRef PubMed.
- R. Intartaglia, K. Bagga, M. Scotto, A. Diaspro and F. Brandi, Opt. Mater. Express, 2012, 2, 510 CrossRef CAS.
- P. Maneeratanasarn, T. Van Khai, S. Y. Kim, B. G. Choi and K. B. Shim, Phys. Status Solidi, 2013, 210, 563–569 CrossRef CAS.
- S. AdibAmini, A. H. Sari and D. Dorranian, SN Appl. Sci., 2023, 5, 122 CrossRef CAS.
- V. Amendola, D. Amans, Y. Ishikawa, N. Koshizaki, S. Scirè, G. Compagnini, S. Reichenberger and S. Barcikowski, Chem.–Eur. J., 2020, 26, 9206–9242 CrossRef CAS PubMed.
- T. Del Rosso, N. A. Rey, T. Rosado, S. Landi, D. G. Larrude, E. C. Romani, F. L. F. Junior, S. M. Quinteiro, M. Cremona, R. Q. Aucelio, G. Margheri and O. Pandoli, Nanotechnology, 2016, 27, 255602 CrossRef CAS PubMed.
- R. A. Ismail, M. H. Mohsin, A. K. Ali, K. I. Hassoon and S. Erten-Ela, Phys. E Low-dimens. Syst. Nanostruct., 2020, 119, 113997 CrossRef CAS.
- D. E. Martínez-Tong, M. Sanz, T. A. Ezquerra, A. Nogales, J. F. Marco, M. Castillejo and E. Rebollar, Appl. Surf. Sci., 2017, 418, 522–529 CrossRef.
- G. C. C. Tahir, M. Gisbert, M. Cremona, F. Lazaro, M. E. H. Maia da Costa, S. D. T. De Barros, R. Q. Aucélio, T. Saint Pierre, J. M. Godoy, D. Mendes, G. Mariotto, N. Daldosso, F. Enrichi, A. Cuin, A. F. Ferreira, W. M. de Azevedo, G. Perez, C. SantAnna, B. S. Archanjo, Y. E. L. Fonseca, A. L. Rossi, F. L. Deepak, R. Khan, Q. Zaman, S. Reichenberger, T. Fromme, G. Margheri, J. R. Sabino, G. Fibbi, M. Del Rosso, A. Chillà, F. Margheri, A. Laurenzana and T. Del Rosso, Small Sci., 2024, 4(7), 2300328 CrossRef CAS PubMed.
- V. Amendola, P. Riello, S. Polizzi, S. Fiameni, C. Innocenti, C. Sangregorio and M. Meneghetti, J. Mater. Chem., 2011, 21, 18665 RSC.
- E. Vahabzadeh and M. J. Torkamany, J. Clust. Sci., 2014, 25, 959–968 CrossRef CAS.
- V. Amendola, M. Meneghetti, G. Granozzi, S. Agnoli, S. Polizzi, P. Riello, A. Boscaini, C. Anselmi, G. Fracasso, M. Colombatti, C. Innocenti, D. Gatteschi and C. Sangregorio, J. Mater. Chem., 2011, 21, 3803 RSC.
- W. Xie, Z. Guo, F. Gao, Q. Gao, D. Wang, B. Liaw, Q. Cai, X. Sun, X. Wang and L. Zhao, Theranostics, 2018, 8, 3284–3307 CrossRef CAS PubMed.
- P. Sharma, N. Holliger, P. H. Pfromm, B. Liu and V. Chikan, ACS Omega, 2020, 5, 19853–19860 Search PubMed.
- J. Park, K. An, Y. Hwang, J.-G. Park, H.-J. Noh, J.-Y. Kim, J.-H. Park, N.-M. Hwang and T. Hyeon, Nat. Mater., 2004, 3, 891–895 CrossRef CAS PubMed.
- X. Luo, A. H. M. Al-Antaki, T. M. D. Alharbi, W. D. Hutchison, Y. Zou, J. Zou, A. Sheehan, W. Zhang and C. L. Raston, ACS Omega, 2018, 3, 11172–11178 CrossRef CAS PubMed.
- A. Hornberg, Laser Tech. J., 2005, 2, 75–80 CrossRef.
- A. H. Attallah, F. S. Abdulwahid, Y. A. Ali and A. J. Haider, Plasmonics, 2023, 18, 1307–1323 CrossRef CAS.
- Q. Zaman, J. Souza, O. Pandoli, K. Q. Costa, V. Dmitriev, D. Fulvio, M. Cremona, R. Q. Aucelio, G. Fontes and T. Del Rosso, Opt. Express, 2019, 27, 3200 CrossRef CAS PubMed.
- A. De Bonis, T. Lovaglio, A. Galasso, A. Santagata and R. Teghil, Appl. Surf. Sci., 2015, 353, 433–438 CrossRef CAS.
- A. Sikora, D. Grojo and M. Sentis, J. Appl. Phys., 2017, 122(4), 045702 CrossRef.
- V. A. Svetlichnyi, A. V. Shabalina and I. N. Lapin, Russ. Phys. J., 2017, 59, 2012–2016 CrossRef CAS.
- V. A. Svetlichnyi, A. V. Shabalina, I. N. Lapin, D. A. Goncharova, D. A. Velikanov and A. E. Sokolov, Appl. Phys. A, 2017, 123, 763 CrossRef.
- M. J. Rivera-Chaverra, E. Restrepo-Parra, C. D. Acosta-Medina, A. Mello and R. Ospina, Nanomaterials, 2020, 10, 2099 CrossRef CAS PubMed.
- P. Kupracz, E. Coy, K. Grochowska, J. Karczewski, J. Rysz and K. Siuzdak, Appl. Surf. Sci., 2020, 530, 147097 Search PubMed.
- F. S. Abdulwahid, A. J. Haider and S. Al-Musawi, AIP Conf. Proc., 2023, 2769, 020039 CrossRef CAS.
- E. Joseph and G. Singhvi, in Nanomaterials for Drug Delivery and Therapy, Elsevier, 2019, pp. 91–116 Search PubMed.
- A. Muñoz-Labrador, M. Prodanov and M. Villamiel, Ultrason. Sonochem., 2019, 50, 74–81 CrossRef PubMed.
- Y. Yang, G. Li, X. Wang, W. Fan, G. Cheng and J. Si, Opt. Express, 2023, 31, 23589 CrossRef CAS PubMed.
- M. Bobik, I. Korus and L. Dudek, Arch. Environ. Prot., 2017, 43, 3–9 Search PubMed.
- F. Vereda, A. Martín-Molina, R. Hidalgo-Alvarez and M. Quesada-Pérez, Phys. Chem. Chem. Phys., 2015, 17, 17069–17078 RSC.
- E. Illés and E. Tombácz, J. Colloid Interface Sci., 2006, 295, 115–123 CrossRef PubMed.
- Y. T. He, J. Wan and T. Tokunaga, J. Nanoparticle Res., 2008, 10, 321–332 CrossRef CAS.
- C. Lundquist, C. Loo, I. Meraz, J. Cerda, X. Liu and R. Serda, Med. Sci., 2014, 2, 51–69 Search PubMed.
- J. M. Kinsella, S. Ananda, J. S. Andrew, J. F. Grondek, M. Chien, M. Scadeng, N. C. Gianneschi, E. Ruoslahti and M. J. Sailor, Adv. Mater., 2011, 23(36), H248–H253 CrossRef CAS PubMed.
- E. Chistè, G. Ischia, M. Scarpa and N. Daldosso, Mater. Res. Express, 2019, 6, 075006 CrossRef.
- P. Granitzer and K. Rumpf, Front. Phys., 2020, 8 DOI:10.3389/fphy.2020.00121.
- S. Gardelis, V. Gianneta and A. Nassiopoulou, J. Lumin., 2016, 170, 282–287 CrossRef CAS.
- J. F. D. F. Araujo, S. Arsalani, F. L. Freire, G. Mariotto, M. Cremona, L. A. F. Mendoza, C. Luz-Lima, Q. Zaman, T. Del Rosso, O. Baffa and A. C. Bruno, J. Magn. Magn. Mater., 2020, 499, 166300 CrossRef CAS.
- M. G. Rosmaninho, F. C. C. Moura, L. R. Souza, R. K. Nogueira, G. M. Gomes, J. S. Nascimento, M. C. Pereira, J. D. Fabris, J. D. Ardisson, M. S. Nazzarro, K. Sapag, M. H. Araújo and R. M. Lago, Appl. Catal., B Environ., 2012, 115–116, 45–52 CrossRef CAS.
- Q. Li, C. W. Kartikowati, S. Horie, T. Ogi, T. Iwaki and K. Okuyama, Sci. Rep., 2017, 7, 9894 CrossRef PubMed.
Footnote |
| † Electronic supplementary information (ESI) available. See DOI: https://doi.org/10.1039/d5ra01448d |
| This journal is © The Royal Society of Chemistry 2025 |