DOI:
10.1039/D5RA01372K
(Paper)
RSC Adv., 2025,
15, 16999-17014
Asymmetric Schiff base-based colorimetric and fluorescent sensor for Al3+ detection in real samples and live-cell bioimaging†
Received
26th February 2025
, Accepted 14th May 2025
First published on 20th May 2025
Abstract
A novel asymmetric heterocyclic Schiff base chemosensor, (E)-1-(((2-amino-5-methylpyridin-3-yl)imino)methyl)naphthalen-2-ol (AMMN), was synthesized and thoroughly characterized using microanalysis, FTIR, ESI-MS, 1H NMR, and 13C NMR. The interaction of AMMN with various metal ions was investigated via UV-visible and fluorescence spectroscopy. The sensor displayed high selectivity and a sensitive fluorescence response toward Al3+ in a DMSO/HEPES buffer solution (1![[thin space (1/6-em)]](https://www.rsc.org/images/entities/char_2009.gif) :9, v/v) at pH 7.4. The binding constant of AMMN with Al3+ was determined using the Benesi–Hildebrand plot, yielding values of 2.90 × 10³ M−1 and 9.69 × 10³ M−1 based on UV-visible and fluorescence spectroscopic analyses, respectively. The detection mechanism was identified as a 1:1 binding interaction between AMMN and Al3+, as confirmed by ESI-MS, Job plot analysis, and 1H NMR titration. The sensor exhibited excellent linearity, with low detection limits of 1.7 × 10⁻⁶ M and 5.3 × 10⁻⁷ M, as determined by UV-visible and fluorescence titration studies, respectively. Furthermore, theoretical analysis using density functional theory (DFT) was conducted to support the experimental results for both AMMN and its AMMN–Al3+ complex.
:9, v/v) at pH 7.4. The binding constant of AMMN with Al3+ was determined using the Benesi–Hildebrand plot, yielding values of 2.90 × 10³ M−1 and 9.69 × 10³ M−1 based on UV-visible and fluorescence spectroscopic analyses, respectively. The detection mechanism was identified as a 1:1 binding interaction between AMMN and Al3+, as confirmed by ESI-MS, Job plot analysis, and 1H NMR titration. The sensor exhibited excellent linearity, with low detection limits of 1.7 × 10⁻⁶ M and 5.3 × 10⁻⁷ M, as determined by UV-visible and fluorescence titration studies, respectively. Furthermore, theoretical analysis using density functional theory (DFT) was conducted to support the experimental results for both AMMN and its AMMN–Al3+ complex.
1. Introduction
In recent years, the development of artificial receptors for recognizing cationic, neutral, and anionic species has garnered significant attention due to their crucial roles in biological, environmental, and chemical processes. Among these species, the Al3+ ion, which constitutes 8.1% of the Earth's crust by mass,1 has attracted substantial research interest because of its widespread application in industries such as pharmaceuticals, electronics, paper, and textiles.2,3 Additionally, Al3+ is commonly used in household utensils, increasing the risk of continuous human exposure.4 The World Health Organization (WHO) has recommended an average daily intake of 0.15 to 0.20 mg of Al3+ for humans.5 However, despite being a non-essential element, excessive aluminum intake has been linked to severe health issues, including Alzheimer's and Parkinson's diseases, dementia, anaemia, encephalopathy, and gastrointestinal disorders.6 Due to its high natural abundance, Al3+ can enter the human body through drinking water, food, and pharmaceuticals, eventually accumulating and potentially disrupting normal nervous system functions.7,8 Therefore, reliable methods for detecting Al3+ at trace levels are essential. Various analytical techniques, including atomic absorption spectroscopy (AAS),9 inductively coupled plasma atomic emission spectroscopy (ICP-AES),10 inductively coupled plasma mass spectrometry (ICP-MS),11 electrochemical detection,12 and ion chromatography,13–17 have been employed for the quantification of Al3+ in trace concentrations. However, these methods present several limitations, such as high costs, lack of on-site detection capability, extensive sample pre-treatment requirements, complex operational procedures that demand trained personnel, and limited sensitivity, which hinder their practical applications.18
Colorimetric and fluorescent chemosensors have emerged as valuable alternatives for detecting metal ions due to their advantages, including simplicity, high sensitivity and selectivity, cost-effectiveness, rapid response times, and adaptability.19,20 Additionally, these chemosensors play a vital role in biological applications, as they enable the detection of various biochemical parameters in living cells, including intracellular pH, anions, cations, biomolecules, and cell viability.21–23
Among the different types of chemosensors, Schiff base-based sensors are particularly promising due to their straightforward synthesis, tunable structure–function relationships, and excellent solubility in solutions, making them highly suitable for practical applications.24–41
In line with this objective, we have designed and synthesized a novel Schiff base-based small-molecule sensor with high selectivity and ultra-trace sensitivity for fluorescent and colorimetric detection of Al3+ in living cells and real water samples.
2. Experimental
2.1 Materials and instruments
The details of the reagents and instruments used in this study are provided in the ESI.†
2.2 Synthesis and characterization of Schiff base ligand (AMMN)
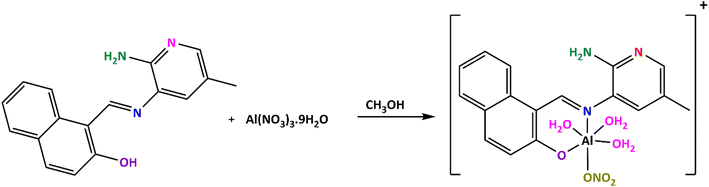
The Schiff base AMMN ligand was synthesized as outlined in Scheme 1. First, to a hot 10 mL solution of 5-methylpyridine-2,3-diamine (10 mmol, 1.2316 g) in dry ethanol, 10 mL ethanolic of 1-hydroxy-2-naphthaldehyde (10 mmol, 1.7218 g) was added drop wisely. The mixture was sequentially stirred continuously for 3 hours at 70 °C. Afterward, the solvent was eliminated under reduced pressure, and the purified product was separated by recrystallization from 2-propanol. AMMN was subjected to further purification by gradient silica gel column chromatography using a CHCl3–EtOH solvent system. The final product was recrystallized from 2-propanol, yielding yellow crystals with a 79.8% yield. Elemental analysis calcd. for C17H15N3O (277.32): H, 5.45; C, 73.63; N, 15.15%; found: C, 73.59; H, 5.51; N, 15.35%.
 |
| | Scheme 1 Synthesis of (E)-1-(((2-amino-5-methylpyridin-3-yl)imino)methyl)naphthalen-2-ol (AMMN). | |
2.3 Synthesis of solid AMMN–Al3+ complex
The AMMN–Al3+ complex was synthesized by refluxing AMMN (10 mmol, 20 mL) and Al(NO3)3·9H2O (10 mmol, 20 mL) in absolute ethanol for 1 hour (Scheme 2). After cooling and filtration, the mixture was washed (sequentially with water, ethanol, ether), followed by vacuum drying over anhydrous CaCl2. The complex was isolated as a bright yellow solid. Yield: %78, m.p. > 300 °C. Elemental analysis calcd. for C17H20N4O7Al (419.34): C, 48.69; H, 4.81; N, 13.36%; found: C, 47.99.59; H, 4.68; N, 13.45%.
 |
| | Scheme 2 Synthesis of AMMN–Al3+ complex. | |
2.4 General procedure for photophysical measurements
A 1 mM stock solution of AMMN was prepared by dissolving 2.7732 mg in 10 mL of DMSO/HEPES buffer (1:9 v/v, pH 7.4). Various metal ion solutions (1 mM) were prepared by dissolving appropriate wight of their nitrate's salts in Millipore water. For various spectral measurements, a precise volume of 25 μL of AMMN (1 mM) was carefully taken from the stock solution and diluted to a final volume of 3 mL using HEPES buffer, ensuring a consistent pH environment for the experiment. Subsequently, 25 μL of a 1 mM solution of the selected cation was introduced into the mixture to study its interaction with AMMN. The total volume was then adjusted to 5 mL by adding additional HEPES buffer, maintaining uniform dilution conditions across all samples. After thorough mixing, both UV-vis absorption and fluorescence spectra were recorded to analyze the spectral changes induced by the presence of the cation. This procedure facilitated the investigation of the electronic and photophysical properties of AMMN in the presence of different metal ions.
2.5 Effect of pH
The influence of pH on the photophysical properties of AMMN and the AMMN–Al3+ complex was evaluated using UV-vis absorption (λmax = 375 nm) and fluorescence (λem = 503 nm) spectroscopy. The HEPES buffer was adjusted to pH 2–12 using HCl and NaOH.
2.6 Effect of response time
The response time of 5 μM AMMN was evaluated in presence of Al3+ ions (5 μM) at 10 seconds intervals over a period of 2 minutes.
2.7 Effect of response time
The response time of AMMN (5 μM) in the presence of Al3+ ions (5 μM) was monitored at 10 seconds intervals over 2 minutes to assess the sensor's reaction speed.
2.8 Job plot analysis
To determine the binding stoichiometry between AMMN and Al3+, solutions containing AMMN (5 μM) and Al(NO3)3·9H2O (5 μM) in DMSO/HEPES buffer (1:9 v/v) were prepared. The mole fraction of Al3+ was varied from 0.1 to 0.9, maintaining a total volume of 2 mL. After shaking for 30 seconds, the solutions were analyzed using UV-vis absorption and fluorescence spectroscopy at room temperature.
2.9 Calibration curve
The absorption and fluorescence responses of AMMN (0.1 mg mL−1) to Al3+ (5–60 μM) were recorded using UV-vis absorption and fluorescence titrations in DMSO/HEPES buffer (1:9 v/v, pH 7.4) to establish a calibration curve.
2.10 Competitive experiments
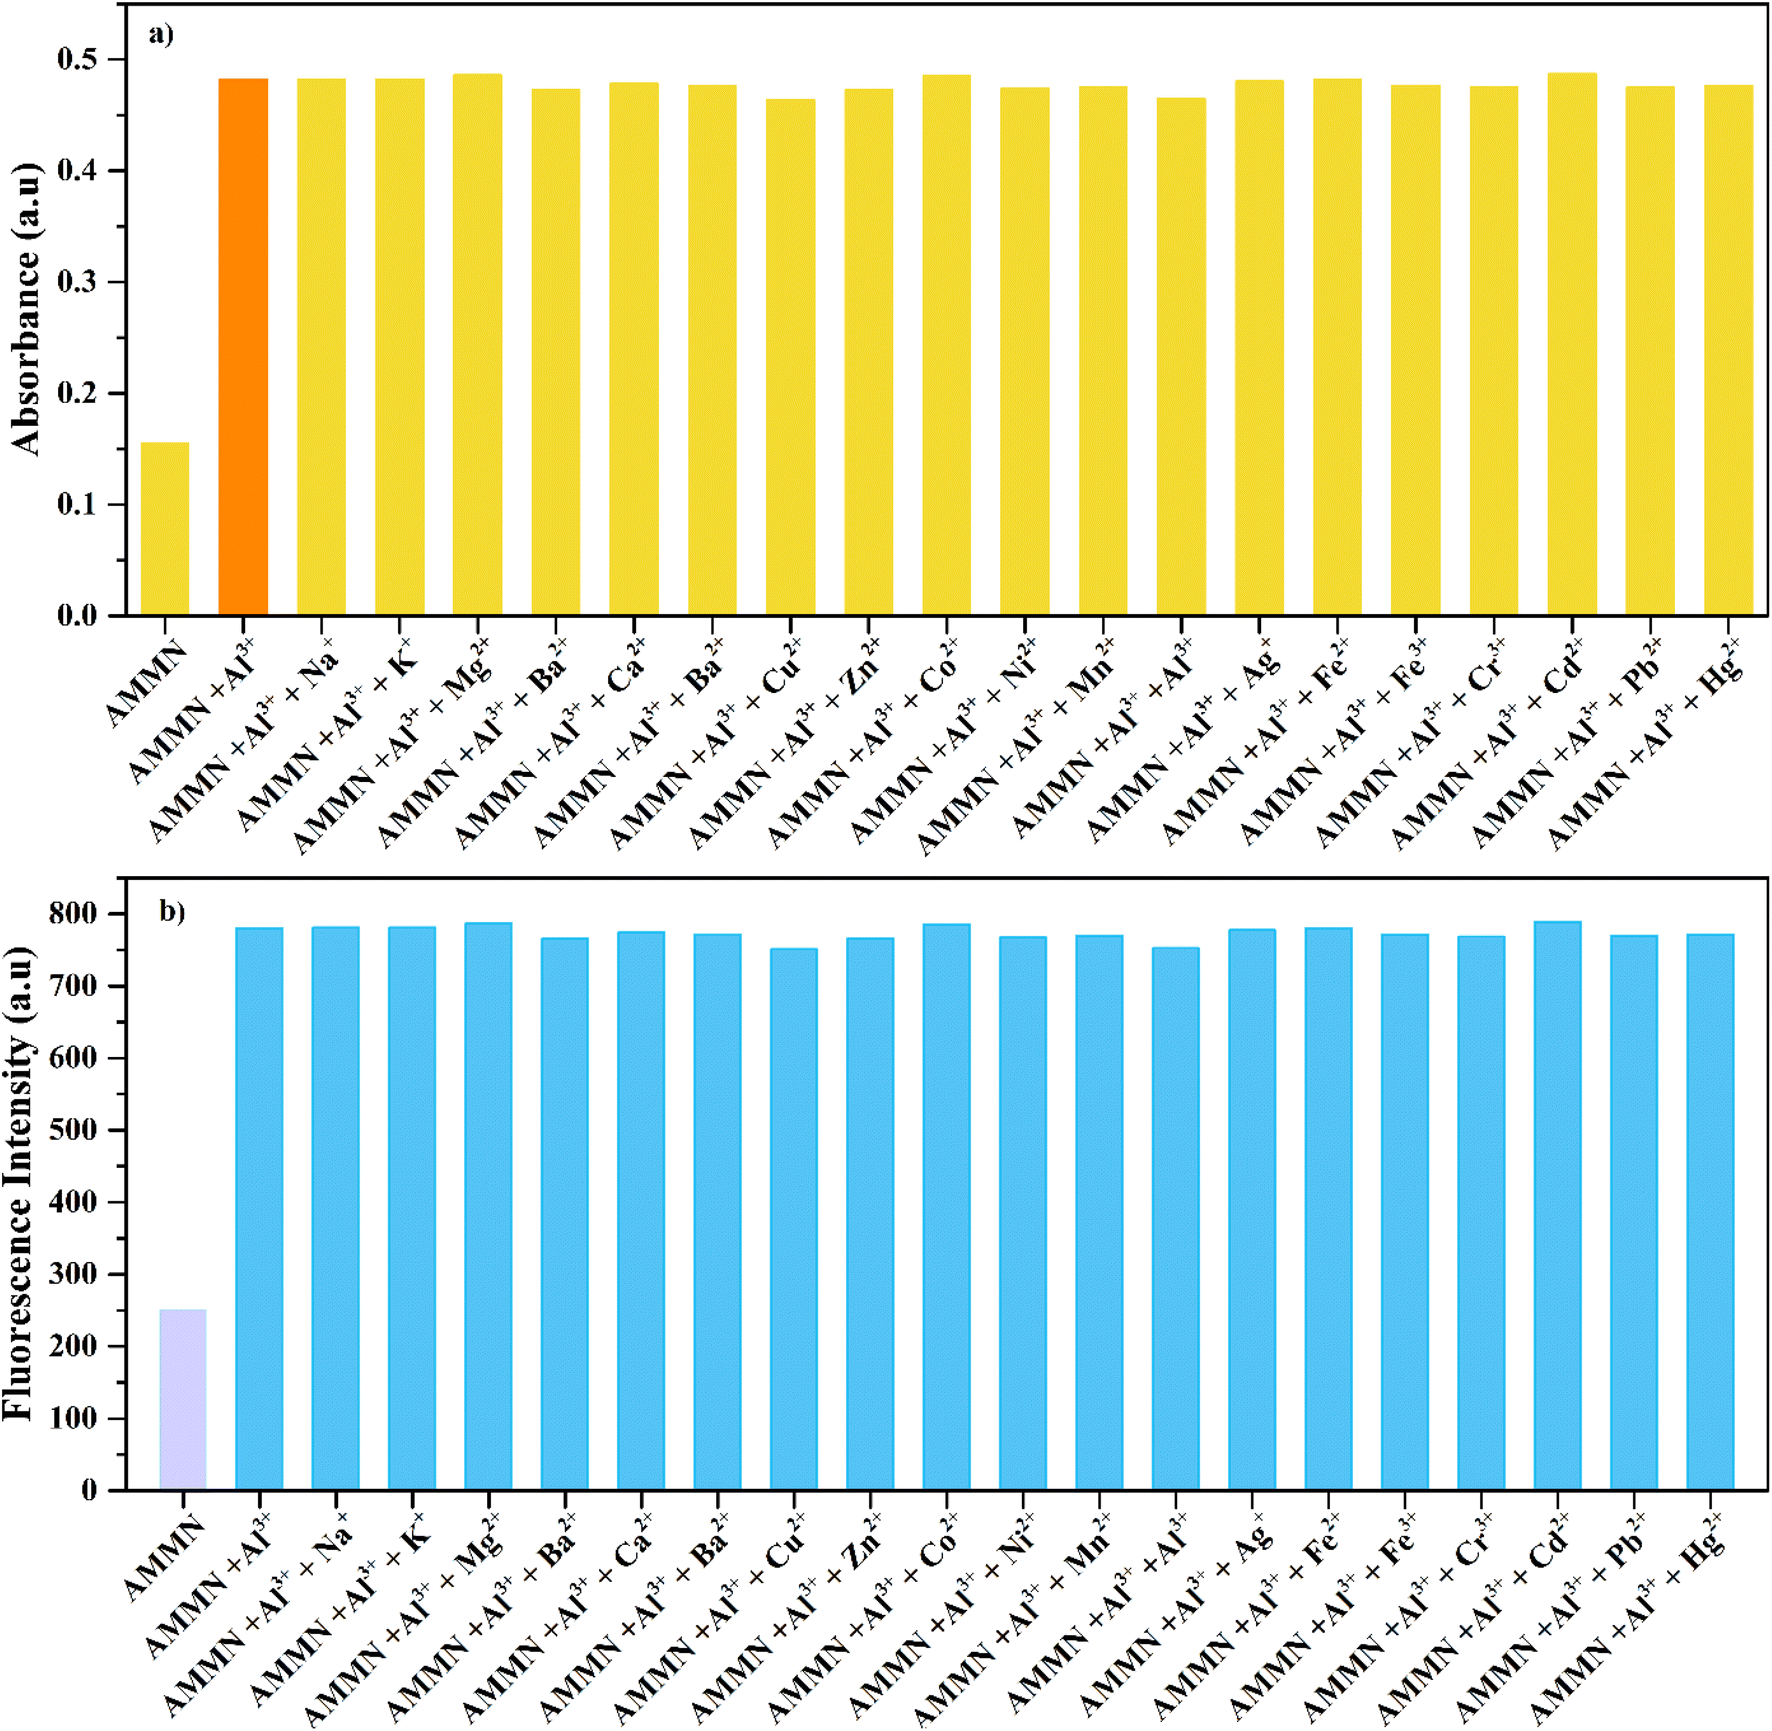
To evaluate potential interference from other metal ions, absorbance and fluorescence studies were conducted at room temperature. First, AMMN (1 μM) was mixed with Al3+ (5 μM) in DMSO/HEPES buffer (1:9 v/v, pH 7.4). Then, 100 equiv. of various competing metal ions (Na+, K+, Mg2+, Ca2+, Sr2+, Ba2+, Cu2+, Zn2+, Co2+, Ni2+, Mn2+, Ag+, Fe2+, Fe3+, Cd2+, Pb2+, Hg2+) were added to assess their interference in the AMMN–Al3+ interaction.
2.11 Reversibility of sensor AMMN for Al3+
The reversibility of the chemosensor AMMN was tested by titrating the AMMN–Al3+ solution with Na2EDTA chelating agent. The experiment was conducted using one equivalent of Na2EDTA solution to assess the coordination reversibility of the AMMN–Al3+ complex.
2.12 Fluorescence quantum yield experiment
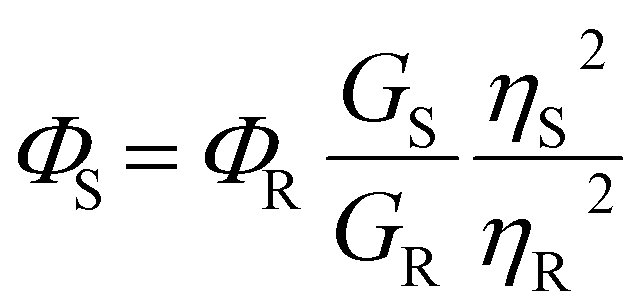
The fluorescence quantum yield of AMMN, both before and after complexation with Al3+, was determined using quinine sulfate in 0.1 M H2SO4 as a reference,42 which has a known quantum yield (Φ) of 0.577.43 The calculation was performed using eqn (1):| |
 | (1) |
where Φ and G are the quantum yield, and the gradient (slope), respectively, obtained by plotting integrated fluorescence intensity against absorbance values. The subscripts S and R refer to the sample and the reference, respectively.44,45 The solvents' refractive index, η, were determined using Milton Roy, Inc refractometer.
2.13 1H NMR titration of AMMN with Al3+ ions
For the 1H NMR titration, a solution of AMMN (2.7732 mg, 1 × 10⁻⁵ mol) in DMSO-d6 (2.0 mL) was prepared and then divided equally into four NMR tubes. Sequentially, to each tube, 0, 0.5, 1.0, 1.5, and 2.0 equiv. of Al3+ ions in deuterated dimethyl sulfoxide (1.0 mL) were added. After stirring each mixture for 30 seconds, their 1H NMR spectra were recorded.
2.14 Analysis of real water samples
To evaluate the practical application of AMMN, Al3+ ion detection was conducted in various real water samples, including distilled and tap water. A standard amount of Al3+ ions were added to the samples. The UV absorption and fluorescence intensity were measured using a UV-vis spectrometer and fluorescence spectrometer, respectively. The concentrations of Al3+ ions in the water samples were then calculated using the standard linear equation.
3. Results and discussion
3.1 Characterization of AMMN
The structure of AMMN was confirmed using elemental analysis, ESI-MS, FT-IR, 1H NMR, and 13C NMR techniques. Additionally, the AMMN–Al3+ complex was synthesized in the solid state, as depicted in Scheme 2. The molar conductivity (Λm) of the synthesized Al3+ complex was measured in DMSO at a concentration of 1 × 10⁻³ M, yielding a conductivity value of 38.66 Ω−1 cm2 mol−1, which indicates its non-electrolytic nature.46
3.2 Selectivity study of AMMN towards Al3+ ion
The UV-visible absorption spectra of synthesized AMMN (1 μM) in DMSO/HEPES buffer solution (1:9 v/v, pH 7.4) exhibited two absorption maxima at 261 nm, 320 nm, and 364 nm, corresponding to the π → π* and n–π* electronic transitions47 of the naphtholic and CH![[double bond, length as m-dash]](https://www.rsc.org/images/entities/char_e001.gif) N chromophores, respectively.48 The metal recognition ability of AMMN was examined by adding various biologically and environmentally relevant metal ions (5 μM), including Na+, K+, Mg2+, Ca2+, Sr2+, Ba2+, Cu2+, Al3+, Co2+, Zn2+, Mn2+, Ni2+, Fe2+, Ag+, Fe3+, Cd2+, Hg2+, and Pb2+. Spectra were recorded after the addition of these metal ions. It was observed that no significant optical change was detected upon the addition of various metal ions, except for a visually discernible color change from very pale yellow to intense yellow in the presence of Al3+ ions, accompanied by a redshift in AMMN absorption bands (Fig. 1a). These results confirm that AMMN is highly selective for Al3+ in a DMSO/HEPES buffer solution (1:9, v/v, pH 7.4).
N chromophores, respectively.48 The metal recognition ability of AMMN was examined by adding various biologically and environmentally relevant metal ions (5 μM), including Na+, K+, Mg2+, Ca2+, Sr2+, Ba2+, Cu2+, Al3+, Co2+, Zn2+, Mn2+, Ni2+, Fe2+, Ag+, Fe3+, Cd2+, Hg2+, and Pb2+. Spectra were recorded after the addition of these metal ions. It was observed that no significant optical change was detected upon the addition of various metal ions, except for a visually discernible color change from very pale yellow to intense yellow in the presence of Al3+ ions, accompanied by a redshift in AMMN absorption bands (Fig. 1a). These results confirm that AMMN is highly selective for Al3+ in a DMSO/HEPES buffer solution (1:9, v/v, pH 7.4).
 |
| | Fig. 1 (a) Absorption spectral changes of AMMN (1 μM) upon interaction with various metals (5 μM) in DMSO/HEPES buffer solution (1:9, v/v, pH 7.4) (inset: Color change observed in the AMMN solution after treatment with Al3+). (b) Emission spectral changes of AMMN (5 μM) with (5 μM) of other metal ions in DMSO/HEPES buffer solution (1:9, v/v, pH 7.4), with an excitation wavelength 375 nm (inset: Fluorescence emission change observed in the AMMN solution after treatment with Al3+). | |
To further confirm the selectivity of AMMN (1 μM) towards Al3+ and other metal ions (5 μM), the fluorescence behavior of AMMN was investigated in DMSO/HEPES buffer solution (1:9, v/v, pH 7.4). The fluorescence spectra of AMMN exhibited weak emission intensity with a maximum at 503 nm (excitation wavelength: 375 nm) due to photo-induced electron transfer (PET) and CN isomerization. As shown in Fig. 1b, upon the addition of Al3+ ions, the fluorescence intensity of AMMN was significantly enhanced, while the addition of other competitive metal ions showed no significant changes in fluorescence spectra. This drastic fluorescence enhancement is attributed to chelation-enhanced fluorescence emission and CN isomerization inhibition. Consequently, AMMN functions as an excellent fluorescent chemosensor for Al3+ ions.
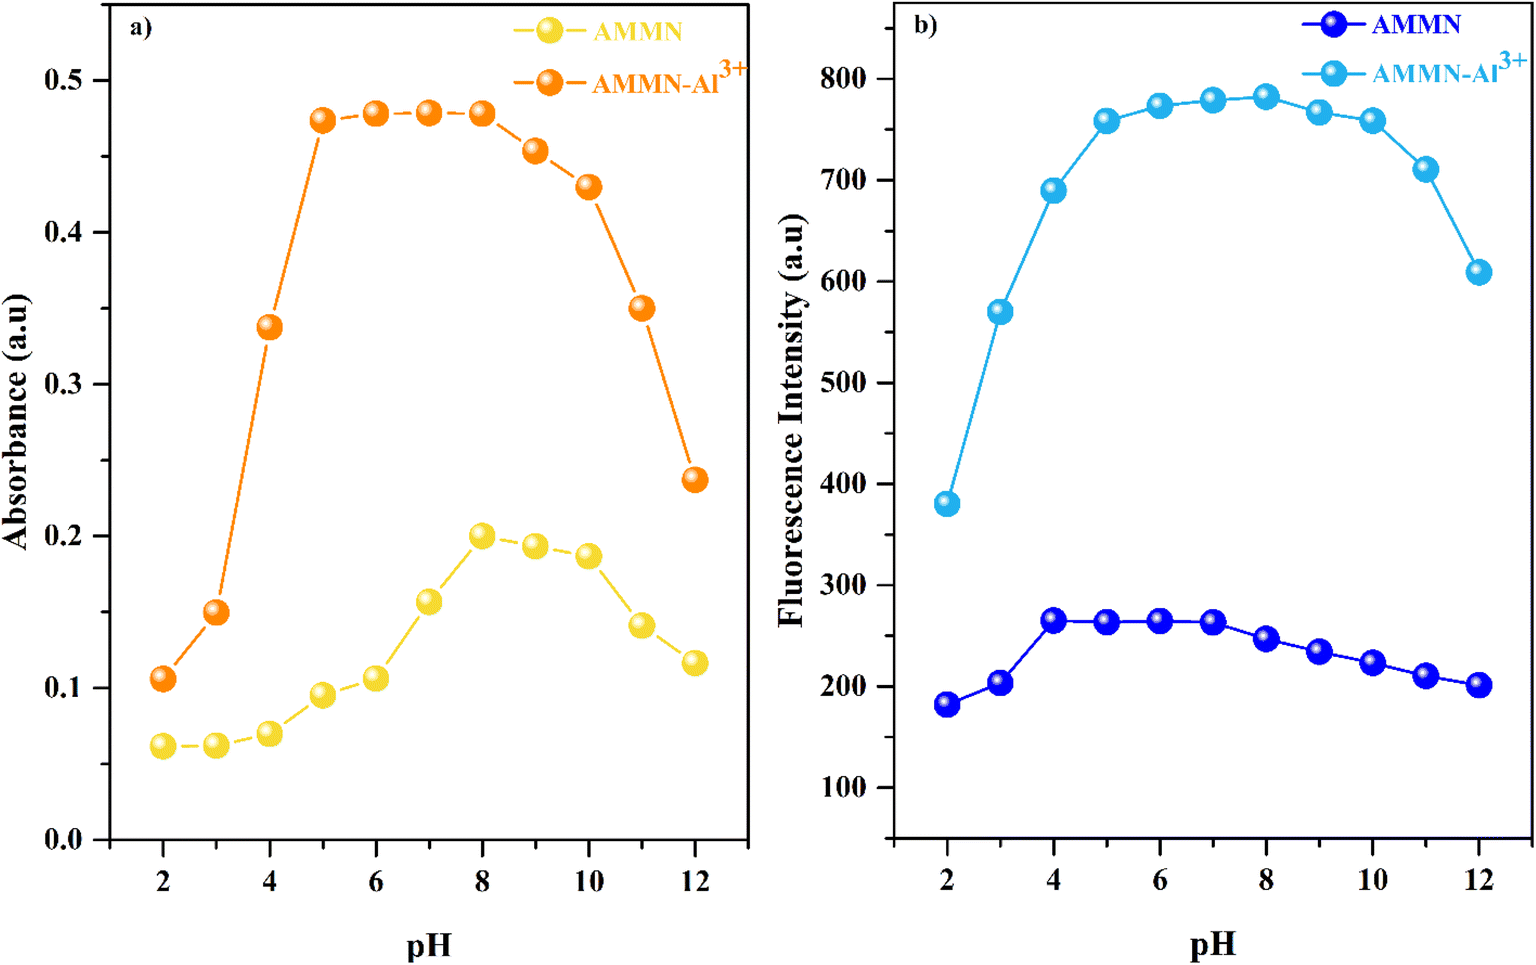
3.3 pH profile of AMMN
To further investigate the optimal pH range for AMMN, a series of AMMN and AMMN–Al3+ solutions at different pH values were prepared, and their UV-vis absorption and fluorescence spectra were recorded (Fig. 2). The absorbance at 375 nm and fluorescence intensity at 503 nm of free AMMN were low across a wide pH range (2–12). However, from pH 4 to 8, the absorbance intensity of AMMN–Al3+ was significantly higher than that of AMMN alone and remained nearly constant. Meanwhile, the fluorescence intensity at 503 nm of the AMMN–Al3+ solution increased notably and stayed consistent between pH 5 and 8. These findings indicate that AMMN can be used as an Al3+ sensor over a wide pH range of 4–8 via UV-vis absorption measurements, and as an Al3+ sensor over a pH range of 5–8 through fluorescence measurements.
 |
| | Fig. 2 Impact of pH on AMMN (5 μM) (a) absorption intensity in absence and presence of Al3+ ions; (b) fluorescence intensity in absence and presence of Al3+ ions. | |
3.4 Response time
To better study the reaction of AMMN in the presence of Al3+, we examined the kinetics of AMMN and Al3+ by analyzing the response time of AMMN towards Al3+. Response time is a crucial analytical feature of a sensor. To evaluate this, the time-dependent colorimetric and fluorometric response of AMMN (5 μM) towards Al3+ ions (1.0 equiv.) was measured in a DMSO/HEPES buffer (1:9 v/v, pH 7.4) solution. As displayed in Fig. 3, the addition of Al3+ ions led to a rapid increase in absorbance at 375 nm (ca. 30 s) and fluorescence intensity at 503 nm (ca. 30 s), which then remained stable thereafter. This indicates a rapid response time and strong binding between AMMN and Al3+, making it suitable for practical applications.
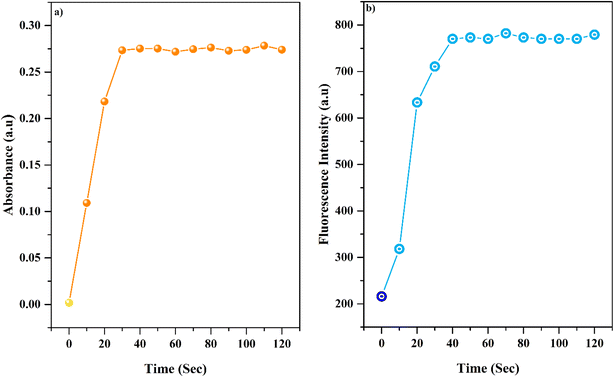 |
| | Fig. 3 (a) Response time–absorbance profile of AMMN (5 μM) after the addition of Al3+ ions (1.0 equiv.) in a DMSO/HEPES (1:9 v/v, pH = 7.4) solution; (b) response time–fluorescence profile of AMMN (5 μM) after the addition of Al3+ ions (1.0 equiv.) in a buffer solution (1:9 v/v, pH 7.4). | |
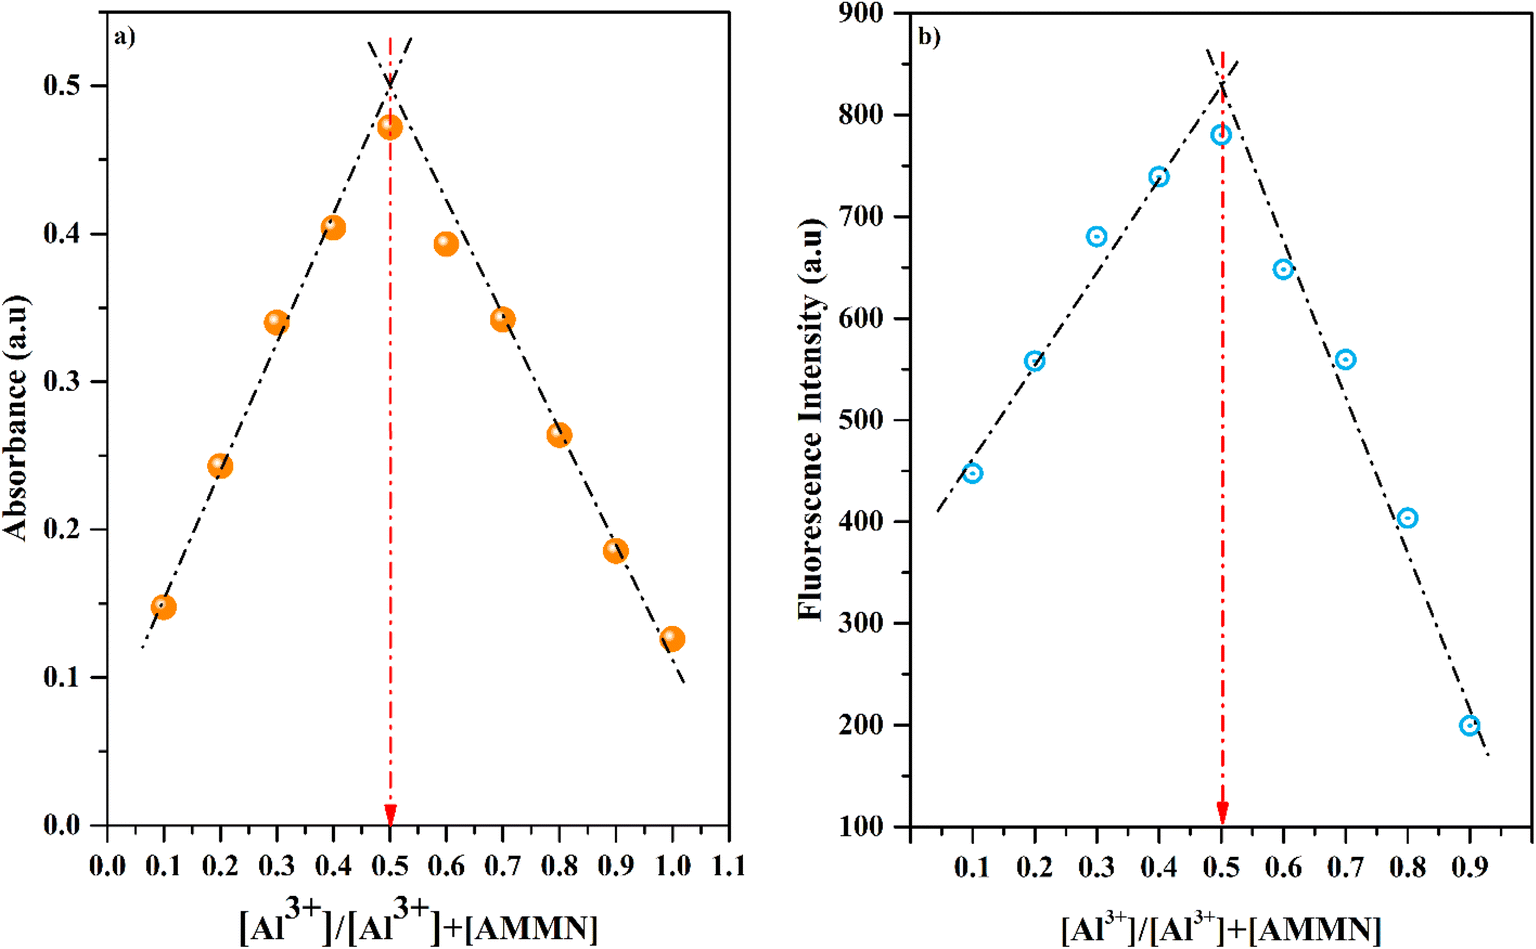
3.5 Job plot studies
To figure out the binding stoichiometry between AMMN and Al3+, a Job's plot analysis was conducted36,49 (Fig. 4) by varying the molar fraction of AMMN and Al3+ while maintaining a fixed total concentration. The highest absorbance and fluorescence intensity were observed at a molar fraction of 0.5, indicating the formation of a 1:1 binding complex between AMMN and Al3+.
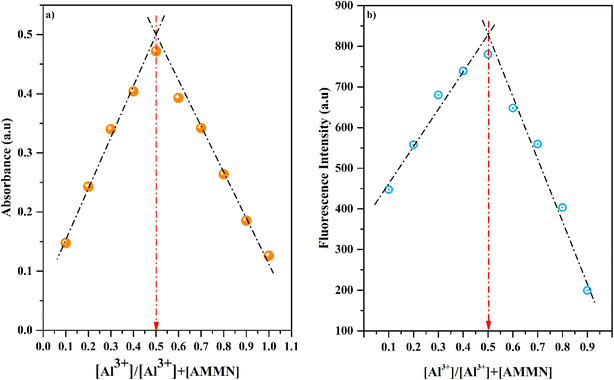 |
| | Fig. 4 Job's plot analysis: (a) Absorbance at λmax = 375 nm as a function of the mole fraction of the Al3+ ion ([Al3+] = [AMMN] = 20 μM); (b) Fluorescence intensity at λem = 503 nm as a function of the mole fraction of the Al3+ ion ([Al3+] = [AMMN] = 5 μM). | |
3.6 Sensitivity studies
The colorimetric sensitivity of AMMN towards Al3+ was further examined through UV-vis and fluorometric titrations in a DMSO/HEPES buffer solution (1:9 v/v, pH 7.4). The limit of detection (LOD) for Al3+ ions was determined by treating a 5 μM AMMN solution with increasing concentrations of Al3+ ions ranging from 5 to 60 μM in UV-vis measurements at 375 nm and from 1 to 15 μM in fluorescence measurements at 503 nm (Fig. 5).
 |
| | Fig. 5 The spectra and linear relationships between of (a and b) absorbance of AMMN (5 μM) at 375 nm after treatment of Al3+ ions with increasing concentrations from 5–60 mM; (c) and (d) Fluorescence intensity emission of AMMN (1 μM) at 503 nm after treatment with increasing Al3+ concentrations from 1 to 15 μM at room temperature. | |
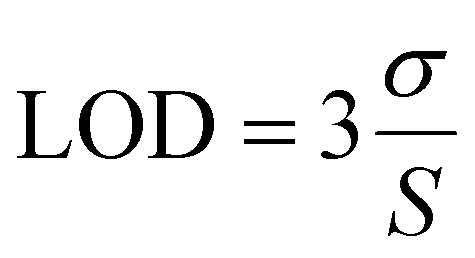
A calibration curve was generated by plotting the absorbance and fluorescence intensity values against the Al3+ ion concentrations (Fig. 5). Based on this analysis, the LOD values were calculated as 1.7 μM for UV-vis measurements and 0.53 μM for fluorescence measurements, using eqn (2).
| |
 | (2) |
Here,
S and
σ represent the slope and the standard deviation (SD) of
Y-intercept of the calibration plots. This study clearly demonstrates that AMMN exhibits excellent linearity, and lower limit of detection (LOD) for both UV-vis and fluorometric measurements. The data has shown the best sensitivity of fluorescence sensing strategy over colorimetric technique; therefore, we concern our further measurements on fluorescence technique for measuring Al
3+ concentration.
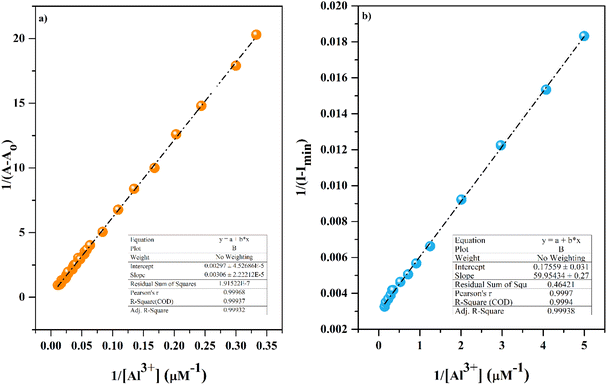
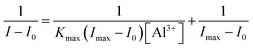
3.7 Binding constant calculation
The binding constant (K) for the AMMN–Al3+ complex was determined using the Benesi–Hildebrand equation (eqn (3)).50| |
 | (3) |
Here, A0 and A represent the absorbance of AMMN in the absence and presence of the Al3+ ion, respectively. Amax is the saturated absorbance of AMMN in the presence of excess Al3+ ions. Plotting 1/(A – A0) against 1/[Al3+] resulted in a linear relationship (Fig. 6a), and the binding constant (K) was calculated to be 2.90 × 10³ M−1.
 |
| | Fig. 6 Benesi–Hildebrand plot analysis of Al3+ with AMMN from (a) UV-vis spectroscopy; (b) Fluorescence spectroscopy. | |
Fluorescence emission studies were also used to assess the binding affinity of AMMN with Al3+. Fluorescence emission spectra were recorded for AMMN as the concentration of Al3+ ions were gradually increased in DMSO/HEPES buffer solution (1:9 v/v, pH 7.4). Initially, AMMN (5 μM) showed fluorescence intensity at 503 nm, which progressively enhanced as Al3+ concentration increased from 0 to 5 μM. The binding constant (Kmax) for the AMMN–Al3+ interaction was determined via a modified Benesi–Hildebrand equation51 (eqn (4)) as follows:
| |
 | (4) |
Herein, I0, I, and Imax are the emission intensities (at 503 nm) of AMMN probe in the absence, presence, and at a concentration of complete interaction, of Al3+ ion, respectively. The binding constant Kmax of AMMN–Al3+ was evaluated to be 9.69 × 10³ M−1 (Fig. 6b).
3.8 Interference study of over other competitive metal ions
To further investigate the impact of potential metal ions interferents on AMMN's detection of Al3+ ions, the response of AMMN to Al3+ was measured in the presence of various metal ions within a DMSO/HEPES buffer solution (1:9 v/v, pH 7.4). The data presented in Fig. 7 demonstrate that AMMN's fluorescence response to Al3+ remains unaffected by the presence of other metal ions, including Na+, K+, Mg2+, Ca2+, Sr2+, Ba2+, Cu2+, Zn2+, Mn2+, Co2+, Ni2+, Ag+, Fe2+, Fe3+, Cd2+, Pb2+, and Hg2+. This implies that AMMN demonstrates outstanding selectivity for Al3+ and can serve as a selective chemosensor for Al3+ even in the presence of other metal ions. While the choice of competing ions based upon likely abundance in environmental/biological samples is very reasonable, we were curious to see how the sensor would respond to other trace trivalent metal ions, such as Sc3+, La3+, Y3+, In3+ and Ga3+. The results have shown that, no observable change was detected in both absorption spectra and fluorescence spectra (Fig. S1†), which may be assigned to their difficult to coordinate with the sensor under mild conditions due to larger ionic radii of Sc3+, La3+, Y3+ ions, cutting down their ability to form stable chelates with Schiff bases, which typically coordinate through imine (–CN) nitrogen and phenolic oxygen. On the other hand, both In3+ and Ga3+ exhibit lower Lewis acidity, leading to weaker interactions with Schiff bases that rely on π-back bonding or stronger metal–ligand interactions.
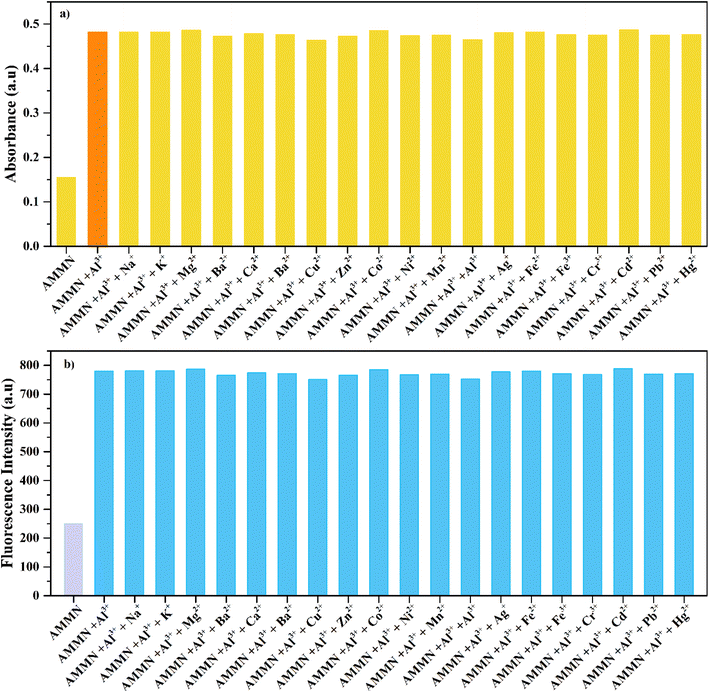 |
| | Fig. 7 (a) Absorbance response of AMMN (5 μM) toward Al3+ (5 μM) in the absence and presence of other metal ions (100 equiv.) in DMSO/HEPES (1:9 v/v, pH 7.4); (b) Fluorescence response of AMMN (5 μM) toward Al3+ (5 μM) in the absence and presence of other metal ions (100 equiv.) in DMSO/HEPES (1:9 v/v, pH 7.4, λem 503 nm). | |
3.9 Binding reversibility
Reversibility is a key feature required to satisfy the needs of advanced chemosensors. As illustrated in Fig. 8, the initial fluorescence intensity of AMMN at 503 nm increased upon the addition of Al3+. Because of EDTA's strong affinity for metal ions, it was expected that the addition of Na2EDTA would release Al3+ from the AMMN–Al3+ complex. After adding Na2EDTA to the AMMN–Al3+ complex, the fluorescence was restored. The fluorescence changes remained reversible even after multiple cycles of sequentially adding Al3+ and EDTA, demonstrating that AMMN can serve as an effective reversible sensor for detecting Al3+. This result indicates that the assay can be used in a variety of real samples due to EDTA's strong ability to mask metal ions.
 |
| | Fig. 8 Reversible changes in (a) absorbance and (b) fluorescence intensity of AMMN after the sequential addition of Al3+ and Na2EDTA. | |
3.10 Binding mode and sensing mechanism of AMMN with Al3+
The enhancement in fluorescence of AMMN in the presence of Al3+ is attributed to complex formation, that restricts cis–trans interconversion by hindering the rotation around the CN bond. This effect could also be explained by mechanisms such as chelation-enhanced fluorescence (CHEF) and CN isomerization (Scheme 3).
 |
| | Scheme 3 A possible reaction mechanism of AMMN to Al3+. | |
To confirm the formation of the AMMN–Al3+ complex, FT-IR spectra, ESI-mass spectra and 1H NMR titration were analysed, revealing characteristic structural changes that occur upon interaction of AMMN with Al3+.
The interaction between AMMN and Al3+ was further examined using FT-IR spectroscopy, which highlighted significant spectral differences between the free AMMN sensor and its Al3+ complex within the range of 4000–400 cm−1 (Fig. 9). The FT-IR spectrum of AMMN displayed distinct broad band at 3400 cm−1 which can be assigned for νOH group. The broadness of OH band may be arisen from, intramolecular hydrogen bonded through a pair of N–H⋯O.52 Complexation with Al3+ deprotonates the OH group, leading to the disappearance of νOH band, which is not observed in IR spectrum of complexes due to existence of coordinated water molecules. The disappearance of the in-plane O–H bending vibration peak at 1295 cm−1 in free AMMN indicates the coordination of Al3+ ions through phenolic ortho-oxygen atoms, a common coordination mode observed in transition metal complexes of o-hydroxy Schiff bases.53 The stretching frequency of νCN for the free AMMN appeared at 1623 cm−1. However, when AMMN coordinated with Al3+, a charge transfer from CN to Al3+ occurred, resulting in a significant shift of the IR peak for to 1618 cm−1. Furthermore, two peaks at 3184 and 3154 cm−1, corresponding to NH2 stretching modes,54 and a peak at 1623 cm−1, attributed to CN stretching, were observed. After complexation with Al3+, a broad band reappeared at 3375 cm−1 due to coordinated water, and the NH2 stretching peaks became more distinct with a slight shift. The coordination of the Schiff base sensor was further confirmed by the appearance of weak, non-ligand peaks at 499 and 420 cm−1, corresponding to the formation of Al–O and Al–N bonds, respectively.
 |
| | Fig. 9 FT-IR spectrum of AMMN and AMMN–Al3+ complex. | |
To further validate the 1:1 complexation mode between AMMN and Al3+, an ESI-mass analysis was conducted (Fig. 10). The positive ion mass spectrum of the ligand displayed a peak at m/z 277.31. Upon the addition of 1.0 equiv. of Al3+, two distinct signals emerged at m/z 419.03 and 365.12, corresponding to the parent peaks of the [AMMN + Al3+ + NO3− + 3H2O] and [AMMN + Al3+ + NO3−] complexes, respectively.
 |
| | Fig. 10 Positive-ion ESI-mass spectrum of AMMN (50 μM) upon addition of Al3+ (1.0 equiv.). | |
To gain a deeper understanding of the reaction mechanism between AMMN and Al3+ ions, a 1H NMR titration experiment was conducted. As illustrated in Fig. 11, the addition of 1.0 equiv. of Al3+ to an AMMN solution in DMSO-d6 resulted in the disappearance of the signal at δ 13.14 ppm, which corresponds to the phenolic proton (OH) in the naphthylidene moiety and is linked to intramolecular hydrogen bonding of the (OH/N or O/HN) type.55 This disappearance confirms that AMMN interacts with Al3+ through the deprotonation of the phenolic proton. Additionally, the singlet for the CHN proton shifted from δ 8.84 ppm to 9.89 ppm. Moreover, all aromatic proton multiplet signals of AMMN experienced slight shifts upon complexation with Al3+, suggesting alterations in the chemical environment due to complex formation.
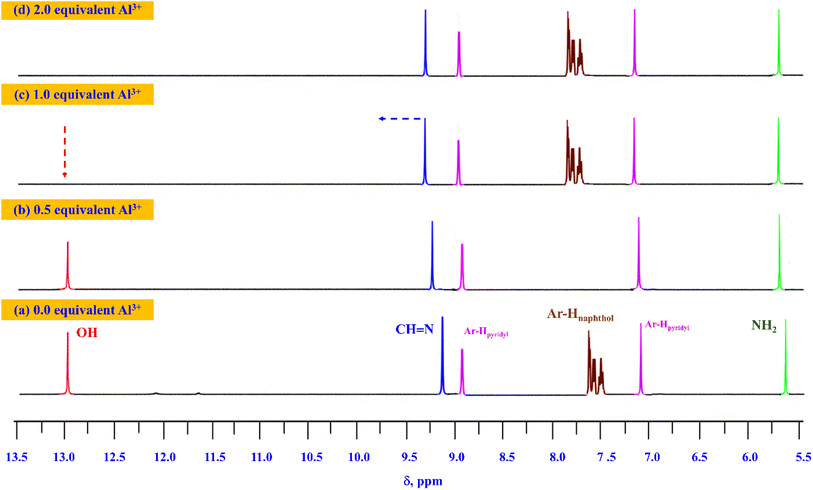 |
| | Fig. 11 1H NMR spectra of AMMN (5 μM) after addition of (a) 0 equiv.; (b) 0.5 equiv.; (c) 1 equiv. and (d) 2 equiv. of Al3+ ions. | |
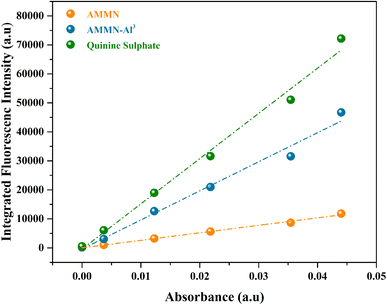
3.11 Quantum yield and TCSPC studies
Quantum yield (Φ) measurements (Fig. 12) reveal that AMMN exhibits weak emission with a quantum yield of 0.0204. However, upon complexation with Al3+, the quantum yield of the AMMN–Al3+ complex significantly increases to 0.07169. This fourfold enhancement in emission intensity is attributed to the chelation-enhanced fluorescence (CHEF) effect, resulting from the binding of Al3+ to AMMN.
 |
| | Fig. 12 Plot of integrated fluorescence intensity versus absorbance for AMMN and its AMMN–Al3+ complex. | |
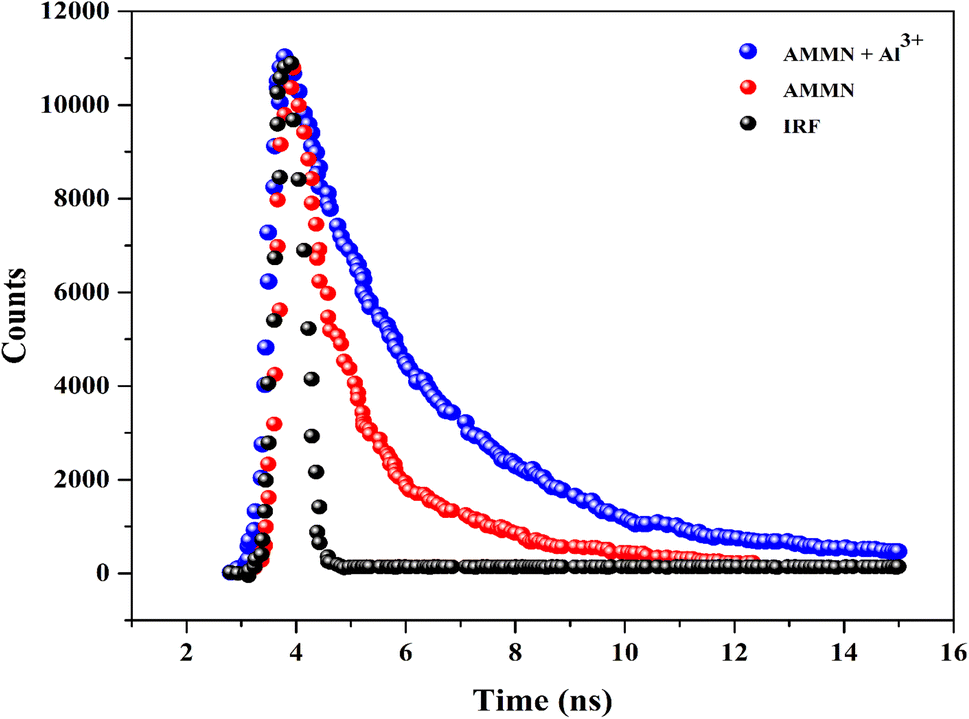
Time-correlated single-photon counting (TCSPC) was employed to determine the fluorescence lifetimes of AMMN and its Al3+ complex. This method is more sensitive than steady-state fluorescence measurements, as it is independent of fluorophore concentration and excitation intensity. Additionally, it provides insights into the sensing mechanism of AMMN toward Al3+ ions (Fig. 13). Both samples were excited at 375 nm, and fluorescence data were recorded at 503 nm. The calculated intensity-averaged fluorescence lifetimes (τf) of sensor AMMN and the AMMN–Al3+ ion complex are 1.44 ns and 2.55 ns. This indicates the presence of both non-radiative conformational relaxation and radiative relaxation in the excited-state molecules. The increase in average lifetime, along with a substantial rise in fluorescence intensity upon adding one equivalent of Al3+ ion, results from chelation between Al3+ and sensor AMMN.56 This chelation enhances structural rigidity as well as restricts free rotation of the complex, leading to a CHEF (chelation-enhanced fluorescence) effect by forming a stable complex and suppressing PET (photoinduced electron transfer).
 |
| | Fig. 13 Time-resolved fluorescence decay profile of AMMN probe and AMMN–Al3+. | |
3.12 Molecular DFT calculation
Theoretical molecular geometry evaluations provide valuable insights into the three-dimensional structures of compounds. Frontier molecular orbitals (FMOs), LUMO and HOMO, are very crucial one to forecast the reactivity of a molecule.57 All compounds were optimized at the B3LYP/6-311++G (d,p) level of DFT.58 The HOMO–LUMO energy levels of the free ligand AMMN and its Al3+ complex are key factors in electronic transitions. The energy gap between these orbitals provides insights into molecular reactivity, where smaller gaps indicate higher reactivity, and larger gaps correspond to increased stability.59
The optimized geometries of the AMMN sensor and its AMMN–Al3+ complex is illustrated in Fig. 14. As shown in Fig. 14, the HOMO of AMMN is primarily localized on part of the pyridine moiety and slightly on the naphthaldehyde moiety, while the LUMO is spread across both the pyridine and naphthaldehyde groups. For the AMMN–Al3+ complex, however, the HOMO is mainly concentrated on the pyridine moiety, with the LUMO located on the naphthaldehyde group. The calculated energy gap between the HOMO and LUMO for AMMN and the AMMN–Al3+ complex is 3.873 eV and 1.796 eV, respectively. This reduction in the energy gap upon Al3+ binding indicates that Al3+ coordination stabilizes the system, enhancing chelation as expected.
 |
| | Fig. 14 Energy diagram and Frontier molecular orbitals of AMMN and AMMN–Al3+ derived from DFT calculations performed with Gaussian 09. | |
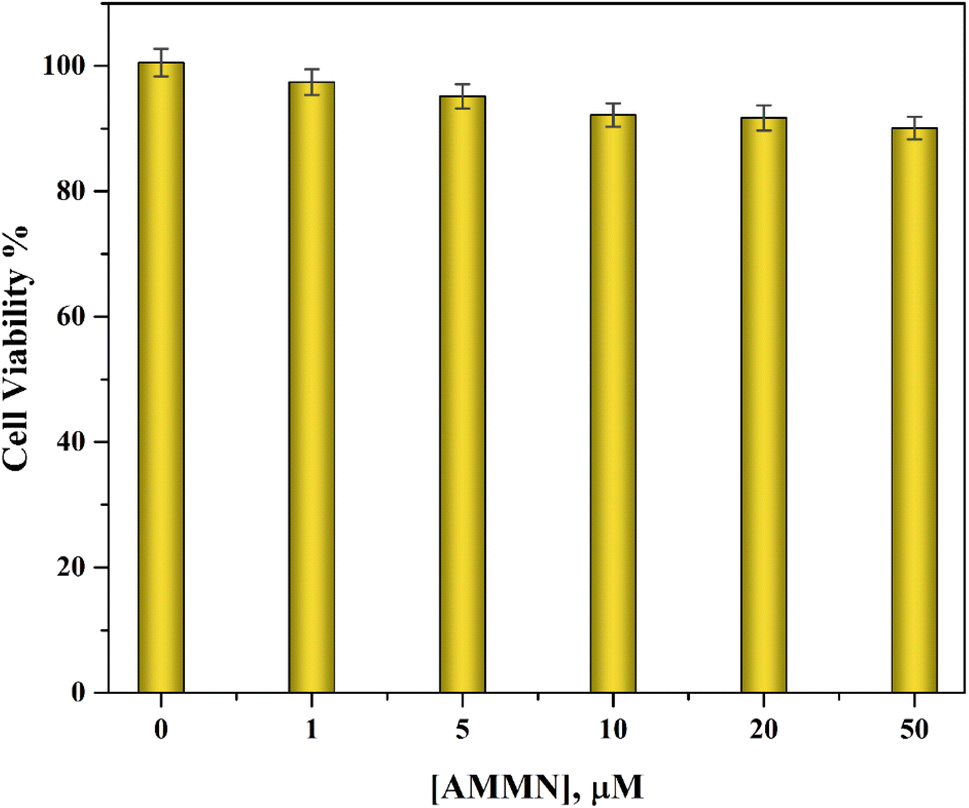
3.13 Cytotoxicity studies and bio-imaging in HeLa cells
AMMN's fluorescence sensing ability towards Al3+ ions is employed in a real-time application for monitoring the presence of Al3+ ions in the living system. For practical biological applications, AMMN was utilized for in vitro cell imaging assay. The cytotoxicity of AMMN chemosensor was evaluated on HeLa cell lines using the MTT assay. The cells were incubated with AMMN solutions at concentrations ranging from 0 to 50 μM for 24 hours. during the incubation process, more than 90% of the cells remained viable, indicating the low cytotoxicity effect of AMMN, holding great potential as an intracellular imaging probe (Fig. 15). Bio-imaging experiments were employed to demonstrate the ability of AMMN to detect Al3+ in HeLa cells. Images were captured using confocal fluorescence microscopy (Fig. 16). As shown in Fig. 16b, a very weak emission was observed within the HeLa cells upon treatment with AMMN (5 μM) for 1 hour only. However, upon pre-treating the HeLa cells with AMMN incubated with Al3+ (5 μM) as a harmful exotic for the cells, an enhancement in the fluorescence intensity was observed under same experimental condition (Fig. 16e). Then, the experiments were carried out under the fluorescence microscope by using the excitation wavelength of 375 nm. Therefore, these results demonstrate that AMMN is suitable for the in vivo imaging and consequently detection of Al3+ in living cells. Fig. 16a and d show HeLa cells treated with AMMN and AMMN + Al3+, respectively, while Fig. 16c and f display the corresponding overlay images of the same cells—AMMN-treated in Fig. 16a and c, and AMMN + Al3+-treated in Fig. 16d and f.
 |
| | Fig. 15 Cytotoxicity of AMMN at varying concentration-dependent assay. | |
 |
| | Fig. 16 Confocal fluorescence micrograph of HeLa cells incubation with AMMN and Al3+. (Left) bright field image; (middle) fluorescence image; (right) merged image. | |
3.14 Real sample analysis
To assess the practical applicability of the proposed sensing probe, Al3+ detection was conducted in distilled and tap water samples. Prior to analysis, the water samples were filtered to eliminate insoluble substances. The Al3+ ion at different concentration levels 10, 20 and 50 μM in case of colorimetric sensing and 1, 3 and 5 μM in case of fluorometric analysis were spiked in all real samples. Full detailed procedure is provided ESI.† The results (Tables 1 and 2) indicate that AMMN accurately detects the spiked Al3+ concentrations, demonstrating good recovery rates. These findings confirm the effectiveness and reliability of AMMN for Al3+ detection in real water samples, even in the presence of other environmentally relevant interfering metal ions.
Table 1 Al3+ determination in real water samples by colorimetric method
| Sample |
Added (μM) |
Detected (x ±SD) (μM) |
Recovery (%) |
RSD (%) |
Standard error |
| Mean values of three determinations. Standard deviation. |
| Distilled water |
5 |
4.98a ± 0.224b |
99.60 |
2.51 |
0.29 |
| 7 |
7.01a ± 0.421b |
100.24 |
2.78 |
0.38 |
| 10 |
9.88a ± 0.173b |
99.88 |
3.24 |
0.87 |
| Tap water |
5 |
5.02a ± 0.124b |
100.32 |
1.15 |
0.26 |
| 7 |
7.00a ± 0.832b |
100.35 |
2.24 |
0.46 |
| 10 |
10.11a ± 0.432b |
100.45 |
1.99 |
0.58 |
Table 2 Al3+ determination in real water samples by fluorometric method
| Sample |
Added (μM) |
Detected (x ± SD) (μM) |
Recovery (%) |
RSD (%) |
Standard error |
| Mean values of three determinations. Standard deviation. |
| Distilled water |
1 |
0.99a ± 0.015b |
99.00 |
0.41 |
0.016 |
| 3 |
3.01a ± 0.020b |
100.30 |
0.69 |
0.016 |
| 5 |
4.98a ± 0.081b |
99.61 |
1.63 |
0.066 |
| Tap water |
1 |
1.01a ± 0.020b |
101.32 |
2.05 |
0.017 |
| 3 |
3.00a ± 0.032b |
100.20 |
1.19 |
0.026 |
| 5 |
5.01a ± 0.043b |
100.00 |
0.87 |
0.035 |
3.15 Comparison with recent work
A comparative analysis of the synthesized chemosensor with the previously reported Schiff-based sensors for detection in real samples and bio-imaging of Al3+ in living cells.29,60–67 (Table 3) reveals that the probe demonstrates comparable or superior analytical performance. Therefore, the synthesized probe can be considered an efficient chemosensor for the selective detection of micromolar concentrations of Al3+ in both environmental and biological sample.
Table 3 Comparison of the probe AMMN with the previously with some Schiff base sensors reported literature
| Sensor |
Sensor type |
Signal |
LOD, M |
Bio-image |
Reference |
 |
PET |
Fluorescence |
9.08 × 10⁻⁷ |
HeLa cells |
29 |
 |
CN isomerization and ESIPT |
Fluorescence |
7.05 × 10⁻⁶ |
HeLa cells |
60 |
 |
— |
Fluorescence |
3.7 × 10⁻⁷ |
HepG2 cells |
61 |
 |
PET |
Fluorescence |
1.2 × 10⁻⁷ |
HeLa cells |
62 |
 |
CHEF |
Fluorescence |
1.62 × 10⁻⁶ |
HeLa cells |
63 |
 |
CHEF |
Fluorescence |
1.2 × 10⁻⁷ |
HeLa cells |
64 |
 |
PET and CHEE |
Fluorescence |
1.5 × 10⁻⁶ |
HeLa cells |
65 |
 |
CHEE |
Fluorescence |
1.5 × 10⁻⁶ |
A549 cells |
66 |
 |
ICT |
Fluorescence |
1.64 × 10⁻⁶ |
HeLa cells |
67 |
 |
CN isomerization and PET |
Absorption |
1.7 × 10⁻⁶ |
|
|
| Fluorescence |
5.3 × 10⁻⁷ |
HeLa cells |
This work |
4. Conclusion
In conclusion, a straightforward, simple Schiff base AMMN, was successfully synthesized designed and developed as a dual colorimetric-fluorescent probe for sequent monitoring Al3+ ions with high selectivity and sensitivity in biological and environmental systems. A 1:1 stoichiometry between AMMN and Al3+was confirmed through Job's plot analysis, ESI-mass spectrometry, and DFT studies. The detection limits were determined to be 1.7 × 10⁻⁶ M and 5.3 × 10⁻⁷ M for chromogenic and fluorogenic measurements, respectively. These values are significantly lower than the thresholds recommended by WHO guidelines for drinking water which don't exceed the practicable levels of 0.1–0.2 mg L−1. Furthermore, the probe AMMN was utilized for imaging in HeLa cells, confirming its potential as a fluorescent probe for Al3+ monitoring in living cells.
Data availability
The data supporting this article have been included as part of the Supplementary Information.†
Author contributions
Ayman A. Abdel Aziz: conceptualization, software, formal analysis, writing – review & editing, supervision. Ali M. Abdek-Aziz: investigation, methodology, formal analysis, data curation, writing, review & editing original draft.
Conflicts of interest
There are no conflicts to declare.
References
- H. Sang, P. Liang and D. Du, J. Hazard. Mater., 2008, 154(1–3), 1127–1132 CrossRef CAS.
- E. Delhaize and P. R. Ryan, Plant Physiol., 1995, 107(2), 315 CrossRef CAS PubMed.
- B. Valeur and I. Leray, Coord. Chem. Rev., 2000, 205(1), 3–40 CrossRef CAS.
- K. Klotz, W. Weistenhöfer, F. Neff, A. Hartwig, C. van Thriel and H. Drexler, Dtsch. Arztebl. Int., 2017, 114(39), 653–659 Search PubMed.
- J. Barcelo and C. Poschenrieder, Environ. Exp. Bot., 2002, 48(1), 75–92 CrossRef CAS.
- K. B. Mogensen, M. Gühlke, J. Kneipp, S. Kadkhodazadeh, J. B. Wagner, M. E. Palanco, H. Kneipp and K. Kneipp, Chem. Commun., 2014, 50(28), 3744–3746 RSC.
- A. A. Ammann, J. Mass Spectrom., 2007, 42(4), 419–427 CrossRef CAS.
- T. G. Kazi, S. Khan, J. A. Baig, N. F. Kolachi, H. I. Afridi, G. S. Kumar and A. Q. Shah, J. Hazard. Mater., 2009, 172(2–3), 780–785 CrossRef CAS PubMed.
- A. Mishra, S. R. Bhalla, S. Rawat, V. Bansal, R. Sehgal and S. Kumar, Biologicals, 2007, 35(4), 277–284 CrossRef CAS.
- H. A. Panahi, A. Feizbakhsh, S. Riyasati, E. Moniri, M. N. Nezhati and I. Y. Galaev, Desalin. Water Treat., 2015, 53(7), 1902–1908 CrossRef CAS.
- P. S. Martín, S., J. M. Bauçà and E. Martínez-Morillo, Adv. Lab. Med., 2022, 3(2), 160–166 Search PubMed.
- J. Qiao, F. Tao, G. Wei, X. Zhang, W. Xie, X. Li and J. Yang, J. Electroanal. Chem., 2023, 929, 117102 CrossRef CAS.
- M. Chaudry, Noor-Ul-Islam, Z. Yasin and J. Rad, Nucl. Chem., 1988, 122(1), 43–50 CrossRef CAS.
- M. Frankowski and A. Zioła-Frankowska, Talanta, 2010, 82(5), 1763–1769 CrossRef CAS.
- J. Tria, P. R. Haddad and P. N. Nesterenko, J. Sep. Sci., 2008, 31(12), 2231–2238 CrossRef CAS PubMed.
- H. Rekhi, R. Kumar, S. Rani and A. K. Malik, J. Chromatogr. Sci., 2015, 53(5), 800–806 Search PubMed.
- M. Shibukawa, K. Koyahara, A. Mishina, K. Saitoh and A. Nishigaki, Curr. Chromatogr., 2016, 3(2), 123–128 CrossRef CAS.
- D. S. Moore, Rev. Sci. Instrum., 2004, 75(8), 2499–2512 CrossRef CAS.
- S. Sogra, V. Aishwarya, P. S. Chaithra, L. Suchi, S. Abhishek, S. Vishnu and A. K. Das, J. Fluoresc., 2024, 1–32 Search PubMed.
- P. R. Dongare and A. H. Gore, ChemistrySelect, 2021, 6(23), 5657–5669 CrossRef CAS.
- H. M. Al-Saidi and S. Khan, Crit. Rev. Anal. Chem., 2024, 54(1), 93–109 CrossRef CAS.
- B. Liu, J. Zhuang and G. Wei, Environ. Sci.: Nano, 2020, 7(8), 2195–2213 RSC.
- D. Wu, L. Chen, W. Lee, G. Ko, J. Yin and J. Yoon, Coord. Chem. Rev., 2018, 354, 74–97 CrossRef CAS.
- A. Afrin, A. Jayaraj and M. Gayathri, Sens. Diagn., 2023, 2(5), 988–1076 RSC.
- A. Kumar, Virender, M. Saini, B. Mohan, Shayoraj and M. Kamboj, Microchem. J., 2022, 181, 107798 CrossRef CAS.
- D. Peralta-Domínguez, M. Rodriguez, G. Ramos-Ortiz, J. L. Maldonado, D. Luna-Moreno, M. Ortiz-Gutierrez and V. Barba, Sens. Actuators, B, 2016, 225, 221–227 CrossRef.
- A. Taha, N. Farooq, N. Singh and A. A. Hashmi, J. Mole. Liq., 2024, 124678 CrossRef CAS.
- A. L. Berhanu, Gaurav, I. Mohiuddin, A. K. Malik, J. S. Aulakh, V. Kumar and K.-H. Kim, TrAC, Trends Anal. Chem., 2019, 116, 74–91 CrossRef CAS.
- J. Zhu, Y. Zhang, L. Wang, T. Sun, M. Wang, Y. Wang, D. Ma, Q. Yang and Y. Tang, Tetrahedron Lett., 2016, 57(31), 3535–3539 CrossRef CAS.
- M. A. Treto-Suárez, Y. Hidalgo-Rosa, E. Schott, X. Zarate and D. Páez-Hernández, J. Phys. Chem. A, 2019, 123(32), 6970–6977 CrossRef.
- B. Musikavanhu, Y. Liang, Z. Xue, L. Feng and L. Zhao, Molecules, 2023, 28(19), 6960 CrossRef CAS PubMed.
- B. Mohan, J. Kapoor, A. Shanmughan, M. K. Noushija, M. Sumithradevi and S. Shanmugaraju, Results Chem., 2024, 7, 101402 CrossRef CAS.
- G.-q. Wang, J.-c. Qin, C.-R. Li and Z.-y. Yang, Spectrochim. Acta Part A, 2015, 150, 21–25 CrossRef CAS PubMed.
- F. Wang, Y. Xu, S. O. Aderinto, H. Peng, H. Zhang and H. Wu, J. Photochem. Photobiol., A, 2017, 332, 273–282 CrossRef CAS.
- S. Das, M. Das, S. Laha, K. Rajak, I. Choudhuri, N. Bhattacharyya, B. C. Samanta and T. Maity, J. Mol. Struct., 2022, 1263, 133214 CrossRef CAS.
- M. E. Sidqi, A. A. Abdel Aziz, A. E. Abolehasan and M. A. Sayed, J. Photochem. Photobiol., A, 2022, 424, 113616 CrossRef CAS.
- L. Wang, Y. Zhao, J. Li, C. Sun, W. Li, Z. Chang and D. Qi, J. Mol. Struct., 2022, 1255, 132431 CrossRef CAS.
- Ö. Güngör and L. Nuralin, J. Fluoresc., 2024, 34(3), 1319–1342 CrossRef PubMed.
- S. Gurusamy, M. Sankarganesh, V. Sathish, P. Thanasekaran and A. Mathavan, J. Photochem. Photobiol., A, 2022, 425, 113674 CrossRef CAS.
- Y. Xu, L. Yang, H. Wang, Y. Zhang, X. Yang, M. Pei and G. Zhang, J. Photochem. Photobiol., A, 2020, 391, 112372 CrossRef CAS.
- A. Q. Alorabi, S. A. Zabin, M. M. Alam and M. Abdelbaset, Int. J. Anal. Chem., 2022, 2022(1), 4899145 Search PubMed.
- A. M. Brouwer, Appl. Chem., 2011, 83(12), 2213–2228 CrossRef CAS.
- R. C. Weast, in Handbook of chemistry and physics, CRC Press, Inc, Cleveland, 58th edn, 1977–1978 Search PubMed.
- D. Kandi, S. Mansingh, A. Behera and K. Parida, J. Lumin., 2021, 231, 117792 CrossRef CAS.
- J. Oliva, L. Diaz-Torres, A. Torres-Castro, P. Salas, L. Perez-Mayen and E. De la Rosa, Opt. Mater. Express, 2015, 5(5), 1109–1121 CrossRef.
- A. A. Abdel Aziz, R. M. Ramadan, M. E. Sidqi and M. A. Sayed, Appl. Organomet. Chem., 2023, 37(2), e6954 CrossRef CAS.
- A. Ö. Yıldırım, M. H. Yıldırım and Ç. A. Kaştaş, J. Mol. Struct., 2017, 1127, 275–282 CrossRef.
- Ö. Güngör and P. Gürkan, J. Mol. Struct., 2014, 1074, 62–70 CrossRef.
- A. A. Al-Rashdi, A. H. Naggar, O. A. Farghaly, H. A. Mauof and A. A. Ekshiba, Am. J. Anal. Chem., 2018, 9(3), 99–112 CrossRef CAS.
- H. A. Benesi and J. Hildebrand, J. Am. Chem. Soc., 1949, 71(8), 2703–2707 CrossRef CAS.
- A. G. Mwalupindi, A. Rideau, R. A. Agbaria and I. M. Warner, Talanta, 1994, 41(4), 599–609 CrossRef CAS.
- A. D. Sánchez-Pacheco, M. Hernández-Vergara, E. Jaime-Adán, S. Hernández-Ortega and J. Valdés-Martínez, J. Mol. Struct., 2021, 1234, 130136 CrossRef.
- A. Bartyzel, J. Therm. Anal. Calorim., 2017, 127, 2133–2147 CrossRef CAS.
- F. S. M. Canisares, A. G. Bispo-Jr, A. M. Pires and S. A. M. Lima, Optik, 2020, 219, 164995 CrossRef CAS.
- Ö. Özdemir, J. Mol. Struct., 2019, 1179, 376–389 CrossRef.
- M. S. Ansari, A. Banik and M. Qureshi, Carbon, 2017, 121, 90–105 CrossRef CAS.
- S. Muthu and S. Renuga, Spectrochim. Acta A., 2014, 118, 683–694 CrossRef CAS.
- F. M. J. Frisch, G. Trucks, H. B. Schlegel and G. E. Scuseria, Gaussian 09, Revision D. 01, Gaussian Inc., Wallingford CT, 2009, p. 620, Available at: https://www.gaussian.com Search PubMed.
- C.-G. Zhan, J. A. Nichols and D. A. Dixon, J. Phys. Chem., 2003, 107(20), 4184–4195 CrossRef CAS.
- M. E. Sidqi, A. A. Abdel Aziz, A. E. Abolehasan and M. A. Sayed, J. Photochem. Photobiol., A, 2022, 424, 113616 CrossRef CAS.
- Q. Wang, H. Sun, L. Jin, W. Wang, Z. Zhang and Y. Chen, J. Lumin., 2018, 203, 113–120 CrossRef CAS.
- J. Tian, X. Yan, H. Yang and F. Tian, RSC Adv., 2015, 5(129), 107012–107019 RSC.
- S. K. Sheet, B. Sen, R. Thounaojam, K. Aguan and S. Khatua, J. Photochem. Photobiol., A, 2017, 332, 101–111 CrossRef CAS.
- G. Yang, P. Li, Y. Han, L. Tang, Y. Liu, H. Xin, K.-N. Wang, S. Zhao, Z. Liu and D. Cao, Mater. Chem. Phys., 2023, 295, 127145 CrossRef CAS.
- Q. Liu, Y. Liu, Z. Xing, Y. Huang, L. Ling and X. Mo, Spectrochim. Acta A., 2023, 287, 122076 CrossRef CAS PubMed.
- B. Das, A. Ghosh, S. Yesmin, S. J. Abbas, M. Dolai, S. Mabhai, A. Jana, S. Dey and A. Misra, J. Mol. Struct., 2022, 1253, 132295 CrossRef CAS.
- B. Musikavanhu, Z. Huang, Q. Ma, Y. Liang, Z. Xue, L. Feng and L. Zhao, Spectrochim. Acta, Part A, 2023, 301, 122961 CrossRef CAS PubMed.
|
| This journal is © The Royal Society of Chemistry 2025 |
Click here to see how this site uses Cookies. View our privacy policy here. 
 Open Access Article
 This Open Access Article is licensed under a Creative Commons Attribution-Non Commercial 3.0 Unported Licence
 * and
Ali M. Abdel-Aziz
* and
Ali M. Abdel-Aziz