
 Open Access Article
 This Open Access Article is licensed under a Creative Commons Attribution-Non Commercial 3.0 Unported Licence
CFD study on microchannel reactor operating conditions for Fischer–Tropsch synthesis with Fe-based catalysts†
Shijie Ren a and
Yuanyang Wang*b
a and
Yuanyang Wang*b
aTaiyuan University of Technology, College of Materials Science and Engineering, College of Energy and Materials Engineering, 66 Waliu Road, Wanbailin District, Taiyuan, Shanxi Province 030024, China
bTaiyuan University of Technology, College of Chemical Engineering and Technology, 66 Waliu Road, Wanbailin District, Taiyuan, Shanxi Province 030024, China. E-mail: yywangs@163.com
First published on 25th April 2025
Abstract
Based on the kinetics of Fischer–Tropsch synthesis and computational fluid dynamics, this study established a numerical model for a coated microchannel reactor. The simulation results revealed the distribution characteristics of the flow fields within the reactor, demonstrating that the pressure drop in the microchannel reactor was only 3–5 Pa, with minor backmixing and potential hot spots observed near the inlet and outlet regions. Under the conditions of an inlet temperature of 340 °C, a gauge pressure of 0.7 MPa, and an H2/CO feed ratio of 2/3, the reactor with catalyst coating on both the inner and outer surfaces of the channels exhibited a maximum temperature increase of 9.1 °C and an 8.9% improvement in CO conversion compared to the reactor with only internal channel coating. The simulation results were in good agreement with experimental data, validating the accuracy of the model. The sensitivity analysis of the operating conditions revealed that inlet temperature, H2/CO feed ratio, operating pressure, and space velocity exerted distinct influences on CO conversion, maximum temperature increase, and product distribution. Lower inlet temperatures, H2/CO feed ratios, and space velocities, along with higher reaction pressures, contribute to increased C5+ yield, thereby providing a basis for the optimal design of the reactor.
1. Introduction
Against the backdrop of increasingly strained petroleum resources, Fischer–Tropsch synthesis (FTS) offers a promising pathway to convert syngas derived from non-petroleum resources such as coal, natural gas, and biomass into sulfur-free and aromatic-free liquid fuels, including gasoline and kerosene.1 This process holds significant importance for diversifying energy structures, reducing dependence on petroleum, and providing more possibilities for the development and utilization of clean energy.2 However, due to the highly exothermic nature of FTS and its complex catalytic reaction process, traditional reactors such as fixed-bed, fluidized-bed, and slurry-bed reactors face inherent limitations that are difficult to overcome. In recent years, advancements in microchannel reactor technology have provided new solutions for the efficient operation of FTS.3Microchannel reactors can significantly reduce heat and mass transfer distances at the micro/millimeter scale, offering notable process intensification. They can enhance reaction rates by 10 to 1000 times while accelerating heat dissipation, thereby preventing thermal runaway and establishing a new safety paradigm for FTS.4 Additionally, microchannel reactors can operate at low costs with small-scale gas sources and are easily scalable by numbering-up.5 Several researchers6–9 have reported on the feasibility and effectiveness of microchannel reactors for FTS. Internationally, companies such as Compact GTL and Velocys Inc. have developed small-scale gas-to-liquid technologies utilizing microchannel reactors for FTS applications.10 Nevertheless, the performance of FTS in microchannel reactors is highly dependent on channel configuration, catalyst design, and flow field distribution. Due to the micro/millimeter-scale diameter of the reactor channels, it is challenging to directly insert sensors for continuous measurement during operation, making it difficult to obtain localized parameter distributions within the reactor. This poses challenges for subsequent optimization and modification.7
With the continuous improvement of numerical techniques in chemical process modeling, computational fluid dynamics (CFD) has emerged as one of the reliable numerical methods for simulating fluid dynamics in catalytic reactors.11,12 By integrating CFD with reaction kinetics, a numerical model of FTS in microchannel reactors can be established to overcome the difficulties associated with experimental measurements. This approach enables the acquisition of internal flow field characteristics, such as temperature, pressure and concentration distributions, providing a reliable reference for the safe operation, optimal design, and selection of operating conditions for the reactor. Current research on numerical simulations of microchannel reactors primarily focuses on designing reactor structures and catalyst arrangement to control reactor temperature and enhance the yield of target products. For instance, Gumuslu et al.13 developed a two-dimensional reactor model with square-grid-arranged microchannels for FTS, considering factors such as wall thickness, material, and channel size to evaluate their impact on reactor temperature. Park et al.14 employed numerical methods to study the effects of different microchannel arrangements and catalyst packing zones on temperature distribution and maximum temperature differences in FTS reactors. Na et al.15 combined CFD with stochastic optimization algorithms to design catalyst packing zones, aiming to maximize C5+ yield while minimizing the maximum temperature rise. However, these studies primarily focus on square-grid-arranged microchannel reactors, with limited research on multi-tubular catalyst-coated microchannel reactors. Moreover, there is a lack of comprehensive discussion on the impact of various operating conditions, including inlet temperature, operating pressure, H2/CO feed ratio, and space velocity, on the reaction performance.
In this study, based on FTS reaction kinetics and CFD, a novel microchannel FTS reactor model was established. The reactor employed steel tubes with an outer diameter of 3 mm as microchannels, utilizing the inherent Fe content to form Fe–Mn catalytic active substances on the inner/outer surfaces of the tubes via an impregnation method, thereby achieving enhanced mass and heat transfer. The study aims to investigate the characteristics of the flow field distribution within the reactor, as well as the impact of various operating conditions on catalytic performance.
2. Model description
2.1 Geometric model and meshing
The reactor was constructed by closely packing seven microtubes (designated as Tube I) with dimensions of φ2 × 0.5 × 100 mm and nesting them within a larger tube (designated as Tube II) with dimensions of φ9 × 1 × 160 mm, forming multiple distinct reaction channels of varying shapes. The tubes were fabricated from 20# carbon steel (AISI 1020). Tube I was centrally positioned along the axial direction of Tube II, with both the front and rear ends being 30 mm away from the inlet and outlet of Tube II, respectively. After corrosion treatment, the inner and outer surfaces of Tube I were impregnated to form an Fe–Mn catalyst layer. Consequently, the seven Tube I units not only served as the flow channels for syngas but also acted as the substrate for the Fe-based catalyst, thereby integrating the catalyst with the microchannel reactor structure. Syngas was introduced through one end of Tube II and underwent Fischer–Tropsch synthesis reactions on the catalyst-coated surfaces of Tube I. The reaction products were subsequently discharged through the opposite end of Tube II. The 30 mm spaces at both ends of Tube II were filled with inert particles to ensure laminar flow of the gas throughout the reaction process.A three-dimensional geometric model identical in size to the reactor was established, as illustrated in Fig. 1. The reaction channels consist of Steel Tube I and Steel Tube II, with the origin located at the center of the inlet cross-section of Tube II and the flow direction aligned with the positive x-axis. Based on their shapes, four types of reaction channels are marked with points A, B, C, and D as shown in Fig. 1. Points A, B, and C represent the centerlines of the channels, while point D is located at the intersection extended from the tangent of Tube I and the diameter of Tube II.
 | ||
| Fig. 1 Geometric model of the microchannel reactor. The origin is set at the center of the inlet end of Steel Tube II, with the x-axis aligned in the direction of the reactant flow. At x = 30 mm, four reaction channels are formed by the inner and outer walls of Steel Tube I and the inner wall of Steel Tube II. These channels are labeled as characteristic points A, B, C, and D. Cross-sections 1–1 and 2–2 of the reactor are obtained perpendicular to the z-axis and y-axis, respectively. | ||
The geometric model is divided into three domains: the solid domain, the fluid domain, and the catalyst layer domain. FTS reaction occurs exclusively within the catalyst layer domain. The geometric model was meshed using Ansys Meshing, resulting in a total of 3,280,891 tetrahedral mesh elements with a maximum skewness of 0.69. A grid independence test was conducted, confirming that the simulation results did not exhibit significant changes with increasing mesh density.
2.2 FTS reaction kinetics
The reported FTS kinetic models in the literature can be categorized into three types: reactant consumption rate models, detailed kinetic models, and lumped kinetic models.16 This study employed a lumped kinetic model, which simplified the detailed kinetic model from ref. 17. The reaction products were lumped into CH4, C3H8, and C14H30, representing C1, C2–C4, and C5+ components, respectively. The water–gas shift (WGS) reaction was also considered, as detailed in Table 1.| Reaction | Reaction rate expression |
|---|---|
a 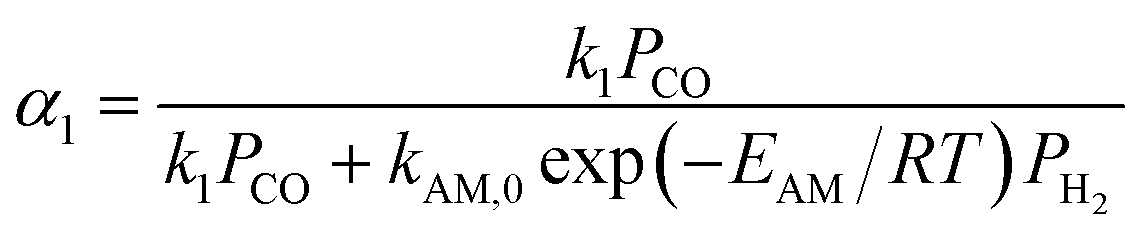    b Parameter values: k1 = 2.23 × 10⁻¹⁰ mol (g−1·Pa−1·s) Ka = 1.81 × 10⁻² Kb = 4.68 × 10⁻² Kc = 2.26 × 10⁻¹ Kν = 3.57 × 10⁻⁶Pa−0.5 kAM,0 = 4.65 × 10⁻² mol (g−1·Pa−1·s) EAM = 92.89 × 10³ J mol−1 kA1,0 = 2.74 × 10⁻³ mol (g−1·Pa−1·s) EA1 = 87.01 × 10³ J mol−1 kA2,0 = 2.74 × 10⁻³ mol (g−1·Pa−1·s) EA2 = 87.01 × 10³ J mol−1 kν,0 = 4.96 × 10⁻⁷ mol (g−1·Pa−1 − 1.5·s) Eν = 45.08 × 10³ J mol−1. b Parameter values: k1 = 2.23 × 10⁻¹⁰ mol (g−1·Pa−1·s) Ka = 1.81 × 10⁻² Kb = 4.68 × 10⁻² Kc = 2.26 × 10⁻¹ Kν = 3.57 × 10⁻⁶Pa−0.5 kAM,0 = 4.65 × 10⁻² mol (g−1·Pa−1·s) EAM = 92.89 × 10³ J mol−1 kA1,0 = 2.74 × 10⁻³ mol (g−1·Pa−1·s) EA1 = 87.01 × 10³ J mol−1 kA2,0 = 2.74 × 10⁻³ mol (g−1·Pa−1·s) EA2 = 87.01 × 10³ J mol−1 kν,0 = 4.96 × 10⁻⁷ mol (g−1·Pa−1 − 1.5·s) Eν = 45.08 × 10³ J mol−1. |
|
| CO + 3H2 → H2O + CH4 | 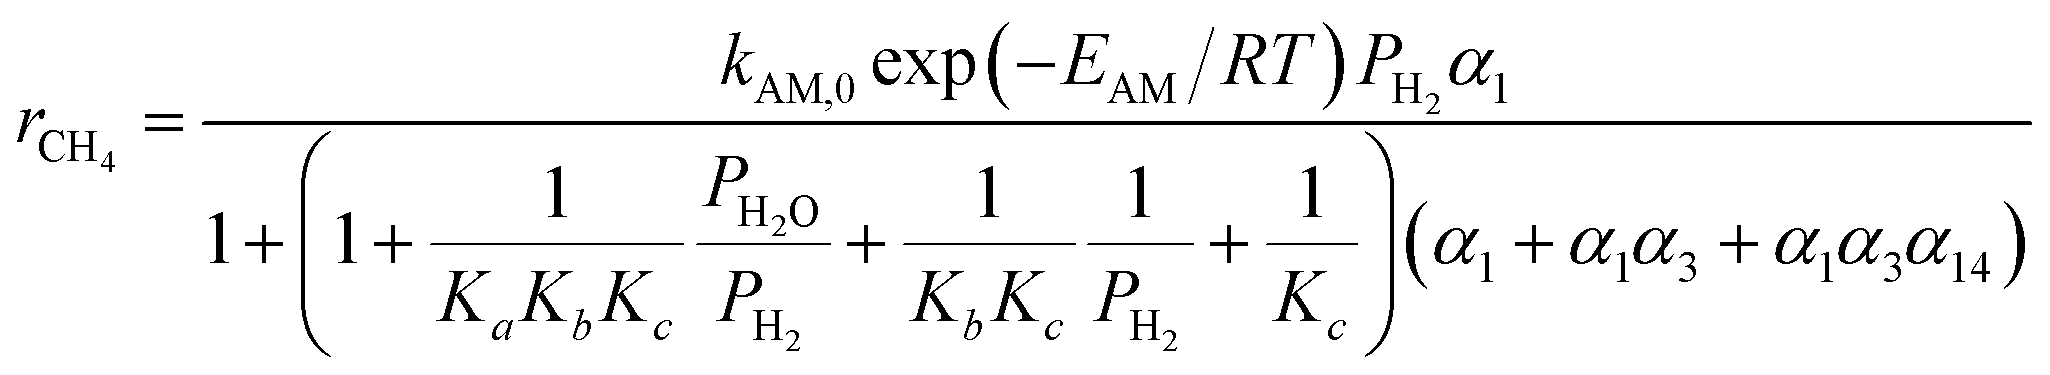 |
| 3CO + 7H2 → 3H2O + C3H8 |  |
| 14CO +29H2 → 4H2O + C14H30 |  |
| CO + H2O → H2 + CO2 |  |
The catalytic performance parameters were defined by the following relationships.
CO conversion rate:
 | (1) |
CO2 selectivity:
 | (2) |
C1, C3, and C5+ selectivity:
 | (3) |
C1, C3, and C5+ Yields:
| YCi = XCO × SCi × 100% | (4) |
2.3 Microchannel reactor model
Based on the FTS reaction kinetics in Table 1, the microchannel reactor model was established by integrating the mass, momentum, and energy conservation equations from CFD. All reactants and products were treated as incompressible ideal gas mixture. FTS within the coating layer was simulated using a porous media model, assuming isotropic properties. The continuity and momentum equations, incorporating the porous media terms, were formulated based on the Navier–Stokes equations. The flow regime within the fluid domain was considered to be laminar. The entire reaction process was treated as a steady-state process, and thus the time-dependent terms in the original equations were set to zero. The primary governing equations are presented as follows:Mass conservation equation:
 | (5) |
 is the superficial velocity.
Momentum conservation equation:
 | (6) |
For isotropic porous media, the source term is calculated as:
 | (7) |
 is the velocity magnitude, and C is a specified matrix.
Energy conservation equation:
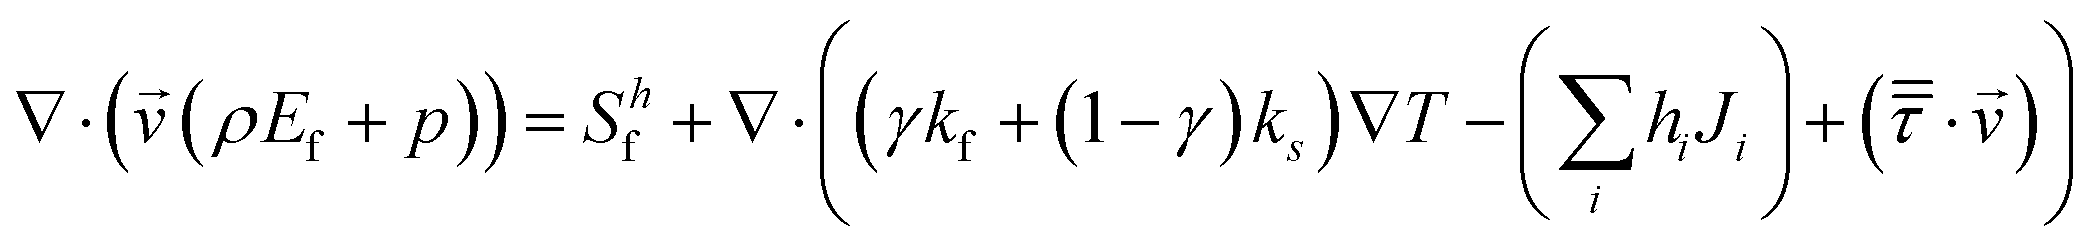 | (8) |
Species diffusion equation with Volumetric reaction term:
 | (9) |
 | (10) |
![[R with combining circumflex]](https://www.rsc.org/images/entities/i_char_0052_0302.gif) i,r is the molar rate of creation/destruction of species i in reaction r, which can be computed using the reaction rate equations provided in Table 1. These rates are implemented in Ansys Fluent via User-Defined Functions (UDF) written in C language. The UDFs enable the incorporation of custom reaction kinetics into the simulation environment. During this process, the unit conversion from mol (g−1·s−1) to mol (m3·s−1) is also handled within the UDF functions.
i,r is the molar rate of creation/destruction of species i in reaction r, which can be computed using the reaction rate equations provided in Table 1. These rates are implemented in Ansys Fluent via User-Defined Functions (UDF) written in C language. The UDFs enable the incorporation of custom reaction kinetics into the simulation environment. During this process, the unit conversion from mol (g−1·s−1) to mol (m3·s−1) is also handled within the UDF functions.
Heat conduction in the solid region:
| q = −kwall ∇T | (11) |
Additionally, the Maxwell–Stefan equation was utilized to determine the diffusion fluxes for multicomponent diffusion. To validate the applicability of the continuum model and the Navier–Stokes equations, the Knudsen number was calculated, yielding an order of magnitude of 1 × 10⁻⁵. This value was below the threshold of 0.001, confirming the suitability of the continuum model for microchannels, as supported by ref. 18–20.
2.4 Experimental data for validation
In this study, experimental data from the study of Wang.21 were employed to validate the simulation. A brief overview is provided here. The entire experimental setup is illustrated in Fig. 2. The reactor body was placed inside a constant-temperature jacket. H2, CO, and N2 were introduced into the microchannel reactor via a gas mixer (Gas-Mixer) at specific ratios and flow rates, which were controlled by a mass flow controller (MFC). The reactants were preheated and subjected to programmed temperature control for the reaction. The products were collected through a cold trap and a back-pressure valve and then analyzed by a Hexion GC-950 gas chromatograph for online detection. The gas composition before and after the reaction was determined using a thermal conductivity detector with a TDX-01 column, as well as a flame ionization detector with a GDX-403 column and an SE-30 capillary column in parallel. Table 2 presents the experimental conditions and the corresponding results, which can be used to validate the simulation results of this paper.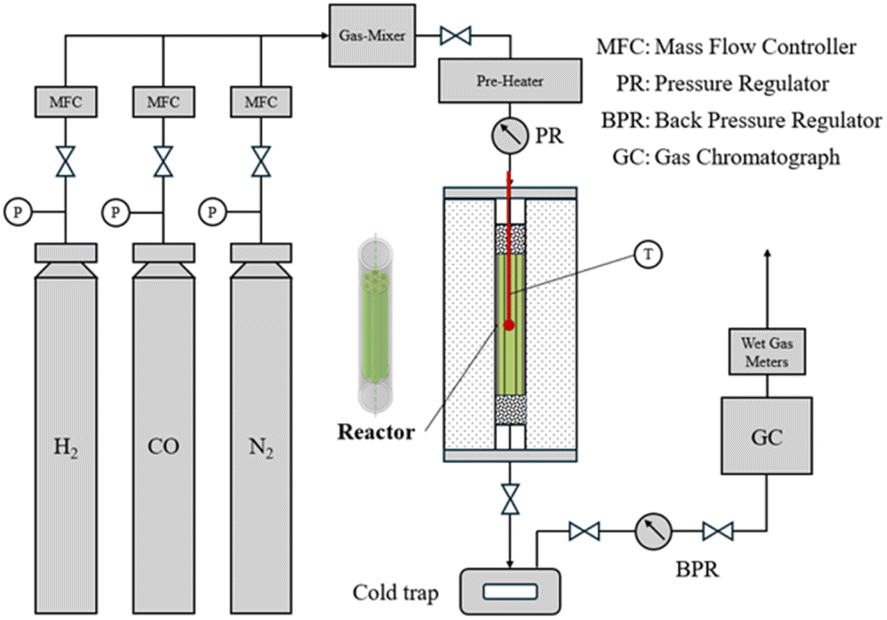 | ||
| Fig. 2 Fischer–Tropsch synthesis reaction experimental setup. | ||
| Case ID | Inlet temp./°C | H2/CO molar ratio | Operating pressure/MPa | XCO/% | ΔT/°C |
|---|---|---|---|---|---|
| a The GHSV is set at 4000 h−1 for all cases, corresponding to an inlet flow velocity of 0.0853 m s−1. | |||||
| 1 | 300 | 2/3 | 0.1 | 33.4 | 7.23 |
| 2 | 300 | 3/3 | 0.1 | 34.52 | 8.64 |
| 3 | 300 | 4/3 | 0.1 | 34.67 | 12.73 |
| 4 | 300 | 2/3 | 0.3 | 44.94 | 7.21 |
| 5 | 300 | 2/3 | 0.5 | 46.23 | 12.45 |
| 6 | 300 | 2/3 | 0.7 | 47.99 | 6.82 |
| 7 | 220 | 2/3 | 0.7 | 25.44 | 6.32 |
| 8 | 260 | 2/3 | 0.7 | 37.67 | 9.35 |
| 9 | 340 | 2/3 | 0.7 | 51.57 | 11.30 |
| 10 | 380 | 2/3 | 0.7 | 91.07 | 16.43 |
2.5 Simulation conditions and settings
2.6 Simulation scheme
By solving the steady-state mass, momentum, and energy conservation equations, the distributions of temperature, pressure, and species concentration within the reaction channels were obtained. This allowed for the analysis of XCO, ΔT and selectivity. The simulation was divided into three groups:(1) Validation and flow field analysis: the first group of simulations was conducted under the experimental conditions listed in Table 2 to validate the accuracy of the model. The flow field characteristics within the microchannel reactor and the locations of potential hot spots were analyzed.
(2) Catalyst coating comparison: the second group of simulations used the operating conditions of case 9 in Table 2 as a baseline. The reaction performance was compared between two configurations, labeled as G1 and G2: (a) G1: catalyst coating on both the inner and outer surfaces of Steel Tube I and (b) G2: catalyst coating only on the inner surface.
(3) Operating condition sensitivity analysis: the third group of simulations also used the operating conditions of case 9 in Table 2 as a baseline. Using the method of Controlled Variables, individual reaction conditions were varied, including inlet temperature (220–380 °C), operating pressure (0.1–2.1 MPa), H2/CO feed ratio (1/3–7/3), and space velocity (2000–16000 h−1). The changes in XCO, the maximum temperature rise(ΔT), and product distribution were analyzed to evaluate the catalytic performance of the reactor under different operating conditions.
3 Result and discussion
3.1 Grid independence test
The geometric model was meshed using Ansys Meshing, as illustrated in Fig. 3. Given the small angles at the tangential sections of the cylindrical tubes, chamfering and smoothing treatments were applied to enhance mesh quality. A grid independence test was conducted during meshing to balance computational efficiency and simulation accuracy. A multizone meshing approach was employed, restricting the maximum mesh size in each region to achieve different meshing results. Five meshing schemes were developed, as detailed in Table 3. As the maximum mesh size decreased progressively from Scheme 1 to Scheme 5, the total number of mesh elements increased significantly, from 170![[thin space (1/6-em)]](https://www.rsc.org/images/entities/char_2009.gif) 000 to 9,260,000. Concurrently, the mesh skewness decreased from 0.96 to 0.65, indicating improved mesh quality with smaller mesh sizes, albeit at the cost of increased computational burden.
000 to 9,260,000. Concurrently, the mesh skewness decreased from 0.96 to 0.65, indicating improved mesh quality with smaller mesh sizes, albeit at the cost of increased computational burden.
 | ||
| Fig. 3 The mesh of the microchannel reactor model. | ||
| Scheme | Maximum size of fluid domain/mm | Number of cell layers in the catalyst coating domain | Maximum size of solid domain/mm | Number of cells per 104 | Skewness | |||
|---|---|---|---|---|---|---|---|---|
| Channels A and B | Channels C and D | Other regions | Tube I | Tube II | ||||
| a Scheme 1 failed to converge due to the excessive skewness of the mesh and poor mesh quality. | ||||||||
| 1a | 1 | 0.5 | 1 | 3 | 0.5 | 1 | 17 | 0.96 |
| 2 | 0.5 | 0.25 | 0.5 | 3 | 0.5 | 1 | 56 | 0.85 |
| 3 | 0.2 | 0.1 | 0.5 | 4 | 0.25 | 0.5 | 121 | 0.76 |
| 4 | 0.1 | 0.05 | 0.25 | 5 | 0.125 | 0.25 | 328 | 0.69 |
| 5 | 0.05 | 0.05 | 0.1 | 5 | 0.125 | 0.25 | 926 | 0.65 |
To strike a balance between computational efficiency and simulation accuracy, the impact of mesh density on the simulation results was examined. Fig. 4 presents the radial and axial velocity distributions for Schemes 2–5. It is worth noting that Scheme 1 was not included in this figure because it failed to converge due to the excessive skewness of the mesh. It is evident that Scheme 2 exhibited severe numerical diffusion, while Scheme 3 also showed noticeable numerical diffusion. In contrast, Schemes 4 and 5 demonstrated relatively uniform variable distributions, with minimal differences in velocity profiles. Although velocity distribution of Scheme 3 was comparable to Schemes 4 and 5, discrepancies still existed in the temperature and concentration distributions. Detailed temperature and concentration distribution maps are provided in the ESI materials†. Ultimately, Scheme 4 was selected for its ability to ensure simulation accuracy while maintaining a moderate number of mesh elements, thus balancing computational efficiency.
 | ||
| Fig. 4 Velocity distribution and CO mass fraction distribution under different mesh densities (Schemes 2–5). Scheme 1 is not included due to non-convergence. | ||
3.2 Validation of simulation results with experimental data
The simulation results for the first group are shown in Fig. 5. A comparison was made between the experimental data21 and the simulated results for CO conversion rate (XCO_exp, XCO_sim) and the temperature at the center of the reactor (Tc_exp, Tc_sim). The mean absolute relative residuals for CO conversion rate and center temperature were 11.74% and 0.43%, respectively. The discrepancies observed in this study may stem from three primary sources: | ||
| Fig. 5 Comparison of experimental and simulation results (a) experimental and simulated CO conversion rates under the 10 operating conditions listed in Table 2. (b) Experimental and simulated temperatures at the center of Steel Tube I (x = 80 mm) under the 10 operating conditions listed in Table 2. | ||
(1) Measurement precision limitations: the experimental setup described in the paper21 is subject to inherent measurement errors due to the precision limitations of the instruments used. For instance, the mass flow controller has a precision of ±1%; the temperature controller, ±0.5 °C; the back-pressure valve, ±2%; the gas chromatograph's thermal conductivity detector (TCD), ±5%; the flame ionization detector (FID), ±5%; and temperature control of the cold trap, ±0.5 °C. Collectively these factors contribute to the uncertainties in the experimental results. Additionally, certain physical quantities are challenging to measure precisely. For example, the pressure within the reactor is controlled by the back-pressure valve at the outlet. When the pressure deviates from the set value, the valve continuously adjusts to maintain stability, which is a dynamic process. However, this study employs a static simulation, which can only assume a constant outlet pressure. This difference between the dynamic experimental process and the static simulation is one of the reasons for the discrepancies between the experimental and simulation results.
(2) Reaction kinetics model: this study utilizes the reaction kinetics model from paper.17 Although both studies employ iron-based catalysts, differences in catalyst properties and the complexity of reaction mechanisms make it difficult to fully align with the specific reaction patterns observed in the experiments.
(3) Lumped kinetics model: a lumped kinetics model is applied, where C2–C4 hydrocarbons are lumped into a single C3 product, and hydrocarbons with five or more carbon atoms are lumped into a single C14 product. In reality, the physical properties of these multi-component mixtures differ from the assumed properties of C3 and C14. This discrepancy is another significant contributor to the observed differences.
Despite the presence of some discrepancies, the results indicate a good agreement between the simulation and experimental data, thereby validating the accuracy of the established model.
3.3 Distribution characteristics of flow fields
This section, taking Case 9 in Table 2 as an example, the various flow fields in the simulation results are analyzed and discussed. The velocity field is illustrated in Fig. 6 to identify whether backmixing occurs within the reactor. The temperature fields in the fluid and solid domains are shown in Fig. 7 and 8, respectively, to identify potential thermal runaway regions and support the analysis of reaction channels. The concentration field of CO, the main reactant, is presented in Fig. 9 to infer reaction progress and calculate local conversion rates. | ||
| Fig. 6 Fluid velocity vector distribution in the microchannel reactor (Operating conditions: case 9 from Table 2, with an inlet temperature of 340 °C, pressure of 0.7 MPa, space velocity of 4000 h−1, and H2/CO feed ratio of 2/3.) The figure shows the velocity vectors in cross-sections 1–1 and 2–2. The velocity vectors near x = 30 mm and 130 mm in cross-section 1–1 are magnified for clarity. | ||
 | ||
| Fig. 7 Temperature distribution within the microchannel reactor. The left section of the figure presents three temperature distribution profiles within the reactor. The first profile illustrates the temperature distribution at the reactor inlet and outlet (x∈[0, 30]∪[130, 160]). The remaining two profiles depict the temperature distribution within half of the fluid domain of the reaction channel in different orientations (x∈[30, 130], y ≥ 0, and z ≥ 0). The right section of the figure shows the temperature distribution along the 1–1 and 2–2 cross-sectional planes, as well as the radial cross-sectional distributions at x = 30 mm, 80 mm, and 130 mm. | ||
 | ||
| Fig. 8 Temperature distribution in the reactor (a) temperature distribution in Steel Tube I. (b) Regions in Tube I with potential thermal runaway risks (temperature rise exceeding 10 °C). | ||
 | ||
| Fig. 9 CO mass fraction distribution in the microchannel reactor. Operating conditions and cross-sectional positions are the same as in Fig. 7. | ||
Fig. 6 illustrates the distribution characteristics of the velocity field within the reactor. In the inlet region filled with inert material (x∈ [0, 30]) and the outlet section (x∈[130, 160]), the velocities were relatively low. As the fluid entered the four reaction channels formed by Tube I and Tube II, the velocities increased at points A, B, and D due to the obstruction by solid walls, as well as changes in cross-sectional area and flow rate, while the velocity at point C decreased. As can be observed from the magnified section of Fig. 6, there was a certain degree of backmixing near the inlet and outlet of Tube I. This phenomenon also influenced the distribution of temperature, as evidenced by the temperature depicted in Fig. 7.
Regarding the pressure field distribution, due to the nature of the coated microchannel reactor, the pressure drop across the entire reactor was minimal, with an inlet-to-outlet pressure drop of only 3–5 Pa. This suggests that the reaction process occurs under nearly isobaric conditions.
Given the highly exothermic nature of FTS, the potential risk of thermal runaway must be closely monitored. Across all 10 experimental cases, ΔT did not exceed 20 °C, indicating no occurrence of thermal runaway. Fig. 7 illustrates the temperature distribution characteristics within the microchannel reactor. A noticeable temperature increase was observed at the outlet section compared to the inlet section, with varying magnitudes of temperature rise across reaction channels. Cross-sectional views at x = 30, 80, and 130 mm in Fig. 7 revealed that near the starting point of Tube I, the temperature at the center of each reaction channel was significantly lower than that near the wall. However, in the middle and outlet sections of Tube I, the temperature difference within the same reaction channel across the cross-section was almost negligible. Nevertheless, considering the radial distribution of the fluid in the front half of the reactor, the temperature near the reactor channel walls may be higher than that at the center point C. The temperature distribution trends observed in the microchannel reactor are primarily due to its structural design and the reaction characteristics. In the inlet section (e.g., x = 30 mm), the temperature is lower at the center of the reaction channels than near the walls, as the reaction has not fully progressed and minimal reaction heat has accumulated. In the mid (e.g., x = 80 mm) and outlet sections (e.g., x = 130 mm), the temperature distribution becomes more uniform due to accumulated reaction heat, indicating effective heat transfer design that prevents localized overheating. In the front half of the reactor, the temperature near the walls is higher than at the center point C, likely due to preheated walls and heat conduction, which promotes uniform reaction progress and prevents thermal runaway.
As shown in Fig. 8(a), which displays the temperature distribution in Tube I, the temperature was nearly uniform except in regions close to reaction Channel C. Plotting the areas where the temperature rise exceeds 10 °C revealed that these regions were primarily concentrated near the walls of reaction Channel C and the inlet face of Tube I. Taking these factors into account, the reactor has potential thermal runaway risks at the sharply rising temperature segment near the inlet face of Steel Tube I (x = 30 mm) and the wall region of reaction Channel C (see Fig. 8(b)). The temperature distribution trend observed in Fig. 8 is primarily attributed to the structural characteristics of reaction Channel C and steel Tube I, as well as the localized accumulation of reaction heat. Specifically, the smaller cross-sectional area and slower flow velocity in reaction Channel C result in longer residence times for the gas, leading to more complete reactions and thus greater heat release. Additionally, as previously mentioned, backmixing at the inlet of Tube I accelerates heat diffusion near the entrance of reaction Channel C. Another contributing factor is the presence of catalyst coatings on both ends of Tube I, which also exhibit higher temperatures. These high-temperature regions indicate potential thermal runaway risks in the reactor. If the reaction heat is not dissipated in a timely and effective manner, the accumulation of heat can accelerate the reaction rate, leading to further heat release and potentially triggering thermal runaway.
Fig. 9 illustrates the distribution characteristics of CO concentration within the microchannel reactor. Near the inlet of Tube I, the CO concentration begins to decrease, indicating the initiation of FTS. Along the length of the tube, the overall CO concentration continuously declines, with a more pronounced decrease in the first half compared to the second half. In terms of radial distribution, at x = 30 mm, relatively high CO concentrations are observed in all channels except Channel C, with higher concentrations at the center compared to the edge near the wall. At x = 80 mm, the CO concentration in Channel C approaches zero, while Channels A and B maintain higher concentrations than Channel D, with uniform concentration profiles across each channel's cross-section. At x = 130 mm, the CO concentration in Channel C increases due to backmixing at the outlet of Tube I, approaching the concentration in Channel D, while Channels A and B still retain concentrations above 0.4. The CO concentration distribution trend observed in Fig. 9 is primarily influenced by structural characteristics of the microchannel reactor, reaction kinetics, and backmixing phenomena. Smaller cross-sectional area and lower flow velocity of Channel C result in longer gas residence times, leading to more complete reactions and a significant decrease in CO concentration. Backmixing near Channel C's inlet accelerates CO consumption by promoting rapid heat and reactant diffusion. In the first half of the reactor (x < 80 mm), CO concentration decreases gradually across channels, with Channels A and B showing minimal changes and Channel C experiencing the most significant drop, indicating more complete reaction progress. In the latter half (x > 80 mm), Channel C's CO concentration approaches zero, consistent with the temperature field analysis, confirming near-complete FTS at x = 80 mm. At the outlet of Tube I, backmixing homogenizes CO concentration, particularly evident at x = 130 mm, where Channel C's concentration increases due to backmixing, approaching that of Channel D. Additionally, higher wall temperatures at the inlet of Tube I drive faster reactions and more pronounced CO concentration decreases near the walls, while elevated temperatures in the reactor's latter half accelerate concentration diffusion, resulting in more uniform CO concentration across channel cross-sections.
Additionally, an examination of backmixing in Tube I reveals its influence on reaction performance and product selectivity through changes in residence time, temperature profiles, and concentration distributions. At the inlet, backmixing prolongs the residence time of reactants, increasing local reaction rates and temperatures. This effect is more pronounced at the tube entrance, enhancing C1 selectivity while reducing the selectivity of C3 and C5. Simulations show that some products generated within the inner tube diffuse into Channels C and D due to backmixing, altering product concentrations within each channel and influencing reaction rates and product selectivity.
At the outlet, backmixing redistributes concentrations in the channels near the exit. The concentrations of various components in Channel A decrease, affecting the reaction rate. However, the temperature change at the tube end is minimal, indicating that outlet backmixing has a relatively minor impact on reaction performance and product selectivity.
3.4 Influence of single-sided vs. double-sided catalyst coatings
In contrast to the conventional single-sided catalyst coating on the inner surface of the tube, the Fe-based catalyst-integrated microchannel reactor employed in this study features a double-sided catalyst coating, with catalyst layers applied on both the inner and outer surfaces of Tube I. Based on the operating conditions of Case 9 in Table 2, two comparative simulations, designated as G1 and G2, were conducted. In G1, reactions occurred on both the inner and outer catalyst coatings, whereas in G2, reactions were confined to the inner coating region only. The axial distributions of velocity, temperature, XCO, and C5+ mass fraction along the centers of the four reaction channels are shown in Fig. 10. These simulations allow for a comparison of the catalytic performance of the reactor under identical dimensions and operating conditions, with and without external catalyst coatings.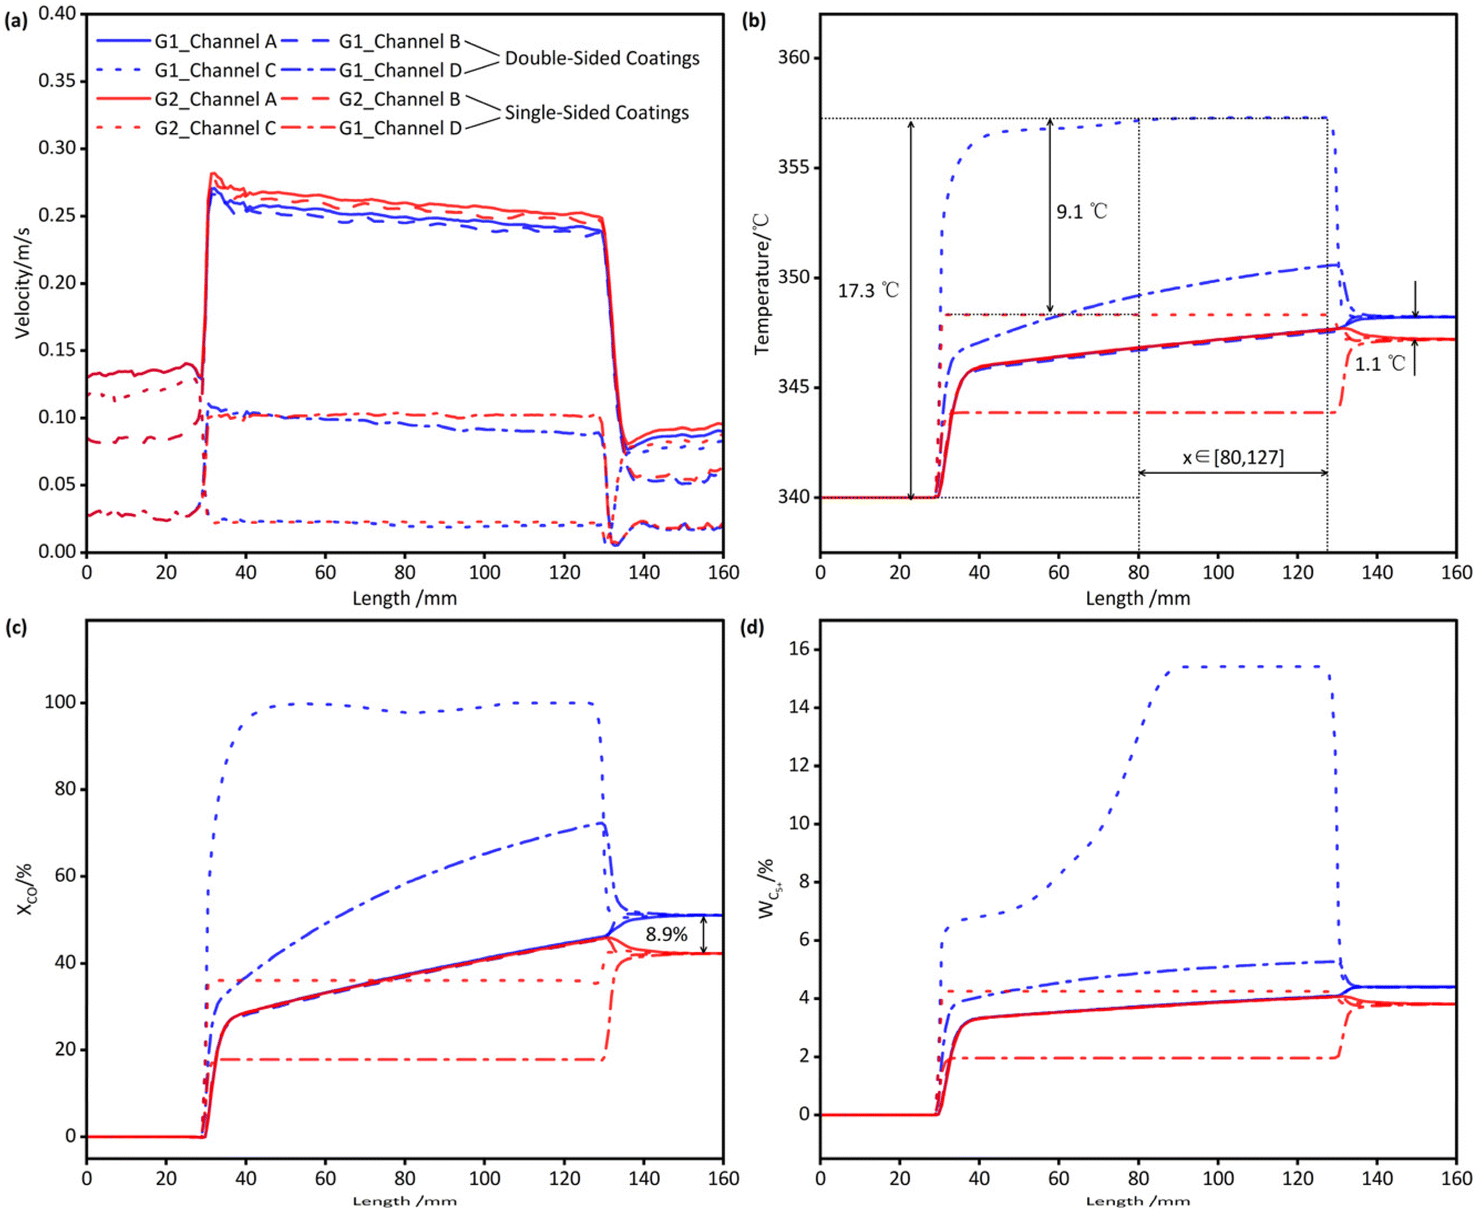 | ||
| Fig. 10 Influence of external catalyst coating on reactor performance. (Operating conditions: case 9 from Table 2. G1 represents the results with catalyst coatings on both the inner and outer walls of Tube I, while G2 represents the results with catalyst coating only on the inner wall of Steel Tube I.). (a) Velocity distribution. (b) Temperature distribution. (c) Local CO conversion rate distribution. (d) C5+ mass concentration distribution. | ||
The temperature distribution of G1 is depicted in Fig. 10(b). Near the inlet of Tube I (x = 30 mm), the temperature within the reaction channels rose sharply, followed by a gradual increase along the channel until approaching the outlet of Tube I (x = 130 mm), where mixing of fluids from different reaction channels resulted in a uniform temperature. Due to differences in cross-sectional area, geometry, and catalyst coating area, the temperature rise varied significantly among Channel A, Channel C, and Channel D. Channel C, characterized by the lowest GHSV, exhibited the highest reaction extent and consequently the highest temperature. Under the conditions of Case 9, the temperature reached its maximum and remains nearly constant within the range of x∈[80, 127] mm. This suggests that the reaction is nearly complete at x = 80 mm, and the temperature ceases to increase. Beyond x = 127 mm, the temperature decreased due to backmixing near the outlet of Tube I, where the fluid mixed with cooler fluids from other channels. Thus, under these operating conditions, the temperature attained its maximum within the range of x∈[80, 127] mm. While the starting point of this range varied slightly under other conditions, the endpoint remained nearly constant, indicating that the length of the backmixing region near the reactor outlet was approximately 3 mm.
The variation of XCO calculated from local CO concentration in G1 is shown in Fig. 10(c). Along the length of the reactor, XCO increases in all four channels as the FTS reaction progresses. Notably, in Channel C, XCO approaches 100% not far from the inlet of Tube I.
The variation of C5+ mass concentration in G1 is illustrated in Fig. 10(d). Along the length of the reactor, the mass concentration of C5+ also increased in all four channels as the FTS reaction progresses. However, in Channel C, despite XCO approaching 100% near the inlet (as shown in Fig. 10(c)), the actual reaction continued until the concentration of C5+ sharply increased in the middle section and then remained constant, indicating the near completion of the reaction. This phenomenon may be attributed to the chain growth factor and the regulating effect of the WGS reaction in the kinetics of FTS over Fe-based catalysts, which promote the conversion of low-carbon hydrocarbons to high-carbon hydrocarbons even at low CO concentrations. Similarly, the smaller temperature variation in the latter half of Channel C (as shown in Fig. 10(b)) further supports this observation.
Simulations show that the external catalyst coating reduces C1 and C3 selectivity while boosting C5+ selectivity. This is explained by the lower local H2/CO ratio in Channels C and D compared to Channels A and B, which increases the chain growth probability and shifts the product distribution towards heavier hydrocarbons. The smaller cross-sectional area of Channels C and D also reduces the local space velocity, further enhancing the chain growth probability.
Overall, compared to G2, in G1 where the external catalyst coating is considered, the maximum temperature increased by 9.1 °C, and the outlet temperature rose by 1.1 °C. Correspondingly, the local XCO at the reactor outlet increased by 8.9%, and the SC5+ increased by 10.24%. In conjunction with the temperatures and conversion rates under other operating conditions, it can be concluded that within the conventional operating range, the use of both internal and external coatings, as opposed to only internal coating, results in a maximum temperature increase of no more than 15 °C, while the single-pass conversion rate can be enhanced by 5–10%.
3.5 Sensitivity analysis of different operating conditions
Taking the operating conditions of G1 as the baseline, the effects of varying inlet temperature, H2/CO ratio, pressure, and GHSV on ΔT, XCO, and product distribution were investigated.As depicted in Fig. 11(a), ΔT peaked at 300 °C as the inlet temperature was increased from 220 °C to 380 °C, while XCO rose progressively. During this process, SCH4, SC3, and SCO2 all increased, while SC5+ decreased. Therefore, to enhance YC5+, a lower inlet temperature is recommended. The inlet temperature significantly determines the reaction temperature, thereby profoundly influencing XCO and product distribution.
 | ||
| Fig. 11 Influence of different operating conditions on ΔT, XCO and product distribution. (a) Inlet temperature. (b) H2/CO feed ratio. (c) Pressure. (d) GHSV. | ||
Given that FTS is a highly exothermic reaction, higher temperatures lead to greater reaction rates, which in turn increase XCO. Below 300 °C, the change in XCO was relatively mild, whereas above 300 °C, the increase in XCO became more pronounced. Correspondingly, ΔT increased up to 300 °C and then decreased. This trend can be attributed to the following two reasons:
Firstly, the formation of FTS products occurs through chain growth involving intermediates. As the temperature increases, the likelihood of intermediate desorption rises, accelerating the chain termination rate during product formation and reducing the probability of carbon chain elongation. Consequently, SCH4 and SC3 increase with rising temperature, while SC5+ decreases.
Correspondingly, the proportion of the highly exothermic C5+-forming reactions diminishes. The continued rise in XCO is counterbalanced by a decline in YC5+, which results in no significant increase in heat release. Similarly, the numerical simulation results of Kshetrimayum et al.20 for a single-channel reactor show that an increase in channel temperature leads to higher CO conversion and increased selectivity of undesired C1 products, while the selectivity of desired C5+ products decreases. This suggests that maintaining the reaction channel temperature below a specific threshold is essential to achieve the desired reaction conversion rates and product selectivity.
Secondly, the impact of the WGS reaction must be considered. The heat release from the WGS reaction is significantly lower than that from hydrocarbon formation reactions. As indicated in the Fig. 11(a), SCO2 increases progressively with rising temperature, suggesting a corresponding increase in the proportion of WGS reaction. Consequently, within the temperature range above 300 °C, the combined effects of the decreasing proportion of C5+-forming reactions and the increasing proportion of WGS reaction lead to a reduction in the overall temperature difference across the reactor.
As shown in Fig. 11(b), with the H2/CO feed ratio increasing from 1/3 to 7/3, both ΔT and XCO gradually increased. Meanwhile, SCH4 and SC3 also rised, while SCO2 and SC5+ decreased. Therefore, to enhance YC5+, a lower feed ratio of 2/3 is recommended. When the H2/CO ratio reaches 7/3, the temperature increase has already exceeded 25 °C. Considering that excessively high temperatures can easily lead to temperature runaway in the reactor, simulations for H2/CO ratios greater than 7/3 were not conducted in this study.
The H2/CO feed ratio has a significant impact on the distribution of reaction products. Generally, an increase in the H2/CO ratio leads to a higher relative hydrogen partial pressure on the catalyst surface, which reduces the surface monomer coverage. As the H2/CO ratio increases, the partial pressure of CO decreases, while the hydrogen partial pressure on the catalyst surface relatively increases. This reduces the coverage of monomers on the catalyst surface, inhibits the combination between carbon chains, and increases the probability of carbon chain desorption. Consequently, the chain termination rate of reaction intermediates accelerates, and the probability of chain growth decreases. Similarly, Tian et al.23 reported that a higher H2/CO ratio favors chain termination to produce light hydrocarbons, while a lower H2/CO ratio promotes chain growth and the formation of heavy hydrocarbons. Dry24 suggested that reducing the CO partial pressure leads to a decrease in H2 species on the catalyst surface, thereby reducing the ability for chain growth and increasing the desorption rate of hydrocarbon products. In contrast, increasing the hydrogen partial pressure causes chain growth reactions on the catalyst surface to terminate with the formation of more alkane species. From the product distribution in this study, it is observed that as the H2/CO feed ratio increases, SCH4 and SC3 rise, while SC5+ and SCO2 gradually decrease. YC5+ reaches its maximum value at an H2/CO feed ratio of 2/3. However, in FTS, the catalyst surface not only experiences competition between CO and H2 for adsorption sites but also faces competition from other components such as CO2 and H2O for active sites. The chemical adsorption of CO is stronger than that of H2, and the negative impact of CO2 and H2O partial pressures on the adsorption of H2 is greater than that on the adsorption of CO. Therefore, the selectivity of FTS products is not simply determined by the H2/CO ratio. Moreover, an excessively low H2/CO ratio can lead to excessive carbon deposition on the catalyst surface, causing rapid deactivation and affecting the catalyst's lifetime.
As shown in Fig. 11(c), with the operating pressure increasing from 0.1 to 2.1 MPa, ΔT reached its peak at 0.5 MPa, While XCO gradually increased. SCH4 and SC3 both decreased, whereas SCO2 and SC5++ increased. Therefore, to enhance YC5+, a higher reaction pressure is preferable. In practice, the operating pressure can be increased by raising the feed rate. The increase in operating pressure raises the partial pressures of the reactants, thereby affecting their collision frequency on the catalyst surface and enhancing the catalyst activity, which in turn increases XCO. Since FTS is a volume-reducing reaction, increasing the pressure favors the re-adsorption of olefins for secondary reactions, which promotes the probability of carbon chain growth.
As shown in Fig. 11(c), with the operating pressure increasing from 0.1 to 2.1 MPa, ΔT reached its peak at 0.5 MPa, while XCO gradually increased. SCH4 and SC3 both decreased, whereas SCO2 and SC5+ increased. Therefore, to enhance YC5+, a higher reaction pressure is preferable.
In practice, the operating pressure can be increased by raising the feed rate. The increase in operating pressure raises the partial pressures of the reactants, thereby affecting their collision frequency on the catalyst surface and enhancing the catalyst activity, which in turn increases XCO. Since FTS is a volume-reducing reaction, increasing the pressure favors the re-adsorption of olefins for secondary reactions, which promotes the probability of carbon chain growth. This mechanism can be further explained as follows:
(1) Enhanced reactant adsorption: higher operating pressure increases the partial pressures of CO and H2, enhancing their adsorption on the catalyst surface. This provides more active sites for reactants, facilitating the formation of reactive intermediates crucial for carbon chain growth.
(2) Kinetic favorability: elevated pressure increases the collision frequency of reactant molecules on the catalyst surface, accelerating reaction kinetics. This is particularly beneficial for forming longer-chain hydrocarbons (C5+), as it promotes carbon–carbon bond formation.
(3) Thermodynamic shift: As a volume-reducing reaction, Fischer–Tropsch synthesis benefits from higher pressures according to Le Chatelier's principle. Increased pressure drives the reaction towards fewer gas molecules, favoring the formation of heavier hydrocarbons (C5+) and enhancing their selectivity.
(4) Secondary reactions and chain growth: higher pressures promote the re-adsorption of olefins, enabling secondary reactions that add more carbon atoms to growing hydrocarbon chains. This significantly increases the probability of carbon chain growth and enhances C5+ yield.
As depicted in Fig. 11(d), with GHSV increasing from 2000 to 16000 h−1, ΔT reached its peak at 4000 h−1, while XCO gradually decreased. SCH4, SC3, and SC5+ remained relatively stable, but SCO2 gradually declined. Therefore, to enhance YC5+, a lower GHSV of 2000 h−1 is more appropriate. The increase in GHSV reduces the residence time of reactants, leading to a gradual decrease in XCO. The variation in ΔT is minimal within 2 °C. Park et al.25 suggested that there is a trade-off between conversion rate and space velocity for productivity, and the optimal space velocity should be determined based on maximum productivity. However, in this study, YC5+ only varied by 3.2% within the space velocity range of 2000–16000 h−1. This may be due to the sensitivity of yield to space velocity being influenced by other operating conditions such as temperature, pressure, and feed ratio.
Based on the observed risks of thermal runaway, several strategies can be employed to enhance reactor safety. These include optimization of operating conditions, modification of tube geometry and spacing, employment of coolants, and implementation of real-time thermal monitoring systems. Due to the limitations of space and the complexity of the work, we hope to explore this in more detail in future research.
4. Conclusions
Based on the kinetics of FTS and CFD, a simulation study was conducted on a multi-tubular catalyst-coated microchannel reactor integrated with Fe-based catalysts. The flow field characteristics, potential locations of thermal runaway, and product distribution within the reactor were analyzed. The results indicate that compared to the scenario where catalysts are coated only internally within the microchannels, the maximum temperature increase by 10 °C and the single-pass conversion rate can be enhanced by 5–10% when catalysts are coated both internally and externally. Sensitivity analysis of four operating conditions (inlet temperature, H2/CO feed ratio, operating pressure, and space velocity) on XCO, ΔT, and product distribution reveal distinct influence patterns. To maximize YC5+, lower inlet temperatures, H2/CO ratios, and GHSV, along with higher operating pressures, are recommended. These findings provide a fundamental basis for the optimal design and operation of the reactor.Data availability
The data supporting this article are available as part of the (ESI).†Conflicts of interest
There are no conflicts to declare.Acknowledgements
We thank Professor Wang yuanyang for his invaluable guidance and support throughout this research. We are grateful to Wang yanqian for their assistance with the experimental work. We also thank the anonymous reviewers for their constructive comments and suggestions that helped improve the manuscript.References
- M. Alhassan, A. A. Jalil, M. B. Bahari, A. H. K. Owgi, W. Nabgan, N. S. Hassan, T. V. Tran, A. A. Abdulrasheed, M. Y. S. Hamid, M. Ikram, M. L. Firmansyah, H. Holilah and N. A. Sholejah, RSC Adv., 2023, 13, 1711–1726 RSC
.
- J. E. Apolinar-Hernandez, S. L. Bertoli, H. G. Riella, C. Soares and N. Padoin, Energy Fuels, 2023, 38, 1–28 CrossRef
- N. Mohammad, S. Aravamudhan and D. Kuila, Nanomaterials, 2022, 12, 24–25 CrossRef PubMed
- C. S. Cao, J. L. Hu, S. R. Li, W. Wilcox and Y. Wang, Catal. Today, 2009, 140, 149–156 CrossRef CAS
- D. Braide, C. Panaritis, G. Patience and D. C. Boffito, Fuel, 2024, 375, 132385 CrossRef CAS
- S. Bepari, R. Stevens-Boyd, N. Mohammad, X. Li, R. Abrokwah and D. Kuila, Mater. Today: Proc., 2021, 35, 221–228 CAS
- H. Cao, R. Xu, X. Tang, T. Yang, S. Hou and C. Hou, Chin. J. Chem. Eng., 2023, 64, 224–240 CrossRef CAS
- N. Mohammad, C. Chukwudoro, S. Bepari, O. Basha, S. Aravamudhan and D. Kuila, Catal. Today, 2022, 397, 182–196 CrossRef
- G. R. S. Santos, O. M. Basha, R. Wang, H. Ashkanani and B. Morsi, Catal. Today, 2021, 371, 93–112 CrossRef CAS
- S. LeViness, S. R. Deshmukh, L. A. Richard and H. J. Robota, Top. Catal., 2014, 57, 518–525 CrossRef CAS
- Z. Teimouri, V. B. Borugadda, A. K. Dalai and N. Abatzoglou, Renewable Sustainable Energy Rev., 2022, 160, 112287 CrossRef CAS
- Z. Yu, Z. Wang, H. Zhong and K. Cheng, RSC Adv., 2024, 14, 28724–28739 RSC
- G. Gumuslu and A. K. Avci, AIChE J., 2012, 58, 227–235 CrossRef CAS
- S. Park, I. Jung, Y. Lee, K. S. Kshetrimayum, J. Na, S. Park, S. Shin, D. Ha, Y. Lee, J. Chung, C. J. Lee and C. Han, Chem. Eng. Sci., 2016, 143, 63–75 CrossRef CAS
- J. Na, K. S. Kshetrimayum, U. Lee and C. Han, Chem. Eng. J., 2016, 1521–1534 Search PubMed
- M.-S. Shin, N. Park, M.-J. Park, K.-W. Jun and K.-S. Ha, Chem. Eng. J., 2013, 234, 23–32 CrossRef CAS
- Y. N. Wang, W. P. Ma, Y. J. Lu, J. Yang, Y. Y. Xu, H. W. Xiang, Y. W. Li, Y. L. Zhao and B. J. Zhang, Fuel, 2003, 82, 195–213 CrossRef CAS
- G. Arzamendi, P. M. Diéguez, M. Montes, J. A. Odriozola, E. F. Sousa-Aguiar and L. M. Gandía, Chem. Eng. J., 2010, 160, 915–922 CrossRef CAS
- D. Q. Gbadago, H. T. Oh, D. H. Oh, C. H. Lee and M. Oh, Int. J. Greenhouse Gas Control, 2020, 95, 102983 CrossRef CAS
- K. S. Kshetrimayum, I. Jung, J. Na, S. Park, Y. Lee, S. Park, C. J. Lee and C. Han, Ind. Eng. Chem. Res., 2016, 55, 543–554 CrossRef CAS
- Y. Wang, Research on synthesis of low carbon hydrocarbons by intedrated Fischer-Tropsch reaction of microreactor and Fe-based catalyst, Taiyuan University of Science and Technology, 2022, DOI:10.27721/d.cnki.gyzjc.2022.000362
- J. O. Maloney, Perry's Chemical Engineer's Handbook, 1984 Search PubMed
- L. Tian, C. F. Huo, D. B. Cao, Y. Yang, J. Xu, B. S. Wu, H. W. Xiang, Y. Y. Xu and Y. W. Li, J. Mol. Struct.:THEOCHEM, 2010, 941, 30–35 CrossRef CAS
- M. E. Dry, Catal. Today, 2002, 71, 227–241 CrossRef CAS
- J. S. Park, D. E. Kim, Y. J. Lee, G. Kwak and M. J. Park, Ind. Eng. Chem. Res., 2016, 55, 9416–9425 Search PubMed
Footnote |
| † Electronic supplementary information (ESI) available. See DOI: https://doi.org/10.1039/d5ra01314c |
| This journal is © The Royal Society of Chemistry 2025 |