
 Open Access Article
 This Open Access Article is licensed under a Creative Commons Attribution-Non Commercial 3.0 Unported Licence
Development of sulfonated polystyrene resin-supported tungsten oxide for Pb2+ ion sequestration†
Kashmala Khaliqa,
Mohsin Ali Raza Anjum b,
Shabnam Shahida*a,
Ramzan Akhtarb,
Adil Khanb,
Munib Ahmad Shafiqc,
Iqra Rafiqd,
Muhammad Rehane,
Rashid Nazir Qureshic,
Sajid Iqbal*f,
Jong-Il Yun*f and
Muhammad Saifullah*b
b,
Shabnam Shahida*a,
Ramzan Akhtarb,
Adil Khanb,
Munib Ahmad Shafiqc,
Iqra Rafiqd,
Muhammad Rehane,
Rashid Nazir Qureshic,
Sajid Iqbal*f,
Jong-Il Yun*f and
Muhammad Saifullah*b
aDepartment of Chemistry, University of Poonch Rawalakot, AJK, Pakistan. E-mail: shabnamshahida01@gmail.com
bChemistry Division, Pakistan Institute of Nuclear Science and Technology (PINSTECH), Nilore 45650, Islamabad, Pakistan. E-mail: saifi.551@gmail.com
cCentral Analytical Facility Division, Pakistan Institute of Nuclear Science and Technology (PINSTECH), Nilore 45650, Islamabad, Pakistan
dDepartment of Chemistry, Government College University Faisalabad (GCUF), Faisalabad, Pakistan
ePhotovoltaic Research Department, Korea Institute of Energy Research, Daejeon, South Korea
fDepartment of Nuclear and Quantum Engineering, KAIST, 291 Deahak-ro, Yuseong-gu, Daejeon 34141, Republic of Korea. E-mail: sajid1@kaist.ac.kr; jiyun@kaist.ac.kr
First published on 1st May 2025
Abstract
A sulfonated polystyrene resin-supported tungsten oxide (SO3-PSWO) was synthesized and evaluated for its efficiency in removing lead (Pb2+) from aqueous solutions. Morphology, phase purity, structural properties, thermal stability, and elemental composition of SO3-PSWO, are evaluated using SEM, XRD, FTIR, TGA, and CHNS analyzers. The ICP-OES technique was utilized for quantitative measurements of the Pb2+ ions. The influence of key parameters such as pH, adsorbent dose, contact time, metal ion concentration, temperature, and interference of competing ions on Pb2+ removal is systematically investigated. Under optimum conditions (pH 3.5–5.5), SO3-PSWO achieved a maximum Pb2+ removal efficiency of 99.7% within one hour and demonstrated an exceptional adsorption capacity of 386 mg g−1, as described by the Langmuir isotherm model. Kinetic analysis revealed a pseudo-second-order mechanism, highlighting chemisorption as the predominant process. Thermodynamic studies indicated an exothermic and spontaneous adsorption behavior. With its easy synthesis, cost-effectiveness, rapid kinetics, high adsorption capacity, and superior efficiency, SO3-PSWO emerges as a promising material for the remediation of Pb2+ contamination in water treatment applications.
1. Introduction
The contamination of water with heavy metals such as Pb, Cd, As, Cu, Cr, Ni, Hg, Mn, and Zn poses a significant global environmental challenge due to their detrimental effects on public health and the ecosystem.1–9 According to the World Health Organization (WHO),10 over 785 million people worldwide lack access to clean drinking water, with a substantial portion of water sources contaminated by heavy metals. Metal-polluted wastewater must be treated to reduce hazardous substances to permissible levels before being released into the environment.11Among heavy metals, lead (Pb2+) is particularly hazardous and carcinogenic.12 Prolonged exposure can cause aminoaciduria, glycosuria, renal cancer, liver failure, skeletal abnormalities, neurological impairment, cardiovascular diseases, developmental disorders, and immune system suppression by reducing immunoglobulin-producing cells and inhibiting antibody synthesis.13–16 Pb2+ contamination has increased in recent years, especially in China. In Pakistan, water systems in Balochistan have reported Pb2+ concentrations ranging from 0.0010 to 0.063 mg L−1, significantly exceeding the U.S. Environmental Protection Agency (EPA) standard of 0.015 mg L−1. The WHO and EPA set maximum Pb2+ levels in drinking water at 10 μg L−1 and 15 μg L−1, respectively.17,18 Whether ingested or inhaled, Pb2+ has severe physiological effects, but effective strategies and preventive measures can help mitigate these risks.16
Various methods such as ion exchange, chemical precipitation, solvent extraction, and membrane filtration have been used for heavy metal removal, these techniques often face challenges like incomplete contaminant removal, high energy costs, and toxic sludge production.19–23 Among them, adsorption stands out due to its simplicity, cost-effectiveness, and reusability of adsorbents after treatment.24–26 Traditional adsorbents, including activated carbon and polymeric ion exchangers, face limitations such as high operational costs, reduced efficiency when competing ions are present, and limited selectivity.27 Functionalized polystyrene, particularly sulfonated forms, has shown promise for heavy metal removal due to its ability to develop diverse polymer matrices.28 Previous studies have incorporated materials like hydrous zirconium oxide and zirconium oxide nanoparticles into polystyrene for effective Pb2+ remediation.9,29 Inorganic nano-oxides and hydroxides, such as ferric oxide, manganese oxide, cerium hydroxide, activated alumina, and zirconium phosphate, have also demonstrated efficiency in heavy metal removal; however, challenges like low adsorption capacity and poor acid resistance persist.30–36 Tungsten oxide has emerged as a promising material due to its thermal stability, acid resistance, and abundant oxygen vacancies, providing numerous active sites for heavy metal adsorption. These properties make tungsten oxide highly effective for advancing water purification technologies.31
Lead (Pb2+) adsorption using tungsten oxide remains limited, underscoring the need for further investigation. Perkins et al.32 demonstrated that commercially available WO3 nanopowder exhibits high Pb2+ sorption efficiency, achieving an adsorption capacity of 324 mg g−1 (36%), highlighting its potential for Pb2+ remediation. In a subsequent study, Perkins et al.33 reported that nanoporous WO3 further enhances Pb2+ adsorption, achieving a 42.5% sorption capacity. The increased porosity, faster sorption kinetics, and larger surface area contribute to reducing Pb2+ concentration to below 0.5 ppb. Additionally, Umejuru et al.34 functionalized coal fly ash with a graphene oxide–tungsten oxide nanorod composite via a hydrothermal process, achieving a Pb2+ adsorption capacity of 41.51 mg g−1. These studies highlight the potential of tungsten oxide-based materials for effective Pb2+ removal, warranting further exploration of their adsorption mechanisms and practical applications.
The inorganic nanoparticles of tungsten oxide tend to agglomerate, significantly decreasing their effectiveness for separation purposes.35 Separating ultrafine particles from aqueous systems can be an inefficient, expensive, and challenging task.36 Powder adsorbents coagulate due to strong van der Waals forces, decreasing their accessible surface area and binding sites, making them less suitable for column or fluidized systems due to high pressure drop and separation difficulties.37,38 To prevent nanoparticle agglomeration and enhance water treatment efficiency, polystyrene divinyl benzene (PS-DVB) is used as a support material for tungsten oxide. Furthermore, the functionalization of PS-DVB with sulfonic acid enhances its removal efficiency for metal ions, and results in rapid adsorption kinetics as it induces additional active sites and improves the dispersion of tungsten oxide. The porous and functionalized PS-DVB ensure uniform distribution of tungsten oxide particles, maximizing active site exposure for effective Pb2+ ion removal from aqueous solution.
This study develops a novel adsorbent by incorporating tungsten oxide onto a polystyrene-based support. The synthesis method is simple, low-temperature, and highly efficient. Tungsten oxide is deposited on pristine and sulfonated polystyrene resins, and their Pb2+ adsorption performance is compared. The sulfonated polystyrene resin enables higher tungsten oxide loading due to sulfonic acid groups, which enhance Pb2+ adsorption capacity. The results demonstrate that tungsten oxide-functionalized sulfonated polystyrene resin exhibits superior removal efficiency and adsorption capacity, making it a highly effective material for Pb2+ remediation.
2. Materials and methods
2.1 Materials
Materials used in this study are divinyl benzene (DVB) (Sigma-Aldrich, 85%), styrene (98%), ethanol (C2H5OH) (Merck, 99%), cyclohexanone (Merck, 99%), gelatin pyruvate (Merck, 99%), gum arabic (98%), deionized water (DI), benzoyl peroxide (BPO) (Sigma-Aldrich, 98%), tungsten powder (99%), acetic acid (CH3COOH) (Merck, 99%), hydrogen peroxide (Merck, 35%), lead chloride (PbCl2) (Sigma-Aldrich, 98%), sulphuric acid (Merck, 97.5%), dichloromethane (99%), nitric acid (HNO3, 65%), and sodium hydroxide (NaOH, 98%). DI water is used for washing and solution preparation.2.2 Synthesis of polystyrene divinyl benzene resin-supported tungsten oxide
The synthesis of tungsten oxide encapsulated polystyrene divinyl benzene (PS-DVB) beads includes three main steps. | ||
| Fig. 1 Schematic illustration of the synthesis process of polystyrene and sulfonated polystyrene resin. | ||
For sulfonation, 10 g of PS-DVB resin is swollen in 50 mL of dichloromethane overnight. Afterward, 50 mL of concentrated sulfuric acid is added to the swollen resin, and the mixture is stirred at 300 rpm and heated to 85 °C for 5 hours to induce sulfonation. The resin is next washed extensively with DI water to eliminate residual acid and impurities, followed by drying at 60 °C overnight.
 | ||
| Fig. 2 Schematic illustrations of the synthesis process of APTA. | ||
The solution is centrifuged for 2 minutes to separate the tungsten powder. The supernatant is combined with 40 mL of acetic acid and heated at 55 °C for 3 hours, forming a milky solution. Solvent removal via rotary evaporation yields a white powder, which is dissolved in 50 mL of ethanol and reheated at 55 °C for 3 hours, producing a yellow solution. Finally, acetylated peroxotungstic acid (APTA) is obtained as a yellow powder using a rotary evaporator.
 | ||
| Fig. 3 Schematic illustration of the synthesis process of pristine polystyrene-supported tungsten oxide and sulfonated polystyrene-supported tungsten oxide. | ||
2.3 Characterization
Scanning electron microscopy (SEM) (TESCAN MAIA3 Triglav) is used to investigate the surface morphology, and energy-dispersive X-ray spectroscopy coupled with SEM is used to assess the loading of WO3 in different host materials. An X-ray diffractometer (XRD) (EQUINOX 3000) with Cu Kα (λ = 1.5408 Å), step size 0.05°, and scan range between 10–80°, is used to study the structural characteristics. The thermal stability of the material is evaluated through thermogravimetric analysis (METLER TOLEDO GA/SDTA851) (TGA). C, H, N, and S elemental concentrations are determined using the elemental analyzer EA2 (ThermoFlash 2000, Italy). The amount of metal ions in adsorption studies is measured using an inductively coupled plasma-optical emission (ICP-OES) spectrometer (Thermo Scientific iCAP 6000).2.4 Adsorption experiment
A 1000 mg L−1 stock solution is prepared by dissolving PbCl2 in 250 mL of DI water. This stock solution is diluted as required for the adsorption experiments. For the batch adsorption study, 100 mg L−1 of Pb2+ solution containing 0.05 g of adsorbent (SO3-PSWO) is used. The mixture is agitated at 250 rpm for 4 hours using a mechanical shaker to ensure sorption equilibrium. After centrifugation and filtration, concentrations of Pb2+ from the supernatant are determined by ICP-OES.Adsorption capacity (mg g−1) and removal efficiency (%) of prepared adsorbents are calculated using eqn (1) and (2), respectively.
 | (1) |
 | (2) |
To evaluate the adsorption characteristics of Pb2+ ions under different conditions, experiments are conducted to study key parameters like pH, adsorbent dosage, contact time, initial metal ion concentration, temperature, and coexisting competing ions.
| ln(qe − qt) = ln(qe) − k1t | (3) |
 | (4) |
To investigate adsorption kinetics, 0.05 g of SO3-PSWO is shaken with 100 mg L−1 Pb2+ solution on a mechanical shaker for 4 hours. Samples are collected at intervals of 5, 10, 20, 30, 45, 60, 120, 180, and 240 minutes, filtered using Whatman grade 42 filter paper having a pore size of 2.5 μm, and analyzed for Pb2+ concentrations.
 | (5) |
 | (6) |
 | (7) |
To study the effect of initial metal ion concentration, Pb2+ solutions with 25, 50, 100, 150, and 200 mg L−1 concentrations are prepared. At each of these concentrations, 0.05 g of adsorbent is added, and the mixture is shaken for 1 hour. Residual Pb2+ concentration is measured to evaluate adsorption capacity at varying initial concentrations.
The suitability of sorption isotherm models was assessed using the chi-square (χ2) test and the linear regression coefficient (R2). The chi-square test quantifies the discrepancies between experimental and model-predicted data by calculating the sum of squared errors, normalized by the model-derived values. The closely matched calculated adsorption capacity (qcal) and the experimental adsorption capacity (qexp) lead to the χ2 value approaching zero, indicating a better fit. Conversely, larger differences between qcal and qexp result in higher χ2 values. The mathematical expression for the χ2 test is provided below for clarity.40
 | (8) |
 | (9) |
| ΔG = ΔH − TΔS | (10) |
The effect of temperature on Pb2+ adsorption is also studied at 298, 313, 323, and 333 K.
2.5 Statistical analysis
All experiments are conducted in triplicate, and the mean values with standard deviations are calculated to evaluate pH, adsorbent dosage, kinetics, and adsorption isotherms. Experimental adsorption data is analyzed by employing various isotherm and kinetic models using both linear and non-linear regression techniques.3. Results and discussion
3.1 Morphology and phase characterization
SEM analysis is conducted to observe the morphology of polystyrene (PS), WO3-incorporated PS (PSWO), and WO3-incorporated sulfonated PS (SO3-PSWO) adsorbents. Fig. 4(a–e) reveals a spherical bead-like morphology with surface variations in all the samples. For further clarity, digital photographs of PS, PSWO, SO3-PS, and SO3-PSWO are also included in the ESI as shown in Fig. S1(a–d).† This is a typical morphology of PS beads synthesized via suspension polymerization, where monomer droplets polymerize into stabilized beads due to agitation and surfactants.42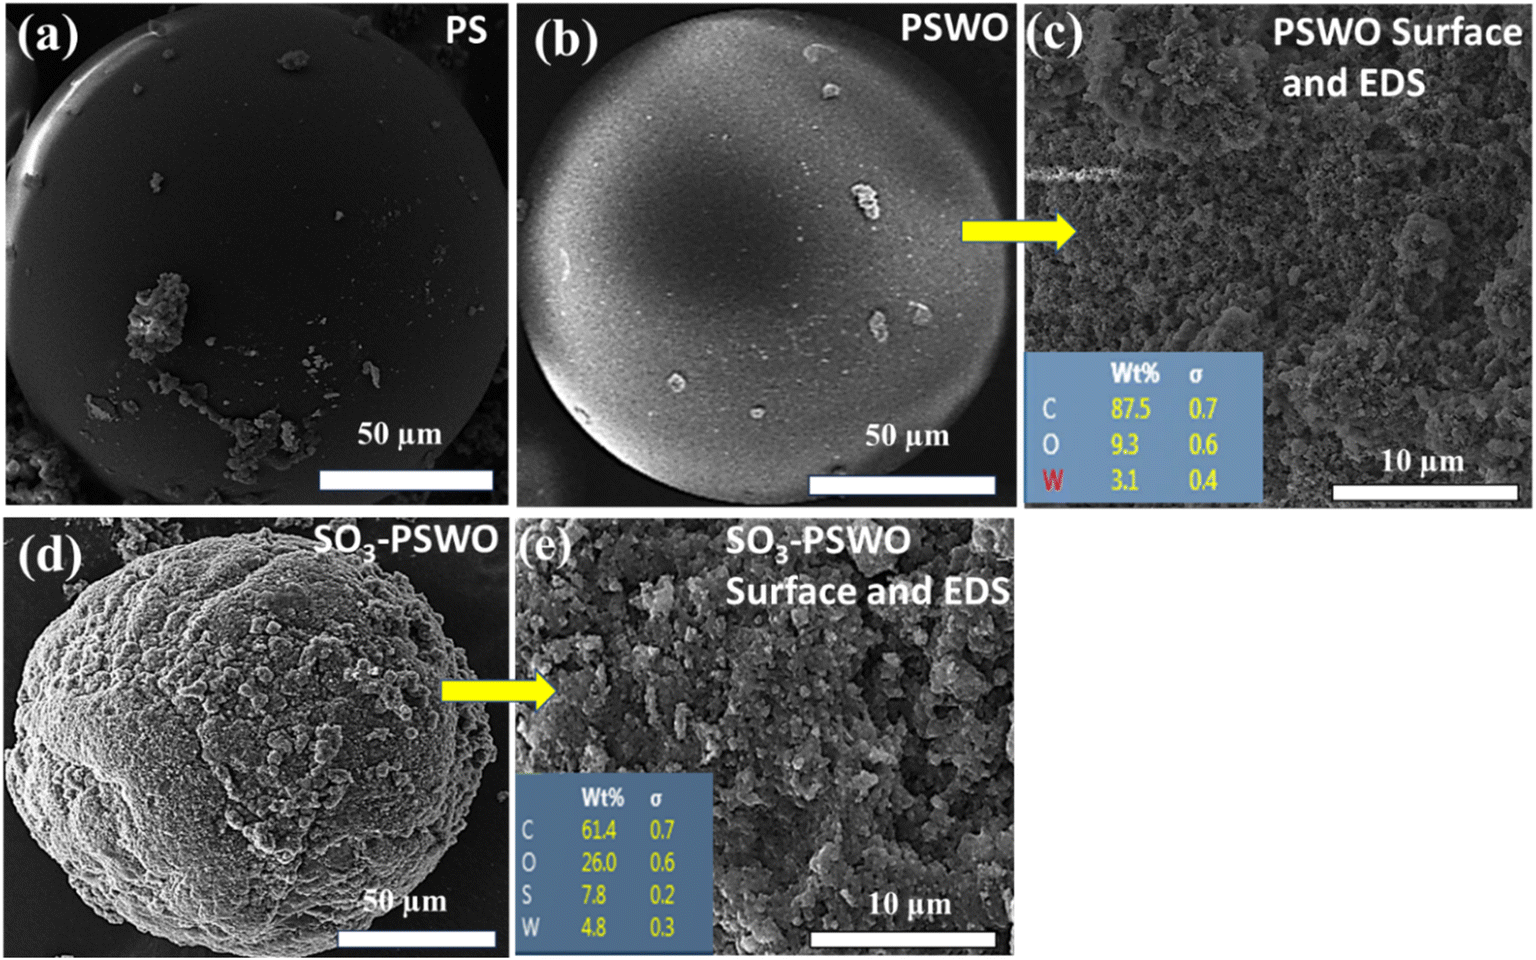 | ||
| Fig. 4 SEM images of (a) PS and (b) PSWO, (c) the surface of PSWO bead along with its EDS spectrum, and (d and e) the SEM images of SO3-PSWO at low and higher magnifications along with EDS data, respectively. | ||
The surface of PS, i.e., a pristine base polymer, is smooth (Fig. 4a), without the addition of WO3 and functionalization, whereas the surface of PSWO is slightly rough (Fig. 4b and c), indicating the incorporation of WO3 in it. The morphology of PSWO is similar to the PS-DVB/Fe3O4 core–shell beads synthesized elsewhere,43 where beads exhibit a rough surface besides some pores and cavities after the Fe3O4 incorporation. This suggests that PS changes its structure because of the addition of WO3, leading to increased surface irregularities and enhancing overall roughness. The EDS data of PSWO present in Fig. 4c (inset), indicates the W concentration of 3.1 wt%.
In the case of SO3-PSWO (Fig. 4d and e), a more pronounced change in the surface morphology of beads can be observed. The significant change in surface roughness can be traced back to sulfonated PS, which is the base material of SO3-PSWO. A similar morphology is reported by Martin et al.,44 where the micrographs of the sulfonated resins show particles (P2S) with a spherical shape having irregular surfaces due to sulfuric acid treatment. This surface roughness originates from sulfonation due to the chemical introduction of sulfonic acid groups, which disrupts the polymer structure and can lead to localized degradation. This results in unevenness and increased porosity, enhancing the overall surface roughness. The roughness of the SO3-PSWO can facilitate the efficient incorporation of WO3 in the SO3-PS support. The elemental mapping results, shown in Fig. S2,† demonstrate a uniform distribution of tungsten oxide particles throughout the host matrix, further confirming the successful incorporation of tungsten oxide in SO3-PSWO. The degree of incorporation of WO3 in SO3-PSWO is comparatively higher, i.e. 4.8 wt% (Fig. 4e), compared with PSWO, which has 3.1 wt% W (Fig. 4c).9
XRD patterns of PS, PSWO, SO3-PS, and SO3-PSWO are shown in Fig. 5. In Fig. 5, PS exhibits a broad hump between at low 2θ values ranging from 10 to 30° indicating its amorphous nature without a regular and repeating pattern, likely because of the random distribution of monomers, i.e. styrene and divinylbenzene, during polymerization and uneven cross-linking of polymer chains through divinylbenzene.45,46 The incorporation of WO3 into PS (i.e. PSWO) shows two broad humps with no discernible peaks in the XRD pattern, indicating that the PSWO is still amorphous. This suggests that besides PS, WO3 incorporated into PS reacted at 100 °C is also amorphous, meaning that the PS surface does not support the growth of crystalline WO3. This is similar to the other studies where WO3 grown on FTO substrate at low process temperature shows the amorphous nature.47 The sulfonation typically involves introducing sulfonic acid (–SO3H) groups onto the PS backbone, a treatment that generally further disrupts the regularity within the polymer introduced by the SO3H groups and breaks the symmetry of the polymer chains.48 This is why the SO3-PS shows an even broader hump in the XRD pattern. Interestingly, when WO3 is grown into SO3-PS, its crystallinity increases, which is indicated by the appearance of distinct peaks in its XRD pattern. XRD peaks do not belong to any single phase; rather, SO3-PSWO seems to be a mixture of two phases. The diffraction peak at the 2θ value of 16.5° corresponds to the (102) plane of monoclinic W17O47 with the PDF card no. 00-044-0396 with space group P2/m. Other peaks at 2θ values of 25.6, 35.0, 49.7, and 52.8° arise from (230), (231), (441), and (460) planes, respectively, with W3O8 orthorhombic crystal system with the PDF card no. 01-081-2263 having space group Pbam. These sharp and distinct peaks confirm that the synthesized WO3 is crystalline. Typically, WO3 is initially produced in an amorphous form at low temperatures, with crystallinity developing at temperatures of ≥400 °C.49 This suggests that the SO3H groups on PS may have promoted the crystallization of WO3 from APTA, even at lower temperatures.
 | ||
| Fig. 5 XRD patterns of PS, PSWO, SO3-PS, and SO3-PSWO. | ||
3.2 Thermal stability and structural analysis
The TGA analysis of PS, PSWO, and SO3-PSWO (Fig. 6) reveals distinct thermal behaviors influenced by the sulfonic acid groups and tungsten oxide. The initial weight loss (5–6 wt%) in PS up to 200 °C is attributed to the evaporation of physically or surface-absorbed water.50,51 In PSWO and SO3-PSWO, a 21.7 wt% weight loss is linked to the elimination of physisorbed and chemisorbed structural water within the resin, as noted by Suleiman et al. (2007).52 Between 200–350 °C, a major weight loss occurs, with SO3-PSWO losing 69.61% and PSWO 78.6 wt%, primarily due to polymer backbone degradation. The presence of SO3H in SO3-PSWO promotes earlier decomposition. Tungsten oxide slightly enhances thermal stability, as evidenced by increased residue content in SO3-PSWO compared to PSWO. In contrast, PS exhibits 85.18% weight loss between 250–500 °C, corresponding to polymer chain decomposition, leaving almost no residue beyond 550 °C, consistent with polystyrene's organic nature.53 | ||
| Fig. 6 Thermal stability analysis of PS, PSWO, and SO3-PSWO. | ||
The CHNS elemental composition of samples is determined by the CHNS elemental analyzer and is summarized in Table 1. CHNS analysis reveals that both PS and PSWO are rich in carbon (C), with negligible changes in C and hydrogen (H) content after WO3 incorporation. However, in SO3-PSWO, a significant reduction in C content and the presence of 0.33 wt% of sulfur (S) confirm the successful sulfonation of PS beads before WO3 loading. This marked decrease (over 50%) in C content in SO3-PS and SO3-PSWO is expected due to the introduction of sulfur groups and the heavy atomic mass of tungsten. Graphical representations of C, H, and S content across all samples are shown in Fig. S3.† The hydrogen concentration in sulfonated PS (5.8%) is slightly higher than in SO3-PSWO (5.6%), suggesting that WO3 primarily integrates with sulfonated PS through SO3H functional groups.
| Sample ID | C (wt%) | H (wt%) | S (wt%) |
|---|---|---|---|
| PS | 85.0 | 7.0 | ND |
| PSWO | 85.9 | 7.3 | ND |
| SO3-PS | 35.7 | 5.8 | 0.33 |
| SO3-PSWO | 338.4 | 5.6 | 0.33 |
Interestingly, a slight increase in C content is observed in both PSWO and SO3-PSWO after WO3 incorporation using acetyl peroxotungstic acid compared to their counterparts' PS and SO3-PS. This increase is more pronounced in sulfonated PS, likely due to residual acetyl groups retained in the polymer matrix. The higher polarity of sulfonated PS, attributed to SO3H groups, may facilitate stronger interactions with the acetyl species, leading to its greater retention.
3.3 Absorption studies
In Fig. 7a, PS exhibits minimal change in adsorption across the tested pH range, with a slight increase at pH 4.5–5.5. In contrast, PSWO shows a significant increase in Pb2+ removal efficiency, rising from 8% at pH 1 to 89% at pH 5.5, attributed to the amorphous WO3. However, its efficiency does not exceed 95%. SO3-PSWO demonstrates superior adsorption across all pH values, achieving 98% removal at pH 3.5 and reaching 99.7% at pH 5.5. The study is conducted within a pH range of 1 to 5.5 to prevent Pb2+ precipitation at higher pH levels.9 Above pH 5.5, interfering species such as Pb(OH)+ and Pb(OH)2 begin to form, resulting in weaker sorption or precipitation from the solution. Consequently, the pH is maintained at 5.5 throughout the upcoming experiments.
 | ||
Fig. 7 (a) Effect of pH ranging from 1 to 5.5 on adsorption of Pb2+ onto PS, PSWO, and SO3-PSWO and (b) effect of adsorbent dose in the range of 0.1 to 5 g L−1 on adsorption efficiency of the SO3-PSWO (C0 = 100 mg L−1, S![[thin space (1/6-em)]](https://www.rsc.org/images/entities/char_2009.gif) :L ratio = 0.5 g L−1, contact time = 1 hour, shaking speed = 250 rpm). :L ratio = 0.5 g L−1, contact time = 1 hour, shaking speed = 250 rpm). | ||
The higher removal efficiencies of PSWO and SO3-PSWO at elevated pH levels can be attributed to reduced proton competition with Pb2+ for adsorption sites. Additionally, variations in the swelling behavior of polystyrene may contribute to this trend, as the polymer undergoes ionization-induced swelling at higher pH values. When acidic functional groups ionize above their pKa, the resulting negative charges on the polymer chains increase electrostatic repulsion, causing expansion. Similar swelling behavior has been reported by Rizwan et al. (2017).55 For kinetic and adsorption modeling studies, SO3-PSWO is selected due to its highest removal efficiency at pH 5.5.
As shown in Fig. 7b, the Pb2+ removal efficiency increases from 80.1% at 0.1 g L−1 to over 99% at 0.5 g L−1. Beyond this dosage, up to 5 g L−1, removal efficiency remains consistently above 99%. These findings suggest that 0.5 g L−1 is the optimal adsorbent dose, as a further increase in dosage does not significantly enhance removal efficiency and may make the process less cost-effective.
 | ||
| Fig. 8 Adsorption kinetics, (a) ln(qe − qt) versus t for PFO model fitting, (b) t/qt versus t for PSO model fitting, and (c) qt versus t data fitted with PSO model (contact time = 240 minutes, shaking speed = 250 rpm, C0 = 100 mg L−1, pH = 5.5, S:L ratio = 0.5 g L−1). Adsorption isotherm models (d) Langmuir linear fitted model, (e) Freundlich linear fitted models, and (f) Langmuir curved fitted model of Pb2+ onto SO3-PSWO. | ||
| Parameters | PFO | PSO |
|---|---|---|
| Experimental qe (mg g−1) | 200.0 | 200.0 |
| Calculated qe (mg g−1) | 34.9 | 201.2 |
| Rate constants (k1 and k2) | 1.10 × 10⁻⁵ min−1 | 0.0035 g mg−1 min−1 |
| R2 | 0.7320 | 0.9999 |
The good fitting of experimental data with the PSO model suggests that Pb2+ undergoes chemisorption on the SO3-PSWO surface through electrostatic interaction between adsorbent surface functional groups (SO3H) and Pb2+ ions.57 The Pb2+ ions chemisorption on the SO3-PSWO surface may occur through ion exchange or complexation reactions. In terms of adsorption, the chemisorption process is preferred over physisorption due to the strong adherence between the adsorbent and the adsorbate.
The concentration of metal ions, specifically Pb2+ in this study, significantly influences the adsorption. At lower Pb2+ concentrations, removal efficiency is typically high due to the abundance of available adsorption sites. However, as Pb2+ concentration increases, the removal efficiency declines. This reduction is primarily attributed to the finite number of adsorption sites on the adsorbent surface, which become saturated at higher metal ion concentrations. Additionally, a higher Pb2+ concentration enhances the driving force for adsorption, increasing the mass transfer of Pb2+ ions from the liquid phase and thereby raising the adsorption capacity.58
To evaluate the adsorption behavior, experimental isotherm data is obtained by varying Pb2+ concentrations from 25 to 200 mg L−1 and analyzing the data using the Freundlich and Langmuir isotherm models. Fig. 8d and e illustrate the fitting of the Langmuir and Freundlich models to the experimental data, while Fig. 8f presents the overlay of Langmuir-fitted data with experimental results. The Langmuir model plotted as Ce/qe versus Ce (Fig. 8d), exhibits an excellent fit, with an R2 value of 0.9903. In contrast, the Freundlich model is based on the linear fit of ln(qe) and lnCe results in a lower R2 value of 0.7837. Furthermore, the χ2 value for the Langmuir model (2.18) is significantly lower than that for the Freundlich model (5.19), further confirming that Langmuir provides a superior fit.
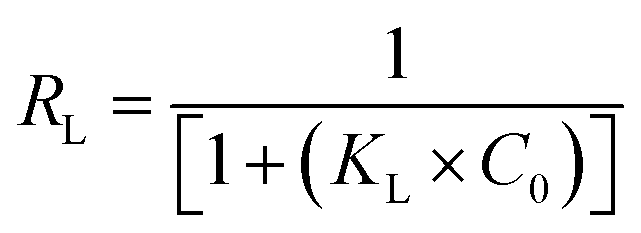
The better agreement of the experimental data with the Langmuir model suggests that Pb2+ adsorption onto SO3-PSWO likely occurrs via chemisorption, involving monolayer coverage of metal binding sites. A summary of parameters obtained by fitting the experimental data following the adsorption isotherm models is provided in Table 3. Importantly, the Langmuir isotherm for SO3-PSWO yields a maximum adsorption capacity (qmax) of 386.10 mg g−1. Additionally, the Freundlich constant (n) of 2.39 and the dimensionless factor, RL, of 0.65 from the Langmuir model indicate that the adsorption process is advantageous.39
| Type of isotherm | Parameter | Values |
|---|---|---|
| Langmuir | Qmax (mg g−1) | 386.10 |
| KL (L mg−1) | 0.4442 | |
| RL | 0.6508 | |
| R2 | 0.9903 | |
| χ2 | 2.18 | |
| Freundlich | KF | 111.41 |
| n | 2.3889 | |
| R2 | 0.7837 | |
| χ2 | 5.19 |
 | ||
| Fig. 9 ln(kc) versus 1/T for Pb2+ adsorption onto SO3-PSWO to determine the change in enthalpy and entropy (C0 = 100 mg L−1, S:L ratio 0.5 g L−1, pH = 5.5, contact time = 1 hour). | ||
Thermodynamic parameters, including the enthalpy change (ΔH°) and entropy change (ΔS°), are calculated using eqn (9), yielding values of −14.55 kJ mol−1 and −0.004 kJ mol−1 K−1, respectively. The negative ΔH° confirms that the adsorption process is exothermic, meaning heat is released as Pb2+ ions bind to the SO3-PSWO surface. This exothermic nature stabilizes the system, as Pb2+ adsorption leads to a lower energy state, making the process thermodynamically favorable.
Furthermore, a negative ΔS° value indicates a decrease in disorder, which means the reduction in entropy at the solid–liquid interface during the adsorption of Pb2+ ions. This shows that the system achieves greater order as Pb2+ ions transition from the solution to the adsorbent surface, likely due to the organized arrangement of ions and water molecules surrounding the adsorption site.60 The adsorption process is most efficient at room temperature, where moderate thermal energy allows Pb2+ ions to interact with the adsorbent's active sites. At elevated temperatures, increased ion mobility disrupts adsorption equilibrium, reducing adsorption efficiency.
Using the determined ΔH° and ΔS° values at different temperatures, ΔG° is also calculated using the standard Gibbs free energy equation (eqn (10)), and the corresponding values are summarized in the Table 4. As the temperature is increased from 298 to 333 K, the value of ΔG° slightly increases from −13.22 to −13.07 kJ mol−1. The overall negative value of ΔG° represents the spontaneity of the adsorption process,56 and its gradual increase from −13.22 to −13.07 kJ mol−1 indicates that the adsorption process becomes increasingly less favorable as the temperature increases.
| ΔH° (kJ mol−1) | ΔS° (kJ mol−1 K−1) | Temperature (K) | ΔG° (kJ mol−1) |
|---|---|---|---|
| −14.55 | −0.004 | 298 | −13.22 |
| 313 | −13.16 | ||
| 323 | −13.11 | ||
| 333 | −13.07 |
The impact of coexisting ions, such as Mg2+, Ca2+, Na+, and K+, on Pb2+ adsorption is also evaluated. Equimolar concentrations of Pb2+ (100 mg L−1) and Mg2+ or Ca2+ are prepared, and 0.05 g adsorbent is added to 100 mL of the mixed solution, which is shaken for 1 hour. The residual concentration of Pb2+, Ca2+, Mg2+, Na+, and K+ is analyzed to assess the preferential adsorption of SO3-PSWO for Pb2+ in the presence of these competing ions.
Fig. 10 exhibited an excellent removal (99.7%) of Pb2+. Notably, the presence of competing cations did not affect the performance of SO3-PSWO, highlighting its high adsorption capacity for Pb2+ ions. It is also worth noting that SO3-PSWO shows almost the same removal for divalent and monovalent metal cations (≥80%). The adsorption process likely involves both electrostatic interactions and ion exchange, where SO3H groups facilitate the uptake of cations irrespective of their charge. This broad affinity may contribute to the observed similar removal rates for monovalent and divalent cations. Moreover, the presence of SO3H groups on the polymer matrix can interact with various cations without a strict preference for divalent ions like Pb2+. This suggests that the material's adsorption behavior is influenced by both charge and steric effects rather than a rigid selectivity pattern.
 | ||
| Fig. 10 Effect of interfering ions on Pb2+ adsorption by SO3-PSWO (C0 = 100 mg L−1, S:L ratio 0.5 g L−1, pH = 5.5, contact time = 1 hour). | ||
The results shown in Fig. 11, indicate a slight decrease in Pb2+ removal efficiency after the the third cycle. However, at a concentration of 100 mg L−1, the removal efficiency slightly decreased up to 7% after four cycles.
 | ||
| Fig. 11 Regeneration and reusability of SO3-PSWO for Pb2+ removal. | ||
The ability to maintain high removal efficiency over multiple regeneration cycles underscores the adsorbent's durability and cost-effectiveness. Additionally, its reusability reduces the frequency of adsorbent replacement and minimizes secondary waste generation, making SO3-PSWO an environmentally friendly and economically viable option for practical water treatment applications.
A comparison of pre-adsorption and post-adsorption characterization using FTIR and SEM is performed, and results are reported in Fig. S4 and S5,† respectively. Successful Pb2+ adsorption by SO3-PSWO is indicated by FTIR by decreasing the intensity of W–O–O, W–O, and W–OH and W![[double bond, length as m-dash]](https://www.rsc.org/images/entities/char_e001.gif) O bands, as shown in Fig. S4b.†
O bands, as shown in Fig. S4b.†
The SEM image of SO3-PSWO pre-adsorption (Fig. S5a†) shows a smooth surface, while the SEM image in post adsorption of Pb2+ (Fig. S5b†) reveals observable changes on the surface. These alterations are probably due to Pb2+ ion adsorption by SO3-PSWO surface or inside pores of the matrix.
| Adsorbents | Adsorption capacity (mg g−1) | References |
|---|---|---|
| Chelating resin functionalized with dithiooxamide | 24.3 | 62 |
| CFA/GO/WO3NRs | 41.5 | 34 |
| Poly(MMA–MAGA) functionalized with methacryloylamidoglutamic acid groups | 65.2 | 63 |
| Poly(styrene-co-divinylbenzene)amine | 73.0 | 64 |
| Polyhedral oligomeric silsesquioxanes (POSS) incorporated with Fe3O4 | 90.9 | 65 |
| EGTA-modified chitosan | 101.4 | 66 |
| Polyacrylamide-hydrated ferric oxide hybrid material | 211.4 | 67 |
| NZP (hydrated Zr(IV) oxide inside a commercial cation exchange resin D-001 nanocomposite) | 319.4 | 9 |
| Commercially available tungsten trioxide (WO3) | 324.0 | 32 |
| MoS2 | 366.0 | 68 |
| SO3-PSWO | 386.1 | This study |
This exceptional performance can be attributed to its dual adsorption mechanism, combining electrostatic attraction facilitated by SO3H groups with strong chemical bonding offered by tungsten oxide. The synergistic interaction between these components enhances the adsorption capacity and ensures rapid uptake kinetics, making SO3-PSWO highly effective for water treatment applications.
The high adsorption capacity of SO3-PSWO positions it as a promising material for practical environmental remediation, especially in scenarios involving heavy metal contamination. Its ability to outperform traditional adsorbents demonstrates its potential for large-scale deployment in water purification systems, aligning with the growing demand for efficient, cost-effective, and sustainable solutions to mitigate water pollution.
3.4 Possible adsorption mechanism
The SO3-PSWO composite, comprising tungsten oxide and sulfonated polystyrene resin, demonstrates higher efficiency in removing Pb2+ ions from aqueous solutions. The adsorption mechanism leverages multiple binding sites provided by tungsten oxide and sulfonate groups, employing electrostatic attraction and chemical binding for enhanced performance. The SO3H group, with its negative charge, attracts Pb2+ ions electrostatically, even in the presence of competing ions.9Additionally, tungsten oxide offers specific surface sites for Pb2+ ions, forming stable coordination complexes. This dual mechanism ensures efficient capture: Pb2+ ions are initially bound to the SO3H groups through electrostatic interactions, followed by tungsten oxide forming strong chemical bonds, leading to stable surface complexes. The strong affinity of tungsten oxide for Pb2+ ions supports a monolayer adsorption behavior consistent with the Langmuir model. Even without the SO3H group, tungsten oxide exhibits significant adsorption capability, as evidenced by PSWO, which achieves 89% Pb2+ removal. The synergetic effect of SO3H groups and tungsten oxide enhances both the efficiency and rate of Pb2+ ion removal, showcasing the material's potential for effective heavy metal remediation.69
4. Conclusion
This study successfully synthesized sulfonated polystyrene resin-supported tungsten oxide (SO3-PSWO) and investigated its efficiency in removing Pb2+ ions from aqueous solutions. A comparative analysis with pristine polystyrene resin-supported tungsten oxide demonstrated the superior performance of SO3-PSWO, attributed to the higher loading of tungsten oxide facilitated by the sulfonic acid groups. XRD analysis confirmed the crystalline nature of tungsten oxide on SO3-PSWO, in contrast to its amorphous form on pristine polystyrene.Comprehensive characterization using SEM, XRD, TGA, CHNS analyzer, and ICP-OES revealed critical insights into the material's morphology, structural properties, thermal stability, and elemental compositions. Adsorption performance is evaluated across various parameters, including pH, adsorbent dosage, contact time, Pb2+ concentration, temperature, and competing ions. SO3-PSWO demonstrated remarkable removal efficiency, achieving near-complete Pb2+ removal within an hour in the pH range of 3.5–5.5. The maximum adsorption capacity reached 386 mg g−1, aligning well with the Langmuir isotherm model, while kinetic studies indicated a chemisorption-driven pseudo-second-order process.
Thermodynamic analysis revealed the adsorption process to be exothermic and spontaneous. The combined effects of sulfonic acid groups and tungsten oxide might have contributed to the high adsorption capacity, making SO3-PSWO a promising material for removing Pb2+ ions from industrial effluents. These findings emphasize its potential as a cost-effective and efficient solution for mitigating heavy metal contamination in water treatment applications.
Data availability
Data will be available on request.Conflicts of interest
There are no conflicts to declare.References
- T. Zhang, P. Li, S. Ding and X. Wang, J. Hazard. Mater., 2022, 424, 127742 CrossRef CAS.
- D. Purkayastha, U. Mishra and S. Biswas, J. Water Process Eng., 2014, 2, 105–128 CrossRef.
- H. Alidadi, S. B. Tavakoly Sany, B. Zarif Garaati Oftadeh, T. Mohamad, H. Shamszade and M. Fakhari, Environ. Health Prev. Med., 2019, 24, 1–17 CrossRef CAS.
- M. Parmar and L. S. Thakur, Int. J. Plant, Anim. Environ. Sci., 2013, 3, 143–157 CAS.
- S. Ray and M. K. Ray, Al Ameen J. Med. Sci., 2009, 2, 57–63 CAS.
- K. K. Das, R. C. Reddy, I. B. Bagoji, S. Das, S. Bagali, L. Mullur, J. P. Khodnapur and M. Biradar, J. Basic Clin. Physiol. Pharmacol., 2019, 30, 141–152 CrossRef CAS.
- K. Vikrant and K.-H. Kim, Chem. Eng. J., 2019, 358, 264–282 CrossRef CAS.
- F. Fernandez-Luqueno, F. Lopez-Valdez, P. Gamero-Melo, S. Luna-Suarez, E. N. Aguilera-Gonzalez, A. I. Martínez, M. García-Guillermo, G. Hernandez-Martinez, R. Herrera-Mendoza and M. A. Álvarez-Garza, J. Environ. Sci. Technol., 2013, 7, 567–584 Search PubMed.
- M. Hua, Y. Jiang, B. Wu, B. Pan, X. Zhao and Q. Zhang, ACS Appl. Mater. Interfaces, 2013, 5, 12135–12142 CrossRef CAS.
- M. Fida, P. Li, Y. Wang, S. K. Alam and A. Nsabimana, Exposure Health, 2023, 15, 619–639 CrossRef CAS.
- S. Gunatilake, Methods, 2015, 1, 14 Search PubMed.
- M. Rose, M. Baxter, N. Brereton and C. Baskaran, Food Addit. Contam., 2010, 27, 1380–1404 CrossRef CAS.
- M. Loghman-Adham, Environ. Health Perspect., 1997, 105, 928–939 CrossRef CAS PubMed.
- D. A. Gidlow, Occup. Med., 2015, 65, 348–356 CrossRef CAS PubMed.
- P. Froom, E. Kristal-Boneh, J. Benbassat, R. Ashkanazi and J. Ribak, Clin. Chem., 1998, 44, 1283–1288 CrossRef CAS.
- P. Mitra, S. Sharma, P. Purohit and P. Sharma, Crit. Rev. Clin. Lab. Sci., 2017, 54, 506–528 CrossRef CAS PubMed.
- J. Su, D. Ji, M. Lin, Y. Chen, Y. Sun, S. Huo, J. Zhu and B. Xi, Resour., Conserv. Recycl., 2017, 117, 294–303 CrossRef.
- A. Xu, Y.-H. Wu, Z. Chen, G. Wu, Q. Wu, F. Ling, W. E. Huang and H.-Y. Hu, Water Cycle, 2020, 1, 80–87 CrossRef.
- S. Wan, X. Zhao, L. Lv, Q. Su, H. Gu, B. Pan, W. Zhang, Z. Lin and J. Luan, Ind. Eng. Chem. Res., 2010, 49, 7574–7579 CrossRef CAS.
- T. A. Kurniawan, G. Y. Chan, W.-H. Lo and S. Babel, Chem. Eng. J., 2006, 118, 83–98 CrossRef CAS.
- D. W. O'Connell, C. Birkinshaw and T. F. O'Dwyer, Bioresour. Technol., 2008, 99, 6709–6724 CrossRef PubMed.
- F. Fu and Q. Wang, J. Environ. Manage., 2011, 92, 407–418 CrossRef CAS.
- H. Eccles, Trends Biotechnol., 1999, 17, 462–465 CrossRef CAS PubMed.
- Y. Sharma, U. S. Upadhyay and F. Gode, J. Appl. Sci. Environ. Sanit., 2009, 4, 21–24 Search PubMed.
- B. Pan, B. Pan, W. Zhang, L. Lv, Q. Zhang and S. Zheng, Chem. Eng. J., 2009, 151, 19–29 CrossRef CAS.
- G. Zhao, X. Wu, X. Tan and X. Wang, Open Colloid Sci. J., 2010, 4, 19–31 CrossRef.
- M. Hua, Y. Jiang, B. Wu, B. Pan, X. Zhao and Q. Zhang, ACS Appl. Mater. Interfaces, 2013, 5, 12135–12142 CrossRef CAS.
- H. Tabekh, M. H. Al Kurdi and Z. Ajji, Polimeri, 2015, 36, 11–14 Search PubMed.
- Q. Zhang, Q. Du, M. Hua, T. Jiao, F. Gao and B. Pan, Environ. Sci. Technol., 2013, 47, 6536–6544 CrossRef CAS PubMed.
- P. Trivedi, L. Axe and T. A. Tyson, Environ. Sci. Technol., 2001, 35, 4515–4521 CrossRef CAS.
- Y. Wang, H. Huang, S. Duan, X. Liu, J. Sun, T. Hayat, A. Alsaedi and J. Li, ACS Sustain. Chem. Eng., 2018, 6, 2462–2473 CrossRef CAS.
- C. K. Perkins, T. M. Reed and A. W. Apblett, RSC Adv., 2015, 5, 68991–68997 RSC.
- C. K. Perkins, T. M. Reed, Z. A. Brown and A. W. Apblett, Environ. Sci.:Water Res. Technol., 2017, 3, 429–432 RSC.
- E. C. Umejuru, E. Prabakaran and K. Pillay, ACS Omega, 2021, 6, 11155–11172 CrossRef CAS PubMed.
- A. A. Keller, H. Wang, D. Zhou, H. S. Lenihan, G. Cherr, B. J. Cardinale, R. Miller and Z. Ji, Environ. Sci. Technol., 2010, 44, 1962–1967 CrossRef CAS PubMed.
- V. Chandra, J. Park, Y. Chun, J. W. Lee, I.-C. Hwang and K. S. Kim, ACS Nano, 2010, 4, 3979–3986 CrossRef CAS PubMed.
- S. Sarkar, A. K. SenGupta and P. Prakash, Environ. Sci. Technol., 2010, 44, 1161–1166 CrossRef CAS PubMed.
- Q. Zhang, B. Pan, B. Pan, W. Zhang, K. Jia and Q. Zhang, Environ. Sci. Technol., 2008, 42, 4140–4145 CrossRef CAS.
- M. B. Desta, Environ. Sci. Technol., 2013, 2013, 375830 Search PubMed.
- S. Z.-e.-H. Ejaz, S. Iqbal, S. Shahida, S. M. Husnain and M. Saifullah, New J. Chem., 2023, 47, 443–452 RSC.
- C. Han, L. Yang, H. Yu, Y. Luo and X. Shan, Environ. Sci. Pollut. Res., 2020, 27, 2455–2463 CrossRef CAS.
- H. Yuan, G. Kalfas and W. Ray, J. Macromol. Sci., Part C, 1991, 31, 215–299 CrossRef.
- M. A. Ali, M. F. Mubarak, M. Keshawy, M. A. Zayed and M. Ataalla, Alexandria Eng. J., 2022, 61, 1335–1352 CrossRef.
- C. Martin, L. Ramirez and J. Cuellar, Surf. Coat. Technol., 2003, 165, 58–64 CrossRef CAS.
- N. Manikandan, Int. J. Recent Innovation Trends Comput. Commun., 2014, 2, 1148–1151 Search PubMed.
- X. Fu and S. Qutubuddin, Mater. Lett., 2000, 42, 12–15 CrossRef CAS.
- J. Han, K.-w. Ko, S. Sarwar, M.-s. Lee, S. Park, S. Hong and C.-h. Han, Electrochim. Acta, 2018, 278, 396–404 CrossRef CAS.
- A. Al-Sabagh, Y. Moustafa, A. Hamdy, H. Killa, R. Ghanem and R. Morsi, Egypt. J. Pet., 2018, 27, 403–413 CrossRef.
- C. Santato, M. Odziemkowski, M. Ulmann and J. Augustynski, J. Am. Chem. Soc., 2001, 123, 10639–10649 CrossRef CAS.
- T. Faravelli, M. Pinciroli, F. Pisano, G. Bozzano, M. Dente and E. Ranzi, J. Anal. Appl. Pyrolysis, 2001, 60, 103–121 CrossRef CAS.
- Q. Zheng and R. Morgan, J. Compos. Mater., 1993, 27, 1465–1478 CrossRef CAS.
- D. Suleiman, E. Napadensky, J. M. Sloan and D. M. Crawford, Thermochim. Acta, 2007, 460, 35–40 CrossRef CAS.
- B. N. Jang and C. A. Wilkie, Polym. J., 2005, 46, 2933–2942 CAS.
- R. Karthik and S. Meenakshi, J. Water Process Eng., 2014, 1, 37–45 CrossRef.
- M. Rizwan, R. Yahya, A. Hassan, M. Yar, A. D. Azzahari, V. Selvanathan, F. Sonsudin and C. N. Abouloula, Polym. J., 2017, 9, 137 Search PubMed.
- K. Mumtaz, S. Iqbal, S. Shahida, M. A. Shafique, M. Wasim and B. Ahmad, Microporous Mesoporous Mater., 2021, 326, 111361 CrossRef CAS.
- W. Cai, M. Gu, W. Jin and J. Zhou, J. Alloys Compd., 2019, 777, 1304–1312 CrossRef CAS.
- W. Zhang, S. Zhang, J. Wang, M. Wang, Q. He, J. Song, H. Wang and J. Zhou, Chemosphere, 2018, 203, 188–198 CrossRef CAS.
- L. Tian, G. Xie, R.-x. Li, X.-h. Yu and Y.-q. Hou, Desalin. Water Treat., 2011, 36, 334–343 CrossRef CAS.
- O. O. Rukayat, M. F. Usman, O. M. Elizabeth, O. O. Abosede and I. U. Faith, S. Afr. J. Chem. Eng., 2021, 37, 74–80 Search PubMed.
- M. A. R. Anjum, S. Iqbal, Z. Toba, S. Javaid, A. Jamal, M. A. Shafique and M. S. Ullah, New J. Chem., 2023, 47, 18260–18271 RSC.
- S. Dutta and A. Das, J. Appl. Polym. Sci., 2007, 103, 2281–2285 CrossRef CAS.
- A. Denizli, N. Sanli, B. Garipcan, S. Patir and G. Alsancak, Ind. Eng. Chem. Res., 2004, 43, 6095–6101 CrossRef CAS.
- B. L. Rivas, S. A. Pooley, H. A. Maturana and S. Villegas, J. Appl. Polym. Sci., 2001, 80, 2123–2127 CrossRef CAS.
- A. Akbari, N. Arsalani, B. Eftekhari-Sis, M. Amini, G. Gohari and E. Jabbari, Front. Chem. Sci. Eng., 2019, 13, 563–573 CrossRef CAS.
- F. Zhao, E. Repo, D. Yin and M. E. Sillanpää, J. Colloid Interface Sci., 2013, 409, 174–182 CrossRef CAS PubMed.
- G. Manju, K. A. Krishnan, V. Vinod and T. Anirudhan, J. Hazard. Mater., 2002, 91, 221–238 CrossRef CAS.
- C. Liu, S. Zeng, B. Yang, F. Jia and S. Song, J. Mol. Liq., 2019, 296, 111987 CrossRef CAS.
- Y. Wang, H. Huang, S. Duan, X. Liu, J. Sun, T. Hayat, A. Alsaedi and J. Li, ACS Sustain. Chem. Eng., 2018, 6, 2462–2473 CrossRef CAS.
Footnote |
| † Electronic supplementary information (ESI) available. See DOI: https://doi.org/10.1039/d5ra01017a |
| This journal is © The Royal Society of Chemistry 2025 |