
 Open Access Article
 This Open Access Article is licensed under a Creative Commons Attribution-Non Commercial 3.0 Unported Licence
Synthesis and DNA binding studies of novel triazine-isatin hybrids: experimental and computational insights†
Alia Mushtaq and
Muhammad Moazzam Naseer *
*
Department of Chemistry, Quaid-i-Azam University, Islamabad 45320, Pakistan. E-mail: moazzam@qau.edu.pk
First published on 18th March 2025
Abstract
DNA binding is a crucial determinant in developing novel anticancer agents, as it plays a key role in the mechanism of action for many chemotherapeutic drugs. In this study, a series of novel s-triazine-isatin hybrids (7a–f) was synthesized, and their binding interactions with salmon sperm DNA (SS-DNA) were investigated under physiological conditions (pH 7.4) using UV-vis absorption spectroscopy. The experimental findings demonstrated strong DNA-binding affinity through absorption and intensity shifts via groove-binding modes with SS-DNA. The binding constants (Kb) of synthesized hybrids with SS-DNA calculated from the Benesi–Hildebrand plot, ranged from 104 to 105 M−1, with compound 7f exhibiting the highest binding constant (9.51 × 10⁵ M−1) at 298 K, surpassing the reference cabozantinib. The Gibbs free energy change in the binding interaction of 7f, was found to be ΔG = −34.1 kJ mol−1 indicating a spontaneous binding process. The molecular docking results supported experimental findings with a docking score of −10.3 kcal mol−1 for 7f, highlighting hydrophobic and hydrogen bonding interactions within the AT-rich region of DNA grooves. In addition, DFT and in silico studies provided insights into the charge density of structures and drug-likeness, hence the s-triazine-isatin hybrid core holds promise as a potential therapeutic agent.
1. Introduction
Cancer continues to be a leading cause of morbidity and mortality worldwide, highlighting the critical need for ongoing research into novel therapeutic agents.1,2 Despite significant progress in treatment options, challenges such as drug resistance and toxicity emphasize the urgent demand for new compounds that offer improved efficacy and selectivity.3,4 Therefore, the design and development of small molecules with anticancer potential have attracted considerable attention due to their ability to target and modulate key biological pathways.5–7DNA is a well-established target for anticancer drugs,8 as interactions between drugs and DNA can disrupt cellular replication and transcription processes.9–11 Small molecules interact with DNA through covalent or noncovalent mechanisms, modulating its structure and function.12 Noncovalent interactions are typically classified into groove binding, intercalation, and electrostatic binding.13 Intercalation involves the insertion of a small molecule between DNA base pairs, which distorts the DNA backbone.14,15 In contrast, groove binding occurs within the minor or major grooves of DNA, facilitated by dispersion forces or hydrogen bonding, and is influenced by the structural and electronic properties of the small molecules.14,15 Given the crucial role of DNA in essential cellular processes, studying its interactions with small molecules is vital for drug discovery, especially when designing novel therapeutic agents with enhanced specificity and efficacy.16–21
Triazines and isatin derivatives represent two pharmacophoric scaffolds that have demonstrated broad-spectrum biological activities, including anticancer properties.22–26 Triazines, recognized for their versatility in medicinal chemistry, serve as the structural foundation for several commercially available anticancer drugs including altretamine, gedatolisib, and bimiralisib.27–29 Similarly, isatin (indole-2,3-dione) and its derivatives have exhibited promising anticancer activities by targeting various cellular mechanisms, such as DNA interaction and enzyme inhibition.30–32 Notably, isatin-based compounds are key components of FDA-approved anticancer drugs such as sunitinib and nintedanib.33,34
In recent years, pharmacophore hybridization has emerged as a promising strategy for developing novel anticancer agents, as different pharmacophores work synergistically to enhance biological activity.35–39 In this context, both s-triazine and isatin have produced excellent results.40,41 Given the importance of hybrid approach and our recent interest in developing anticancer agents based on s-triazine42 and isatin,43 herein we report the synthesis of a series of novel s-triazine-isatin hybrids (7a–f) and their evaluation for DNA binding properties using UV-vis absorption spectroscopy. Salmon sperm DNA (SS-DNA) is typically favored as a DNA model for its availability and cost-effectiveness,10 was employed in this study to investigate its interaction with newly synthesized compounds, providing insights into their binding mechanisms and therapeutic potential. In addition, molecular docking, density functional theory (DFT) analyses, and in silico ADMET profiling were performed to predict binding modes, binding strength, specificity, and drug-likeness. The integration of experimental and computational findings highlights the remarkable potential of these novel hybrids as promising anticancer agents.
2. Results and discussion
2.1 Chemistry
A convergent synthetic pathway was utilized for the synthesis of s-triazine-isatin hybrids (7a–f) (Scheme 1). Fragment I, diphenoxy-linked hydrazinyl s-triazines (3) were synthesized by reacting trichlorotriazine (1) with 2 equivalents of various substituted phenols using anhydrous potassium carbonate as an acid scavenger for liberated hydrochloric acid.44 Maintaining reaction conditions was also crucial, as the reaction was initiated at ice-cold temperatures and subsequently transitioned to room temperature to minimize the formation of tri-substituted side products. The diphenoxy-linked s-triazines (2) were subsequently reacted with hydrazine monohydrate at room temperature,45 yielding fragment I (3). Likewise, the alkylation reaction of isatin (4) with 2-chloro-N-(4-bromophenyl)acetamide (5) in the presence of DMF, yielded fragment II, 4-bromophenyl acetamide pendant isatin (6), in good yield.46,47 Finally, the two synthesized fragments were refluxed in the presence of ethanol and a few drops of glacial acetic acid to afford series of phenoxy-linked s-triazine-based hydrazones of N-alkylated isatins (7a–f). | ||
| Scheme 1 Synthetic pathway of various s-triazine-isatin hybrids (7a–f). | ||
The chemical structures of the newly synthesized compounds (7a–f) were elucidated through comprehensive characterization using spectroscopic techniques, including FTIR, NMR, and MS analyses.
In the 1H NMR spectrum of compound 7a, the hallmark singlets for –NH protons of hydrazone moiety and amide linkage appeared at 12.65 ppm and 10.51 ppm respectively. Moreover, the absence of –NH2 protons of compound 6 also evidenced the hydrazone formation by the condensation of hydrazinyl s-triazine scaffold with the carbonyl of isatin. The aromatic region is characterized by multiplets corresponding to an 18-proton integration within the δ 7.16–7.58 range, validating the substitution pattern on the aromatic rings. The singlet at 4.66 ppm integrating two protons was assigned to methylene group of N-phenylacetamide (–N–CH2). Furthermore, in the 13C NMR spectra of compound 7a, the most deshielded signals at 167.5 ppm and 165.5 ppm were accredited to the carbonyl of amide moieties. The absence of keto-carbonyl carbon further supported the formation of hydrazones. The signal in the aliphatic region at 43.2 suggested the presence of methylene group of N-phenylacetamide (–NCH2) moeity. Moreover, the signals observed in the range of 110.8 to 161.7 were attributed to the aromatic carbons of the s-triazine-isatin hybrids (see ESI† for further details).
The mass spectra of the s-triazine-isatin hybrids (7a–f) also revealed parent ion peaks [M − 1], consistent with their respective molecular formulas. Furthermore, the FTIR spectral analysis revealed distinct absorption bands characteristic of the functional groups, supporting the structural frameworks of the synthesized compounds (7a–f).
2.2 DNA binding studies
In pharmacology, assessing the DNA-binding affinity of newly synthesized compounds is a key approach for evaluating their antitumor potential.42,48 Investigating these drug–DNA interactions is critical to understanding their biological mechanisms and optimizing their efficacy.49–51UV-visible spectroscopy is a powerful tool for investigating the binding modes and strengths of DNA–compound interactions.52,53 The absorption spectra for compounds (7a–f) were recorded at a constant concentration of 50 μM, with varying the concentration of SS-DNA (5–35 μM).10 As expected, all unbound derivatives (7a–f) displayed absorption within the 300–450 nm range, with absorption maxima falls in the range of 340–351 nm. The findings revealed that successive additions of DNA induced characteristic spectral changes, including hyperchromic and hypochromic effects, accompanied by bathochromic (red) or hypsochromic (blue) shifts in the UV-vis spectral bands. These spectral shifts are indicative of robust interactions between the synthesized compounds (7a–f) and the SS-DNA double helix54 (Fig. 1).
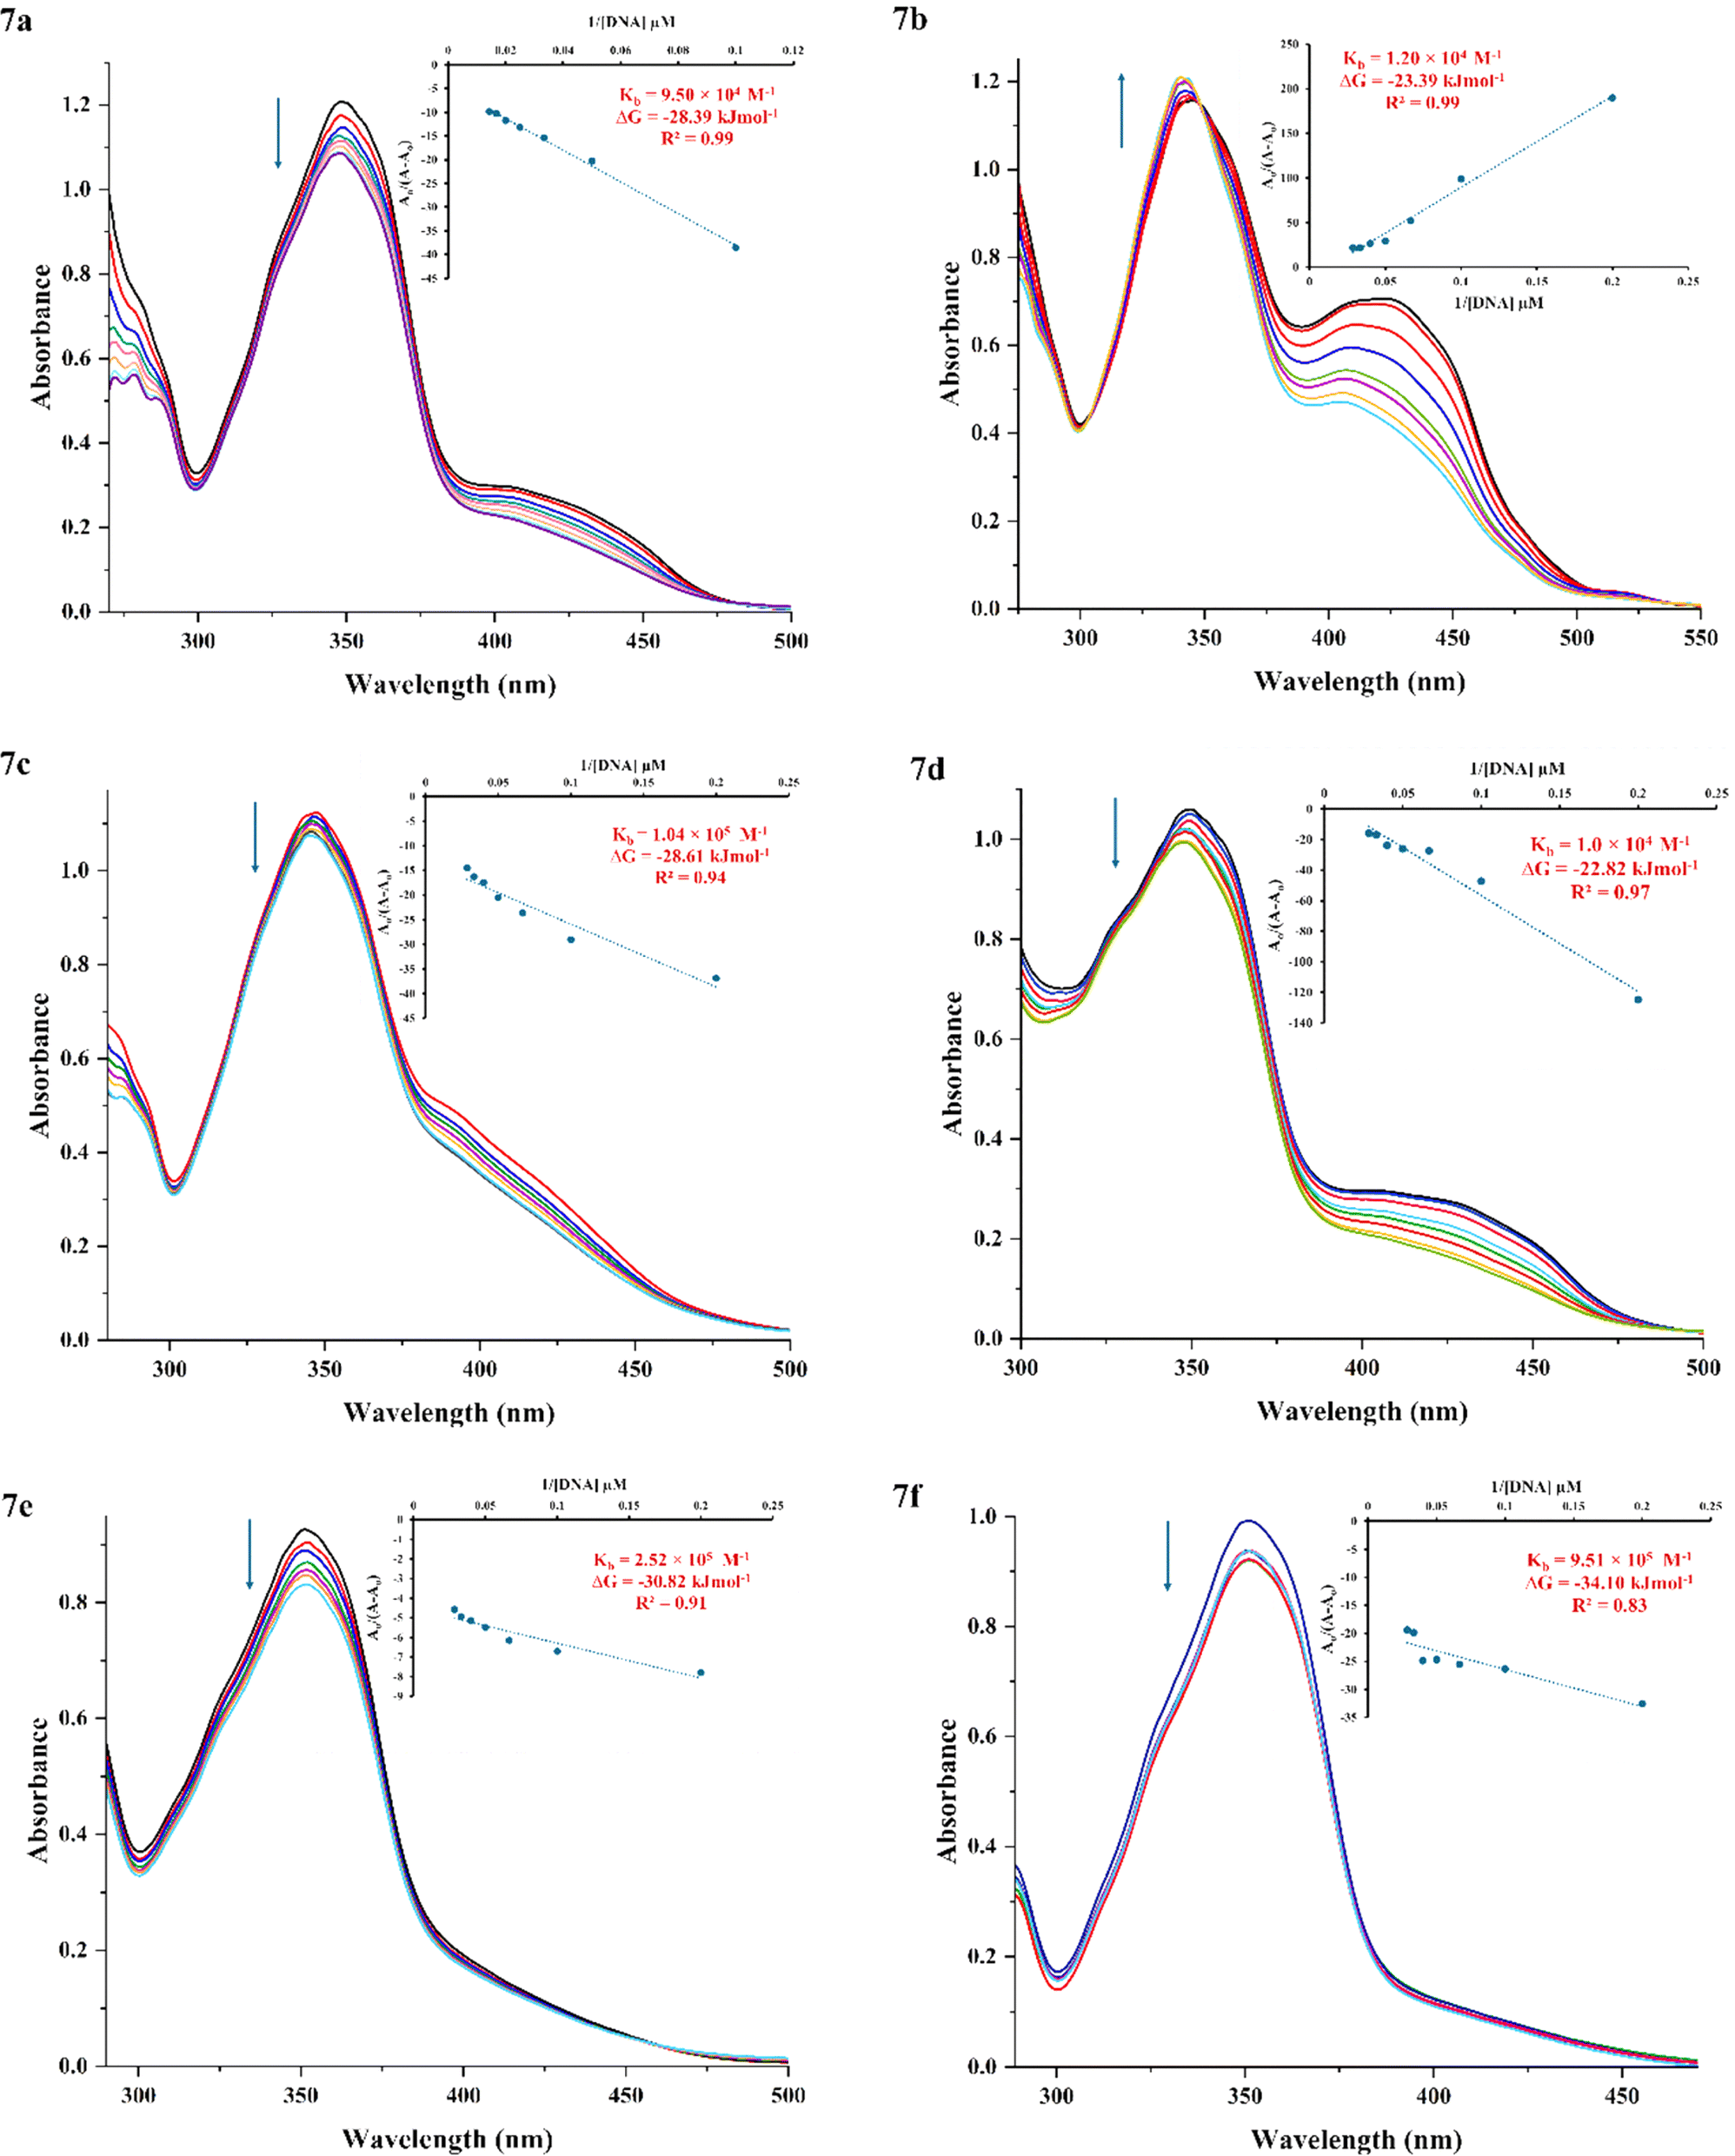 | ||
| Fig. 1 UV-vis absorption spectra of compounds (7a–f) at pH 7.4 and room temperature, with and without varying SS-DNA concentrations (5–35 μM), demonstrating spectral shifts indicative of groove binding interactions. Inset: plot of A0/(A − A0) as a function of 1/[DNA]. | ||
Among the synthesized compounds, 7b (R = 4-Br) uniquely displayed a hyperchromic effect and a pronounced red shift (6 nm) in the UV-vis spectra, signifying notable conformational and structural changes in DNA upon interaction due to π–π* and n–π* transitions.55,56 However, the remaining compounds showed a hypochromic shift, with slight blue shift or without significant red shift (Fig. 1) indicating aromatic electron stabilization and enhanced compound-DNA complex stability via major or minor groove binding mode.8,57,58
Binding affinity, a fundamental determinant of drug potency, is quantified using the association constant (Kb), where higher Kb values reflect stronger and more effective binding interactions.14,59 The binding constants (Kb) for compound-DNA complexes were calculated using the Benesi–Hildebrand equation, to assess the binding strength of the synthesized derivatives (7a–f). These values were determined from the A0/(A − A0) intercept-to-slope ratios plotted against 1/[DNA].60 At room temperature, the Kb values were found to range from 104 to 105, with higher values signifying a greater affinity for DNA binding. The Kb values for the compounds (7a–f) followed the ascending order: 7d < 7b < 7a < 7c < 7e < 7f (Table 1). These variations in the binding strength were attributed to the differing electronic contributions of the substituents, influencing the interaction of the compounds with SS-DNA.
Notably, compound 7f (R = 3-CF3) exhibited the highest binding constant (Kb = 9.51 ×10⁵ M−1), highlighting its superior interaction profile compared to other derivatives. This aligns with its significant hypochromic effect without significant red shift, suggesting its strong binding affinity and potential to bind in the grooves of DNA, consistent with the literature.14,61,62 Although, its binding constant was lower than that of the classical intercalators like ethidium bromide (1.4 × 10⁶ M−1),63 it aligned with the typical range for DNA groove binders like cabozantinib (Table 1).10,64–67 These results underscore the influence of substituents on DNA binding efficacy, particularly the role of electronic and hydrophobic effects in enhancing groove binding.
Additionally, the variation in light absorption observed across all compounds, does not correlate with DNA binding strength. Although the derivative 7b, exhibited the greatest hyperchromic and bathochromic shifts, it did not have the highest Kb value, likely due to electronic and lipophilic effects.58 Substituents at the para position with smaller electronic profiles (σ) were found to positively influence DNA interactions. However, the substituents with positive lipophilicity (+π) i.e. CF3, as indicated in Craig Diagram,68 demonstrated higher Kb values (Table 1). Besides that, the strong electron-withdrawing nature of the CF3 group reduces the availability of free electron pairs, facilitating hydrophobic interactions and stabilizing the DNA-compound complex.58 In comparison, derivatives with smaller or less lipophilic substituents, such as 7d (4-NO2), exhibited lower binding constants (1.0 × 10⁴ M−1), consistent with reduced hydrophobic stabilization. These findings emphasize the pivotal role of substituents in modulating electronic properties and lipophilicity, directly impacting binding strength and selectivity.
The Van't Hoff equation (ΔG = −RT![[thin space (1/6-em)]](https://www.rsc.org/images/entities/char_2009.gif) lnKb) was used to determine the Gibbs free energy (ΔG) for the interaction between the tested compounds (7a–f) and SS-DNA.10 The compound 7f (R = 3-CF3) exhibited the most negative ΔG value of −34.1 kJ mol−1 (Table 1), surpassing the standard cabozantinib,10 indicating a spontaneous and thermodynamically favorable binding process under the given conditions.42 Henceforth, these findings suggested that compounds (7a–f) hold potential as future therapeutic agents for treating various diseases.
lnKb) was used to determine the Gibbs free energy (ΔG) for the interaction between the tested compounds (7a–f) and SS-DNA.10 The compound 7f (R = 3-CF3) exhibited the most negative ΔG value of −34.1 kJ mol−1 (Table 1), surpassing the standard cabozantinib,10 indicating a spontaneous and thermodynamically favorable binding process under the given conditions.42 Henceforth, these findings suggested that compounds (7a–f) hold potential as future therapeutic agents for treating various diseases.
2.3 Molecular docking
The rational design of effective anticancer agents involves considering a drug's ability to bind to DNA because this binding makes it possible to identify particular DNA regions that are targeted through non-covalent interactions.10,69 When combined with experimental methods, molecular docking studies provide useful information for identifying possible drug candidates.70 Docking analyses were performed using AutoDockTools 1.5.7 to assess the interaction mode and binding affinity of synthesized s-triazine-isatin hybrids (7a–f) with DNA (PDB ID: 3EY0).71 The results revealed significant binding affinity of all studied compounds with the double-helix DNA (sequence: 5′-(ATATATATAT)-3′), with docking scores ranging from −8.5 to −10.3 kcal mol−1 (Table 2). Notably, the 3-trifluoromethyl-substituted derivative 7f showed the highest binding affinity, scoring −10.3 kcal mol−1.| Compds | R | Binding energy (kcal mol−1) | Compound-DNA interactions | |
|---|---|---|---|---|
| Hydrogen bonding | Hydrophobic | |||
| a da: deoxy-adenine, dt: deoxy-thymine. | ||||
| 7a | H | −8.7 | dt4 (A), da5 (A), da 7 (B) | dt2 (A), da3 (A), dt4 (B), da5 (B), dt6 (B) |
| 7b | 4-Br | −8.7 | da5 (A) | dt2 (A), da3 (A), dt4 (A), dt4 (B), da5 (B), dt6 (B), da7 (B) |
| 7c | 4-Cl | −8.9 | da 7 (B) | dt2 (A), da3 (A), dt4 (A), dt4 (B), da5 (B), dt6 (B) |
| 7d | 4-NO2 | −8.5 | — | dt4 (A), da5 (A), dt6 (A), dt6 (B), da7 (A), da7 (B), dt8 (B), da9 (B) |
| 7e | 3-Me | −8.9 | da5 (A), da7 (B) | dt2 (A), da3 (A), dt4 (A), dt4 (B), da5 (B), dt6 (B) |
| 7f | 3-CF3 | −10.3 | da7 (B) | da5 (A), da5 (B), dt6 (A), dt6 (B), da7 (A), dt8 (A), dt8 (B), da9 (B) |
The representative docking poses of compounds (7a–f) revealed their interaction with DNA through a mixed binding mode in both the major and minor grooves (Fig. 2). Molecular docking results supported the experimental DNA binding studies, showing hydrogen bonding and hydrophobic interactions between the compounds and DNA (3EY0). Compounds 7a, 7b, 7c and 7e incorporating R![[double bond, length as m-dash]](https://www.rsc.org/images/entities/char_e001.gif) H, 4-Br, 4-Cl, and 3-Me respectively, displayed binding interactions in the major groove of DNA. However, compounds 7d (R = 4-NO2) and 7f (R = 3-CF3) were found to bind in the minor groove of DNA (Fig. 2). The docking protocol was also validated by superimposing the co-crystallized ligand on the redocked structure, which exhibited the RMSD value of 1.4292 Å (Fig. S1†).
H, 4-Br, 4-Cl, and 3-Me respectively, displayed binding interactions in the major groove of DNA. However, compounds 7d (R = 4-NO2) and 7f (R = 3-CF3) were found to bind in the minor groove of DNA (Fig. 2). The docking protocol was also validated by superimposing the co-crystallized ligand on the redocked structure, which exhibited the RMSD value of 1.4292 Å (Fig. S1†).
 | ||
| Fig. 2 3D docked view of compounds (7a–f) with the nitrogenous base pairs of DNA (3EY0): and cartoon presentation (right) and surface view (left); deoxy adenine-da (red), deoxy thymine-dt (blue), 7a (yellow), 7b (orange), 7c (green), 7d (pink), 7e (cyan) 7f (purple). | ||
The hydrogen bonding and hydrophobic interactions of compounds (7a–f) are presented in Fig. 3. The top scorer compound 7f displayed two hydrogen bond interactions (2.91 and 3.30 Å distance) with the da7 base of chain B (Table 2), which corroborated the hydrogen bond interactions of the standard tyrosine kinase inhibitor, cabozantinib (2.64 and 3.08 Å distance).10 In addition, hydrophobic interactions with the same nitrogenous pairs dt8, dt6, da5, da7, and da9 were found, suggesting similar sorts of interactions in the binding site of DNA as in the case of standard cabozantinib. Furthermore, the NH group of hydrazones, lactum carbonyl of isatin and oxygen of phenoxy groups in compounds (7a–f) were mainly involved in the hydrogen bonding interactions with adenine and thymine base pairs of DNA (Fig. 3) The hydrazone functionality is also well-recognized for its antitumor properties.72
 | ||
| Fig. 3 2D schematic representation of the binding interactions in compounds (7a–f)–DNA complexes, illustrating hydrogen bond interactions (green dashed lines), hydrogen bond lengths (Å), and hydrophobic interactions (red rays). | ||
2.4 DFT studies
Density functional theory (DFT) offers a framework for understanding chemical reactivity through the electron density of a system.72,73 The parameters obtained from the optimized geometries (Fig. 4) of the synthesized hybrids (7a–f) provide valuable insights into molecular interactions, complementing the findings from molecular docking analyses.43,74 | ||
| Fig. 4 Optimized structures of s-triazine-isatin hybrids (7a–f). | ||
FMO analysis of s-triazine-isatin hybrids (7a–f), revealed variations in electronic properties influenced by substituents.8 Global reactivity descriptors including EHOMO, ELUMO, energy gap (ΔEgap), electron affinity (EA), ionization potential (IP), electronegativity (χ), chemical potential (μ), chemical hardness (η), chemical softness (S), and electrophilicity (ω) (Table 3) were determined using B3LYP method and 3-21G basis set.75 All the synthesized compounds (7a–f) displayed dipole moments within the suitable range of 3.18 to 5.48 debye (Table 1), indicative of significant charge separation that enhances solubility in polar solvents such as water and highlights suitable polarity for drug-like behavior.76 The most potent compound 7f (R = 3-CF3), exhibited dipole moments of 5.48 D, which fall well within the optimal range for drug-like molecules, suggesting an ideal balance of charge separation to ensure enhanced solubility while maintaining favorable pharmacokinetic properties.
| Compds | R | Dipole moment (Debye) | EHOMO (eV) | ELUMO (eV) | Energy gap (ΔEGap) | Ionization potential IP (eV) | Electron affinity EA (eV) | Electro-negativity χ (eV) | Electro-chemical potential μ (eV) | Hardness η (eV) | Softness S (eV) | Electro-philicity ω (eV) |
|---|---|---|---|---|---|---|---|---|---|---|---|---|
| 7a | H | 3.96 | −5.85 | −2.60 | 3.25 | 5.85 | 2.60 | 4.23 | 1.625 | 1.625 | 0.308 | 0.81 |
| 7b | 4-Br | 3.77 | −5.88 | −2.71 | 3.17 | 5.88 | 2.71 | 4.30 | 1.585 | 1.585 | 0.315 | 0.79 |
| 7c | 4-Cl | 3.67 | −5.89 | −2.73 | 3.16 | 5.89 | 2.73 | 4.31 | 1.58 | 1.58 | 0.316 | 0.79 |
| 7d | 4-NO2 | 3.70 | −5.79 | −2.94 | 2.85 | 5.79 | 2.94 | 4.37 | 1.425 | 1.425 | 0.351 | 0.71 |
| 7e | 3-Me | 3.18 | −5.83 | −2.55 | 3.28 | 5.83 | 2.55 | 4.19 | 1.64 | 1.64 | 0.305 | 0.82 |
| 7f | 3-CF3 | 5.48 | −5.94 | −2.84 | 3.10 | 5.94 | 2.84 | 4.39 | 1.55 | 1.55 | 0.322 | 0.78 |
In addition, EHOMO reflects the greater electron-donating ability of a compound, whereas higher ELUMO represents its electron-withdrawing capacity.77 The negative energies of EHOMO and ELUMO indicated the inherent stability of all the studied compounds (7a–f) (Table 3). The energy gap (ΔELUMO−HOMO) reflects the chemical behavior and kinetic stability of compounds. The EHOMO and ELUMO values (−5.94 to −5.79 eV and −2.94 to −2.55 eV, respectively) and energy gaps (ΔEgap, 2.85–3.28 eV) suggested inherent stability and reactivity (Table 3). Compounds 7d (R = 4-NO2) and 7f (R = 3-CF3), incorporating electron-withdrawing groups, displayed the lower (ΔELUMO–HOMO) values, indicating their high propensity for chemical reactivity due to smaller gaps. This characteristic makes these compounds promising candidates for drug development due to their efficient electron-donating and electron-accepting capabilities.
Ionization potential (IP) and electron affinity (EA) correlated with these orbital energies, while electronegativity (χ) values for compounds (7a–f) ranged from 4.19 eV (7e; R = 3-Me), to 4.39 eV (7f; R = 3-CF3) (Table 3), reflecting a strong electron-attracting tendency due to the electronic effects of the substituents. Furthermore, these reactivity indices quantify the tendency of chemical species to interact with electrons. A strong nucleophile is characterized by low values of chemical potential (μ) and electrophilicity (ω), while a strong electrophile exhibits high values of these parameters.78 The hardness and softness values classify these compounds as relatively soft, implying higher reactivity. Likewise, the electrophilicity index (ω) varied from 0.71 eV to 0.82 eV (Table 3) with higher values denoting an increased ability to accept electrons. Compound 7d exhibited the lowest hardness (η = 1.425 eV), highest softness (S = 0.351 eV), and lowest electrophilicity index (ω = 0.71 eV), signifying high reactivity and nucleophilic tendency. In contrast, 7e had the highest hardness (η = 1.64 eV) and electrophilicity (ω = 0.82 eV), indicating greater stability and electron-accepting potential (Table 3). These results highlight the impact of substituents on the stability and reactivity of s-triazine-isatin hybrids (7a–f), emphasizing their potential as adaptable candidates for drug development.
Fig. 5 illustrates that the HOMO orbitals of compounds (7a–f) are primarily localized on the N-phenylacetamide motif, while the LUMO orbitals are distributed across the π-systems of the s-triazine moiety and isatin scaffold. The spatial distribution highlights key regions for potential biological interactions, as illustrated in Fig. 5, which depicts the distinct electron-dense regions within the hybrids.
 | ||
| Fig. 5 HOMO, LUMO and MESP diagram of s-triazine-isatin hybrids (7a–f). | ||
The DFT results also complement the molecular docking findings, providing a holistic understanding of the electronic and structural features that contribute to the bioactivity of compounds (7a–f). Compounds with enhanced electron transfer capabilities may more readily bind to macromolecules such as DNA or proteins due to their improved compatibility with macromolecular structures.79 The charge transfer interactions revealed by the HOMO–LUMO transitions align with docking predictions of binding affinity, highlighting the potential of synthesized s-triazine-isatin hybrids (7a–f) for stable interactions with biological targets. Moreover, MEP analysis80 (Fig. 5) provided critical insights into the electron distribution, identifying electron-rich (red) and electron-poor (blue) regions that corroborate docking-derived binding sites.81 Notably, the electron-deficient s-triazine ring and nucleophilic oxygen atoms, highlighted in MEP, correspond precisely to the key interaction sites predicted by docking simulations. This convergence between DFT and docking results not only underscores the reactivity profiles of compounds (7a–f) but also strengthens their potential as targeted anticancer agents.
2.5 In silico pharmacokinetic profiling
Pharmacokinetic evaluation is a cornerstone in drug discovery, offering critical insights into the bioavailability, absorption, distribution, and overall drug-like properties of candidate molecules.82 The in silico pharmacokinetic parameters of the synthesized compounds (7a–f) were assessed using SwissADME83 and pkCSM tools,84 with the results summarized in Table 4.| Compounds | LogPa |
LogSb |
TPSAc (Å2) | Caco-2 permd | Int. abse | VDssf |
|---|---|---|---|---|---|---|
| a Log of octanol–water partition coefficient (SwissADME83).b Log of aqueous solubility (SwissADME83).c Topological Polar Surface Area (TPSA) (SwissADME83).d Caco-2 cell permeability as estimation of absorption at human intestinal mucosa85 (pkCSM prediction86).e Proportion (%) of compound absorbed through the human small intestine85 (pkCSM prediction86).f Steady-state volume of distribution (VDss) (pkCSM prediction86). | ||||||
| 7a | 4.85 | −7.90 | 130.93 | 0.616 | 100 | −0.437 |
| 7b | 6.11 | −9.73 | 130.93 | 0.425 | 100 | −0.342 |
| 7c | 6.01 | −9.09 | 130.93 | 0.42 | 100 | −0.367 |
| 7d | 3.44 | −8.05 | 222.57 | −0.36 | 98.11 | −1.103 |
| 7e | 5.40 | −8.51 | 130.93 | 0.441 | 100 | −0.311 |
| 7f | 6.77 | −9.65 | 130.93 | 0.426 | 100 | −0.238 |
| Cabozantinib | 4.40 | −7.22 | 98.78 | 0.166 | 100 | −1.023 |
The compounds (7a–f) exhibited favorable physicochemical and pharmacokinetic properties, aligning with Lipinski's rule of five,87 which indicated their potential for favorable oral bioavailability.88 Parameters such as the log of the octanol–water partition coefficient (logP), log aqueous solubility (logS), and Topological Polar Surface Area (TPSA) fell within acceptable ranges for oral drug candidates.58,89 Particularly, the LogP values, representing lipophilicity, were found within a range (3.44–6.77) consistent with drug-likeness, with most compounds demonstrating higher lipophilicity compared to cabozantinib (4.40), supporting adequate membrane permeability. However, more negative aqueous solubility (LogS) values for compounds 7b, 7c, and 7f (−9.73, −9.09, and −9.65, respectively) than for cabozantinib (−7.22), suggested reduced solubility. Conversely, compounds 7a and 7d showed relatively better solubility profiles, closer to the standard (Table 4).
The topological polar surface area (TPSA), associated with drug absorption and blood–brain barrier penetration, was 130.93 Å2 for most compounds, remained below the threshold of 140 Å2 (Table 4) ensuring efficient transmembrane diffusion. Except compound 7d, which exhibited a higher TPSA of 222.57 Å2 suggesting reduced permeability potential compared to the other derivatives and cabozantinib (98.78 Å2). Likewise, most compounds displayed higher Caco-2 permeability than cabozantinib (0.166), while compound 7d showed a negative value (−0.36), further confirming its limited permeability.
The intestinal absorption percentages, predicted through pkCSM, demonstrated excellent absorption potential for all synthesized compounds (7a–f), indicating effective absorption with values exceeding 98% for human intestinal absorption.90 The steady-state volume of distribution (VDss) values suggested intermediate tissue distribution for most compounds, reflecting a balanced partitioning between plasma and tissues. Compounds (7a–f) had better tissue distribution than cabozantinib (−1.023), with the highest VDss observed for 7f (−0.238), implying better systemic distribution. Exceptions with lower VDss values could be attributed to specific structural features influencing solubility and ionization capacity, such as in compound 7d with its higher TPSA.
Overall, the pharmacokinetic profiles of synthesized compounds (7a–f) suggest that these hybrids are well-suited for further investigations, with promising absorption, distribution, and bioavailability characteristics. These findings highlight their potential as orally active anticancer agents, warranting advanced preclinical evaluations.
3. Conclusions
The synthesis and characterization of novel s-triazine-isatin hybrids (7a–f) demonstrated their structural integrity and potential for biological applications, by revealing their strong potential as DNA-binding agents. Spectroscopic analyses and molecular docking studies revealed strong SS-DNA binding, particularly for the 3-CF3 substituted compound 7f, which exhibited the highest binding constant, favorable thermodynamics and the highest docking score. DFT calculations and in silico pharmacokinetic results further supported their suitability as drug candidates, highlighting optimal electronic properties and polarity for pharmacological activity. Overall, this study underscores the therapeutic potential of s-triazine-isatin hybrids as DNA-binding agents. The integration of spectroscopic analyses and computational results provides a comprehensive understanding of their interaction profiles. These findings establish a robust foundation for future studies, including in vitro and in vivo evaluations, to explore the clinical applicability of these hybrids as anticancer agents. Furthermore, the insights gained on substituent effects can guide the rational design of next-generation DNA-targeted therapeutics.4. Experimental
4.1 Computational
The Gaussian 09 software package was used to optimize the molecular structures of all synthesized compounds.91 To determine the electronic properties of the synthesized compounds, the optimized structures were employed. HOMO, LUMO and other descriptors were computed using GaussView6. AutodockVina 1.5.7 (ref. 71) was used to conduct the molecular docking studies, while for visualization the Discovery Studio,92 PyMOL,93 LigPlot + V1.4.5,94 ChimeraX 1.4,95 and VESTA 3.5.8 (ref. 96) were utilized. The reported grid point sizes (80, 60, 60) and coordinates (16.394, 10.415, 90.220) were employed for docking analyses.104.2 UV-visible spectroscopic analysis of DNA binding interactions
The SS-DNA (Sigma-Aldrich) stock solution was prepared in distilled water and kept on stirring for 24 h. DNA's purity from protein contamination was confirmed by A260/A280 ratio of 1.89. The solution was further diluted 10-fold to obtain maximum absorbance at 260 nm. Using a molar absorptivity coefficient (ε) of 6600 M−1 cm−1 at 260 nm, the concentration of DNA was determined.52 Shimadzu 1700 UV-visible spectrophotometer was utilized to acquire UV-vis absorption spectra. After preparing compound solutions (50 μM) in DMSO, their spectra were recorded without DNA, followed by measurements at varying DNA concentrations (5–35 μM).424.3 Synthetic procedure for the synthesis of s-triazine-isatin hybrids (7a–f)
To a solution of 4-bromophenyl acetamide pendant isatin 6 (0.25 mmol, 1.0 eq.) in ethanol, glacial acetic acid (few drops) was added followed by the addition of phenoxy-linked hydrazinyl s-triazines (3) (0.25 mmol, 1.0 eq.) The reaction progress was monitored at regular intervals using thin-layer chromatography. Hydrazones (7a–f) were precipitated out from the reaction mixture after 3–4 hours of reflux, which were subsequently filtered, dried, and recrystallized from ethanol to yield the pure product.:1); yield: 85%; FT-IR ![[small nu, Greek, macron]](https://www.rsc.org/images/entities/i_char_e0ce.gif) (cm−1): 1209 (C–N stretch; lactam), 1281 (Csp2–O stretch; ether), 1467 (Csp3–H bend; methylene), 1470, 1541 (CC stretch; aromatic), 1619 (CN stretch; imine), 1686, 1737 (CO stretch; amide), 2971, (Csp3–H stretch), 3049, 3129 (Csp2–H stretch), 3225, 3300 (N–H stretch); 1H NMR (300 MHz, DMSO-d6) δ (ppm): 12.65 (s, 1H, –NH), 10.51 (s, 1H, –NH), 7.58–7.16 (m, 18H, Ar–H), 4.66 (s, 2H, –CH2), 4.71 (t, 2H, 3J = 6 Hz, –OCH2), 4.14 (t, 2H, 3J = 6 Hz, –CH2 triazole); 13C NMR (75 MHz, DMSO-d6) δ (ppm): 167.2, 165.3, 161.7, 152.1, 143.4, 138.2, 135.5, 132.1, 131.9, 129.9, 126.3, 123.8, 122.0, 121.7, 119.4, 115.8, 110.8, 43.2; UV-vis (DMSO, nm) 348 (π–π*); LC-MS m/z 636.0 [M − 1]:1); yield: 85%; FT-IR (cm−1): 1210 (C–N stretch; lactam), 1348 (Csp2–O stretch; ether), 1477 (Csp3–H bend; methylene), 1481, 1546 (CC stretch; aromatic), 1619 (CN stretch; imine), 1654, 1738 (CO stretch; amide), 2836, 2935 (Csp3–H stretch), 3064, 3124 (Csp2–H stretch), 3253, 3300 (N–H stretch); 1H NMR (300 MHz, DMSO-d6) δ (ppm): 12.71 (s, 1H, –NH), 10.52 (s, 1H, –NH), 8.01–6.70 (m, 16H, Ar–H), 4.67 (s, 2H, –CH2); 13C NMR (75 MHz, DMSO-d6) δ (ppm): 172.1, 165.8, 163.9, 151.2, 151.1, 144.8, 143.5, 141.3, 140.2, 138.4, 132.7, 132.4, 132.1, 124.4, 121.6, 121.5, 118.7, 118.5, 117.9, 115.6, 115.3, 43.2; UV-vis (DMSO, nm) 340 (π–π*), 422 (n–π*); LC-MS m/z 794.0 [M − 1]:1); yield: 86%; FT-IR (cm−1): 1209 (C–N stretch; lactam), 1378 (Csp2–O stretch; ether), 1484, 1558 (CC stretch; aromatic), 1619 (CN stretch; imine), 1686, 1720 (CO stretch; amide), 2981, (Csp3–H stretch), 3067, 3190 (Csp2–H stretch), 3225, 3300 (N–H stretch); 1H NMR (300 MHz, DMSO-d6) δ (ppm): 12.70 (s, 1H, –NH), 10.51 (s, 1H, –NH), 7.60–7.17 (m, 16H, Ar–H), 4.66 (s, 2H, –CH2); 13C NMR (75 MHz, DMSO-d6) δ (ppm): 167.2, 165.3, 161.7, 150.6, 137.8, 135.8, 132.1, 130.5, 129.8, 129.2, 127.7, 124.0, 121.3, 119.4, 110.8, 43.2; UV-vis (DMSO, nm) 348 (π–π*); LC-MS m/z 704.2 [M − 1]:1); yield: 81%; FT-IR (cm−1): 1209 (C–N stretch; lactam), 1345 (Csp3–O stretch; ether), 1467 (Csp3–H bend; methylene), 1499, 1559 (CC stretch; aromatic), 1619 (CN stretch; imine), 1688 (CO stretch; amide), 2872, (Csp3–H stretch), 3070, 3124 (Csp2–H stretch), 3244, 3300 (N–H stretch); 1H NMR (300 MHz, DMSO-d6) δ (ppm): 12.78 (s, 1H, –NH), 10.51 (s, 1H, –NH), 8.34–7.17 (m, 16H, Ar–H), 4.67 (s, 2H, –CH2); 13C NMR (75 MHz, DMSO-d6) δ (ppm): 167.3, 165.2, 145.5, 143.6, 138.3, 136.3, 132.1, 125.8, 123.4, 121.6, 119.6, 116.2, 43.2; UV-vis (DMSO, nm) 350 (π–π*); LC-MS m/z 726.1 [M − 1]:1); yield: 83%; FT-IR (cm−1): 1202 (C–N stretch; lactam), 1366 (Csp2–O stretch; ether), 1467 (Csp3–H bend; methylene), 1487, 1541 (CC stretch; aromatic), 1619 (CN stretch; imine), 1684 (CO stretch; amide), 2924 (Csp3–H stretch), 3049, 3129 (Csp2–H stretch), 3252, 3300 (N–H stretch); 1H NMR (300 MHz, DMSO-d6) δ (ppm): 12.52 (s, 1H, –NH), 10.52 (s, 1H, –NH), 7.83–6.57 (m, 16H, Ar–H), 4.68 (s, 2H, –CH2); 13C NMR (75 MHz, DMSO-d6) δ (ppm): 166.0, 164.9, 156.7, 153.5, 150.4, 138.4, 132.1, 130.5, 129.8, 129.5, 124.0, 122.7, 121.6, 117.3, 43.2; UV-vis (DMSO, nm) 351 (π–π*); LC-MS m/z 664.2 [M − 1]:1); yield: 84%; FT-IR (cm−1): 1168 (Csp3–O stretch; ether), 1209 (C–N stretch; lactam), 1281 (Csp2–O stretch; ether), 1467 (Csp3–H bend; methylene), 1470, 1541 (CC stretch; aromatic), 1619 (CN stretch; imine), 1686 (CO stretch; amide), 1737 (CO stretch; ketone), 2971, (Csp3–H stretch), 3049, 3129 (Csp2–H stretch), 3225, 3300, (N–H stretch); 1H NMR (300 MHz, DMSO-d6) δ (ppm): 12.68 (s, 1H, –NH), 10.51 (s, 1H, –NH), 7.61–7.17 (m, 16H, Ar–H), 4.67 (s, 2H, –CH2); 13C NMR (75 MHz, DMSO-d6) δ (ppm): 167.2, 165.3, 161.7, 158.4, 148.0, 143.5, 137.8, 135.7, 132.0, 129.2, 127.7, 123.9, 120.8, 119.4, 110.8, 43.2; UV-vis (DMSO, nm) 351 (π–π*); LC-MS m/z 771.4 [M − 1]
(cm−1): 1209 (C–N stretch; lactam), 1281 (Csp2–O stretch; ether), 1467 (Csp3–H bend; methylene), 1470, 1541 (CC stretch; aromatic), 1619 (CN stretch; imine), 1686, 1737 (CO stretch; amide), 2971, (Csp3–H stretch), 3049, 3129 (Csp2–H stretch), 3225, 3300 (N–H stretch); 1H NMR (300 MHz, DMSO-d6) δ (ppm): 12.65 (s, 1H, –NH), 10.51 (s, 1H, –NH), 7.58–7.16 (m, 18H, Ar–H), 4.66 (s, 2H, –CH2), 4.71 (t, 2H, 3J = 6 Hz, –OCH2), 4.14 (t, 2H, 3J = 6 Hz, –CH2 triazole); 13C NMR (75 MHz, DMSO-d6) δ (ppm): 167.2, 165.3, 161.7, 152.1, 143.4, 138.2, 135.5, 132.1, 131.9, 129.9, 126.3, 123.8, 122.0, 121.7, 119.4, 115.8, 110.8, 43.2; UV-vis (DMSO, nm) 348 (π–π*); LC-MS m/z 636.0 [M − 1]:1); yield: 85%; FT-IR (cm−1): 1210 (C–N stretch; lactam), 1348 (Csp2–O stretch; ether), 1477 (Csp3–H bend; methylene), 1481, 1546 (CC stretch; aromatic), 1619 (CN stretch; imine), 1654, 1738 (CO stretch; amide), 2836, 2935 (Csp3–H stretch), 3064, 3124 (Csp2–H stretch), 3253, 3300 (N–H stretch); 1H NMR (300 MHz, DMSO-d6) δ (ppm): 12.71 (s, 1H, –NH), 10.52 (s, 1H, –NH), 8.01–6.70 (m, 16H, Ar–H), 4.67 (s, 2H, –CH2); 13C NMR (75 MHz, DMSO-d6) δ (ppm): 172.1, 165.8, 163.9, 151.2, 151.1, 144.8, 143.5, 141.3, 140.2, 138.4, 132.7, 132.4, 132.1, 124.4, 121.6, 121.5, 118.7, 118.5, 117.9, 115.6, 115.3, 43.2; UV-vis (DMSO, nm) 340 (π–π*), 422 (n–π*); LC-MS m/z 794.0 [M − 1]:1); yield: 86%; FT-IR (cm−1): 1209 (C–N stretch; lactam), 1378 (Csp2–O stretch; ether), 1484, 1558 (CC stretch; aromatic), 1619 (CN stretch; imine), 1686, 1720 (CO stretch; amide), 2981, (Csp3–H stretch), 3067, 3190 (Csp2–H stretch), 3225, 3300 (N–H stretch); 1H NMR (300 MHz, DMSO-d6) δ (ppm): 12.70 (s, 1H, –NH), 10.51 (s, 1H, –NH), 7.60–7.17 (m, 16H, Ar–H), 4.66 (s, 2H, –CH2); 13C NMR (75 MHz, DMSO-d6) δ (ppm): 167.2, 165.3, 161.7, 150.6, 137.8, 135.8, 132.1, 130.5, 129.8, 129.2, 127.7, 124.0, 121.3, 119.4, 110.8, 43.2; UV-vis (DMSO, nm) 348 (π–π*); LC-MS m/z 704.2 [M − 1]:1); yield: 81%; FT-IR (cm−1): 1209 (C–N stretch; lactam), 1345 (Csp3–O stretch; ether), 1467 (Csp3–H bend; methylene), 1499, 1559 (CC stretch; aromatic), 1619 (CN stretch; imine), 1688 (CO stretch; amide), 2872, (Csp3–H stretch), 3070, 3124 (Csp2–H stretch), 3244, 3300 (N–H stretch); 1H NMR (300 MHz, DMSO-d6) δ (ppm): 12.78 (s, 1H, –NH), 10.51 (s, 1H, –NH), 8.34–7.17 (m, 16H, Ar–H), 4.67 (s, 2H, –CH2); 13C NMR (75 MHz, DMSO-d6) δ (ppm): 167.3, 165.2, 145.5, 143.6, 138.3, 136.3, 132.1, 125.8, 123.4, 121.6, 119.6, 116.2, 43.2; UV-vis (DMSO, nm) 350 (π–π*); LC-MS m/z 726.1 [M − 1]:1); yield: 83%; FT-IR (cm−1): 1202 (C–N stretch; lactam), 1366 (Csp2–O stretch; ether), 1467 (Csp3–H bend; methylene), 1487, 1541 (CC stretch; aromatic), 1619 (CN stretch; imine), 1684 (CO stretch; amide), 2924 (Csp3–H stretch), 3049, 3129 (Csp2–H stretch), 3252, 3300 (N–H stretch); 1H NMR (300 MHz, DMSO-d6) δ (ppm): 12.52 (s, 1H, –NH), 10.52 (s, 1H, –NH), 7.83–6.57 (m, 16H, Ar–H), 4.68 (s, 2H, –CH2); 13C NMR (75 MHz, DMSO-d6) δ (ppm): 166.0, 164.9, 156.7, 153.5, 150.4, 138.4, 132.1, 130.5, 129.8, 129.5, 124.0, 122.7, 121.6, 117.3, 43.2; UV-vis (DMSO, nm) 351 (π–π*); LC-MS m/z 664.2 [M − 1]:1); yield: 84%; FT-IR (cm−1): 1168 (Csp3–O stretch; ether), 1209 (C–N stretch; lactam), 1281 (Csp2–O stretch; ether), 1467 (Csp3–H bend; methylene), 1470, 1541 (CC stretch; aromatic), 1619 (CN stretch; imine), 1686 (CO stretch; amide), 1737 (CO stretch; ketone), 2971, (Csp3–H stretch), 3049, 3129 (Csp2–H stretch), 3225, 3300, (N–H stretch); 1H NMR (300 MHz, DMSO-d6) δ (ppm): 12.68 (s, 1H, –NH), 10.51 (s, 1H, –NH), 7.61–7.17 (m, 16H, Ar–H), 4.67 (s, 2H, –CH2); 13C NMR (75 MHz, DMSO-d6) δ (ppm): 167.2, 165.3, 161.7, 158.4, 148.0, 143.5, 137.8, 135.7, 132.0, 129.2, 127.7, 123.9, 120.8, 119.4, 110.8, 43.2; UV-vis (DMSO, nm) 351 (π–π*); LC-MS m/z 771.4 [M − 1]Data availability
The additional data that support this manuscript is provided as part of ESI†Conflicts of interest
The authors declare that there are no conflicts of interestAcknowledgements
We are grateful to the Higher Education Commission (HEC) of Pakistan and The World Academy of Sciences (TWAS) for providing financial support through the projects (9225/Federal/NRPU/R&D/HEC/2017) and (13-419 RG/PHA/AS_CUNESCO FR: 3240279216), respectively.References
- B. Liu, H. Zhou, L. Tan, K. T. H. Siu and X.-Y. Guan, Signal Transduction Targeted Ther., 2024, 9, 175 CrossRef.
- C. Zhao, W. Song, J. Wang, X. Tang and Z. Jiang, Chem. Commun., 2025, 61, 1962–1977 RSC.
- N. K. Sharma, A. Bahot, G. Sekar, M. Bansode, K. Khunteta, P. V. Sonar, A. Hebale, V. Salokhe and B. K. Sinha, Cancers, 2024, 16, 680 CrossRef CAS PubMed.
- S. Zheng, R. Chen, L. Zhang, L. Tan, L. Li, F. Long and T. Wang, Eur. J. Med. Chem., 2024, 116702 CrossRef CAS PubMed.
- A. Mushtaq, P. Wu and M. M. Naseer, Pharmacol. Ther., 2024, 254, 108579 CrossRef CAS PubMed.
- D. Li, X. Peng, Z. Hu, S. Li, J. Chen and W. Pan, Eur. J. Med. Chem., 2024, 264, 115982 CrossRef CAS PubMed.
- A. Rismanbaf, Cancer Rep., 2024, 7, e1945 CrossRef CAS.
- A. M. Abu-Dief, T. El-Dabea, R. M. El-Khatib, M. Feizi-Dehnayebi, F. S. Aljohani, K. Al-Ghamdi, I. O. Barnawi and M. A. E. A. A. Ali, J. Mol. Liq., 2024, 399, 124422 CrossRef CAS.
- I. El-Deen, A. Shoair and M. El-Bindary, J. Mol. Liq., 2018, 249, 533–545 CrossRef CAS.
- G. Magdy, F. Belal, A. F. A. Hakiem and A. M. Abdel-Megied, Int. J. Biol. Macromol., 2021, 182, 1852–1862 CrossRef CAS.
- R. Wing, H. Drew, T. Takano, C. Broka, S. Tanaka, K. Itakura and R. E. Dickerson, Nature, 1980, 287, 755–758 CrossRef CAS.
- L. Strekowski and B. Wilson, Mutat. Res., Fundam. Mol. Mech. Mutagen., 2007, 623, 3–13 CrossRef CAS.
- I. Saha, M. Hossain and G. Suresh Kumar, J. Phys. Chem. B, 2010, 114, 15278–15287 CrossRef CAS.
- M. Sirajuddin, S. Ali and A. Badshah, J. Photochem. Photobiol., B, 2013, 124, 1–19 CrossRef CAS PubMed.
- A. Ganguly, S. Ghosh and N. Guchhait, Phys. Chem. Chem. Phys., 2015, 17, 483–492 RSC.
- J.-H. Shi, T.-T. Liu, M. Jiang, J. Chen and Q. Wang, J. Photochem. Photobiol., B, 2015, 147, 47–55 CrossRef CAS PubMed.
- H. Li, X. Bu, J. Lu, C. Xu, X. Wang and X. Yang, Spectrochim. Acta, Part A, 2013, 107, 227–234 CrossRef CAS PubMed.
- R. Bera, B. K. Sahoo, K. S. Ghosh and S. Dasgupta, Int. J. Biol. Macromol., 2008, 42, 14–21 CrossRef CAS PubMed.
- J.-H. Shi, J. Chen, J. Wang and Y.-Y. Zhu, Spectrochim. Acta, Part A, 2015, 136, 443–450 CrossRef CAS PubMed.
- Y. Guo, Q. Yue and B. Gao, Int. J. Biol. Macromol., 2011, 49, 55–61 CrossRef CAS PubMed.
- N. Shakibapour, F. Dehghani Sani, S. Beigoli, H. Sadeghian and J. Chamani, J. Biomol. Struct. Dyn., 2019, 37, 359–371 CrossRef CAS PubMed.
- A. Mushtaq, U. Azam, S. Mehreen and M. M. Naseer, Eur. J. Med. Chem., 2023, 249, 115119 CrossRef CAS PubMed.
- M. Altamimi, S. A. Syed, B. Tuzun, M. R. Alhazani, O. Alnemer and A. Bari, J. Enzyme Inhib. Med. Chem., 2024, 39, 2288548 CrossRef PubMed.
- N. S. Haiba, H. H. Khalil, M. A. Moniem, M. H. El-Wakil, A. A. Bekhit and S. N. Khattab, Bioorg. Chem., 2019, 89, 103013 CrossRef CAS.
- A. S. Diakité, C. N. t. M. Ambeu-Loko, A. D. Yapi, C. Logé, A. Kacou, S. Kra, B. Baratte, S. Bach, S. Ruchaud and D. Sissouma, Int. J. Pharm. Res. Allied Sci., 2024, 13, 1–11 CrossRef.
- T. Verma, M. Sinha and N. Bansal, Anti-Cancer Agents Med. Chem., 2020, 20, 4–28 CrossRef CAS.
- I. Shawish, A. Barakat, A. Aldalbahi, A. M. Malebari, M. S. Nafie, A. A. Bekhit, A. Albohy, A. Khan, Z. Ul-Haq and M. Haukka, ACS omega, 2022, 7, 24858–24870 CrossRef CAS PubMed.
- A. El-Faham, M. Farooq, Z. Almarhoon, R. Abd Alhameed, M. A. Wadaan, B. G. de la Torre and F. Albericio, Bioorg. Chem., 2020, 94, 103397 CrossRef CAS PubMed.
- Q. Dai, Q. Sun, X. Ouyang, J. Liu, L. Jin, A. Liu, B. He, T. Fan and Y. Jiang, Molecules, 2023, 28, 4278 CrossRef CAS PubMed.
- K. Vine, L. Matesic, J. Locke, M. Ranson and D. Skropeta, Anti-Cancer Agents Med. Chem., 2009, 9, 397–414 CrossRef CAS PubMed.
- W. M. Eldehna, M. A. El Hassab, M. F. Abo-Ashour, T. Al-Warhi, M. M. Elaasser, N. A. Safwat, H. Suliman, M. F. Ahmed, S. T. Al-Rashood and H. A. Abdel-Aziz, Bioorg. Chem., 2021, 110, 104748 CrossRef CAS.
- D. A. Gideon, P. Annadurai, V. Nirusimhan, A. Parashar, J. James and V. V. Dhayabaran, in Handbook of Oxidative Stress in Cancer: Therapeutic Aspects, Springer, 2021, pp. 1–25 Search PubMed.
- K. Dhahagani, M. P. Kesavan, K. G. G. Vinoth, L. Ravi, G. Rajagopal and J. Rajesh, Mater. Sci. Eng., C, 2018, 90, 119–130 CrossRef CAS PubMed.
- Y.-O. Teng, H.-Y. Zhao, J. Wang, H. Liu, M.-L. Gao, Y. Zhou, K.-L. Han, Z.-C. Fan, Y.-M. Zhang and H. Sun, Eur. J. Med. Chem., 2016, 112, 145–156 CrossRef CAS PubMed.
- V. R. Solomon, C. Hu and H. Lee, Bioorg. Med. Chem., 2009, 17, 7585–7592 CrossRef CAS.
- E. P. Başaran, S. Köprü, S. Akkoç and B. i. Türkmenoğlu, ACS Omega, 2024, 9, 17551–17562 CrossRef PubMed.
- R. Raju, K. Chidambaram, B. Chandrasekaran, M. F. Bayan, T. K. Maity, A. M. Alkahtani and H. C. Chandramoorthy, J. Saudi Chem. Soc., 2023, 27, 101598 CrossRef CAS.
- W. M. Eldehna, A. Altoukhy, H. Mahrous and H. A. Abdel-Aziz, Eur. J. Med. Chem., 2015, 90, 684–694 CrossRef CAS PubMed.
- M. M. El-Naggar, D. S. A. Haneen, A. B. M. Mehany and M. T. Khalil, Int. J. Biol. Macromol., 2020, 150, 1323–1330 CrossRef CAS PubMed.
- Y. Tamaddon-Abibigloo, S. Dastmalchi, N. Razzaghi-Asl and J. S. Mojarrad, Bioorg. Chem., 2024, 147, 107355 CrossRef CAS PubMed.
- H. H. Al-Rasheed, S. A. Al-Khamis, A. Barakat, A. A. Masoud, A. A. Sobhy, D. A. Ghareeb, B. G. de la Torre, F. Albericio and A. El-Faham, Tetrahedron, 2024, 134424 Search PubMed.
- A. Mushtaq and M. M. Naseer, J. Mol. Struct., 2025, 1322, 140558 CrossRef CAS.
- A. Mushtaq, R. Asif, W. A. Humayun and M. M. Naseer, RSC Adv., 2024, 14, 14051–14067 RSC.
- T. Linder, M. Schnürch and M. D. Mihovilovic, Monatsh. Chem., 2018, 149, 1257–1284 CrossRef CAS.
- S. Federico, A. Ciancetta, N. Porta, S. Redenti, G. Pastorin, B. Cacciari, K. N. Klotz, S. Moro and G. Spalluto, Eur. J. Med. Chem., 2016, 108, 529–541 CrossRef CAS.
- Ö. Akgül, A. H. Tarikoğullari, F. A. Köse, P. B. Kirmizibayrak and M. V. Pabuççuoğlu, Turk. J. Chem., 2013, 37, 204–212 Search PubMed.
- L. Firoozpour, L. Gao, S. Moghimi, P. Pasalar, J. Davoodi, M.-W. Wang, Z. Rezaei, A. Dadgar, H. Yahyavi, M. Amanlou and A. Foroumadi, J. Enzyme Inhib. Med. Chem., 2020, 35, 1674–1684 CrossRef CAS PubMed.
- M. Mohanraj, G. Ayyannan, G. Raja and C. Jayabalakrishnan, Mater. Sci. Eng., C, 2016, 69, 1297–1306 CrossRef CAS PubMed.
- J. Bai, Y. Li and G. Zhang, Cancer Biol. Med., 2017, 14, 348 CrossRef CAS PubMed.
- T. A. Farghaly, A. M. A. Alnaja, H. A. El-Ghamry and M. R. Shaaban, Bioorg. Chem., 2020, 102, 104103 CrossRef CAS.
- T.-R. Li, Z.-Y. Yang, B.-D. Wang and D.-D. Qin, Eur. J. Med. Chem., 2008, 43, 1688–1695 CrossRef CAS.
- H. Ullah, V. Previtali, H. B. Mihigo, B. Twamley, M. K. Rauf, F. Javed, A. Waseem, R. J. Baker and I. Rozas, Eur. J. Med. Chem., 2019, 181, 111544 CrossRef CAS PubMed.
- A. K. Das, S. I. Druzhinin, H. Ihmels, M. Müller and H. Schönherr, Chem.–Eur. J.l, 2019, 25, 12703–12707 CrossRef CAS PubMed.
- H. Shinziya, R. S. Menon and A. K. Das, RSC Adv., 2024, 14, 30631–30646 RSC.
- F. Arjmand and A. Jamsheera, Spectrochim. Acta, Part A, 2011, 78, 45–51 CrossRef.
- H. Ünver, B. Boyacıoğlu, C. T. Zeyrek, M. Yıldız, N. Demir, N. Yıldırım, O. Karaosmanoğlu, H. Sivas and A. Elmalı, J. Mol. Struct., 2016, 1125, 162–176 CrossRef.
- S. Naz, S. Ullah, U. Iqbal, S. Yousuf, S. Rahim, N. Muhammad, R. Fatima, I. U. Haq, A. Haider and S. Ali, J. Mol. Liq., 2022, 368, 120792 CrossRef CAS.
- A. G. Ribeiro, S. M. V. de Almeida, J. F. de Oliveira, T. R. C. de Lima Souza, K. L. Dos Santos, A. P. de Barros Albuquerque, M. C. D. B. L. Nogueira, L. B. de Carvalho Junior, R. O. de Moura and A. C. da Silva, Eur. J. Med. Chem., 2019, 182, 111592 CrossRef CAS PubMed.
- A. K. Das, H. Ihmels and S. Kölsch, Photochem. Photobiol. Sci., 2019, 18, 1373–1381 CrossRef CAS.
- K. Jeyalakshmi, N. Selvakumaran, N. S. Bhuvanesh, A. Sreekanth and R. Karvembu, RSC Adv., 2014, 4, 17179–17195 RSC.
- L. H. Abdel-Rahman, B. S. Al-Farhan, N. O. Al Zamil, M. A. Noamaan, H. E.-S. Ahmed and M. S. S. Adam, Bioorg. Chem., 2021, 114, 105106 CrossRef CAS PubMed.
- N. Yıldırım and N. Demir, Sakarya Univ. J. Sci., 2021, 25, 339–348 Search PubMed.
- T. Kondori, N. Akbarzadeh-T, H. Ghaznavi, Z. Karimi, R. Sheervalilou, M. Dušek, V. Eigner and O. Shahraki, J. Mol. Struct., 2021, 1231, 129989 CrossRef CAS.
- J.-H. Shi, D.-Q. Pan, K.-L. Zhou and Y.-Y. Lou, J. Biomol. Struct. Dyn., 2019, 37, 837–845 CrossRef CAS PubMed.
- L. Strekowski and B. Wilson, Mutat. Res., Fundam. Mol. Mech. Mutagen., 2007, 623, 3–13 CrossRef CAS PubMed.
- A. Granzhan, H. Ihmels and G. Viola, J. Am. Chem. Soc., 2007, 129, 1254–1267 CrossRef CAS PubMed.
- L. Subha, C. Balakrishnan, S. Thalamuthu and M. Neelakantan, J. Coord. Chem., 2015, 68, 1021–1039 CrossRef CAS.
- P. N. Craig, J. Med. Chem., 1971, 14, 680–684 CrossRef CAS PubMed.
- S. Vishnu, A. Nag and A. K. Das, Anal. Methods, 2024, 16, 5263–5271 RSC.
- K. Mahmood, Z. Akhter, F. Perveen, M. Bibi, H. Ismail, N. Tabassum, S. Yousuf, A. R. Ashraf and M. A. Qayyum, RSC Adv., 2023, 13, 11982–11999 RSC.
- O. Trott and A. J. Olson, J. Comput. Chem., 2010, 31, 455–461 CrossRef CAS PubMed.
- S. K. Ramadan, H. S. Abd-Rabboh, A. A. A. Hafez and W. S. Abou-Elmagd, RSC Adv., 2024, 14, 16584–16599 RSC.
- M. Miar, A. Shiroudi, K. Pourshamsian, A. R. Oliaey and F. Hatamjafari, J. Chem. Res., 2021, 45, 147–158 CrossRef CAS.
- K. K. Saini, R. K. Upadhyay, R. Kant, A. Vajpayee, K. Jain, A. Kumar, L. S. Kumar and R. Kumar, RSC Adv., 2023, 13, 27525–27534 RSC.
- M. Raghu, C. P. Kumar, M. Prashanth, K. Y. Kumar, B. Prathibha, G. Kanthimathi, S. A. Alissa, H. A. Alghulikah and S. M. Osman, New J. Chem., 2021, 45, 13909–13924 RSC.
- E. J. Lien, Z.-R. Guo, R.-L. Li and C.-T. Su, J. Pharm. Sci., 1982, 71, 641–655 CrossRef CAS PubMed.
- S. Jiang, Y. Jin, R. Yan and Z. Wang, J. Mol. Struct., 2021, 1225, 129295 CrossRef CAS.
- Z. Akbari, C. Stagno, N. Iraci, T. Efferth, E. A. Omer, A. Piperno, M. Montazerozohori, M. Feizi-Dehnayebi and N. Micale, J. Mol. Struct., 2024, 1301, 137400 CrossRef CAS.
- I. Ahmad, R. H. Pawara, R. T. Girase, A. Y. Pathan, V. R. Jagatap, N. Desai, Y. O. Ayipo, S. J. Surana and H. Patel, ACS omega, 2022, 7, 21820–21844 CrossRef CAS PubMed.
- M. A. Mumit, T. K. Pal, M. A. Alam, M. A. Islam, S. Paul and M. C. Sheikh, J. Mol. Struct., 2020, 1220, 128715 CrossRef CAS PubMed.
- Y. A. Alghuwainem, H. M. Abd El-Lateef, M. M. Khalaf, A. A. Abdelhamid, A. Alfarsi, M. Gouda, M. Abdelbaset and A. Abdou, J. Mol. Liq., 2023, 369, 120936 CrossRef CAS.
- G. Bocci, E. Carosati, P. Vayer, A. Arrault, S. Lozano and G. Cruciani, Sci. Rep., 2017, 7, 6359 CrossRef PubMed.
- A. Daina, O. Michielin and V. Zoete, Sci. Rep., 2017, 7, 42717 CrossRef PubMed.
- D. E. Pires, T. L. Blundell and D. B. Ascher, J. Med. Chem., 2015, 58, 4066–4072 CrossRef CAS PubMed.
- V. P. DE, T. Blundell and D. Ascher, PKCSM, 2015, 5 Search PubMed.
- D. E. V. Pires, T. L. Blundell and D. B. Ascher, J. Med. Chem., 2015, 58, 4066–4072 CrossRef CAS PubMed.
- C. A. Lipinski, F. Lombardo, B. W. Dominy and P. J. Feeney, Adv. Drug Delivery Rev., 1997, 23, 3–25 CrossRef CAS.
- D. F. Veber, S. R. Johnson, H.-Y. Cheng, B. R. Smith, K. W. Ward and K. D. Kopple, J. Med. Chem., 2002, 45, 2615–2623 CrossRef CAS PubMed.
- M. S. Kumar, S. Pakrashy, S. Manna, S. M. Choudhury, B. Das, A. Ghosh, A. H. Seikh, M. Dolai and A. K. Das, Anal. Methods, 2025, 17, 2125–2133 RSC.
- C. Lambertucci, G. Marucci, D. Dal Ben, M. Buccioni, A. Spinaci, S. Kachler, K.-N. Klotz and R. Volpini, Eur. J. Med. Chem., 2018, 151, 199–213 CrossRef CAS PubMed.
- M. Caricato, M. J. Frisch, J. Hiscocks and M. J. Frisch, Gaussian 09: IOps Reference, Gaussian Wallingford, CT, USA, 2009 Search PubMed.
- BIOVIA Discovery Studio Visualizer, Dassault Systèmes Biovia, San Diego, CA, USA, 2016 Search PubMed.
- W. L. DeLano, CCP4 Newsl. Protein Crystallogr, 2002, 40, 82–92 Search PubMed.
- R. A. Laskowski and M. B. Swindells, J. Chem. Inf. Model., 2011, 51, 2778–2786 CrossRef CAS PubMed.
- E. F. Pettersen, T. D. Goddard, C. C. Huang, G. S. Couch, D. M. Greenblatt, E. C. Meng and T. E. Ferrin, J. Comput. Chem., 2004, 25, 1605–1612 CrossRef CAS PubMed.
- K. Momma and F. Izumi, J. Appl. Crystallogr., 2011, 44, 1272–1276 CrossRef CAS.
Footnote |
| † Electronic supplementary information (ESI) available. See DOI: https://doi.org/10.1039/d5ra00899a |
| This journal is © The Royal Society of Chemistry 2025 |