DOI:
10.1039/D5RA00877H
(Paper)
RSC Adv., 2025,
15, 22138-22153
Integration of magnetic graphene oxide and office waste paper-derived fibrillated cellulose into a composite adsorbent for effective tetracycline elimination
Received
6th February 2025
, Accepted 23rd June 2025
First published on 30th June 2025
Abstract
Utilizing office waste paper for environmental treatments has garnered significant interest from the research community, as it addresses both waste management and the development of low-cost sustainable adsorbents. In this study, a novel approach was developed by integrating office waste paper-derived fibrillated cellulose (PFC) with magnetic graphene oxide (M-GO) to develop a composite adsorbent for the removal of tetracycline (TC) from aqueous solutions. PFC was isolated via an alkali-acid treatment process; graphene oxide (GO) was synthesized using a modified Hummers' method and subsequently functionalized with magnetite nanoparticles to produce M-GO. The M-GO/PFC composite was then prepared using an ultrasound-assisted mixing technique, followed by lyophilization. Materials were characterized using Fourier-transform infrared (FTIR) spectroscopy, X-ray powder diffraction (XRD), Raman spectroscopy, X-ray photoelectron spectroscopy (XPS), field-emission scanning electron microscopy (FE-SEM), energy-dispersive X-ray (EDX) spectroscopy, N2 adsorption–desorption isotherms, and vibrating sample magnetometry (VSM). The effects of solution pH, adsorbent dose, and ionic strength on TC removal by the composite adsorbent were systematically investigated. Adsorption kinetics was analyzed using the pseudo-first-order, pseudo-second-order, and Elovich models, suggested to fit well with the pseudo-second-order kinetic model with an initial rate of 18.09 mg g−1 min−1. Adsorption isotherms were evaluated using the Langmuir, Freundlich, Sips, and Temkin models, of which the Sips model best described the experimental data, yielding a maximum adsorption capacity of 130.11 mg g−1. Recyclability testing was carried out through five successive adsorption–desorption cycles, indicating a stable adsorption performance of the composite adsorbent with 12.9% decrease between the first and the fifth cycle. These findings suggest that the M-GO/PFC composite is a promising and effective adsorbent for the removal of TC and potentially other water-soluble antibiotics from aqueous environments.
1. Introduction
Antibiotics have been drastically overused in medical treatments and aquaculture since penicillin was first discovered in 1928.1,2 The tremendous remains of antibiotics are annually released into water bodies, causing serious threats to aquatic ecosystems and human health, including the spread of waterborne diseases.1,3 Among commonly used antibiotics, tetracycline (TC) is widely consumed due to its strong antimicrobial effects.4–6 However, a significant portion of TC is not absorbed by humans and animals, resulting in its excretion into the environment through urine and feces.7–9 Due to its poor biodegradation and eco-toxicity, this residue can accumulate and pollute soil, surface water, and groundwater, in turn escalating the growth of antibiotic-resistant pathogens.5,10 According to the literature, TC concentrations have been reported to reach approximately 15 μg L−1 in water bodies and 3 μg L−1 in wetlands.11 Therefore, it is essential to treat and eliminate TC from agro-medical effluents to protect both ecosystem integrity and public health.3,12 Various methods such as photocatalytic degradation,9 membrane filtration,13 adsorption,4,14 electrochemical degradation,15 and advanced oxidation techniques,16 have been employed to deal with the presence of TC contamination. Among these techniques, adsorption with the features of simplicity, cost-effectiveness, and easy control, is favorably used for removing TC.3,17 Besides, the variety and flexibility of adsorbents such as carbon-based materials,18–22 zeolites,23,24 clay minerals,25–27 and synthetic resins,28,29 highlight the strength of the adsorption method in antibiotic removal studies, fostering the incorporation of existing adsorbents and the development of novel materials to date.
Apart from popular adsorbents as aforementioned, repurposing ubiquitous waste paper into value-added products can do wonders for environmental and economic benefits, reflecting the inclinations of green chemistry and sustainability in wastewater treatment.30–32 Globally, tons of paper are produced and used, leading to massive waste paper thrown away on a daily life basis, especially office waste paper from workplaces, institutions, and industries.33 Although paper consumption varies by country, global consumption of paper and cardboard is estimated at approximately 55 kg per capita annually, with North American, Northern European, and East Asian countries leading the way.34 According to findings by Anelia Milbrandt et al.,35 an estimated 110 million tons of paper and cardboard waste were generated in the United States in 2019. Of this total, approximately 56% was landfilled, 6% was combusted, and 38% was recycled. Despite ongoing recycling efforts, waste paper continues to contribute significantly to both municipal and industrial waste streams.36 Moreover, the recycling process of waste paper often results in low-quality paper due to fiber shortening and residual ink contamination.37 It is vital to find alternative methods for recycling waste paper. One of prospective alternatives is to convert waste paper into fibrillated cellulose based on its high cellulosic content.38 The converted cellulose from waste paper is highly crystalline, which is a plausible and inexpensive source for obtaining bio-based cellulose to supplement conventional cellulose sources.39 The converted fibrillated cellulose not only upgrades the value of waste paper but also enhances the adsorption capacity with its oxygen-rich functional groups.40–42 In addition, it features the exceptional properties of large specific surface area, high porosity, low toxicity, good stability, biodegradability, and flexible incorporation with other materials such as graphene-based materials43–45 or metal oxides,46,47 making it one of the most promising adsorbents.38,48
In recent years, graphene and its derivatives have gained prominence as high-performance adsorbents for a wide range of contaminants.49–52 Graphene consists of a monolayer of carbon atoms arranged in a two-dimensional (2D) honeycomb lattice.53 Graphene features the unique physicochemical characteristics of mechanical robustness, chemical stability, outstanding thermal and electrical conductivity, extensive specific surface area, remarkable light transmittance, and versatility for integration with diverse materials.10,51 Graphene oxide (GO) is a frequently utilized derivative of graphene, retaining many of its desirable properties while offering the benefit of cost-effective synthesis compared to pristine graphene.49 Moreover, GO contains oxygenated functional groups, such as hydroxyl (O–H), carbonyl (C![[double bond, length as m-dash]](https://www.rsc.org/images/entities/char_e001.gif) O), carboxyl (COOH), and epoxy (–O–), which enhance its adsorption capacity and hydrophilicity.54,55 The features of GO facilitate its dispersion and combination with other hydrophilic agents in aqueous media, making it a highly favorable adsorbent.49–51 Notwithstanding, the excellent dispersion of GO in water can limit its reusability, as it tends to form stable colloidal suspensions.1,56,57 To address this limitation, incorporating GO and fibrillated cellulose derived from office waste paper is expected to enhance the adsorption capacity of the composite adsorbent while minimizing the risk of secondary environmental pollution. Furthermore, the supplementation of magnetite nanoparticles to the GO-based composite enables the material to be easily magnetically separated for recyclability.58,59 A desirable integration of each purpose-driven component into a ternary composite adsorbent would bring a huge significance for eliminating antibiotics in aqueous solutions.
O), carboxyl (COOH), and epoxy (–O–), which enhance its adsorption capacity and hydrophilicity.54,55 The features of GO facilitate its dispersion and combination with other hydrophilic agents in aqueous media, making it a highly favorable adsorbent.49–51 Notwithstanding, the excellent dispersion of GO in water can limit its reusability, as it tends to form stable colloidal suspensions.1,56,57 To address this limitation, incorporating GO and fibrillated cellulose derived from office waste paper is expected to enhance the adsorption capacity of the composite adsorbent while minimizing the risk of secondary environmental pollution. Furthermore, the supplementation of magnetite nanoparticles to the GO-based composite enables the material to be easily magnetically separated for recyclability.58,59 A desirable integration of each purpose-driven component into a ternary composite adsorbent would bring a huge significance for eliminating antibiotics in aqueous solutions.
In an effort to advance the development of innovative and eco-friendly adsorbents from abundant waste sources, this study demonstrates the incorporation of PFC with M-GO, targeting its use in the TC elimination. This aims to harness the unique potentials of each component for the desirable adsorption capacity and the convenient recovery of the composite. The characterization was analyzed to assess the formation of the materials. The effects of solution pH, adsorbent dose, and ionic strength on the adsorption capacity were investigated. The adsorption isotherm, adsorption kinetic, and adsorption mechanism were also studied and proposed to gain a comprehensive understanding of the adsorption process. The recyclability study was conducted to assess the reusability of the composite adsorbent.
2. Experimental
2.1. Chemicals and materials
Potassium permanganate (KMnO4, 99%), potassium nitrate (KNO3, 99%), sodium hydroxide (NaOH, 97%), hydrochloric acid (HCl, 36%), sulfuric acid (H2SO4, 98%), phosphoric acid (H3PO4, 85%), iron(II) sulfate heptahydrate (FeSO4·7H2O, 99%), iron(III) chloride hexahydrate (FeCl3·6H2O, 99%), sodium hypochlorite (NaOCl, 30%), ammonia solution (NH4OH, 30%), hydrogen peroxide (H2O2, 30%), and ethanol (C2H5OH, 99%) were originated from Xilong Scientific Co. Ltd and used without further purification. Graphite powder (particle size < 20 μm) was sourced from Sigma-Aldrich Chemie GmbH. Office waste paper was collected from a local company in Vietnam. Distilled water was used throughout all experimental procedures.
2.2. Synthesis of GO suspension
GO was obtained by the modified Hummers' method.60 Briefly, 3 g graphite powder (Gi) was gradually added to an acid mixture of 360 mL of 98% H2SO4 and 40 mL of 85% H3PO4 under the conditions of constant magnetic stirring and low temperature (<20 °C). Then, 18.0 g of KMnO4 was slowly added to the mixture, which was then maintained at 50 °C under constant stirring for 12 h. Afterward, 500 mL of distilled water was carefully added, followed by the dropwise addition of 15 mL of H2O2 to terminate the oxidation process. The solution was alternately centrifuged and washed until the decanted water obtained a neutral pH. The resulting paste was dried at 60 °C for 24 h to produce solid graphite oxide. This solid was then dissolved in distilled water at a concentration of 2 mg mL−1 and sonicated at 360 W to yield a GO colloidal suspension.
2.3. Synthesis of M-GO
The synthesis of Fe3O4 particles was carried out following the method described by Hoang et al.61 In brief, the solution of Fe2+![[thin space (1/6-em)]](https://www.rsc.org/images/entities/char_2009.gif) :Fe3+ with the molar ratio of 1:2 was obtained when mixing the same volume of 1.38 M Fe2+ and 2.76 M Fe3+ solutions. Next, 30% NH4OH solution was supplemented to the mixed solution until reaching pH 10.0 and constantly stirring for 1 h. Subsequently, a magnet was used to separate the resulting precipitates, followed by centrifuging and washing until the decanted water reached a neutral pH. The obtained Fe3O4 was then dried at 60 °C under vacuum for 12 h. Thereafter, the magnetic Fe3O4 and the GO colloidal suspension (2 mg mL−1) with the same mass were mixed under the ultrasonic power of 360 W for 30 min to produce M-GO.
:Fe3+ with the molar ratio of 1:2 was obtained when mixing the same volume of 1.38 M Fe2+ and 2.76 M Fe3+ solutions. Next, 30% NH4OH solution was supplemented to the mixed solution until reaching pH 10.0 and constantly stirring for 1 h. Subsequently, a magnet was used to separate the resulting precipitates, followed by centrifuging and washing until the decanted water reached a neutral pH. The obtained Fe3O4 was then dried at 60 °C under vacuum for 12 h. Thereafter, the magnetic Fe3O4 and the GO colloidal suspension (2 mg mL−1) with the same mass were mixed under the ultrasonic power of 360 W for 30 min to produce M-GO.
2.4. Isolation of PFC
PFC was isolated from office waste paper through alkali treatment followed by acid hydrolysis.37,38,62,63 Office waste paper was cut into small pieces and boiled with distilled water for 2 h. The paper pulp was then soaked in a 5% NaOH solution and maintained at 70 °C for 4 h to remove ink and other impurities. The mixture was subsequently filtered and rinsed repetitively with distilled water until a neutral pH was achieved. The filter cake was bleached with a 2% NaClO solution at 60 °C for 1 h, then filtered and washed three times with distilled water. The bleached product was hydrolyzed with 40% H2SO4 at 80 °C for 1.5 h, followed by filtration and rinsing with distilled water until the supernatant reached a neutral pH. The resulting PFC was separated by centrifugation at 4000 rpm and stored in a refrigerator for later use.
2.5. Preparation of M-GO/PFC composite adsorbent
The M-GO/PFC composite adsorbent was prepared using an ultrasound-assisted mixing method followed by lyophilization. Specifically, the as-prepared M-GO was dispersed into the PFC suspension at a 1:1 mass ratio (M-GO:PFC) and sonicated at 360 W for 30 min to obtain a homogeneous suspension with a final concentration of 4 mg mL−1. The resulting suspension was then freeze-dried at −40 °C for 48 h to yield the M-GO/PFC composite adsorbent.
2.6. Characterization
FTIR spectroscopy was conducted using a spectrum 100 FT-IR spectrometer (PerkinElmer) to identify the functional groups present in the materials, covering a wavenumber range of 400–4000 cm−1. XRD analysis was performed to assess the crystallinity of the materials using an Aeris X-ray diffractometer (Malvern Panalytical) with CuKα radiation (λ = 0.154 nm), scanned over a 2θ range of 5–80° at a rate of 0.02° per second. Raman spectroscopy was employed to investigate defects and structural disorders in the carbonaceous and cellulosic materials, using an Express-Raman spectrometer (Bruker Senterra) with a 532 nm excitation wavelength. The morphology and elemental mapping of the materials were visualized using FE-SEM images on TESCAN MIRA3 (Czech Republic) and EDX spectroscopy on AMETEK EDAX, respectively, with an electron voltage accelerating from 15.0 to 20.0 kV. N2 adsorption–desorption isotherm with Barrett–Joyner–Halenda (BJH) method was employed to determine the pore size distribution of the materials, conducted on a TOP-200 extensible multi-stations gas adsorption analyzer (Altamira Instruments). Magnetic hysteresis curves were outlined using a custom-built VSM system under ambient conditions. XPS measurements were used to determine the chemical composition of the materials, utilizing an Axis Ultra X-ray photoelectron spectrometer (Kratos Analytical).
2.7. Point of zero charge (pHpzc) identification
The pHpzc of the M-GO/PFC composite adsorbent was obtained using the solid addition method.64,65 A series of Erlenmeyer flasks was prepared with initial pH values (pHi) ranging from 3.0–9.0, each containing 30 mL of 0.1 M KNO3 solution. The pHi of each solution was calibrated using 0.1 M HCl and 0.1 M NaOH solutions. Next, each flask was added 50 mg of the composite adsorbent and shaken at 160 rpm for 24 h to reach equilibrium. The equilibrium pH (pHe) was collected to calculate ΔpH = pHi − pHe. Accordingly, a graph of ΔpH as a function of pHi was generated, and the pHpzc was determined at the point where the graph intersected the axis of ΔpH = 0.
2.8. Batch adsorption study
Batch adsorption was investigated to evaluate the adsorption performance of the as-prepared M-GO/PFC composite adsorbent in eliminating TC from water. Experiments were carried out to evaluate the effect of each factor at different levels while all other factors were kept constant, as described in our previous studies.61,64,66,67 Specifically, 15 mg of each composite adsorbent was immersed in 30 mL TC solution in each Erlenmeyer flask, maintaining the solid-to-liquid rate of 1/2 mg mL−1. The flasks were continuously shaken at 160 rpm for a predetermined adsorption time. The composite adsorbents were separated using a magnet. The equilibrium TC concentration was measured using UV-Vis spectrometry at 357 nm. Each experiment consisted of a blank sample and three replicates. There were five investigated factors, including solution pH, adsorbent dose, ionic strength, contact time (adsorption kinetic), and initial TC concentration (adsorption isotherm). The effects of solution pH, adsorbent dose, and ionic strength were investigated with the pHi ranging from 3.0 to 8.0, the adsorbent doses of 0.50, 0.67, 0.83, 1.00, 1.17 g L−1, and the NaCl molarities of 0, 0.001, 0.01, 0.05, 0.1 mol L−1, respectively, while the contact time (960 min) and the initial TC concentration (70 mg L−1) were kept constant. After selecting the appropriate pHi value, adsorbent dose, and NaCl molarity, the adsorption kinetic was experimented at 10, 20, 60, 120, 240, and 360 min to choose an appropriate contact time, whereas the adsorption isotherm investigation was carried out at the initial TC concentrations of 30, 50, 70, 110, 150, 200, 300, 400 mg L−1. The adsorption capacity (qe, mg g−1) and adsorption efficiency (H, %) of the composite adsorbent were determined according to eqn (1) and (2),68 respectively:| |
 | (1) |
| |
 | (2) |
where C0 and Ce (mg L−1) are the initial and equilibrium concentrations of TC, respectively; M (g) is the composite adsorbent mass; V (L) is the volume of TC solution.
2.9. Recyclability study
To evaluate the capability of the M-GO/PFC composite adsorbent to reuse, the recyclability test was carried out to calculate the TC adsorption efficiency according to the eqn (2) for five consecutive cycles. After each adsorption run, the composite adsorbent was magnetically collected and dried at 70 °C for 3 h. For TC desorption, the adsorbent was immersed in 0.1 M NaOH and shaken for 18 h, followed by washing with distilled water and drying at 70 °C for 3 h. Subsequently, the regenerated adsorbent was employed for the next adsorption–desorption cycle.
3. Results and discussion
3.1. Characterization
To study the presence of functional groups in Gi, GO, Fe3O4, PFC, and M-GO/PFC composite, the FTIR spectroscopy of each material was analyzed and shown in Fig. 1. The abundance of characteristic vibrations of GO in comparison to Gi indicates that GO was formed by the oxidation of Gi, namely featuring around 3450 cm−1 (O–H stretching), 1730 cm−1 (CO stretching), 1630 cm−1 (CC stretching), 1430 cm−1 (C–O–H bending), 1160 cm−1 (C–O–C stretching), and 1060 cm−1 (C–O stretching).69–71 These functional groups were greatly beneficial to the compatibility of GO into hydrophilic matrices.72 In the FTIR spectrum of Fe3O4, a distinct and intense absorption peak at 580 cm−1 was attributed to the stretching vibration of Fe–O in Fe3O4 molecules.73,74 This peak was also observed in that of the M-GO/PFC composite, albeit with reduced intensity, indicating the synthesis of Fe3O4 and its presence in the M-GO/PFC composite were acquired. The FTIR spectrum of PFC displayed a wide absorption band in the region of 3420 cm−1 (O–H stretching) and characteristic multi-peaks at 1160, 1110, and 1060 cm−1 ascribed to the C–O–C and C–O stretching vibrations of the cellulose backbones.30,75 In addition, the absorption peak around 2900 cm−1 corresponded to the C–H stretching vibration in the –CH2 group of cellulose,76–78 while a strong vibrational peak at 1630 cm−1 represented the aromatic CC stretching vibration.40,79 These observations confirmed the successful isolation of cellulose from office waste paper.38 Notably, the FTIR spectrum of the M-GO/PFC composite in Fig. 1e possibly involved the vibrational modes of the PFC, GO and Fe3O4, indicating the ample presence of the components in the composite. This would play a significant role in the TC adsorption process.
 |
| | Fig. 1 FTIR spectra of (a) Gi, (b) GO, (c) Fe3O4, (d) PFC, (e) M-GO/PFC composite, and (f) M-GO/PFC composite after the TC adsorption. | |
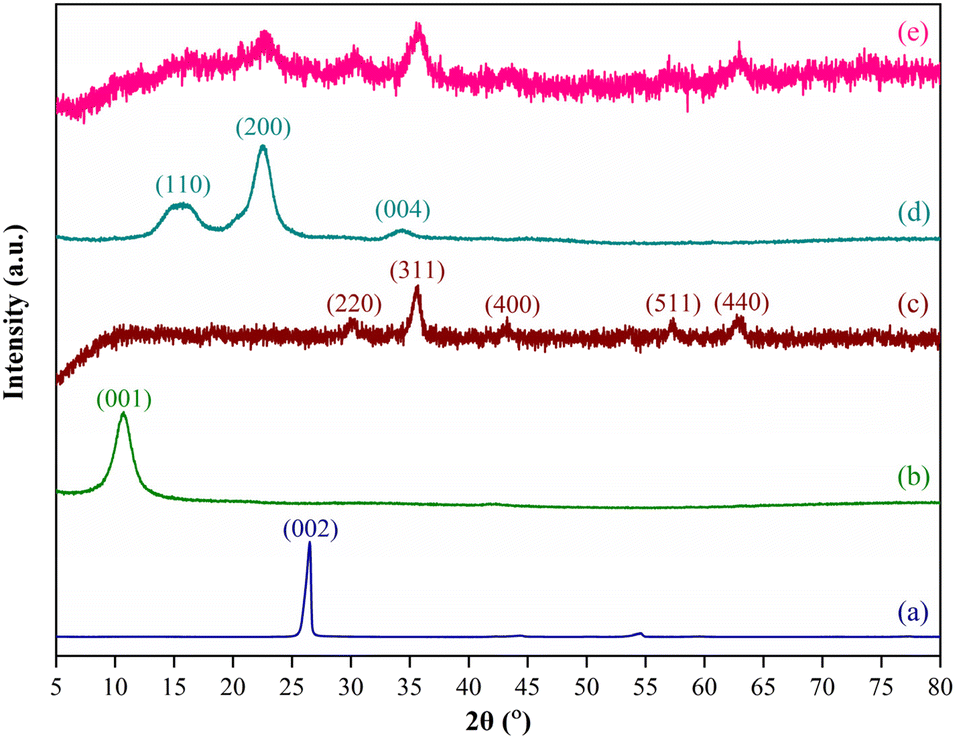
Fig. 2 reveals the XRD patterns of Gi, GO, Fe3O4, PFC, and M-GO/PFC composite in the diffraction angle (2θ) of 5–80°. The characteristic peak of Gi at (002) crystal plane (2θ = 26.50°) was translated to that of GO at (001) crystal plane (2θ = 10.73°), corresponding to the enlarged interplanar spacing from 0.34 to 0.82 nm due to the oxidation of Gi to form GO.80,81 As can be seen in the XRD patterns of Fe3O4 and M-GO/PFC composite, the diffraction peaks at 2θ values of 30.22°, 35.61°, 43.22°, 57.39°, and 62.91° were assigned to the (220), (311), (400), (511), and (440) crystal planes of Fe3O4 particles, aligning with the standard XRD pattern of Fe3O4 as documented in the literature of JCPDS No. 19-0629.82 Moreover, the existence of these signals in the XRD pattern of the M-GO/PFC composite signified the embedment of Fe3O4 in the composite.73 The XRD pattern of PFC witnessed the diffraction peaks at (110) crystal plane (2θ = 15.55°), (200) crystal plane (2θ = 22.53°), and (004) crystal plane (2θ = 34.39°), characterizing the crystallinity of cellulose as noted in the literature of JCPDS No. 50-2241.83–85 The degree of crystallinity of PFC could be assessed by crystallinity index (CrI) using Segal method as the following equation:86
| |
 | (3) |
where
I200 and
Iam are the heights of the peak at 2
θ = 22.53° and the trough at 2
θ = 18.53°, representing the crystalline and amorphous cellulose, respectively.
 |
| | Fig. 2 XRD patterns of (a) Gi, (b) GO, (c) Fe3O4, (d) PFC, and (e) M-GO/PFC composite. | |
The CrI value of PFC was calculated at approximately 86.23%, which was relatively high in comparison to other waste paper-derived cellulose in the literature.38,39,87,88 This affirms the isolation of PFC using the alkali-acid treatments in this study obtained the highly crystalline cellulose. In Fig. 2e, the crystal planes of PFC were observed in the XRD pattern of the M-GO/PFC composite, signifying the presence of this component in the composite.
To analyze the defects of carbon-based materials in Gi, GO, and the M-GO/PFC composite as well as the formation of cellulose in PFC, the Raman spectroscopy of the materials is presented in Fig. 3. For the carbonaceous materials, the G band at the 1579 cm−1 Raman shift corresponds to the planar vibration of sp2-bonded carbon atoms, whereas the D band at 1352 cm−1 stands for the sp3-bonded carbon atoms in disordered states.81,89 As shown in Fig. 3a, the G band of pristine Gi was predominate with an intense and sharp peak in comparison to its D band, while those of GO were widened due to the modification of sp2-hybridized to sp3-hybridized carbon atoms in Fig. 3b.90 The D-to-G band intensity ratio (ID/IG) can be used to assess the degree of defects, meaning that an increase in this ratio indicates a higher degree of structural disorders.91,92 The ID/IG ratio of Gi (0.103) surged to that of GO (1.038), confirming the evolution of D band domains. This could be interpreted by the intercalation of oxygenated groups between layers in Gi, increasing the interlayer spacing as mentioned in the XRD analysis. However, the ID/IG ratio of the M-GO/PFC composite (0.953) as displayed in Fig. 3d was slightly lower than that of GO, denoting a decrease in an average domain of sp3-hybridized carbon atoms. This implies that the oxygen-containing functional groups on the GO surface were more likely to interact with corresponding functional groups of PFC to yield chemical linkages such as hydrogen bonding.93 In other words, GO was partially reduced by the integration with PFC into a composite adsorbent. In the Raman spectrum of PFC in Fig. 3c, the peaks at 1207, 1255, 1345, 1392, 1431, and 1528 cm−1 were ascribed to the conformations of cellulose.94,95 This was in good agreement with the XRD pattern analysis. Therefore, the Raman spectroscopy reinforced the formation of GO, PFC, and the M-GO/PFC composite.
 |
| | Fig. 3 Raman spectra of (a) Gi, (b) GO, (c) PFC, and (d) M-GO/PFC composite. | |
The morphologies of GO, PFC, Fe3O4, and M-GO/PFC composite were identified using the FE-SEM images (Fig. 4). As illustrated in Fig. 4a and b, the FE-SEM images of the surface and cross-section of GO depicted a thin-layer structure with numerous pleats on its surface, possibly enlarging the specific surface area of the GO sheets.92,96,97 This showcases that the sonication process exfoliated graphite oxide to produce GO sheets.98,99 With respect to the FE-SEM of the surface of PFC in Fig. 4c, cellulose appeared as shortened rod-like fibrils with a diameter range of 1–14 μm and the most frequency diameter around 6–7 μm, measured by the imageJ software (Fig. 4g). The micron-sized fibrils were consistent with cellulose fibers reported in the literature, typically ranging from 5 to 10 μm diameter.43,100 In the FE-SEM of the cross-section of PFC in Fig. 4d, these fibrils were interwoven into separated layers with a thickness of around 250 μm, scaffolding for the formation of M-GO/PFC composite.38,43,76 The formation of spherical Fe3O4 particles with an average particle size of around 13 nm was seen in Fig. 4e. These Fe3O4 particles had an inclination to agglomerate into Fe3O4 clusters. With regard to the FE-SEM image of the M-GO/PFC composite in Fig. 4f, sheet-shaped lamellae were distributed throughout the surface of the composite. The formation of these lamellae could be elucidated from the integration of GO sheets and PFC, which was a scaffold for the anchor of the spherical Fe3O4 particles on their surface. The median pore diameters of PFC and the composite, determined using the BJH method, were 16.4 nm and 7.5 nm, respectively. The porosity of the composite could be ascribed to the sonication and lyophilization processes. The former was more likely to generate the formation and the collapse of acoustic cavitations, in turn producing localized high-energy spots.81 This could benefit the uniform dispersions of GO sheets and Fe3O4 particles in the PFC matrix, which was attributable to the prevention of GO restacking and Fe3O4 aggregation. Meanwhile, the latter involved the sublimation of water molecules to preserve the porous structure of the composite, somewhat promoting the adsorption by trapping polluted molecules into pores, so-called pore-filling effects.101 From the observations of the FE-SEM images, the morphology and the formation of GO, PFC, Fe3O4, and M-GO/PFC composite were depicted and verified, which was consistent with the other characterization.
 |
| | Fig. 4 FE-SEM surface images of (a) GO, (c) PFC, (e) Fe3O4, and (f) M-GO/PFC composite; FE-SEM cross-section images of (b) GO and (d) PFC; (g) average PFC diameter distribution. | |
Fig. 5a–d map the elemental distributions of C, O, Fe, and M-GO/PFC composite. As shown in Fig. 5a and b, C and O species were uniformly scattered throughout the surface of the composite, demonstrating the dense carbon-based materials with the presence of oxygen-rich functional groups on the surface. Meanwhile, Fe species were anchored on the surface with some clusters because of the agglomeration of magnetic Fe3O4 particles, which could be observed in Fig. 5c and d. The EDX spectrum of the M-GO/PFC composite in Fig. 5e displayed the existence of these elements at their characteristic peaks, confirming the reliable synthesis of the M-GO/PFC composite while minimizing impurities.62
 |
| | Fig. 5 Elemental maps of (a) C, (b) O, (c) Fe, and (d) M-GO/PFC composite; (e) EDX spectrum of M-GO/PFC composite. | |
The magnetism of the M-GO/PFC composite and pure Fe3O4 were compared in Fig. 6. Accordingly, the magnetic remanence and coercivity in both hysteresis curves obtained a value of approximately zero, signifying their superparamagnetic nature.102 The saturation magnetization (Ms) of Fe3O4 was 54.0 emu g−1, which was more than double in comparison to that of the composite (24.7 emu g−1). The reduction in the Ms value for the composite could be attributed to the predominant presence of non-magnetic components, namely GO and PFC. Nonetheless, the Ms value of the composite remained sufficient to facilitate effective magnetic separation of the adsorbent from the aqueous mixture after use.
 |
| | Fig. 6 Magnetization hysteresis curves of Fe3O4 and M-GO/PFC composite. | |
3.2. Batch adsorption studies
3.2.1. Effect of solution pH. The ionization degrees of the functional groups on the surface of the adsorbent can be controlled by attuning the solution pH. This adjustment impacts the surface charge of the adsorbent in the solution and ultimately determines the adsorption performance.65 The TC speciation is also influenced by the solution pH because of its pKa values (3.3, 7.7, and 9.7).103 As pH value is less than 3.3, TC predominantly exists in its cationic form (TCH3+). In the pH range of 3.3–7.7, TC is a zwitterionic species (TCH2±). Above the pH 7.7, TC is found in anionic forms (TCH− and TC2−).6 To investigate how the solution pH governed the TC adsorption capacity of the M-GO/PFC composite adsorbent, the experiment was conducted with the pHi values of 3.0–8.0. As shown in Fig. 7a, the composite adsorbent demonstrated an enhancement in the TC removal in the increment of the pHi from 3.0 to 4.0. Notably, the qe values showed no statistically significant difference in the pHi range of 4.0–5.0, using t-test (P = 0.18) at a 95% confidence interval (α = 0.05). However, the qe values experienced a continuous decrease when the pHi rose from 5.0 to 8.0. To further interpret these results, the pHpzc of the M-GO/PFC composite adsorbent was determined to be 3.1, as seen in Fig. 7b. This means the adsorbent had a negatively charged surface at the pHi value of more than 3.1 and vice versa. As a result, the effect of the solution pH on the TC adsorption can be elucidated by the electrostatic interactions between the charged surface of the adsorbent and TC molecules. Specifically, the cationic form of TC and the positively charged adsorbent would repel at the pHi of less than 3.1, leading to lower adsorption capacity. When the pHi increased to about 5.0, the zwitterionic form (TCH±2) became predominant.103 Consequently, the electrostatic attraction between the positively charged TC and the negatively charged adsorbent surface was in favor, which in turn improved the adsorption capacity. When the pHi value further increased to 8.0, the zwitterionic form decreased together with the formation of anionic TCH−. This rooted electrostatic repulsion with the negatively charged adsorbent surface, causing a decrease in the qe value. Based on these results, the pHi of 5.0 was selected for subsequent adsorption studies.
 |
| | Fig. 7 (a) Effect of solution pH on the TC adsorption capacity, and (b) the pHpzc of M-GO/PFC composite adsorbent. | |
3.2.2. Effect of adsorbent dose. To examine the effect of adsorbent dose on the TC elimination, the results are plotted in Fig. 8. As can be seen in the graph, a continuous decrease in the TC adsorption capacity of the composite adsorbent was witnessed, dropping from the highest qe value of 93.36 ± 3.85 mg g−1 at an adsorbent dose of 0.50 g L−1 to the lowest point of 59.52 ± 0.11 mg g−1 at 1.17 g L−1. This might be explained that the dense density of the adsorbent at high dose obstructed the available active sites.104–106 It is necessary to emphasize that the high qe value at low dose would pave the way for widespread applications, reducing the adsorption cost while minimizing the hazards of secondary environmental pollution due to the surplus adsorbent use.107 Therefore, the adsorbent dose of 0.50 g L−1 was selected for further studies.
 |
| | Fig. 8 Effect of adsorbent dose on the TC adsorption capacity. | |
3.2.3. Effect of ionic strength. To investigate the effect of ionic strength on the TC adsorption capacity and to gain insight into the underlying adsorption mechanism, the experiment was conducted using NaCl solutions with molarities ranging from 0 to 0.1 M (Fig. 9). These results reveal that the TC adsorption capacity decreased slightly with increasing ionic strength. At a pHi value of 5.0, TC existed as zwitterions (TCH2±), while the M-GO/PFC composite adsorbent possessed a negatively charged surface. Thus, the TC removal could be primarily driven by the electrostatic attraction between TC molecules and the adsorbent surface. However, the presence of NaCl in the solution may suppress the electrostatic interactions of opposite charges between the adsorbent and the adsorbate.67,108 When the ionic strength increased, the excess presence of Na+ ions in the solution might screen the negatively charged surface of the adsorbent, while the zwitterionic species of TC could interact with both Na+ and Cl− ions. Therefore, a suppression of electrostatic attraction occurred, leading to a decline in the TC adsorption capacity.109 Nevertheless, a humble decrease in the adsorption capacity suggests that other adsorption mechanisms such as π–π stacking and hydrogen bonding may also play a significant role at high ionic strengths. Admittedly, the aromatic rings of TC probably engaged in π–π stacking with the honeycomb lattice of GO, whereas its functional groups were prone to forming hydrogen bonds with their counterparts on the adsorbent surface. Such interactions were less dependent on the effect of ionic strength, sustaining the TC elimination when the electrostatic interactions were impeded.
 |
| | Fig. 9 Effect of ionic strength on the TC adsorption capacity. | |
3.2.4. Investigation of adsorption kinetic. Studying adsorption kinetic is essential for determining kinetic parameters, which are crucial for analyzing and optimizing the adsorption performance.104,110 The adsorption performance of the composite adsorbent was monitored over a contact time ranging from 10 to 360 min. As shown in Fig. 10, the adsorption capacity enhanced with longer contact time and reached equilibrium after 60 min. The experimental data were analyzed using non-linear kinetic models, including the pseudo-first-order, pseudo-second-order, and Elovich models.111–113 The corresponding equations, kinetic parameters, and correlation coefficients for each model are presented in Table 1, while the experimental data and model fitting are illustrated in Fig. 10. Among the models, the pseudo-second-order kinetic model provided the best fit to the experimental data, with the highest correlation coefficient (R2 = 0.997). Based on the equation h = k2qe2 where k2 and qe were obtained from the adsorption kinetic parameters of the pseudo-second-order kinetic model in Table 1, the initial adsorption rate was determined to be 18.09 mg g−1 min−1. As illustrated in Fig. 10, the adsorption capacity surged for the first 10 min before slowing down and reaching the equilibrium, which was attributable to promptly occupied adsorption sites.114 This can be interpreted by the assumption of multilayer adsorption onto the heterogeneous surface of the composite.
 |
| | Fig. 10 Adsorption kinetic models for the TC adsorption onto the M-GO/PFC composite adsorbent. | |
Table 1 Adsorption kinetic parameters for the TC adsorption onto the M-GO/PFC composite adsorbenta
| Adsorption kinetic models |
Adsorption kinetic parameters |
Correlation coefficients |
| qe and qt: adsorption capacity at equilibrium and at time t; k1 and k2: corresponding rate constants of adsorption kinetic models; α: initial adsorption rate of the Elovich model; β: desorption rate of the Elovich model. |
| Pseudo-first-order |
k1(min−1) |
qe(mg g−1) |
R2 |
| qt = qe(1 − exp(−k1t)) |
0.11 |
83.92 |
0.982 |
|
| Pseudo-second-order |
k2(g mg−1min−1) |
qe(mg g−1) |
R2 |
 |
0.0023 |
87.74 |
0.997 |
|
| Elovich |
α (g g−1min−1) |
β (mg−1g) |
R2 |
 |
2.89 |
0.13 |
0.996 |
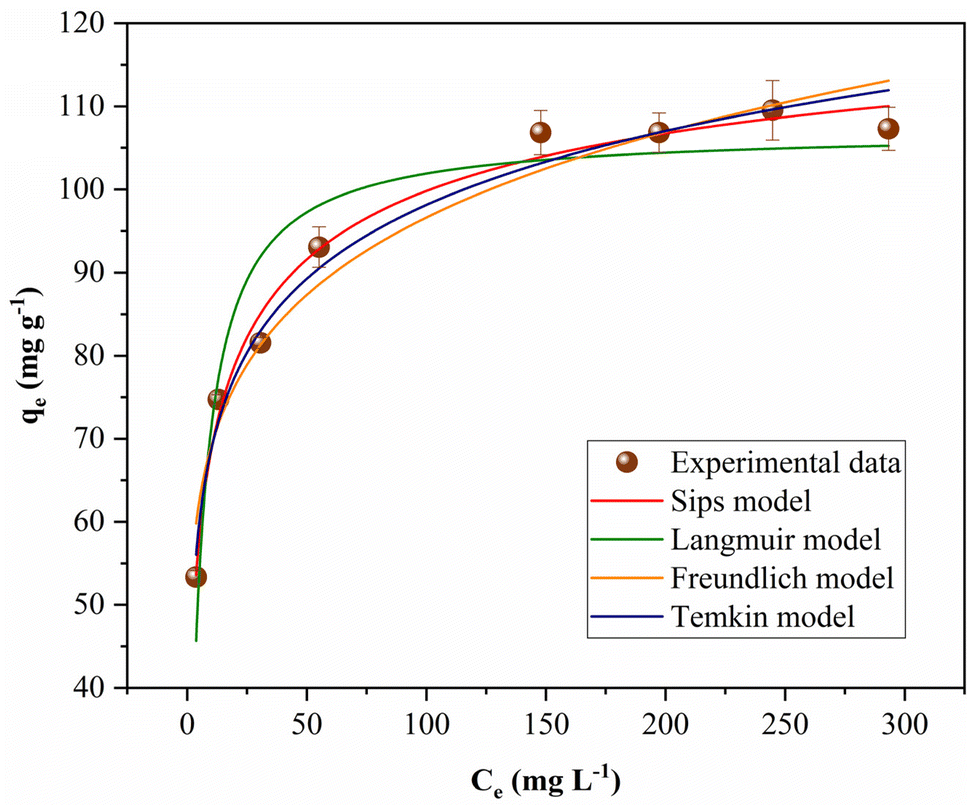
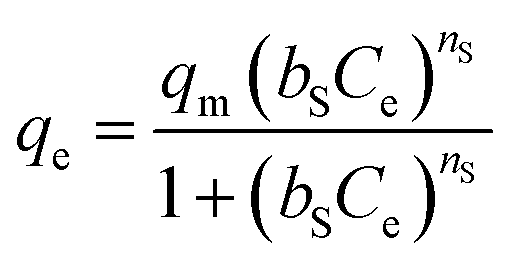
3.2.5. Investigation of adsorption isotherm. The equilibrium performance of the M-GO/PFC composite adsorbent was studied through the adsorption isotherm, applying four widely used non-linear models: Langmuir,115 Freundlich,116 Sips,117 and Temkin.118 The effect of the initial TC concentration on the TC adsorption capacity and the non-linear plots of the isotherm models are described in Fig. 11. The equations of the isotherm models and the corresponding isotherm parameters are detailed in Table 2. As can be seen in the plots, the adsorption capacity was in positive relation with the initial TC concentration. Among these models, the Sips isotherm model was the best representation of the experimental data with the highest R2 value of 0.988, gaining the qm value of 130.11 mg g−1. Theoretically, the Sips model expresses features of both the Freundlich and Langmuir equations.119 The nS value is used to assess the surface heterogeneity of the adsorption and the nature of the adsorption process. Specifically, when nS equals to 1, the Sips model simplifies to the Langmuir isotherm, assuming monolayer adsorption on a homogeneous surface. On the contrary, when nS deviates from 1, it aligns more with the Freundlich isotherm, reflecting adsorption on a heterogeneous surface with multilayer adsorption behavior.120,121 In this study, the nS value of 0.47 was far lower than 1, indicating behavior similar to the Freundlich model. Furthermore, the adsorption isotherm findings were consistent with the adsorption kinetic results, confirming that TC adsorption took place on the heterogeneous surface of the M-GO/PFC composite adsorbent.
 |
| | Fig. 11 Adsorption isotherm models for the TC adsorption onto the M-GO/PFC composite adsorbent. | |
Table 2 Adsorption isotherm parameters for the TC adsorption onto the M-GO/PFC composite adsorbenta
| Adsorption isotherm models |
Adsorption isotherm parameters |
Correlation coefficients |
| qe: equilibrium adsorption capacity; 1/nF: Freundlich adsorption intensity parameter: Ce: equilibrium concentration of adsorbate; KF: Freundlich constant related to adsorption capacity; qm: maximum adsorption capacity; KL: Langmuir constant related to the energy of adsorption; bS: Sips constant; nS: heterogeneity factor; bT: Temkin constant; AT: Temkin isotherm constant. |
| Langmuir |
qm(mg g−1) |
KL(L mg−1) |
|
R2 |
 |
107.06 |
0.20 |
|
0.916 |
|
| Freundlich |
|
KF(mg g−1) |
1/nF |
R2 |
| qe = KFCe1/nF |
|
49.27 |
0.15 |
0.957 |
|
| Sips |
qm(mg g−1) |
bS(mg−1 L) |
nS |
R2 |
 |
130.11 |
0.125 |
0.47 |
0.988 |
| |
| Temkin |
|
bT(kJ mol−1) |
AT(L mg−1) |
R2 |
 |
|
0.20 |
21.03 |
0.980 |
3.2.6. Recyclability study. The recyclability is an indispensable benchmark to assess the cost-effectiveness, efficiency, and practicability of an adsorbent. In this regard, the M-GO/PFC composite adsorbent was reused and regenerated through five successive adsorption–desorption cycles as displayed in Fig. 12. The recyclability study pinpointed a slight decrease in the TC adsorption efficiency from 88.33% after the first cycle to 75.38% at the end of the study. Therefore, from the first to the fifth cycle, the TC adsorption efficiency decreased by 12.95%. It is noticeable to compare this value with other counterparts, showing that the degree of the decrease in the TC adsorption efficiency in this study was lower than that of GO-TiO2 composite (18.80%),121 polyvinyl alcohol-copper alginate gel beads (approximately 20%),122 and Y-immobilized GO-alginate hydrogel (nearly 45%)123 after four adsorption–desorption cycles in the literature. This demonstrated a stable adsorption performance of the M-GO/PFC composite adsorbent, likely benefiting from the magnetic property of the composite adsorbent for the easy separation after use.
 |
| | Fig. 12 Recyclability study of M-CO/PFC composite adsorbent. | |
3.2.7. Comparison of maximum adsorption capacity. The data given in Table 3 compare the qm values obtained from the Sips isotherm model between various adsorbents from previous findings and in this study. It is obvious that the M-GO/PFC composite adsorbent was comparable to other counterparts. On the one hand, the qm value in this study (130.11 mg g−1) was lower than those reported for other GO-based materials, such as the GO-TiO2 composite (133.24 mg g−1), magnetic GO nanocomposite modified with polyvinylpyrrolidone (193.80 mg g−1), and particularly, our previously developed magnetic GO/Fe3O4/banana peel-derived cellulose composite aerogel (238.71 mg g−1). It is also necessary to elaborate that the higher qm value from our previous study could be attributed to the structural advantages of the composite aerogel in comparison to the composite adsorbent used in the present study. On the other hand, the adsorption capacity reported here was nearly double that of GO nanosheets (66.26 mg g−1) and three times higher than that of the monodispersed starch-stabilized magnetic nanocomposite (39.34 mg g−1). This result revealed a promising potential of utilizing office waste paper for a facile preparation of the composite adsorbent, leveraging the mass production of the low-cost and eco-friendly waste paper-derived adsorbent while maintaining the effective TC adsorption performance and reusability based on the supplementations of GO sheets and Fe3O4 particles into the PFC scaffold.
Table 3 Comparison of maximum adsorption capacity according to the Sips isotherm model for the TC removal from the literature and in this study
| Adsorbents |
qm (mg g−1) |
Reference |
| Magnetic graphene oxide/Fe3O4/banana peel-derived cellulose composite aerogel |
238.71 |
66 |
| Magnetic GO nanocomposite modified with polyvinylpyrrolidone |
193.80 (at 308 K) |
124 |
| GO-TiO2 composite |
133.24 (at 298 K) |
121 |
| GO nanosheets |
66.26 (at 308 K) |
125 |
| Monodispersed starch-stabilized magnetic nanocomposite |
39.34 (at 298 K) |
126 |
| M-GO/PFC composite |
130.11 |
This study |
3.2.8. Proposed adsorption mechanism. The FTIR and XPS spectra of the M-GO/PFC composite adsorbent before and after the TC adsorption were recorded to scrutinize the adsorption mechanism. Regarding the FTIR spectra in Fig. 1f, the positions of the characteristic peaks of PFC, GO, and Fe3O4 were preserved, showing a stable architecture of the M-GO/PFC composite adsorbent was maintained after the TC adsorption. The preservation of the components of the composite was attributed to maintaining the ample oxygenated functional groups and aromatic rings, which in turn might contribute to electrostatic interactions between a negatively charged adsorbent surface and a positively charged form of TC, hydrogen bonding, and π–π stacking.122 It is worth noting that a small difference between the FTIR spectra of the M-GO/PFC composite before and after the adsorption could be explored at the broadness of the peak at around 1630 cm−1. As in our previous study about the TC adsorption onto a composite aerogel, the vibrational peak of 1620 cm−1 was probably ascribed to the N–H primary amine of TC.66 Thus, the broadened vibration at around 1630 cm−1 after the TC adsorption somewhat could be related to the presence of TC. The XPS analyses of the M-GO/PFC composite adsorbent before and after the TC adsorption were used to clarify the elemental composition and interactions. As shown in Fig. 13a and d, all characteristic C 1s, O 1s, and Fe 2p peaks from the three components (PFC, GO, and Fe3O4) were observed in the XPS survey spectra of the composite before and after the TC adsorption. When examining the XPS high-resolution spectra of C 1s and O 1s in Fig. 13b, c, e, and f, it is noticeable that the deconvoluted peaks of the functional groups of the composite were translated to higher binding energy after the adsorption. A possible explanation is that TC molecules withdrew electrons from the composite through hydrogen bonding, π–π stacking, and electrostatic interactions, thereby reducing electron density around carbon and oxygen atoms in the composite, eventually leading to an increase in the binding energy.127 The emergence of a new C 1s peak at 288.0 eV (N–CO) in the composite after the TC adsorption (Fig. 13e) confirmed the presence and interaction of TC molecules with the functional groups of the composite.127,128 Moreover, this could be reinforced by the high-resolution spectrum of N 1s peaks at 397.62 eV (C–NH2) and 399.58 eV (N–CO) in Fig. 13h.122,129 In addition, the high-resolution spectrum of Fe 2p peaks at around 710.2 eV (2p3/2) and 725.4 eV (2p1/2) in Fig. 13g demonstrated the retention of Fe3O4,130–132 maintaining the magnetic property of the composite after the adsorption process. To put it simply, the FTIR spectra and XPS findings of the M-GO/PFC composite were consistent in the ample functionalities, the structural preservation, and the chemical composition of the M-GO/PFC composite after the TC adsorption. These results would be concrete evidence for the possible adsorption mechanism of electrostatic interactions, hydrogen bonding, and π–π stacking interactions.
 |
| | Fig. 13 XPS of (a) survey spectrum, (b) C 1s, and (c) O 1s of M-GO/PFC composite before the TC adsorption; XPS of (d) survey spectrum, (e) C 1s, (f) O 1s, (g) Fe 2p, and (h) N 1s of M-GO/PFC composite after the TC adsorption. | |
The results of the TC adsorption study would be beneficial for the proposed adsorption mechanism. Admittedly, the TC adsorption was favored in the solution pH enhancing the electrostatic attraction between TC molecules and the charged surface of the M-GO/PFC composite adsorbent. In this regard, the proposed fundamental mechanism could be electrostatic interactions. It is noteworthy that the TC elimination also occurred at low pHi values, which was subject to electrostatic repulsion. This implies that TC might also interact with the composite adsorbent through other means such as π–π interactions, hydrogen bonds, and pore-filling effects as aforementioned.133,134 To sum up, the electrostatic interactions, π–π interactions, pore-filling effects, and hydrogen bonds may be involved in the proposed TC adsorption mechanism on the M-GO/PFC composite adsorbent, which is illustrated in Fig. 14.
 |
| | Fig. 14 Proposed mechanism for the TC adsorption onto the M-GO/PFC composite adsorbent. | |
4. Conclusions
The findings of spectroscopy and morphology confirm that the M-GO/PFC composite adsorbent was successfully created using the ultrasound-assisted mixing method combined with the lyophilization. It is noteworthy that PFC derived from copious office waste paper and M-GO were simply integrated into the M-GO/PFC composite, aiming to enhance the TC adsorption capacity and the reusability of the composite adsorbent. The VSM analysis proved the magnetism of the composite adsorbent, facilitating the separation of the adsorbent from the aqueous mixture. The analyses of solution pH, ionic strength, FTIR, and XPS spectra after the TC adsorption could be used as concrete evidence for proposing the TC adsorption mechanism of the adsorbent, possibly including the electrostatic interactions, hydrogen bonds, π–π interactions, and pore-filling effects. The adsorption kinetic and isotherm indicated that TC was adsorbed on the heterogeneous surface of the as-prepared adsorbent. The recyclability study revealed a stable adsorption efficiency of the adsorbent after five consecutive adsorption–desorption cycles. The M-GO/PFC composite exhibits significant potential as a promising adsorbent, offering an effective strategy for converting leftover solid waste into valuable materials in antibiotics-containing wastewater treatment.
Data availability
The authors confirm that the data used to support the findings of this study are available within the article.
Author contributions
Lam-Tuan-Cuong Dang: data curation, methodology, investigation, formal analysis, validation, writing – original draft. Hoang-Vinh-Truong Phan: data curation, validation. Nhan-Tam Do: investigation, data curation. Minh-Trung Dao: conceptualization, validation. Thanh-Truc Dang: investigation, data curation. Soontorn Suvokhiaw: conceptualization, methodology. Narit Triamnak: methodology, validation. Thi-Anh-Minh Nguyen: investigation, formal analysis. Van-Kieu Nguyen: conceptualization, methodology. Ngoc-Van-Trang Dao*: investigation, methodology, writing – original draft, writing – review & editing. Le-Thuy-Thuy-Trang Hoang*: conceptualization, methodology, validation, supervision, writing – original draft, writing – review & editing.
Conflicts of interest
There are no conflicts of interest to declare.
Acknowledgements
The authors declare that no funds or grants were received during the preparation of this manuscript.
References
- Y. Kong, Y. Zhuang, K. Han and B. Shi, Colloids Surf., A, 2020, 588, 124360 CrossRef CAS.
- Y. Zhao, Q. E. Yang, X. Zhou, F.-H. Wang, J. Muurinen, M. P. Virta, K. K. Brandt and Y.-G. Zhu, Crit. Rev. Environ. Sci. Technol., 2021, 51, 2159–2196 CrossRef CAS.
- M. Beiranvand, S. Farhadi and A. Mohammadi-Gholami, RSC Adv., 2022, 12, 34438–34453 RSC.
- G. Gopal, S. A. Alex, N. Chandrasekaran and A. Mukherjee, RSC Adv., 2020, 10, 27081–27095 RSC.
- L. Xu, H. Zhang, P. Xiong, Q. Zhu, C. Liao and G. Jiang, Sci. Total Environ., 2021, 753, 141975 CrossRef CAS PubMed.
- Y. Dai, M. Liu, J. Li, S. Yang, Y. Sun, Q. Sun, W. Wang, L. Lu, K. Zhang and J. Xu, Sep. Sci. Technol., 2020, 55, 1005–1021 CrossRef CAS.
- Q. Liao, H. Rong, M. Zhao, H. Luo, Z. Chu and R. Wang, Sci. Total Environ., 2021, 757, 143981 CrossRef CAS PubMed.
- J. Leichtweis, Y. Vieira, N. Welter, S. Silvestri, G. L. Dotto and E. Carissimi, Process Saf. Environ. Prot., 2022, 160, 25–40 CrossRef CAS.
- A. Balakrishnan, M. Chinthala, R. K. Polagani and D.-V. N. Vo, Environ. Res., 2023, 216, 114660 CrossRef CAS PubMed.
- M. Minale, Z. Gu, A. Guadie, D. M. Kabtamu, Y. Li and X. Wang, J. Environ. Manage., 2020, 276, 111310 CrossRef CAS PubMed.
- A. Nasiri, N. Golestani, S. Rajabi and M. Hashemi, Heliyon, 2024, 10, e24179 CrossRef CAS PubMed.
- Y. Qin, B. Chai, C. Wang, J. Yan, G. Fan and G. Song, Colloids Surf., A, 2022, 655, 130197 CrossRef CAS.
- D. Zhang, K. Zhang, X. Hu, Y. Xue, L. Zhang and Y. Sun, Sep. Purif. Technol., 2021, 272, 118957 CrossRef CAS.
- Q. Yang, P. Wu, J. Liu, S. Rehman, Z. Ahmed, B. Ruan and N. Zhu, Environ. Res., 2020, 181, 108899 CrossRef CAS PubMed.
- L. Wang, Y. Liu, D. Pang, H. Song and S. Zhang, Chemosphere, 2022, 292, 133469 CrossRef CAS PubMed.
- X. Wang, F. Li, X. Hu and T. Hua, Sci. Total Environ., 2021, 784, 146912 CrossRef CAS PubMed.
- J. Li, J. Tao, C. Ma, J. Yang, T. Gu and J. Liu, RSC Adv., 2020, 10, 42038–42053 RSC.
- D. Morales-Serrato, J. Torres-Pérez, Á. de Jesús Ruíz-Baltazar and S. Y. Reyes-López, Int J Res GRANTHAALAYAH, 2021, 9, 446–491 Search PubMed.
- O. A. Ajala, S. O. Akinnawo, A. Bamisaye, D. T. Adedipe, M. O. Adesina, O. A. Okon-Akan, T. A. Adebusuyi, A. T. Ojedokun, K. A. Adegoke and O. S. Bello, RSC Adv., 2023, 13, 4678–4712 RSC.
- M. A. Islam, B. Hameed, M. Ahmed, W. Khanday, M. A. Khan and F. Marrakchi, Biomass Convers. Biorefin., 2023, 13, 13153–13162 CrossRef CAS.
- J. Yang, Y. Dou, H. Yang and D. Wang, Appl. Surf. Sci., 2021, 538, 148110 CrossRef CAS.
- P. T. T. Ninh, N. D. Dat, M. L. Nguyen, N. T. Dong, H.-P. Chao and H. N. Tran, Environ. Res., 2023, 218, 114927 CrossRef CAS PubMed.
- S. Al-Salihi, M. M. Fidalgo and Y. Xing, ACS ES&T Water, 2023, 3, 838–847 Search PubMed.
- F. K. Mostafapour, M. Yilmaz, A. H. Mahvi, A. Younesi, F. Ganji and D. Balarak, Desalination Water Treat., 2022, 247, 216–228 CrossRef CAS.
- A. Maged, J. Iqbal, S. Kharbish, I. S. Ismael and A. Bhatnagar, J. Hazard. Mater., 2020, 384, 121320 CrossRef CAS PubMed.
- J. Shang, M. Huang, L. Zhao, P. He, Y. Liu, H. Pan, S. Cao and X. Liu, ACS Omega, 2023, 9, 692–699 CrossRef PubMed.
- M. I. Al-Wabel, M. Ahmad, A. R. Usman, A. S. Sallam, Q. Hussain, R. B. Binyameen, M. R. Shehu and Y. S. Ok, J. Hazard Mater., 2020, 384, 121500 CrossRef CAS PubMed.
- W. Wang, Z. Zhu, M. Zhang, S. Wang and C. Qu, J. Taiwan Inst. Chem. Eng., 2020, 106, 130–137 CrossRef CAS.
- Y. Zhu, J. Shen, M. Guo, H. Zheng and Y. Cao, Environ. Sci. Pollut. Res., 2023, 30, 27315–27327 CrossRef CAS PubMed.
- W. Wongvitvichot, S. Pithakratanayothin, S. Wongkasemjit and T. Chaisuwan, Polym. Degrad. Stab., 2021, 184, 109473 CrossRef CAS.
- L. Bulgariu, L. B. Escudero, O. S. Bello, M. Iqbal, J. Nisar, K. A. Adegoke, F. Alakhras, M. Kornaros and I. Anastopoulos, J. Mol. Liq., 2019, 276, 728–747 CrossRef CAS.
- A. K. Pradhananga and M. A. Davenport, Landsc. Urban Plann., 2017, 168, 1–8 CrossRef.
- S. F. M. Hanafiah, W. H. Danial, M. A. A. Samah, W. Z. Samad, D. Susanti, R. M. Salim and Z. A. Majid, Malays. J. Anal. Sci., 2019, 23, 901–913 Search PubMed.
- A. Haile, G. G. Gelebo, T. Tesfaye, W. Mengie, M. A. Mebrate, A. Abuhay and D. Y. Limeneh, Bioresour. Bioprocess., 2021, 8, 1–22 CrossRef PubMed.
- A. Milbrandt, J. Zuboy, K. Coney and A. Badgett, Waste Manag. Bull., 2024, 2, 21–28 CrossRef.
- G. Joshi, S. Naithani, V. Varshney, S. S. Bisht, V. Rana and P. Gupta, Waste Manage., 2015, 38, 33–40 CrossRef CAS PubMed.
- W. H. Danial, Z. A. Majid, M. N. M. Muhid, S. Triwahyono, M. B. Bakar and Z. Ramli, Carbohydr. Polym., 2015, 118, 165–169 CrossRef CAS PubMed.
- M. Zubair, N. D. Mu’azu, M. Nasir, M. S. Manzar, M. A. Aziz, M. Saleem and M. A. Al-Harthi, Arabian J. Sci. Eng., 2022, 47, 5377–5393 CrossRef CAS.
- A. Orue, A. Santamaria-Echart, A. Eceiza, C. Peña-Rodriguez and A. Arbelaiz, J. Appl. Polym. Sci., 2017, 134, 45257 CrossRef.
- M. Agarwal, V. K. Kudapa and J. Sudharsan, Mater. Today: Proc., 2021, 47, 5319–5325 CAS.
- V. S. Munagapati, J.-C. Wen, C.-L. Pan, Y. Gutha, J.-H. Wen and G. M. Reddy, Int. J. Phytoremediation, 2020, 22, 267–278 CrossRef CAS PubMed.
- L. S. Silva, L. C. Lima, F. C. Silva, J. M. E. Matos, M. R. M. Santos, L. S. S. Júnior, K. S. Sousa and E. C. da Silva Filho, Chem. Eng. J., 2013, 218, 89–98 CrossRef CAS.
- R. Shadkam, M. Naderi, A. Ghazitabar and S. Akbari, Mater. Today Commun., 2021, 28, 102610 CrossRef CAS.
- C. Prasad, N. Madkhali, B.-M. Lee, C. S. Kang and H. Y. Choi, Polymer, 2023, 270, 125786 CrossRef CAS.
- S. Hegazy, N. A. Abdelwahab, A. M. Ramadan and S. K. Mohamed, Next Mater., 2024, 3, 100064 CrossRef.
- O. A. Oyewo, E. E. Elemike, D. C. Onwudiwe and M. S. Onyango, Int. J. Biol. Macromol., 2020, 164, 2477–2496 CrossRef CAS PubMed.
- J. Onwumere, J. d. Piatek, T. Budnyak, J. Chen, S. Budnyk, Z. Karim, T. Thersleff, P. Kuśtrowski, A. P. Mathew and A. Slabon, ACS Appl. Mater. Interfaces, 2020, 12, 42891–42901 CrossRef CAS PubMed.
- P. Bruni, P. Avino, V. Ferrone, S. Pilato, N. Barbacane, V. Canale, G. Carlucci and S. Ferrari, Separations, 2023, 10, 115 CrossRef CAS.
- N. Baig, M. Sajid and T. A. Saleh, J. Environ. Manag., 2019, 244, 370–382 CrossRef CAS PubMed.
- R. H. Krishna, M. Chandraprabha, K. Samrat, T. K. Murthy, C. Manjunatha and S. G. Kumar, Appl. Surf. Sci. Adv., 2023, 16, 100431 CrossRef.
- D. R. Rout, H. M. Jena, O. Baigenzhenov and A. Hosseini-Bandegharaei, Sci. Total Environ., 2023, 863, 160871 CrossRef CAS PubMed.
- P. L. Yap, M. J. Nine, K. Hassan, T. T. Tung, D. N. Tran and D. Losic, Adv. Funct. Mater., 2021, 31, 2007356 CrossRef CAS.
- A. K. Geim and K. S. Novoselov, Nat. Mater., 2007, 6, 183–191 CrossRef CAS PubMed.
- M. S. Iqbal, A. A. Aslam, R. Iftikhar, M. Junaid, S. M. Imran, M. S. Nazir, Z. Ali, M. Zafar, A. Kanwal and N. K. Othman, J. Water Proc. Eng., 2023, 53, 103809 CrossRef.
- N. Yao, C. Li, J. Yu, Q. Xu, S. Wei, Z. Tian, Z. Yang, W. Yang and J. Shen, Sep. Purif. Technol., 2020, 236, 116278 CrossRef CAS.
- N. H. Dang, T. H. Tu, V. N. P. Linh, L. T. M. Thy, H. M. Nam, M. T. Phong and N. H. Hieu, Synth. Met., 2019, 255, 116106 CrossRef.
- P. Joshi, A. Raturi, M. Srivastava and O. P. Khatri, J. Environ. Chem. Eng., 2022, 10, 108597 CrossRef CAS.
- Y. He, C. Yi, X. Zhang, W. Zhao and D. Yu, Trac. Trends Anal. Chem., 2021, 136, 116191 CrossRef CAS.
- D. Qiao, Z. Li, J. Duan and X. He, Chem. Eng. J., 2020, 400, 125952 CrossRef CAS.
- N. Zaaba, K. Foo, U. Hashim, S. Tan, W.-W. Liu and C. Voon, Procedia Eng., 2017, 184, 469–477 CrossRef CAS.
- T. T. T. Le Hoang, F. Unob, S. Suvokhiaw and N. Sukpirom, J. Environ. Chem. Eng., 2020, 8, 103653 CrossRef.
- T. M. Irfan, T. S. George, K. S. Abidh, S. Prakash, B. P. Kanoth, N. George, V. Balachandrakurup, C. M. Dominic and A. B. Nair, Mater. Today: Proc., 2023, 1–17 Search PubMed.
- P. Joshi, O. P. Sharma, S. K. Ganguly, M. Srivastava and O. P. Khatri, J. Colloid Interface Sci., 2022, 608, 2870–2883 CrossRef CAS PubMed.
- L.-T.-T.-T. Hoang, H.-V.-T. Phan, P.-N. Nguyen, T.-T. Dang, T.-N. Tran, D.-T. Vo, V.-K. Nguyen and M.-T. Dao, Arch. Environ. Contam. Toxicol., 2024, 86, 48–57 CrossRef CAS PubMed.
- V. S. Munagapati, H.-Y. Wen, Y. Vijaya, J.-C. Wen, J.-H. Wen, Z. Tian, G. M. Reddy and J. Raul Garcia, Int. J. Phytoremediation, 2021, 23, 911–923 CrossRef CAS PubMed.
- M.-T. Dao, T.-T. Dang, S. Suvokhiaw, N.-T. Do and V.-K. Nguyen, RSC Adv., 2024, 14, 34457–34470 RSC.
- L.-T.-T.-T. Hoang, H.-V.-T. Phan, N.-N. Nguyen, T.-T. Dang, T.-N. Tran, V.-K. Nguyen and M.-T. Dao, Int. J. Phytoremediation, 2024, 26, 2313–2324 CrossRef CAS PubMed.
- H. Lee, S. Fiore and F. Berruti, Biomass Bioenergy, 2024, 191, 107446 CrossRef CAS.
- G. Surekha, K. V. Krishnaiah, N. Ravi and R. P. Suvarna, J. Phys.:Conf. Ser., 2020, 012012 CrossRef CAS.
- D. B. Thinh, N. T. Tien, N. M. Dat, H. H. T. Phong, N. T. H. Giang, D. T. Y. Oanh, H. M. Nam, M. T. Phong and N. H. Hieu, Synth. Met., 2020, 270, 116583 CrossRef CAS.
- P. Moradi and M. Hajjami, RSC Adv., 2021, 11, 25867–25879 RSC.
- P. Zong, D. Cao, Y. Cheng, S. Wang, J. Zhang, Z. Guo, T. Hayat, N. S. Alharbi and C. He, Cellulose, 2019, 26, 4039–4060 CrossRef CAS.
- A. Dang, Y. Wang, Y. Liu, T. Cheng, A. Zada, F. Ye, W. Deng, Y. Sun, T. Zhao and T. Li, J. Hazard. Mater., 2023, 457, 131846 CrossRef CAS PubMed.
- X. Li, D. Zeng, P. Ke, G. Wang and D. Zhang, RSC Adv., 2020, 10, 7163–7169 RSC.
- F.-Z. S. A. Hassani, M. H. Salim, Z. Kassab, H. Sehaqui, E.-H. Ablouh, R. Bouhfid and M. El Achaby, RSC Adv., 2022, 12, 8536–8546 RSC.
- A. G. de Souza, R. F. Barbosa and D. S. Rosa, J. Polym. Environ., 2020, 28, 1851–1868 CrossRef CAS.
- N. T. T. Van, P.-a. Gaspillo, H. G. T. Thanh, N. H. T. Nhi, H. N. Long, N. Tri, N. T. T. Van, T.-T. Nguyen and H. K. P. Ha, Heliyon, 2022, 8, e11845 CrossRef PubMed.
- R. Md Salim, J. Asik and M. S. Sarjadi, Wood Sci. Technol., 2021, 55, 295–313 CrossRef CAS.
- M. Labus and M. Lempart, J. Petrol. Sci. Eng., 2018, 161, 311–318 CrossRef CAS.
- S. Prabhu, L. Cindrella, O. J. Kwon and K. Mohanraju, Sol. Energy Mater. Sol. Cells, 2017, 169, 304–312 CrossRef CAS.
- D. L. T. Cuong, D. N. Trinh, N. T. T. Linh, N. D. Hai, P. T. L. Chau, N. T. Hoang, M. T. Phong and N. H. Hieu, Mater. Res. Bull., 2022, 156, 112000 CrossRef CAS.
- J. Geng, Y. Men, C. Liu, X. Ge and C. Yuan, RSC Adv., 2021, 11, 16592–16599 RSC.
- Q. Jiang, X. Xing, Y. Jing and Y. Han, Int. J. Biol. Macromol., 2020, 149, 1318–1322 CrossRef CAS PubMed.
- Y. Chen, Y. Jiang, A. Wang, X. Yue, F. Qiu and D. Yang, Cellulose, 2023, 30, 10341–10355 CrossRef CAS.
- S. Mishra, B. Prabhakar, P. S. Kharkar and A. M. Pethe, ACS Omega, 2022, 8, 1140–1145 CrossRef PubMed.
- L. Segal, J. J. Creely, A. Martin Jr and C. Conrad, Textil. Res. J., 1959, 29, 786–794 CrossRef CAS.
- R. Yu, P. MN, D. W. Lee and J.-l. Song, J. Nat. Fibers, 2022, 19, 8582–8592 CrossRef CAS.
- M. I. Sofyan, R. S. Mawarni, L. Sirumapea, E. Pramono, A. Marlina and S. T. C. L. Ndruru, AIP Conf. Proc., 2023, 050008 CrossRef CAS.
- P. W. Albers, V. Leich, A. J. Ramirez-Cuesta, Y. Cheng, J. Hönig and S. F. Parker, Mater. Adv., 2022, 3, 2810–2826 RSC.
- X. Mei, X. Meng and F. Wu, Phys. E Low-dimens. Syst. Nanostruct., 2015, 68, 81–86 CrossRef CAS.
- D. Li, J. Huang, L. Huang, S. Tan and T. Liu, Langmuir, 2021, 37, 1521–1530 CrossRef CAS PubMed.
- H. Dan, N. Li, X. Xu, Y. Gao, Y. Huang, M. Akram, W. Yin, B. Gao and Q. Yue, Sci. Total Environ., 2020, 739, 139983 CrossRef CAS PubMed.
- H.-A. S. Tohamy, M. El-Sakhawy and S. Kamel, J. Renewable Mater., 2022, 10, 1889 CAS.
- U. P. Agarwal, Front. Plant Sci., 2014, 5, 490 Search PubMed.
- R. S. Dassanayake, N. Dissanayake, J. S. Fierro, N. Abidi, E. L. Quitevis, K. Boggavarappu and V. D. Thalangamaarachchige, Appl. Spectrosc. Rev., 2023, 58, 180–205 CrossRef CAS.
- K. Phasuksom, W. Prissanaroon-Ouajai and A. Sirivat, RSC Adv., 2020, 10, 15206–15220 RSC.
- W. Li, M. Xu, Q. Cao, J. Luo, S. Yang and G. Zhao, RSC Adv., 2021, 11, 19387–19394 RSC.
- F. Asghar, B. Shakoor, S. Fatima, S. Munir, H. Razzaq, S. Naheed and I. S. Butler, RSC Adv., 2022, 12, 11750–11768 RSC.
- M. Muniyalakshmi, K. Sethuraman and D. Silambarasan, Mater. Today: Proc., 2020, 21, 408–410 CAS.
- M. Mohamed, W. Salleh, J. Jaafar, S. M. Asri and A. Ismail, RSC Adv., 2015, 5, 29842–29849 RSC.
- J. Dai, X. Meng, Y. Zhang and Y. Huang, Bioresour. Technol., 2020, 311, 123455 CrossRef CAS PubMed.
- K. Ali, A. K. Sarfraz, I. M. Mirza, A. Bahadur, S. Iqbal and A. ul Haq, Curr. Appl. Phys., 2015, 15, 925–929 CrossRef.
- J. L. Colaizzi and P. R. Klink, J. Pharm. Sci., 1969, 58, 1184–1189 CrossRef CAS PubMed.
- M.-T. Dao, T.-P.-L. Tran, D.-T. Vo, V.-K. Nguyen and L.-T.-T.-T. Hoang, Adv. Mater. Sci. Eng., 2021, 2021, 1–10 Search PubMed.
- B. N. Mahato, T. Krithiga and M. M. Thangam, Surf. Interfaces, 2021, 23, 100636 CrossRef CAS.
- V. S. Munagapati, H.-Y. Wen, J.-C. Wen, A. R. Gollakota, C.-M. Shu, K.-Y. A. Lin and J.-H. Wen, Int. J. Phytoremediation, 2022, 24, 131–144 CrossRef CAS PubMed.
- S. S. Ray, R. Gusain and N. Kumar, Carbon Nanomaterial-Based Adsorbents for Water Purification: Fundamentals and Applications, Elsevier, 2020 Search PubMed.
- S. Zhao, F. Zhou, L. Li, M. Cao, D. Zuo and H. Liu, Composites, Part B, 2012, 43, 1570–1578 CrossRef CAS.
- K. Althumayri, A. Guesmi, W. A. El-Fattah, A. Houas, N. B. Hamadi and A. Shahat, ACS Omega, 2023, 8, 6762–6777 CrossRef CAS PubMed.
- S. Figaro, J. P. Avril, F. Brouers, A. Ouensanga and S. Gaspard, J. Hazard. Mater., 2009, 161, 649–656 CrossRef CAS PubMed.
- Y. S. Ho and G. McKay, Process Biochem., 1999, 34, 451–465 CrossRef CAS.
- S. Y. Elovich, O. Larinov, I. Akad, N. SSSR and O. Khim, Nauk, 1962, 2, 209–216 Search PubMed.
- J. Wang and X. Guo, J. Hazard Mater., 2020, 390, 122156 CrossRef CAS PubMed.
- M. C. Holliday, D. R. Parsons and S. H. Zein, Biomass Convers. Biorefin., 2024, 14, 6671–6685 CrossRef CAS.
- I. Langmuir, J. Am. Chem. Soc., 1916, 38, 2221–2295 CrossRef CAS.
- H. Freundlich, Z. Phys. Chem., 1907, 57, 385–470 CrossRef CAS.
- R. Sips, J. Chem. Phys., 1948, 16, 490–495 CrossRef CAS.
- M. I. Temkin and Zh. Fiz, Chim., 1941, 15, 296–332 CAS.
- G. de Vargas Brião, M. A. Hashim and K. H. Chu, Sep. Sci. Technol., 2023, 58, 884–892 CrossRef.
- J. Ma, B. Zhou, H. Zhang and W. Zhang, Powder Technol., 2020, 364, 889–900 CrossRef CAS.
- J. Wang, R. Liu and X. Yin, J. Chem. Eng. Data, 2018, 63, 409–416 CrossRef CAS.
- Q. Liao, H. Rong, M. Zhao, H. Luo, Z. Chu and R. Wang, J. Hazard. Mater., 2022, 422, 126863 CrossRef CAS PubMed.
- J. He, F. Ni, A. Cui, X. Chen, S. Deng, F. Shen, C. Huang, G. Yang, C. Song and J. Zhang, Sci. Total Environ., 2020, 701, 134363 CrossRef CAS PubMed.
- M. A. Ahmed, M. A. Ahmed and A. A. Mohamed, React. Funct. Polym., 2023, 191, 105701 CrossRef CAS.
- R. Rostamian and H. Behnejad, Ecotoxicol. Environ. Saf., 2018, 147, 117–123 CrossRef CAS PubMed.
- C. P. Okoli and A. E. Ofomaja, J. Environ. Manag., 2018, 218, 139–147 CrossRef CAS PubMed.
- H. Luo, Y. Liu, H. Lu, Q. Fang and H. Rong, ACS Omega, 2021, 6, 6240–6251 CrossRef CAS PubMed.
- R. Samadder, N. Akter, A. C. Roy, M. M. Uddin, M. J. Hossen and M. S. Azam, RSC Adv., 2020, 10, 11945–11956 RSC.
- R. S. Hazra, N. Kale, G. Aland, B. Qayyumi, D. Mitra, L. Jiang, D. Bajwa, J. Khandare, P. Chaturvedi and M. Quadir, Sci. Rep., 2020, 10, 10010 CrossRef CAS PubMed.
- N. T. T. Van, A. N. Phan, V. C. Cuong, N. T. T. Van, H. G.-T. Thanh, N. Q. Khai, N. Tri, T.-T. Nguyen, X.-T. Bui and K. P. H. Huynh, Environ. Technol. Innovat., 2023, 30, 103041 CrossRef CAS.
- L. Xia, X. Li, X. Wu, L. Huang, Y. Liao, Y. Qing, Y. Wu and X. Lu, J. Mater. Chem. A, 2018, 6, 17378–17388 RSC.
- A. Yang, Z. Wang and Y. Zhu, Sci. Rep., 2021, 11, 8440 CrossRef CAS PubMed.
- R. Rehman and S. Majeed, Int. J. Phytoremediation, 2022, 24, 1004–1013 CrossRef CAS PubMed.
- M. K. Uddin, N. N. Abd Malek, A. H. Jawad and S. Sabar, Int. J. Phytoremediation, 2023, 25, 393–402 CrossRef CAS PubMed.
|
| This journal is © The Royal Society of Chemistry 2025 |
Click here to see how this site uses Cookies. View our privacy policy here. 
 Open Access Article
 This Open Access Article is licensed under a Creative Commons Attribution-Non Commercial 3.0 Unported Licence
 ab,
Hoang-Vinh-Truong Phan
ab,
Hoang-Vinh-Truong Phan