DOI:
10.1039/D5RA00569H
(Paper)
RSC Adv., 2025,
15, 7371-7382
Dimeric 1,3,5-triazinane-based derivatives as corrosion inhibitors for Q235 carbon steel in 1.0 mol per L HCl†
Received
24th January 2025
, Accepted 4th March 2025
First published on 7th March 2025
Abstract
In this work, 5,5′-(propane-1,3-diyl)bis-(1,3,5-triazinane-2-thione) (PBT) was successfully prepared by a three-component condensation method using thiourea, formaldehyde and 1,3-diaminopropane. The inhibition properties of PBT in 1.0 mol per L HCl were investigated by gravimetric measurement, electrochemical analysis, surface analysis and quantum chemical methods. The results show that the inhibition efficiency of PBT is close to 90% at 298.15 K in the concentration range of 0.005–1.0 mmol L−1, where the maximum inhibition efficiency of PBT is 92.1% at a concentration of 1.0 mmol L−1. In addition, the adsorption of PBT on the carbon steel surface is consistent with the Langmuir isothermal model. Both experimental and theoretical calculations show that PBT exhibits excellent corrosion inhibition performance in strong acidic media.
Introduction
With the rapid development of industry, metal materials may find versatile applications in various fields. For instance, carbon steel (CS) is now employed extensively as an engineering material in chemical transport pipelines, oil and gas exploitations and explorations, infrastructure constructions and diverse industries due to its high strength, favorable mechanical properties and cost-effectiveness. Nevertheless, CS is usually prone to significant corrosion and localized pitting, and even catastrophic premature fracture, when exposed to acidic surroundings, especially in strong acid media.1 In order to counteract these damages caused by corrosion, various anti-corrosive coatings, corrosion-resistant alloys and corrosion inhibitors are often used in numerous industrial productions. Among them, the application of corrosion inhibitors that can substantially reduce the rate of corrosion without altering the concentration of the corrosive medium, represents one of the most convenient, economical and pragmatic corrosion prevention approaches for inhibiting corrosion of CSs.2
So far, it has been demonstrated that organic heteroatom- and heterocycle-containing corrosion inhibitors, e.g., Schiff bases,3 quaternary ammonium salts,4 benzothiazole derivatives,5 etc., possess exceptional corrosion inhibition performance. These efficacious inhibitors are characterized by the presence of heteroatoms, including N, O, P and S, which bear lone-pair electrons, facilitating their adsorption onto metal surfaces. Especially, N-containing heterocyclic corrosion inhibitors tend to form protective adsorbent films on metal surfaces, acting as barriers to corrosive substances, resulting in superior corrosion inhibition properties when compared to alternative corrosion inhibitors.6 More recently, triazine derivatives, as a type of N-containing compound, have been identified as potentially effective corrosion inhibitors.7 The efficacy is attributed to the presence of three N atoms within the triazine ring, which can serve as electron-donating sites and thus provide multiple adsorption centers, thereby facilitating the adsorption of triazine derivatives onto the surfaces of metal substrates. Unfortunately, natural triazines, e.g., 1,2,3-triazine, 1,2,4-triazine, and 1,3,5-triazine, almost exhibit a negligible effect on their anticorrosion properties. Consequently, it is often necessary to chemically modify the C or N atoms on the triazine rings to improve their efficacy as corrosion inhibitors. For instance, the incorporation of alkyl chains of varying lengths, along with electron-donating substituents, or the introduction of additional heteroatoms, heterocycles, and benzene rings, can enhance the inhibition efficiency (IE).8 In principle, these chemical modifications can promote the transfer of excess electrons from the inhibitor molecules to the unoccupied 3d orbitals of iron, facilitating the formation of the robust chemical interactions and dense protective films on the metal surface.9 The IEs of three co-substituted 1,3,5-triazine derivatives, each possessing distinct terminal side chains on the triazine ring and synthesized via a one-step ultrasound method, were found to be 90.6%, 84.0%, and 93.2% at their concentrations of 800 mg L−1, respectively, when exposed to 15% HCl solution. These findings suggest that the presence of electron-donating groups in the terminal substituents significantly contributes to the higher IE values.10 Furthermore, the optimal IE for the triazine derivatives with varying aliphatic chain lengths was determined to be 98.3% at a concentration of 500 ppm in 1.0 mol per L HCl, indicating that the increase in their IEs is correlated with the length of the aliphatic chain.11 However, the synthesis of traditional organic heterocyclic corrosion inhibitors is not only complicated, but also often accompanied with the occurrence of side reactions, resulting in low yields and relatively high toxicity, thus limiting their long-term and large-scale applications. Consequently, the development of corrosion inhibitors that can fulfill the dual criteria of high efficiency and environmental sustainability represents a prevailing research trend.
Recently, a great advancement in the development of a novel inhibitor based on 1,3,5-triazinane derivatives was impressive, which is characterized by a saturated six-membered cyclic hydrocarbon (cyclohexane), where three carbon atoms are alternately substituted by three nitrogen atoms. Especially, 1,3,5-triazinane-based inhibitors are facilely synthesized by a one-step three component condensation process of thiourea, formaldehyde and a primary amine.12 On the other hand, with a view to further promoting the IE, numerous efforts have been devoted to the asymmetric/symmetric oligomerization of inhibitors up to date, since dimeric or trimeric inhibitors that possess more tunable variables in molecular structures can adsorb onto the metal surface in different modes.13 In our previous work, a dimeric imidazolium-based ionic liquid connected by a bipyridiyl group showed a superior corrosion inhibition performance with the maximum IE over 95% at 5.0 × 10⁻⁴ mol L−1.14 More recently, several 1,3,5-triazinane-based inhibitors were found to hold a promising potential in anticorrosion applications, either in the CO2-saturated oilfield simulated water with the optimal IE over 97% (ref. 15 and 16) or in the strong acid medium, yielding the highest IE of about 95%.17 Nevertheless, to the best of our knowledge, whether the dimerization of the 1,3,5-triazinane-based inhibitor can implement the expected anticorrosion inhibition behavior has not been reported to date. Therefore, in this study, a dimeric 1,3,5-triazinane-based inhibitor was designed, where two triazinane rings were chemically linked by an oligomeric methylene spacer, based on the hypothesis that the bigger molecules may occupy the more metal surface, thus yielding the high IE even at lower concentrations.
In the present work, the primary aim was twofold: (i) to testify the viability of using the dimeric-1,3,5-triazinane-based derivative as inhibitor in strong acidic environments, (ii) to ascertain the extent to which the dimeric 1,3,5-triazinane-based derivative exerts an influence on the anticorrosion performances. With these purposes in mind, a novel dimeric-1,3,5-triazinane-based derivative, i.e., 5,5′-(propane-1,3-diyl)bis-(1,3,5-triazinane-2-thione) (PBT), was synthesized using a previously established one-step procedure according to the three-component condensation of formaldehyde, thiourea and 1,3-diaminopropane,18 as given in Scheme 1. Here, two 1,3,5-triazinane-2-thiones were interconnected at the 5th position via introducing three methylene units as spacer. The anticorrosion performances of PBT in 1.0 mol per L HCl was then examined via gravimetric measurement, electrochemical analysis and computational chemistry as well.
 |
| | Scheme 1 The synthesis route of PBT. | |
Materials and methods
Synthesis of dimeric-1,3,5-triazinane-based derivative
The reagents used for the synthesis of PBT in this experiment included anhydrous ethanol, 1,3-diaminopropane, 37% aqueous formaldehyde solution and thiourea. All the chemical reagents that were of analytical grade (purity exceeds 99%), were purchased from two suppliers (Titan Technology Co., Ltd and Sinopharm Chemical Reagent Co., Ltd) and used as received.
Herein, PBT was synthesized according to the protocol reported previously with slight modification.18 In brief, 0.969 g (11 mmol) of 1,3-diaminopropane was dissolved in 15 mL of 96% ethanol, which was charged into a three-neck round-bottom flask equipped with a reflux condenser, a constant pressure drip funnel and a magnetic stirrer. Then, a mixture of 1.67 g (22 mmol) of thiourea, 3.56 g (44 mmol) of 37% formaldehyde solution, and 15 mL of H2O was added dropwise into such the 1,3-diaminopropane ethanol solution. The mixture was refluxed for 2 h, and then allowed to stand for 24 h at ambient temperature. The precipitate was obtained using ice ethanol, and then successively filtered off, washed with cold (5 °C) 96% ethanol and dried under reduced pressure. Yield 75% (2.38 g).
1H nuclear magnetic resonance (NMR) and Fourier transform infrared (FT-IR) spectroscopies were conducted to further characterize the chemical structure of PBT (more details see Fig. S1 and S2†). 1H NMR spectrum (400 MHz, DMSO), δ (ppm): 8.09 (d, J = 60.9 Hz, 4H), 3.99 (s, 8H), 2.55 (t, J = 7.0 Hz, 4H), 1.65–1.52 (m, 2H); FT-IR spectrum (KBr), ν (cm−1): 3208 (NH), 2931, 2861 (–CH2, alkyl), 1552 (–NH–), 1371 (C–N), 1300 (C![[double bond, length as m-dash]](https://www.rsc.org/images/entities/char_e001.gif) S).
S).
Material and test solution
The Q235 CSs utilized in this experiment were purchased from Yangzhou Keli in China, with their composition summarized in Table 1. The rectangular Q235 CS coupons with two dimensions, i.e., 40 mm × 13 mm × 2 mm and 5 mm × 1 mm × 1 mm (length × width × thickness), were mechanically fabricated. The former was employed to conduct the gravimetric measurement, while the latter was used to examine the surface morphology and the change in the surface composition of metal as well. Electrochemical evaluation was conducted via utilizing a custom-designed side-opening Q235 CS electrode, which possessed an exposed area of 1.0 cm2. In this study, 1.0 mol L−1 hydrochloric acid solution was utilized as the aggressive medium, which was acquired by diluting 37% concentrated hydrochloric acid with ultrapure water obtained from a Millipore Milli-Q filtration system. The concentrations of PBT were systematically varied from 0.005 to 1.0 mmol L−1.
Table 1 The composition of Q235 carbon steel
| Elements |
C |
Mg |
Si |
Cr |
Mn |
Fe |
| Content (wt%) |
0.34 |
0.26 |
0.38 |
0.42 |
1.01 |
Balance |
Gravimetric measurement
Gravimetric measurement generally serves as an intuitive and dependable experimental approach to the evaluation of anticorrosion properties. Prior to conducting gravimetric measurement, a systematic polishing process was carried out via successively utilizing 400, 800, and 1000 grit sandpaper to eliminate surface contaminants of Q235 CS coupons. Subsequently, all Q235 CS coupons were thoroughly cleaned with ultrapure water, degreased using ethanol and acetone, and finally dried with cold air. After being weighed precisely, three Q235 CS coupons were submerged into 1.0 mol per L hydrochloric acid solution with a volume of 1000 mL, either without PBT (uninhibited) or with PBT (inhibited) at varying concentrations, in a wide mouth bottle. In this work, the experimental temperatures were meticulously controlled at 288.15, 298.15, 308.15, and 318.15 K utilizing a thermostatic water bath. After an immersion period of 24 h, Q235 CS coupons were withdrawn from aggressive medium, thoroughly rinsed with ultrapure water, and then carefully polished with 400, 800, and 1000 grit sandpaper to eliminate the corrosion products that had accumulated on the surface. After that, these Q235 CS coupons were thoroughly washed with ultrapure water again, degreased alternately using ethanol and acetone, dried with cold air, and finally reweighed. Here, triplicate independent measurements were carried out for each sample, average values and standard deviations as well were reported from these independent measurements of the same sample.
Electrochemical tests
The corrosion inhibition performance of PBT was tested using a traditional three-electrode system with the Ag/AgCl electrode as the reference electrode, the Pt electrode as the counter electrode and the custom-designed Q235 CS electrode with an exposure area of 1 cm2 as the working electrode, on a CHI760E electrochemical workstation (China). The pre-treatment method before the experiment was similar to that used in the gravimetric test. Prior to the experiment, a stable open circuit potential (OCP) was acquired via immersing all electrodes into the test solution of 200 mL for 2400 s, contained in a water-jacketed glass cell. Electrochemical impedance spectroscopy (EIS) was conducted over a frequency range of 10 mHz to 100 kHz, utilizing an amplitude of 10 mV s−1. Potentiodynamic polarization (PDP) curves were obtained in a potential variation range of ±250 mV relative to the open circuit potential (EOCP) at a scanning rate of 1.0 mV s−1. All electrochemical experiments were carried out at a controlled temperature of 298.15 K, maintained by a refrigerated/heating circulator. To ensure the reliability of the results, each experiment was performed independently and repeated at least three times for each sample. Average values and standard deviations were determined from these independent measurements of the same sample.
Surface analyses
Q235 CSs were subjected to the immersion in a solution, either with or without 1.0 mmol per L PBT, at a temperature of 298.15 K for 24 h. The pretreatment and cleaning procedure employed was the same as the previously established method. The surface morphology and elemental composition of Q235 CS coupons were examined using scanning electron microscopy (SEM) and energy-dispersive X-ray spectroscopy (EDS), respectively. Moreover, the surface chemistry of the Q235 CS samples was investigated on the Escalab 250Xi X-ray photoelectron spectroscopy (XPS) system (Thermo Scientific, USA) under the monochromatic AlKα radiation. The C 1s binding energy of 248.8 eV served as an internal reference for calibrating the effects of positive charge displacement, and the resulting data were analyzed using Avantage software.
Density functional theory (DFT) calculation
All computational procedures were conducted using Gaussian 09 software. In this work, the geometrical optimization of PBT molecules was performed without any constraints, utilizing the Becke three-parameter hybrid functional in conjunction with the Lee–Yang–Parr correlation functional (B3LYP) and the 6-31G(d,p) basis set. Additionally, frequency analysis was conducted to confirm that all molecules attained their respective ground states.14 The relevant quantum chemical parameters were subsequently derived, including the energy of the highest occupied molecular orbital (HOMO), the energy of the lowest unoccupied molecular orbital (LUMO), the ionization potential (I), the electron affinity (A), the overall hardness (γ), and the electron transfer fraction (ΔN).19 The same method was also used to obtain the electrostatic potential (ESP) of PBT molecules.
Results and discussion
Gravimetric measurements
The IE and the corrosion rate (CR) of PBT were generally obtained from gravimetric measurements, by calculating the difference in the mass of Q235 CS coupon before and after corrosion (eqn (1)). Herein, the CR (v), surface coverage (θ) and IE (η) were calculated according to eqn (2)–(4), respectively, as follows:20| |
 | (2) |
| |
 | (3) |
| |
 | (4) |
where Δw (mg) indicates the change in mass of Q235 CS coupons before and after corrosion, w′ (mg) and w (mg) represent the mass of Q235 CS coupon prior to and the following corrosion, respectively; s (cm2) and t (h) refer to the surface area of Q235 CS specimen that is in contact with the corrosion solution and the duration of immersion, respectively; v (mg cm−2 h−1) and v′ (mg cm−2 h−1) denote CRs in the uninhibited and the inhibited solution with varying concentrations of PBT, respectively; η signifies the IE value derived from gravimetric measurements. It should be noted that all relative standard deviations, derived from average mass losses, are within 2.5%, because all Q235 CS coupons utilized in this work are nearly identical in size, shape and weight.
Effect of inhibitors concentration
Fig. 1 illustrates the variation in CR (v) and IE (η) values of PBT with concentration at different temperatures. As is evident, v values exhibit a sharp decrease at the low concentrations of PBT, while the decrease in v values is not significant when the concentration exceeds 0.05 mmol L−1. Conversely, η values increase rapidly at lower concentrations and then rise slightly after 0.05 mmol L−1. As the PBT concentration approaches up to 1.0 mmol L−1, the η value reaches the maximum, i.e., 90.5%. The principal data based on gravimetric measurements is summarized in Table 2. Results show that PBT can produce a strong adsorption on the Q235 CS surface; moreover, the higher the concentration, the more the PBT molecule adsorbed on the Q235 CS surface and the tighter the protective film formed, thereby avoiding the attack of the corrosive medium in the solution and exerting the effect of corrosion protection.21 Notably, the η value exhibits a minimal increase as the concentration of PBT surpasses 0.25 mmol L−1, suggesting that the adsorption of PBT onto the surface of Q235 CS essentially reaches saturation.
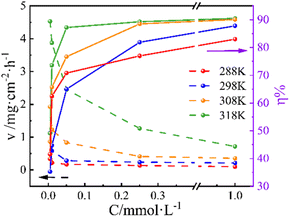 |
| | Fig. 1 Variation of corrosion rate (v) and inhibition efficiency (η) with concentrations of PBT in 1.0 mol per L HCl at different temperatures. Noted that means and standard deviations were obtained from triplicate samples at least, where error bars that lie within the data points themselves are not visible. | |
Table 2 The effect of concentration and temperature on the anticorrosion behavior of PBT for Q235 CS in 1.0 mol per L HCl
| T/K |
Cinh/mmol L−1 |
v/mg cm−2 h−1 |
η/% |
| 288.15 K |
Blank |
0.5834 ± 0.0068 |
|
| 0.005 |
0.3407 ± 0.0042 |
41.6% |
| 0.01 |
0.2187 ± 0.0048 |
62.5% |
| 0.05 |
0.1703 ± 0.0024 |
70.8% |
| 0.25 |
0.1340 ± 0.0034 |
77.0% |
| 1.0 |
0.0991 ± 0.0044 |
83.0% |
| 298.15 K |
Blank |
2.2074 ± 0.0164 |
|
| 0.005 |
1.1227 ± 0.0052 |
49.1% |
| 0.01 |
0.5832 ± 0.0086 |
73.6% |
| 0.05 |
0.2833 ± 0.0058 |
87.2% |
| 0.25 |
0.2370 ± 0.0110 |
89.3% |
| 1.0 |
0.2106 ± 0.0050 |
90.5% |
| 308.15 K |
Blank |
3.5767 ± 0.0055 |
|
| 0.005 |
1.9278 ± 0.0109 |
46.1% |
| 0.01 |
1.2272 ± 0.0133 |
65.7% |
| 0.05 |
0.8325 ± 0.0091 |
76.7% |
| 0.25 |
0.4121 ± 0.0079 |
88.5% |
| 1.0 |
0.3531 ± 0.0061 |
90.1% |
| 318.15 K |
Blank |
7.0016 ± 0.0028 |
|
| 0.005 |
4.5279 ± 0.0120 |
35.3% |
| 0.01 |
3.8737 ± 0.0093 |
44.7% |
| 0.05 |
2.4511 ± 0.0043 |
65.0% |
| 0.25 |
1.2649 ± 0.0102 |
81.9% |
| 1.0 |
0.7146 ± 0.0032 |
89.8% |
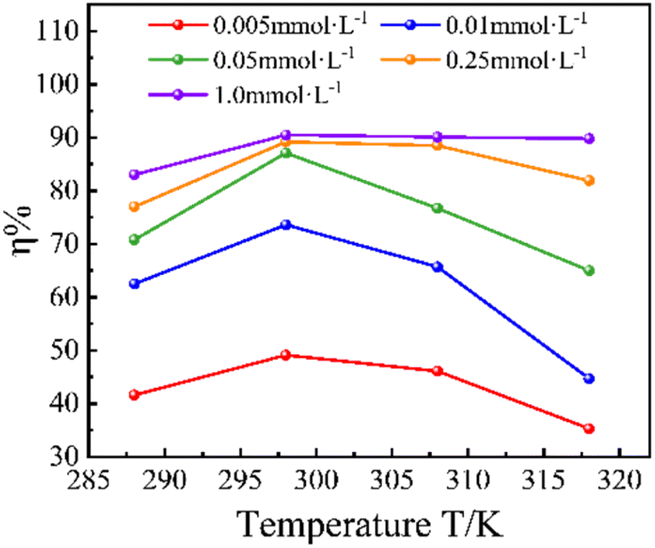
Effect of temperature
In general, temperature has a significant effect on the corrosion process of CS in acidic solutions.22 Fig. 2 shows that the variation in η values of Q235 CSs with temperature in 1.0 mol per L HCl solution for PBT at different concentrations. Overall, PBT exhibits a similar variation trend in η values with temperature over the entire concentration range, i.e., initial increase and subsequent decrease. For instance, the η value increases from 83.0% (288.15 K) to 90.5% (298.15 K) at 1.0 mmol L−1; above 298.15 K, the η value decreased slightly and finally dropped down to 89.8% at 318.15 K. The initial increase in the value of η can be attributed to the fact that the elevated temperature accelerates the interaction between PBT molecules and CS surfaces and improves the chemical reaction activity, which allows more PBT molecules to adsorb onto Q235 CS surfaces, thereby mitigating the effect of corrosive media. However, within the temperature range of 298.15 to 313.15 K, there is a gradual decline in the value of η. This trend suggests that higher temperatures are detrimental to the adsorption of PBT molecules, indicating that as temperature rises, the desorption of PBT molecules from the surface of Q235 CS becomes more significant and such desorption is unfavorable for the fabrication of a protective layer.23 In other words, the adsorption of PBT on Q235 CS surfaces is characterized by the chemical adsorption.
 |
| | Fig. 2 Variation of η of PBT at different concentrations with temperature in 1.0 mol per L HCl solution. | |
Electrochemical tests
Potentiodynamic polarization (PDP). Fig. 3 shows PDP curves for Q235 CS in 1.0 mol per L HCl solution and solutions containing varying concentrations of PBT. The principal electrochemical parameters, associated with PDP results, encompassing corrosion current density (Icorr), corrosion potential (Ecorr) and Tafel slopes of anodic (βa) and cathodic (βc) branches and corresponding IE (η) values, were determined by means of extrapolating the linear portions of anodic and cathodic Tafel curves, are compiled in Table 3. The η value of PBT, derived from PDP results, was calculated using eqn (5).24| |
 | (5) |
where Icorr and Iinh represent the corrosion current densities without inhibitors and with inhibitors, respectively.
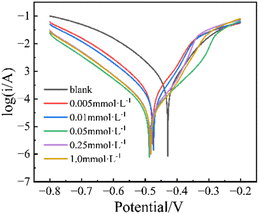 |
| | Fig. 3 PDP curves for Q235 CS in 1.0 mol per L HCl without and with different concentrations of PBT at 298.15 K. | |
Table 3 Electrochemical parameters of Q235 CS from PDP curves in 1.0 mol per L HCl without and with different concentrations of PBT at 298.15 K
| Inhibitor |
C/mmol L−1 |
Ecorr/mV |
Icorr/μA cm−2 |
βa/mV dec−1 |
βc/mV dec−1 |
η |
| PBT |
Blank |
−434.7 ± 0.0 |
387.9 ± 4.2 |
76.4 ± 2.2 |
−108.7 ± 3.7 |
|
| 0.005 |
−476.3 ± 1.2 |
144.3 ± 11.5 |
55.0 ± 2.0 |
−103.8 ± 0.3 |
62.8% |
| 0.01 |
−477.7 ± 4.7 |
80.6 ± 7.5 |
48.4 ± 1.2 |
−105.9 ± 2.7 |
79.2% |
| 0.05 |
−483.3 ± 4.0 |
47.3 ± 3.0 |
75.6 ± 21.7 |
−108.6 ± 2.4 |
87.8% |
| 0.25 |
−481.3 ± 3.1 |
39.7 ± 1.8 |
54.6 ± 11.0 |
−106.5 ± 0.5 |
89.8% |
| 1.0 |
−480.3 ± 2.9 |
33.5 ± 0.8 |
61.7 ± 17.7 |
−106.9 ± 3.5 |
91.4% |
Obviously, after adding PBT, the shapes of the cathodic and anodic curves remain nearly unvaried, but the overall trend shifts towards the lower current density, as shown in Fig. 3. Specifically, as the concentration of PBT rises from 0.005 to 1.0 mmol L−1, the Icorr value drops from 387.9 μA cm−2 (blank) to 144.3 (0.005 mmol L−1) and 33.5 (1.0 mmol L−1) μA cm−2, and the η value reaches the maximum (ηmax) of 91.4%, which indicates that the addition of PBT has an excellent corrosion inhibition effect. Furthermore, the addition of PBT results in a slight negative shift in Ecorr. Typically, when −85 mV < ΔEcorr < +85 mV, where ΔEcorr = Einh − Euninh (Einh and Euninh represent the corrosion potential in inhibited and uninhibited solution, respectively), the inhibitor is categorized as a mixed-type inhibitor; if ΔEcorr > +85 mV or ΔEcorr < −85 mV, the inhibitor is classified as an anodic or cathodic inhibitor.25 Table 3 shows that Einh undergoes a slightly irregular negative shift as concentrations increase, with a maximum value of ΔEcorr of 48.6 mV, suggesting that PBT virtually act as a mixed-type inhibitor, which can slow down the reaction rate of both anodic iron-dissolving and cathodic hydrogen-evolving procedures.
Electrochemical impedance spectroscopy (EIS) tests. EIS measurements can offer the exact surface behavior and kinetic information of electrochemical processes without destroying the adsorbed layer, so that they allow ones to understand the corrosion mechanism in depth, occurring at the electrode/solution interface. Nyquist plot (a) and Bode phase angle plot (b) of Q235 CS in HCl without and with different of PBT are given in Fig. 4. Besides, all OCPs were examined via immersing the uninhibited and inhibited solutions for 2400 s, prior to commencing all impedance tests (more details see Fig. S3†).
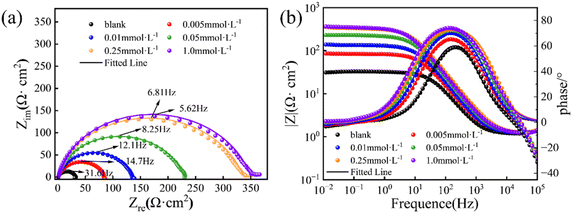 |
| | Fig. 4 Nyquist (a) and Bode-phase angle plots (b) for Q235 CS in 1.0 mol per L HCl containing different concentrations of PBT at 298.15 K. | |
As a whole, Fig. 4 shows that the impedance response of the electrode changes significantly at different PBT concentrations in test solution. Four main features are observed from Fig. 4. Firstly, all impedance curves show a single imperfect semicircular loop, which originates principally from the dispersion effect of the heterogeneous surface (Fig. 4a). However, the addition of PBT does not change the shape of semicircles, which indicates that it does not vary the corrosion mechanism.26 Secondly, the diameter of such semicircles continually increases with the PBT concentration (Fig. 4a), implying that the higher concentration of PBT can form the more compact protective layer and thus improve its IEs. Thirdly, PBT possesses the absolute impedance moduli that gradually increase with the concentrations, and moreover, are always much greater than ones in uninhibited solution in the low frequency region, as shown in Bode plot (Fig. 4b). Such the elevated impedance moduli signify that the enhanced PBT concentration allows the denser adsorption film to bear the higher inhibitive efficacy, thus effectively protecting Q235 CS surfaces from contacting with aggressive ions. Fourthly, the addition of PBT results in a remarkable alteration in the maximum phase angle, which varies from ca. 60 (uninhibited solution) to nearly 75° (1.0 mmol per L PBT) in the mid-frequency region, as shown in Fig. 4b. Similarly, the phase angle value is also a measure of the anticorrosion performance of inhibitors. In general, the more negative the phase angle, the more capacitive the electrochemical performance. In this work, the augmented capacitive response is a likely result of PBT that can effectively adsorb onto Q235 CS surfaces. Therefore, the increased semicircular diameter, impedance modulus and maximum phase angle, together with the depressed semicircular loop, illustrate that PBT can facilely form a tightly protective film on Q235 CS surfaces, which hold a promising potential to protect CS surfaces against attacking of aggressive ions.
Typically, the simplest equivalent circuit model, given in Fig. 5a, can be employed to well fit the impedance data that only possesses one capacitive loop, equivalent to one time constant. Unfortunately, in this work, only the impedance data in uninhibited solution can be fitted well using this simplest circuit, while all impedance results in inhibited solutions of PBT, regardless of its concentrations, can't be. However, carefully inspecting all impedance results in inhibited solutions manifests that they are characterized by an extended capacitive loop, which essentially consisted of two proximate capacitive loops, namely that two peaks nearly overlap, which is firmly confirmed by the fact that the broadened phase angle peaks emerge after adding PBT, as given in Fig. 4b. This indicates the existence of two time constants in the system.27,28 Generally, the semicircle in the high-frequency region can be attributed to the relaxation of the double-layer capacitance, which is connected in parallel with a charge-transfer resistance, while the other semicircle in the low-frequency region can be ascribed to the relaxation process generated by adsorbed substances and other corrosion products accumulated on the electrode surface, or to the re-dissolution of the passivated surface.29,30 Therefore, in this work, a very complicated equivalent circuit model, having two time constants, was adopted to fit all impedance results in inhibited solutions, as shown in Fig. 5b.
 |
| | Fig. 5 Equivalent circuits fitted to impedance spectra in the 1.0 mol per L HCl in the absence (a) and the presence (b) of PBT. | |
In this work, two key points should be noted. On one hand, the dispersion effect, stemmed from the heterogeneity of rough electrode surfaces, always results in a definite deviation between the practical double layer capacitance and the ideal capacitance. Consequently, a constant phase element (CPE) is usually used in equivalent circuits, instead of the double-layer capacitance, in order to compensate for this heterogeneity.31 On the other hand, the difference in the real impedance values between the high frequency and the low frequency commonly refers to the polarization resistance (Rp), which mainly consists of the charge transfer resistance (Rct), film resistance (Rf), diffuse layer resistance (Rd) and accumulation resistance (Ra).32 Accordingly, the Rp value in Fig. 5a is deemed to be the sum of Rct, Rd and Ra (Rp = Rct + Rd + Ra), whereas it in Fig. 5b is considered as the contribution of all resistances, i.e., Rp = Rct + Rf + Rd + Ra. In this work, the principal fitted parameters are listed in Table 4. All χ2 values obtained is of the order of magnitude of 10−3, indicating a good fit. The corresponding IE value, η, can be calculated from the Rp value, according to eqn (6).33
| |
 | (6) |
where
Rp and
R0p represent the polarization resistance at the CS/solution interface with and without adding PBT, respectively.
Table 4 EIS parameters for Q235 CS in 1.0 mol per L HCl without and with different concentrations of PBT at 298.15 K
| Inhibitor |
C/mmol L−1 |
RS/Ω cm2 |
CPEf |
Rf |
CPEdl |
Rct |
RP |
η |
| Y0/μΩ Sn·cm2 |
n1 |
Y0/μΩ Sn·cm2 |
n2 |
| PBT |
Blank |
1.200 ± 0.10 |
|
|
|
238.1 ± 7.20 |
0.9075 ± 0.01 |
27.50 ± 0.63 |
27.50 ± 0.63 |
|
| 0.005 |
1.383 ± 0.05 |
70.75 ± 2.42 |
1 |
7.455 ± 0.91 |
233.7 ± 26.4 |
0.7442 ± 0.03 |
70.41 ± 5.61 |
77.87 ± 4.71 |
64.7% |
| 0.01 |
1.361 ± 0.03 |
60.75 ± 2.48 |
1 |
8.321 ± 0.32 |
191.6 ± 44.8 |
0.7371 ± 0.02 |
116.9 ± 8.29 |
125.3 ± 7.97 |
78.1% |
| 0.05 |
1.351 ± 0.02 |
44.79 ± 1.39 |
1 |
7.552 ± 3.75 |
136.8 ± 4.2 |
0.7275 ± 0.02 |
218.9 ± 6.15 |
226.4 ± 5.18 |
87.9% |
| 0.25 |
1.349 ± 0.01 |
34.70 ± 2.54 |
1 |
13.77 ± 6.46 |
133.2 ± 30.1 |
0.7250 ± 0.03 |
314.5 ± 20.34 |
328.3 ± 14.3 |
91.6% |
| 1.0 |
1.294 ± 0.01 |
30.94 ± 2.77 |
1 |
9.431 ± 3.27 |
121.5 ± 26.4 |
0.7141 ± 0.08 |
338.3 ± 5.18 |
347.7 ± 1.96 |
92.1% |
As is evident, the Rp values increase with the PBT concentration, while the CPEdl values give an opposite trend, i.e., a gradual decrease from 238.1 (uninhibited solution) to 121.5 μΩ Sn·cm2 (1.0 mmol per L PBT). Such the reduced CPEdl values reveal a gradual decrease in the local dielectric constant, which is mainly due to the substitution of pre-adsorbed water molecules by PBT molecules on Q235 CS surfaces. In particular, the η value increases from 64.7% (0.005 mmol L−1) to 92.1% (1.0 mmol L−1) as PBT is added, which indicates that PBT can form a compact protective film and effectively insulate the corrosive ions. In short, PDP, EIS and gravimetric results that exhibit a good consistency in anticorrosion performances, all demonstrate that PBT possesses the excellent inhibition action in acidic surroundings.
Adsorption isotherms. The adsorption isotherm helps to understand the adsorption behavior of PBT molecules on the Q235 CS surface. In general, the IE of a given inhibitor is closely related to its adsorption capacity on the metal surface. Herein, the isothermal adsorption behavior of PBT is evaluated on the basis of the η value from the gravimetric measurements, which is considered to be equal to surface coverage (θ), θ = η. In this work, many models, including Frumkin, Freundlich, Temkin, Bockris–Swinkels and Flory–Huggins as well, were utilized to fit the adsorption results of PBT, proving unsatisfied. In contrast to these models, the Langmuir model exhibits a good fit, evidenced by the linear relationship of C/θ against C (here, C is the concentration of PBT) with the correlation coefficients (R2) over 0.999, given in Fig. 6. In the Langmuir model, the relationship between θ and C can be expressed using eqn (7):18| |
 | (7) |
where Kads is the equilibrium constant during the adsorption process.
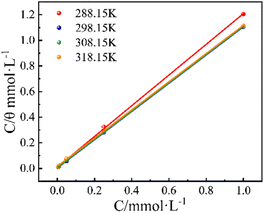 |
| | Fig. 6 Adsorption isotherms of PBT in 1.0 mol per L HCl at 298.15 K. | |
As is apparent, these linear dependences together with high R2 values indicate that the adsorption of PBT conforms to the Langmuir model at any temperature. Nevertheless, the slopes of straight lines are 1.1975 (288.15 K), 1.1022 (298.15 K), 1.1032 (308.15 K), and 1.0999 (318.15 K), respectively, which slightly deviate from unity, which could be attributed to the existence of intermolecular weak interactions among adjoining PBT molecules adsorbed.34 The Kads values can be ascertained by the aid of the reciprocal of the intercepts from the straight line of C/θ against C. All Kads values obtained are listed in Table 5. In this work, the change in Gibbs free energy, ΔGads (here, the subscript “ads” denotes adsorption), associated with the adsorption process, can be readily determined using eqn (8).35
| |
ΔGads = −RT![[thin space (1/6-em)]](https://www.rsc.org/images/entities/char_2009.gif) ln(55.5 × Kads) ln(55.5 × Kads)
| (8) |
where
R (8.314 J mol
−1 K
−1) and
T (K) represent the universal gas constant and the absolute temperature, respectively;
Table 5 Thermodynamic adsorption parameters of PBT on the surface of Q235 CS
| T/K |
R2 |
Slope |
Kads/103 L mol−1 |
Gads/kJ mol−1 |
| 288.15 K |
0.99962 |
1.1975 |
94.25 |
−37.04 |
| 298.15 K |
0.99999 |
1.1022 |
288.2 |
−41.10 |
| 308.15 K |
0.99997 |
1.1032 |
153.4 |
−40.86 |
| 318.15 K |
0.99953 |
1.0999 |
58.2 |
−39.63 |
The value of 55.5 (mol L−1) corresponds to the molarity of water in solution.36 The critical thermodynamic parameters derived from the adsorption isotherms are summarized in Table 5. A higher Kads value suggests that PBT molecules exhibit a greater tendency to adsorb onto surfaces. At 298.15 K, PBT gives the highest Kads value, 288.2 × 10³ L mol−1, among four temperatures. This indicates that PBT has the strongest adsorption capacity at 298.15 K, which is consistent with gravimetric measurements; that is, the maximum IE appears at this temperature.
In general, the magnitude of ΔGads provides a measure to differentiate between physical and chemical adsorption:37 (i) physical adsorption occurs, in the case of |ΔGads| < 20 kJ mol−1 for; (ii) chemical adsorption, |ΔGads| > 40 kJ mol−1; (iii) the mixed physical/chemical adsorption, 20 kJ mol−1 < |ΔGads| < 40 kJ mol−1. Herein, all ΔGads values approximately maintain in the proximity of −40.0 kJ mol−1 within the temperature range of 288.15 to 318.15 K, suggesting that the adsorption of PBT onto the surface of Q235 CS is primarily governed by chemisorption. Moreover, all ΔGads < 0, which proves that the adsorption of PBT is a spontaneously thermodynamic process.
Surface analyses
Surface characterizations via SEM/EDS. SEM can intuitively determine the morphological changes of Q235 CS before and after corrosion. Fig. 7 shows the surface morphologies of Q235 CS before and after corrosion in the 1.0 mol per L HCl without or with 1.0 mmol per L PBT for 24 h at 298.15 K. Evidently, the surface of Q235 CS coupon immersed in 1.0 mol per L−1 HCl without PBT (Fig. 7b) is much rougher than that of the freshly polished surface of Q235 CS (Fig. 7a). Before corrosion, the clear scratch marks are observed, while a layer of corrosion products exists on the surface after 24 h corrosion. However, the addition of PBT results in a significant reduction in the surface roughness, where the quantity of corrosion products dramatically decreases and only the faint scratch marks can be found, as illustrated in Fig. 7c. In this work, the freshly polished Q235 CS coupon gives the Fe content of 95.83 wt% (Fig. 7d), whereas the Fe content markedly decreases down to 79.31 wt% after 24 h corrosion in HCl solution (Fig. 7e). In contrast, the O content increase significantly from 0.25 wt% (freshly) to 16.52 wt% (in HCl solution). The variation in morphologies and elements of Fe and O indicates that 24 h immersion in uninhibited solution leads to the occurrence of redox reactions and thus the formation of a large number of oxidation products.38 More strikingly, the addition of PBT allows both Fe and O elements to restore to their initial contents to some extent. In Fig. 7f, the Fe and O content returns back to 90.01 (Fe) and 5.04 (O) wt%, respectively. Moreover, the appearance of the signal peaks of N and S elements (Fig. 7f) substantiate the adsorption of PBT on the surface of Q235 CS.39 Therefore, SEM and EDS results both prove that PBT can form a stable protective film on Q235 CS surfaces and play an excellent role in corrosion inhibition.40
 |
| | Fig. 7 SEM images (top) and EDS results (bottom) for Q235 CSs immersed in 1.0 mol per L HCl without and with 1.0 mmol per L PBT for 24 h at 298.15 K: (a) and (d) freshly polished CS coupon; (b) and (e) CS coupon immersed in 1.0 mol per L HCl; (c) and (f) CS coupon immersed in 1.0 mol per L HCl with 1.0 mmol per L PBT. | |
XPS characterizations. XPS can help to further analyze the composition of adsorbed films on the surface of Q235 CS. In this work, Q235 CS was immersed in an inhibition solution containing 1.0 mmol per L PBT for 24 h and then analyzed by XPS, as shown in Fig. 8. The XPS full-scan spectrum displays the characteristic signal peaks of five elements, i.e., Fe 2p, C 1s, O 1s, N 1s and S 2p (Fig. 8a), which is attributed to the formation of adsorption film of PBT on Q235 CS surfaces. The Fe 2p3/2 spectrum (Fig. 8b) exhibits three peaks at 711.4, 713.6 and 719.1 eV, which correspond refer to singlet Fe, Fe oxide (Fe2O3/Fe3O4) and Fe3+ (FeCl3/FeOOH),41,42 respectively. This suggests that a layer of oxides, e.g., Fe2O3 and Fe3O4, forms on Q235 CS surface. Moreover, such the oxide layer can impede the diffusion of certain ions or species over the CS/solution interface and in turn mitigate the corrosion, as its thickness increases. Three typical peaks, appeared in the C 1s spectrum (Fig. 8c), can be ascribed to the presence of C–C and CC bonds (at 284.8 eV), C–N and C–S bonds (286.5 eV) and CS bonds (288.6 eV).43 Two characteristic peaks at 530.2 and 531.9 eV in the O 1s spectrum (Fig. 8d) can be attributed to O2− (Fe2O3/Fe3O4) and OH− (FeOOH), respectively.44 In the N 1s spectrum (Fig. 8e), two characteristic peaks at 400.2 and 402.1 eV are associated with C–N and Fe–N bonds, respectively.43 The S 2p spectrum (Fig. 8f) has two peaks at 162.8 and 169.2 eV, which correspond to the formation of CS (162.8 eV) and Fe–S (169.2 eV) bonds.45 In this work, the appearance of Fe–N and Fe–S bonds suggests that the chemisorption takes place on CS surfaces; that is, coordinate bonds are formed between PBT molecules and Fe atoms indeed, consistent with isothermal adsorption analyses and gravimetric tests.
 |
| | Fig. 8 XPS survey spectra (a); high-resolution spectra of (b) Fe 2p; (c) C 1s; (d) O 1s; (e) N 1s and (f) S 2p on Q235 in 1.0 mol per L HCl in the presence of 1.0 mmol per L PBT for 24 h at 298.15 K. | |
Density functional theory (DFT) calculation. In this work, the molecular structure of PBT was optimized by DFT calculation to obtain its highest occupied molecular orbital (HOMO) and lowest unoccupied molecular orbital (LUMO), as shown in Fig. 9. The relevant quantum chemical parameters are listed in Table 6.
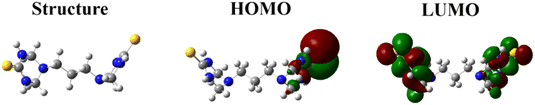 |
| | Fig. 9 Optimized structures, HOMO and LUMO of PBT. | |
Table 6 The results of the quantum chemical calculation for PBT
| Inhibitor |
EHOMO/eV |
ELUMO/eV |
ΔE /eV |
I/eV |
A/eV |
γ/eV |
χ/eV |
ΔN |
| PBT |
−5.4985 |
0.0201 |
5.5186 |
5.4985 |
−0.0201 |
2.7392 |
2.7593 |
0.7741 |
In general, HOMO represents the ability of a molecule to donate electrons, namely that the higher the EHOMO, the higher the ability of the molecule to donate electrons, which means that it favors the formation of coordination bonds. In contrast to HOMOs, LUMO signifies the ability of the molecule to accept electrons; that is, the lower the ELUMO, the more likely the molecule is to accept electrons and form a feedback bond.46 The HOMO of the dimeric PBT molecule is concentrated predominantly on the S atom on one side of this molecule and partially on the triazinane ring near to this S atom, which means that as active sites, the positions, at which S and adjacent triazinane ring are located, are preferentially adsorbed onto the Q235 CS surface, thus donating electrons to the unoccupied 3d orbitals of Fe and in turn forming the coordination bond. Additionally, since PBT is a symmetric molecule, HOMO and HOMO−1 orbitals are close in energy, differing only by 0.0008 eV (EHOMO = −5.4985 eV, EHOMO−1 = −5.4993 eV), meaning that they are degenerate orbitals (more details see Fig. S4†). On the contrary, the LUMO is predominantly distributed on two triazinane rings and S atoms on both sides, suggesting that feedback bonds are more likely to form at these positions. The energy difference between HOMO and LUMO of PBT (ΔE) represents the reactivity of the molecule; the smaller the ΔE, the higher the reactivity of the molecule and the more significant the inhibition effect.47 Herein, PBT has a ΔE of 5.5186 eV, which is comparable with that of monomeric triazinane-based inhibitor, obtained in our previous work,16 implying that PBT has a superior inhibition effect.
Similarly, the other quantum chemical parameters can be derived from EHOMO and ELUMO (calculation formula see ESI†). Notably, the ΔN represents the fraction of electrons transferred from the PBT to the CS surface. If ΔN > 0, electrons are transferred from the PBT to the CS surface, otherwise electrons are transferred from the CS surface to the empty orbitals of the PBT.48 Based on the ΔN values listed in Table 6, the ΔN value of the PBT is 0.7741 eV, indicating that the PBT molecule is capable to donate electrons to Fe atoms on CS surface, which further confirms the occurrence of chemisorption. The ESP is closely associated with the electronic density distribution, which is a very useful descriptor to shed light on the electrophilic and/or nucleophilic attack sites of target molecules. Generally, the negative (red) and positive (blue) regions are intimately to the nucleophilic and electrophilic reactivities, respectively.
Fig. 10 gives the ESP distribution of PBT. Evidently, electron-rich regions are localized primarily around S atoms and partially around N atoms on triazinane rings, attributed to the fact that they both bear lone-pair electrons. This implies that the Fe atom on CS surface, served as an electrophile, is susceptible to attack from the negatively charged sites of PBT (as nucleophilic centers). Actually, nucleophilic centers are usually heteroatoms with lone-pair electrons, functional electronegative groups and all groups containing π-electrons, including double/triple bonds, aromatic rings and their conjugated systems.49 Therefore, the ESP distribution suggests that S atoms and triazinane rings as well, as the main adsorption sites, have a greater tendency to adsorb on Q235 CS surfaces, which is more conducive to the transfer of electrons from PBT to the 3d orbitals of Fe and the formation of coordinate bonds.50 In other words, DFT calculations confirm that PBT exhibits an excellent inhibition ability, which mainly relies on the formed coordinate bond, i.e., the occurrence of strong chemisorption, and is in agreement with the experimental results.
 |
| | Fig. 10 ESP distribution on vdW surface of PBT. | |
Proposed corrosion mechanism
In this work, an adsorption process of PBT molecules on the surface of Q235 CS is proposed, based on all experimental and computational results, as shown in Fig. 11. The main adsorption sites for PBT molecules on the Q235 CS surface are S atoms and the triazinane rings as well. In the initial stage of adsorption process, Cl− in solution is preferentially adsorbed on the surface of Q235 CS to form a negatively charged surface, and then the protonated PBT molecules can be easily adsorbed on the surface of Q235 CS via an electrostatic attraction, which is known as the physical adsorption.51 The rapid rate of physical adsorption can provide a basic mechanism for the subsequent chemisorption process.52 Subsequently, the presence of triazinane rings and S atoms one both sides of the PBT molecule allows excess electrons to be transferred from the PBT molecule to the vacant 3d orbitals of Fe, which results in the formation of coordination bonds and promotes the chemisorption of PBT on the Q235 CS surface. With the continuous accumulation of electrons in the vacant 3d orbitals of Fe, the repulsive interaction between electrons becomes stronger and stronger, prompting a portion of the electrons transferred from 3d orbitals of Fe to the vacant antibonding orbitals of the PBT molecule in the reverse direction to form a feedback bond, which further improves the adsorption capacity of PBT on the Q235 CS surface.53
 |
| | Fig. 11 Schematic illustration of the inhibition mechanism of PBT on Q235 CS. | |
Conclusion
In this work, selecting 1,3-diaminopropane as substituents, PBT was facilely synthesized using a one-step procedure according to the three-component condensation. The IE value of PBT in 1.0 mol per L HCl were then examined via gravimetric measurements, electrochemical tests, surface morphological and composition analyses and DFT calculations. The main conclusions are listed as follows:
(1) PBT exhibit excellent corrosion inhibition, having the increased IE with the concentration ranging from 0.005 to 1.0 mmol L−1. At a concentration of 1.0 mmol L−1, the IE value of PBT reach the maximum of 92.1% at 298.15 K. Furthermore, a moderate increase in temperature can enhance the corrosion inhibition.
(2) According to electrochemical measurement, PBT is a mixed-type corrosion inhibitor, which can not only inhibit the anodic Fe dissolution, but also slow down the cathodic H+ reduction.
(3) The adsorption of PBT on the Q235 CS surface follows the Langmuir isotherm model. PBT molecules can be strongly adsorbed primarily through chemisorption, in conjunction with physisorption, onto the surface of Q235 CS.
(4) Based on DFT calculation, the presence of S atoms and triazinane rings promotes the interaction of PBT with the Q235 CS surface, thereby allowing for the superior inhibitory performance.
Data availability
The data supporting this article have been included as part of the ESI.†
Author contributions
Yuan Wang: methodology, investigation, writing – original draft. Wenwen Song: software. Wenhui Gong: validation, formal analysis. Junbo Xu: methodology, software. Youwei Li and Qibin Chen: supervision, data curation, writing – review & editing.
Conflicts of interest
The authors declare that they have no known competing financial interests or personal relationships that could have appeared to influence the work reported in this paper.
Acknowledgements
This work is supported by the Fundamental Research Funds for the Central Universities (2022ZFJH04).
Notes and references
- A. S. El-Tabei and M. A. Hegazy, J. Surfactants Deterg., 2013, 16, 757–766 CrossRef CAS
 .
. - D. S. Chauhan, M. A. Quraishi, W. B. W. Nik and V. Srivastava, J. Mol. Liq., 2021, 321, 114747 CrossRef CAS .
- H. M. Abd El-Lateef, M. Ismael and I. M. A. Mohamed, Corros. Rev., 2015, 33, 77–97 CAS .
- J. Li, Y. C. Xie, W. H. Li, R. H. Zhu and W. X. Wu, Prot. Met. Phys. Chem. Surf., 2019, 55, 789–794 CrossRef CAS .
- Z. Y. Hu, Y. B. Meng, X. M. Ma, H. L. Zhu, J. Li, C. Li and D. Y. Cao, Corros. Sci., 2016, 112, 563–575 CrossRef CAS .
- C. Verma, M. A. Quraishi and K. Y. Rhee, Chem. Eng. J., 2022, 430, 132645 CrossRef CAS .
- C. H. Wei, G. Xu and J. Yu, Corros. Mater., 2022, 73, 1153–1162 CrossRef CAS .
- J. Wang, L. An, J. Wang, J. Gu, J. Sun and X. J. Wang, Adv. Colloid Interface Sci., 2023, 321, 103031 CrossRef CAS PubMed .
- A. El-Faham, K. A. Dahlous, Z. A. A. L. Othman, H. A. Al-Lohedan and G. A. El-Mahdy, Molecules, 2016, 21, 436 CrossRef PubMed .
- M. Salman, K. R. Ansari, J. Haque, V. Srivastava, M. A. Quraishi and M. A. J. Mazumder, J. Heterocycl. Chem., 2020, 57, 2157–2172 CrossRef CAS .
- S. H. Yoo, Y. W. Kim, J. Shin, N. K. Kim and J. S. Kim, Bull. Korean Chem. Soc., 2015, 36, 346–355 CrossRef CAS .
- Z. F. Zhang, S. Q. Wang and G. S. Zhang, J. Heterocycl. Chem., 2011, 49, 433–437 CrossRef .
- E. T. Heakal and A. E. Elkholy, J. Mol. Liq., 2017, 230, 395–407 CrossRef .
- J. T. Zhang, M. J. Kong, J. T. Feng, C. X. Yin, D. Q. Li, L. Fan, Q. B. Chen and H. L. Liu, J. Mol. Liq., 2021, 344, 117962 CrossRef CAS .
- X. Wang, W. L. Xu, G. A. Zhang and Z. Y. Liu, Corros. Sci., 2023, 220, 111288 CrossRef CAS .
- X. Wang, W. L. Xu, Y. Y. Li, Z. N. Jiang, X. Q. Zeng and G. A. Zhang, J. Colloid Interface Sci., 2023, 639, 107–123 CrossRef CAS PubMed .
- W. H. Gong, M. Li, F. Wang, Y. H. Nie, L. Li and Q. B. Chen, J. Ind. Eng. Chem., 2025 DOI:10.1016/j.jiec.2024.12.059 .
- F. Hamoud, S. M. Ramsh, V. S. Fundamenskii and V. V. Gurzhii, Russ. J. Org. Chem., 2016, 52, 121–126 CrossRef CAS .
- X. M. Ma, J. B. Wang, S. Y. Yu, X. J. Chen, J. Li, H. L. Zhu and Z. Y. Hu, J. Mol. Liq., 2020, 315, 113711 CrossRef CAS .
- T. Li, Y. X. Sun, J. S. Li, S. Han, X. J. Zhou, Y. Z. Tang and X. Q. Zeng, Langmuir, 2023, 39, 2579–2588 CrossRef PubMed .
- X. Wang, L. Liu, P. Wang, W. Li, J. Zhang and Y. G. Yan, Ind. Eng. Chem. Res., 2014, 53, 16785–16792 CrossRef CAS .
- A. Pal, S. Dey and D. Sukul, Res. Chem. Intermed., 2016, 42, 4531–4549 CrossRef CAS .
- P. R. Ammal, M. Prajila and A. Joseph, J. Environ. Chem. Eng., 2018, 6, 1072–1085 CrossRef .
- L. Guo, R. L. Zhang, B. H. Tan, W. P. Li and S. Z. Wu, J. Mol. Liq., 2020, 311, 113239 CrossRef .
- M. O. Rbaa, M. Galai, M. Berisha, A. Lakhrissi, B. Jama, C. Warad, I. Warad and A. Zarrouk, Colloids Surf., A, 2020, 602, 125094 CrossRef CAS .
- K. G. Zhang, B. Xu, W. Z. Yang, X. S. Yin, Y. Liu and Y. Z. Chen, Corros. Sci., 2015, 90, 284–295 CrossRef CAS .
- G. Wang, W. T. Li, X. Wang, X. W. Yuan and H. Y. Yang, Mater. Chem. Phys., 2023, 293, 126956 CrossRef CAS .
- M. El Faydy, M. Galai, A. El Assyry, A. Tazouti, R. Touir, B. Lakhrissi, M. Ebn Touhami and A. Zarrouk, J. Mol. Liq., 2016, 219, 396–404 CrossRef CAS .
- B. Qian, J. Wang, M. Zheng and B. R. Hou, Corros. Sci., 2013, 75, 184–192 CrossRef CAS .
- H. Keleş, D. Melis Emir and M. Keleş, Corros. Sci., 2015, 101, 19–31 CrossRef .
- L. W. Feng, C. X. Yin, H. Zhang, Y. F. Li, X. H. Song, Q. B. Chen and H. L. Liu, ACS Omega, 2018, 3, 18990–18999 CrossRef CAS PubMed .
- R. Solmaz, G. Kardas, M. Culha, B. Yazıcı and M. Erbil, Electrochim. Acta, 2008, 53, 5941–5952 CrossRef CAS .
- H. Lgaz, K. Subrahmanya Bhat, R. Salghi, Shubhalaxmi, S. Jodeh, M. Algarra, B. Hammouti, I. Hassan Ali and A. Essamri, J. Mol. Liq., 2017, 238, 71–83 CrossRef CAS .
- S. A. Umoren, Y. Li and F. H. Wang, Corros. Sci., 2010, 52, 1777–1786 CrossRef CAS .
- A. O. Yüce, B. D. Mert, G. Karda and B. Yazc, Corros. Sci., 2014, 83, 310–316 CrossRef .
- M. A. Hegazy, S. M. Rashwan, M. M. Kamel and M. S. El Kotb, J. Mol. Liq., 2015, 211, 126–134 CrossRef CAS .
- A. Kokalj, Corros. Sci., 2021, 196, 109939 CrossRef .
- L. Cui, M. Y. Hang, H. H. Huang and X. J. Gao, Constr. Build. Mater., 2021, 313, 125533 CrossRef CAS .
- Q. Zhao, J. X. Guo, G. D. Cui, T. Han and Y. H. Wu, Colloids Surf., B, 2020, 194, 111150 CrossRef CAS PubMed .
- F. M. Galleguillos Madrid, A. Soliz, L. Cáceres and M. Bergendahl, Materials, 2024, 17, 3996 CrossRef CAS PubMed .
- F. Z. Bouanis, F. Bentiss, S. Bellayer, J. B. Vogt and C. Jama, Mater. Chem. Phys., 2011, 127, 329–334 CrossRef CAS .
- C. Chen, L. H. Jiang, M. Z. Guo, P. Xu, L. Chen and J. Zha, Constr. Build. Mater., 2019, 228, 116752 CrossRef CAS .
- A. Zarrouk, B. Hammouti, T. Lakhlifi, M. Traisnel, H. Vezin and F. Bentiss, Corros. Sci., 2015, 90, 572–584 CrossRef CAS .
- J. Haque, V. Srivastava, M. A. Quraishi, D. S. Chauhan and I. M. Chung, Corros. Sci., 2020, 172, 108665 CrossRef CAS .
- M. Tourabi, K. Nohair, M. Traisnel, C. Jama and F. Bentiss, Corros. Sci., 2013, 75, 123–133 CrossRef CAS .
- S. A. Haladu, N. D. Mu'Azu, S. A. Ali, A. M. Elsharif, N. A. Odewunmi and H. M. A. El-Lateef, J. Mol. Liq., 2022, 350, 118533 CrossRef CAS .
- A. Rochdi, O. Kassou, N. Dkhireche, R. Touir and M. El Bakri, Corros. Sci., 2014, 80, 442–452 CrossRef CAS .
- M. A. Amin, K. F. Khaled, Q. Mohsen and H. A. Arida, Corros. Sci., 2010, 52, 1684–1695 CrossRef CAS .
- D. Daoud, T. Douadi, H. Hamani, S. Chafaa and M. Al-Noaimi, Corros. Sci., 2015, 94, 21–37 CrossRef CAS .
- H. Tian, W. Li, K. Cao and B. Hou, Corros. Sci., 2013, 73, 281–291 CrossRef CAS .
- X. H. Li, X. G. Xie, S. D. Deng and G. B. Du, Corros. Sci., 2015, 92, 136–147 CrossRef CAS .
- B. S. Hou, N. Xu, Q. H. Zhang, C. J. Xuan, H. F. Liu and G. A. Zhang, J. Taiwan Inst. Chem. Eng., 2019, 95, 541–554 CrossRef CAS .
- S. D. Deng, X. H. Li and X. G. Xie, Corros. Sci., 2014, 80, 276–289 CrossRef CAS .
|
| This journal is © The Royal Society of Chemistry 2025 |
Click here to see how this site uses Cookies. View our privacy policy here. 
 Open Access Article
 This Open Access Article is licensed under a Creative Commons Attribution-Non Commercial 3.0 Unported Licence
 *c
*c