
 Open Access Article
 This Open Access Article is licensed under a Creative Commons Attribution-Non Commercial 3.0 Unported Licence
Material characterization and biocompatibility of polycarbonate-based polyurethane for biomedical implant applications
Farhad Sadeghi ,
Yasaman Zamani,
Kaylee Lynn Bear and
Arash Kheradvar*
,
Yasaman Zamani,
Kaylee Lynn Bear and
Arash Kheradvar*
Department of Biomedical Engineering, University of California, Irvine, 2420 Engineering Hall, Irvine, CA 92697-2730, USA. E-mail: arashkh@uci.edu; Fax: +1-9497252891; Tel: +1-9498246538
First published on 21st March 2025
Abstract
Polycarbonate polyurethane (PCU) resins are widely used in biomedical applications due to their excellent mechanical properties, biocompatibility, and resistance to degradation. The performance of these materials in implantable devices depends on factors such as hardness, molecular weight, and their interactions with cells and tissues. Understanding the relationship between material properties and biological outcomes is essential for optimizing their use in medical devices. In this study, three PCU resins were selected for evaluation as potential polymer implant materials: Chronoflex (CF) 65D, and two Carbothane (CB) samples 95A with different molecular weights. Dynamic mechanical analysis (DMA) revealed that the storage modulus was primarily influenced by the hard domain content, with greater elasticity observed at higher frequencies and lower temperatures. Tensile hysteresis behavior at room temperature was strongly correlated with hardness, with lower hardness samples demonstrating improved strain recovery. Cytotoxicity testing indicated cell viability above 70% for both CF and CB films. Normal Human Lung Fibroblasts (NHLF) grown on CF films exhibited a more homogeneous distribution across the surface, adopting an elongated morphology that conformed closely to the underlying topography. In contrast, cells on CB films tend to aggregate, forming clustered structures. This study demonstrates that the mechanical and biological performance of PCU resins is closely linked to their hardness, molecular weight, and structural composition. The results highlight that a morphology with a higher proportion of hard domains produces a more uniform and favorable environment for cell adhesion and organization.
1 Introduction
Thermoplastic Polyurethane (TPU) is one of the highest-performing medical-grade polymers, widely used in a diverse range of implantable medical devices.1 Its applications range from acetabular bearing material in hip joint and compliant balloon2 to heart valves.3 TPU has specific mechanical and biological properties that contribute to a unique combination of toughness, durability, flexibility, biocompatibility, and bio stability. TPU is increasingly gaining attention in the biomedical field due to its molecular structure, which closely resembles that of human tissues4 resulting in excellent biocompatibility. The molecular structure of TPU comprises of three main segments: (1) isocyanate, (2) polyol, which may be polyester, polyether, or polycarbonate, and (3) a chain extender. The reaction of these components forms a morphology known as a segmented structure, including alternating soft and hard segments.4 The combination of the chain extender and diisocyanate forms the hard segments, while the polyol component forms the soft segments.4 The hard segments provide rigidity, while the soft segments contribute elasticity to the material. TPUs are often categorized by their polyol type; for instance, a “polycarbonate TPU” refers to a TPU with a polyol component based on a polycarbonate structure.Chain extenders are low-molecular-weight diols or diamines that react with diisocyanates to increase the molecular weight of the polyurethane and extend the block length of the hard segments (Fig. 1). The molecules in the hard segments can pack tightly and crystallize, while the soft segments remain primarily amorphous.4 In TPU, microphase separation typically occurs between these two domains, with hard segments dispersed within the soft segment matrix. The hardness of TPU is determined by the ratio of hard segments to soft segments and is measured in Shore hardness according to ASTM D2240. This can be reported as Shore A or Shore D, depending on the hardness range. An increase in the hard segment content generally leads to a higher degree of microphase separation, as the hard segments tend to aggregate and form distinct domains.5 This increased microphase separation can enhance the mechanical properties, thermal stability, and other functional characteristics of the polyurethane.6 Alternatively, a higher soft segment content can result in a more homogeneous and less distinct microphase separation, which may lead to improved flexibility and elasticity of the material.7 Commercial TPUs are typically produced in three categories—polyester, polyether, and polycarbonate—based on the type of polyol used in the soft segment. These TPU polymers are manufactured by various companies and marketed under different trademarks, such as Pellethane, Carbothane, Tecothane, and ChronoFlex.
 | ||
| Fig. 1 Chemical structure of thermoplastic polyether polyurethane. The molecular structure of TPU comprises of three main segments: (1) isocyanate, (2) polyol, which may be polyester, polyether, or polycarbonate, and (3) a chain extender. The reaction of these components forms a morphology known as a segmented structure, including alternating soft and hard segments. The combination of the chain extender and diisocyanate forms the hard segments, while the polyol component forms the soft segments. | ||
Polyester-urethanes contain ester linkages, polyether-urethanes contains ether moieties, and polycarbonate-urethanes (PCUs) contain carbonate linkages.8 The use of TPU in implantable applications has progressively increased due to its excellent biocompatibility and durability. Two important characteristics of TPU that influence its durability for implant applications are the type of polyol linkage and the ratio of hard to soft segments.9 The molecular weight and structure of the polyol portion play a crucial role in the performance of implantable parts.9,10 It has been shown that both polyether and polyester polyurethane copolymers are prone to biodegradation mechanisms.11 Polyester polyurethane shows hydrolytic degradation11 indicating it is more sensitive to moisture, while polyether polyurethane demonstrates stress corrosion cracking and oxidation in vivo.12 It has been observed that the polyol segment is particularly susceptible to oxidative degradation in implant applications.13 Studies have shown that oxidation resistance is significantly improved when the soft segment is replaced with polycarbonate segments.14
Given the expanding use of TPUs in biomedical implants, it is essential to understand and characterize the structure of segmented TPUs, particularly in terms of the effects of hardness and molecular weight on their performance in implant applications. This study focuses on material characterization and biocompatibility of two commercial grade polycarbonate TPUs: Chronoflex and Carbothane.
2 Materials and methods
2.1 Materials preparation and characterization
Two types of polycarbonate polyurethane resins were used in this study: Carbothane AC-4095A, manufactured by Lubrizol, with two melt flow indices (MFI) of 4.3 and 7.1 g per 10 minutes at 210 °C/2160 g, according to ASTM D1238, and Chronoflex C 65D from AdvanSource, with an MFI of 10.36 g per 10 minutes at 205 °C/3.26 kg. In this paper, these materials are referred to as CB 4.3, CB 7.1 and CF. The thermal and mechanical characterization of the materials were conducted at the UCI's TEMPR facility.Molecular weight was measured using the Waters-Wyatt APC-MALS-RI system (Milford, MA), which includes the high-definition Waters ACQUITY APC system. Polymer samples were dissolved in tetrahydrofuran (THF) at a concentration of 6 mg mL−1 and filtered through a 0.2 μm PTFE filter to remove any contaminants. The columns were operated at a flow rate of approximately 0.5 mL min−1.
The rheological behavior of the resins was determined using a Discovery Series Hybrid Rheometer HR-2 (TA Instruments, New Castle, DE). Viscosity frequency sweep tests at 200 °C with a strain of 1% were performed in oscillation mode. Strain sweep tests were first conducted at 1% strain to confirm that the samples were within the linear viscoelastic region.
Polymer films were cast from polymer solutions to evaluate their mechanical properties. Solution casting is the primary method used for producing polyurethane implants, including those for heart valves. A set of sheets was also melt-molded using a heated press at 215 °C to compare with solution-cast parts. Dynamic mechanical analysis (DMA) tests were conducted using a DMA Q800 (TA Instruments, New Castle, DE) in tension mode. DMA testing was conducted on solution-cast sheets to assess stiffness. For DMA testing, a 1% strain was applied during testing.
To evaluate the hard-to-soft segment ratio and characterize phase formation, FTIR experiments were performed by recording infrared spectra with a FTIR 4700 (JASCO, Easton, MD) at a resolution of 4 cm−1 and 16 scans. This characterization is based on analyzing the energy of various molecular vibration modes associated with specific molecular groups. A method introduced by Huang et al.4 was used to evaluate the hard segment ratio, selecting two peaks: one at 1716 cm−1, assigned to the free C![[double bond, length as m-dash]](https://www.rsc.org/images/entities/char_e001.gif) O stretching vibration, and one at 1688 cm−1, assigned to N–H-bonded CO (CO⋯N–H). The peak at 1716 cm−1 is attributed to hydrogen bonding between the N–H groups of the hard segment and the CO group of the soft segment (CO⋯N–H), representing the soft segment. On the other hand, hydrogen bonding (CO⋯N–H) between the hard domains can result in phase separation of the hard and soft domains, providing higher mechanical strength. Hydrogen bonding (CO⋯N–H) between the hard and soft domains may lead to phase mixing of these domains. A hydrogen bonding index HBI = area (1688 cm−1)/area(1713 cm−1) was calculated as the peak area ratio of the stretching vibration corresponding to the hydrogen-bonded CO groups with that corresponding to the free C–O groups. Peak-fit processing was thus performed using gaussian fitting on the FTIR spectra to calculate the peak area of assigned peaks. HBI parameter is used to define parameter of degree of phase separation DPS = HBI/(HBI + 1), The same method was used here with a note that the peaks at 1688 and 1716 have shifted to 1700 and 1735 cm−1 respectively for our samples, that is likely related to hydrogen bonding interactions and the microphase separation between hard and soft segments.15
O stretching vibration, and one at 1688 cm−1, assigned to N–H-bonded CO (CO⋯N–H). The peak at 1716 cm−1 is attributed to hydrogen bonding between the N–H groups of the hard segment and the CO group of the soft segment (CO⋯N–H), representing the soft segment. On the other hand, hydrogen bonding (CO⋯N–H) between the hard domains can result in phase separation of the hard and soft domains, providing higher mechanical strength. Hydrogen bonding (CO⋯N–H) between the hard and soft domains may lead to phase mixing of these domains. A hydrogen bonding index HBI = area (1688 cm−1)/area(1713 cm−1) was calculated as the peak area ratio of the stretching vibration corresponding to the hydrogen-bonded CO groups with that corresponding to the free C–O groups. Peak-fit processing was thus performed using gaussian fitting on the FTIR spectra to calculate the peak area of assigned peaks. HBI parameter is used to define parameter of degree of phase separation DPS = HBI/(HBI + 1), The same method was used here with a note that the peaks at 1688 and 1716 have shifted to 1700 and 1735 cm−1 respectively for our samples, that is likely related to hydrogen bonding interactions and the microphase separation between hard and soft segments.15
Thermal properties of the films were analyzed using a Differential Scanning Calorimeter 2500 (TA Instruments, New Castle, DE). The samples were heated from −30 °C to 200 °C at a rate of 10 °C min−1, then cooled at the same rate to −30 °C and reheated to 200 °C. Hysteresis tests were performed using an Instron 3365 dual-column Universal Testing System (Norwood, MA) at a speed of 100 mm min−1, with a gap of 25 mm and a width of 15 mm. Hysteresis curves for CF and CB samples at 37 °C and 95% relative humidity (RH), simulating body temperature and humidity, were performed using DMA in strain ramp mode with 10 mm min−1 speed within the elastic region (3% strain).
Sheets of material were produced using the solution casting method, where resin granules were dissolved in dimethylacetamide at 60 °C for 24 hours to create a 20% solution. The solution was then cast into a rectangular mold and placed in an oven at 60 °C for 6 hours to dry, resulting in sheets with a thickness of approximately 150 microns. For melt sheet preparation, the resins were compression molded at 220 °C for 8 minutes and then cooled to room temperature. Thermogravimetric analysis (TGA) was performed on the cast films using a TG 209 F1 Libra (NETZSCH-Gerätebau GmbH) at a heating rate of 20 °C min−1. Optical microscopy was conducted using a Nikon Eclipse Ts2 at 20× magnification.
To simulate hydrolysis and evaluate the stability of the samples, solution-cast film samples were submerged in water at 100 °C for six days, then conditioned at room temperature for one day before undergoing mechanical property testing.
Contact angle measurements were performed using the MSE PRO Entry Level Contact Angle Meter (Model #MA211, Tucson, AZ) on the surfaces of both treated and untreated films.
2.2 Cytotoxicity of CB and CF films
Cytotoxicity analysis was performed according to ISO 10993-5. Carbothane and Chronoflex films (1 × 1 cm) were sterilized by immersion in 70% ethanol for 2 hours, followed by rinsing with sterile phosphate-buffered saline (PBS). Eagle's Minimum Essential Medium or EMEM (ATCC, Manassas, VA) containing 10% FBS and 1% Penicillin–Streptomycin was added to the samples at a ratio of 3 cm2 mL−1, and the samples were incubated at 37 °C for 48 hours to prepare the extract. L929 cells (ATCC, Manassas, VA) were seeded in a 96-well plate at a density of 1 × 10⁴ cells per 100 μl MEM per well. After 24 hours, the old culture medium for each well was replaced with the extracts of the samples. A group incubated with complete cell culture medium served as the control. After 3 days of incubation, cell viability was assessed using the CCK-8 assay (MilliporeSigma, St. Louis, MO) by adding 10 μl of CCK-8 solution to each well, followed by a 4 hour incubation period. The absorbance at 450 nm was measured using a Spark Multimode Microplate Reader (Tecan, Männedorf, Switzerland). Cell viability was calculated using the following equation:
 | (1) |
2.3 Cell proliferation on CB and CF films
Carbothane and Chronoflex films (1 × 1 cm) were plasma treated using a Harrick PDC-001 plasma cleaner (Harrick, Ithaca, NY) for two minutes and sterilized by immersion in 70% ethanol, followed by rinsing with sterile PBS. To improve cell attachment, films were coated with a 1 μg mL−1 concentration of fibronectin solution. Normal Human Lung Fibroblasts (NHLF) were obtained from the American Type Culture Collection (ATCC, Manassas, VA). Cells were grown and maintained in fibroblast growth medium (FGM™-2 BulletKit™; Lonza, Basel, Switzerland) enriched with insulin (0.50 mL), hFGF-B (0.50 mL), GA-1000 (0.50 mL), and FBS (10.00 mL) in a humidified incubator with 5% CO2 in air at 37 °C. After reaching ∼75% confluency, cells were detached using 0.25% trypsin-edta (Gibco, Invitrogen, Waltham, MA) in PBS at 37 °C. Cells were then re-suspended in FGM and seeded on Carbothane and Chronoflex samples with a density of 5 × 10³ cells per cm2 in a 24-well culture plates. Attachment was allowed for 30 min, and FGM was added to cell seeded samples. Proliferation was assessed by determining cell numbers on samples at days 1 and 7 using CCK-8 assay, as described above under ‘Cytotoxicityʼ.2.4 Live/dead staining of cells on CB and CF films
A live/dead kit (L3224; Thermo Fisher Scientific, Waltham, MA) was used to assess live cell distribution in the cell-seeded samples according to manufacturer's instructions. Briefly, 24 h post cell seeding, samples were washed in PBS, followed by incubation in 0.5 μL ml−1 calcein acetoxymetyl (Cal-AM) and 2 μL ml−1 ethidium homodimer-1 (EthD) in PBS at 37 °C for 30 minutes. Concentration of Cal-AM and EthD stock solutions was 4 mM in anhydrous dimethyl sulfoxide (DMSO) and 2 mM in DMSO/H2O 1![[thin space (1/6-em)]](https://www.rsc.org/images/entities/char_2009.gif) :4 (v/v), respectively. Samples were washed again in PBS and imaged using fluorescent microscopy (Keyence, Osaka, Japan). Three samples from each group were imaged and representative images were chosen.
:4 (v/v), respectively. Samples were washed again in PBS and imaged using fluorescent microscopy (Keyence, Osaka, Japan). Three samples from each group were imaged and representative images were chosen.
2.5 Cell morphology on CB and CF films
On day 7 post-seeding, samples were prepared for cell morphology analysis. Cells were fixed in 4% (v/v) glutaraldehyde, followed by dehydration in a graded ethanol series (30%, 50%, 70%, 90%, and 100%). After drying, samples were sputter-coated with a 5 nm layer of iridium using the EMS 150T S sputter coater (Quorum Technologies, Laughton, UK). Cell morphology on CB and CF films was then analyzed via scanning electron microscopy (SEM) using a FEI Magellan 400 XHR-SEM, a field emission SEM from Thermo Fisher Scientific (Waltham, MA, USA).2.6 H&E staining of CF mesh
A pilot study was conducted using a Chronoflex mesh created by laser-cutting 0.06 mm diameter holes in a 1 cm × 1 cm Chronoflex film. Fourteen days after cell seeding, hematoxylin and eosin (H&E) staining was performed on the Chronoflex mesh seeded with fibroblasts encapsulated in collagen (4 mg mL−1) to evaluate cell morphology and tissue integration. Mesh samples were fixed in 4% paraformaldehyde for 24 hours, followed by dehydration through a graded ethanol series and paraffin embedding. Thin sections were then cut from the paraffin blocks, mounted on glass slides, and stained with hematoxylin to visualize cell nuclei and eosin to stain the extracellular matrix and cytoplasmic components.3 Results
3.1 Morphological characterization of polymer surfaces
The molecular weights of the resins are presented in Table 1. Our findings indicate that CB 4.3 had the highest molecular weight among the samples, while CB 7.1 showed the highest Mw/Mn ratio, indicating a broader molecular weight distribution despite its lower hardness.| Mn | Mw | Mw/Mn | |
|---|---|---|---|
| CF | 61503 | 104555 | 1.7 |
| CB 4.3 | 70140 | 127650 | 1.8 |
| CB 7.1 | 62503 | 119200 | 1.9 |
The melt viscosity results of the polyurethanes shown in Fig. 2a displayed a non-Newtonian behavior, with viscosity decreasing as shear rate increased. CB 4.3 exhibited the highest viscosity, followed by CB 7.1 and CF. The storage modulus (G′) and loss modulus (G′′) were also obtained from oscillatory viscometry, as shown in Fig. 2b. The G′/G′′ crossover point indicates the juncture at which the storage modulus G′ (representing elastic behavior) and the loss modulus G′′ (representing viscous behavior) are equal. CB 4.3 exhibited the highest elastic modulus, followed by CB 7.1 and CF. Oscillatory viscometry was also performed at 25 °C on polymer solutions in which the polymer was dissolved in DMAC at a 20% concentration. The viscometry results are shown in Fig. 2c, where all solutions displayed a Newtonian behavior.
 | ||
| Fig. 2 Oscillatory viscometry results. (a) Viscosity frequency sweep test for CB and CF at 200 °C. All three samples display non-Newtonian behavior, with viscosity decreasing as shear rate increased. CB 4.3 exhibited the highest viscosity, followed by CB 7.1 and CF. (b) Storage and loss modulus G′ and G′′ for CF and CB at 200 °C. CB 4.3 exhibit the highest elastic modulus, followed by CB 7.1 and CF. (c) Viscosity frequency sweep test for CF and CB dissolved in DMAC solvent with concentration of 20% at 25 °C. All solutions display a Newtonian behavior. | ||
The DMA results, shown in Fig. 3a and b present storage modulus under two relative humidity conditions (1% and 60%) across various frequencies, where storage modulus increases with frequency for CF samples. The storage modulus is significantly lower at higher relative humidity (Fig. 3b). The results of DMA temperature ramp testing for CB 7.1 and CF samples at a frequency of 1 Hz are shown in Fig. 3c, Storage modulus decreases with temperature increasing from room temperature to 95 °C. The DMA testing for the temperature sample was performed over a lower temperature range to obtain tan delta results, as shown in Fig. 3d. The sample CB 7.1 exhibits a broad peak with a glass transition temperature (Tg) around 0 °C, whereas the CF sample shows a narrower peak with a relatively higher tan delta and a Tg around 37 °C. A higher tan delta indicates greater energy dissipation capacity within the material, suggesting increased viscoelastic damping.
 | ||
| Fig. 3 DMA results of solution cast films (a and b) frequency sweep tests for CF and CB at relative humidity (RH) of 1%, and 60%, CF show higher sensitivity to frequency with a decrease storage modulus when RH increased to 60; (c) temperature ramp test for CF and CB 7.1 solution cast film at frequency of 1 HZ, where CF show a higher temperature sensitivity; (d) tan delta versus temperature for CF and CB where Tg of 0 °C and 37 °C are observed for CB and CF respectively. | ||
The tensile test results for both cast and melt-molded samples are shown in Fig. 4a and b. Fig. 4a shows stress versus strain for melt molded samples where CF shows higher strength and CB 4.3, and 7.1 curves are similar. Fig. 4b presents the stress–strain curve for solution casting films. CF shows higher strength but the difference between CF and CB samples are less. The modulus and stress at 100% strain are presented in Table 2.
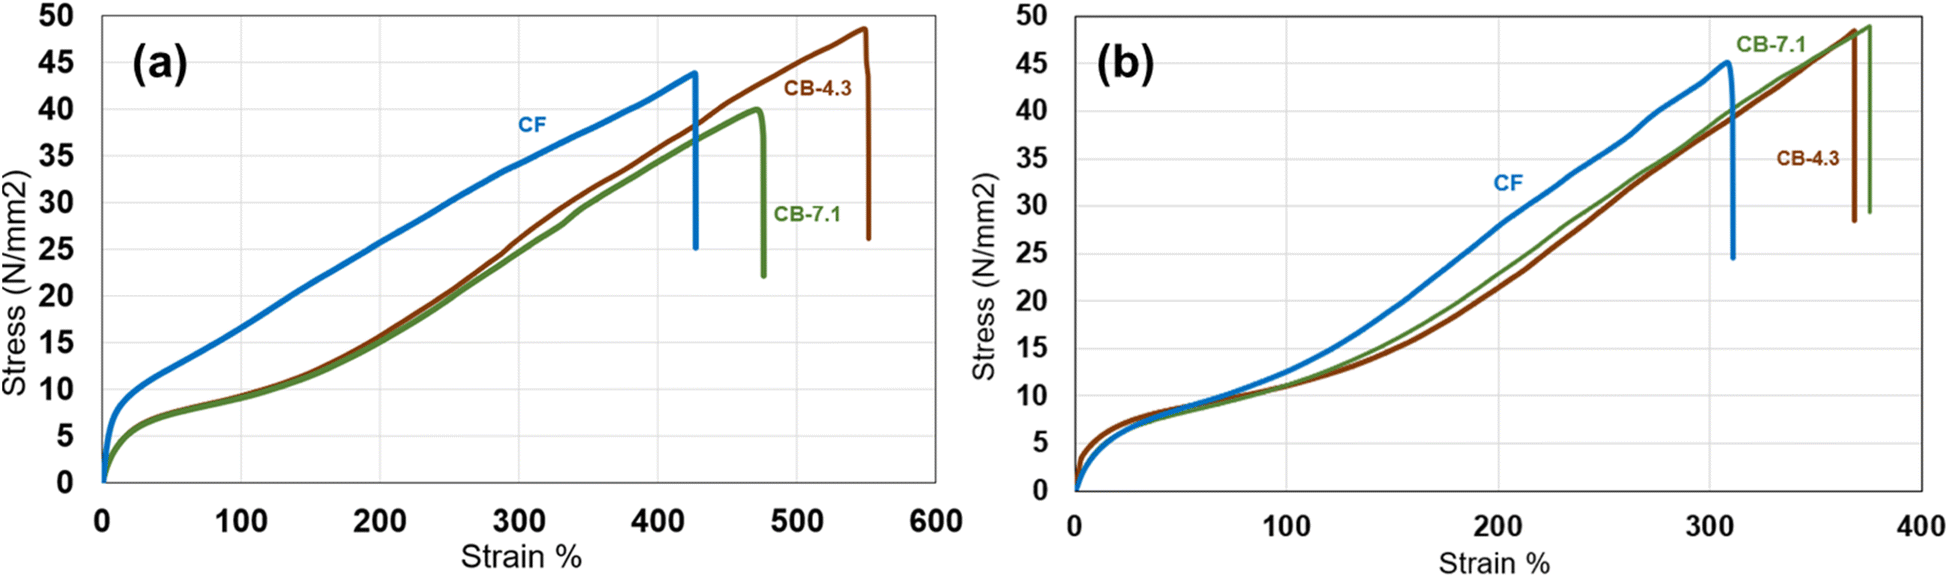 | ||
| Fig. 4 Stress–strain curves for CF and CB samples: (a) films produced by melt compression molding, and (b) films cast from solution. Only the CF film from compression molding exhibits significantly different behavior, characterized by a distinct elastic region followed by a linear strain-hardening region. The tensile behavior of CB 4.3 and 7.1 are similar. | ||
| Modulus (MPa) | Stress (MPa) at 100% strain | |||
|---|---|---|---|---|
| Solution cast | Melt molded | Solution cast | Melt molded | |
| CF | 64 | 166 | 12.5 | 16.7 |
| CB 4.3 | 63 | 63 | 11.1 | 9.5 |
| CB 7.1 | 62 | 61 | 11.1 | 9.5 |
| CF-HR | 61 | N/A | 12.3 | N/A |
| CB 4.3-HR | 48 | N/A | 9.1 | N/A |
| CB 7.1-HR | 42 | N/A | 9.5 | N/A |
The primary degradation mechanism for polyurethanes in implant applications is hydrolysis, which causes chain scission and a reduction in mechanical properties. The results of tensile testing on solution-cast film samples exposed to simulated hydrolysis are shown in Table 2. The results indicate that CF, which has higher hardness, exhibits greater resistance to degradation compared to CB, whereas the effect on CB with different MFI was not significantly different.
An important design consideration for TPUs is stress–strain recovery. The hysteresis tensile test results for the film samples at room temperature are presented in Fig. 5. Fig. 5a present the hystersis curve for one cycle for CF and CB 4.3 samples where CF shows higher strength in 50% strain range. The strain recovery is higher for CB 4.3. The difference between CB 4.3 and CB 7.1 are not significant at it shown in Fig. 5b. Additionally, the hysteresis stress–strain testing results for CF and CB samples at 37 °C and 95% relative humidity (RH)—simulating body temperature and humidity within the elastic region (3% strain)—are shown in Fig. 5c that shows the difference between CF and CB are less pronounced at such condition.
 | ||
| Fig. 5 Hysteresis Stress–Strain curve for samples cast from solution (a) CF and CB 4.3 with CF showing a higher stress but smaller strain recovery, (b) two CBs 4.3 and 7.1 show very similar behavior indicating the insignificant effect of molecular weight, (c) Curve for CF and CB 7.1 at 37 °C and 95% RH in the elastic region (3% strain) where the behavior of two polymers are very similar. | ||
The Differential Scanning Calorimetry (DSC) results, shown in Fig. 6a, depict the thermal behavior of the samples during the first heating cycle—from low temperature to melting—for CF and CB 7.1. Since the results for CB 4.3 closely resemble those of CB 7.1, only the data for CB 7.1 are presented. DSC did not show significant melting peaks for either polymer.
 | ||
| Fig. 6 (a) DSC results first heat for CF and CB 7.1 displays minimal peaks where thermal transition peaks are not significant for this type of polymers (b) TGA results for casted CF and CB, CF shows two step behavior change with 80% of the mass loss occurring in the first step, (c) FTIR spectrum of CB 7.1 and CF films prepared from solution casting, two strong peaks at 1700 and 1735 cm−1 are assigned to N–H-bonded CO (CO⋯N–H) and the free CO stretching vibration, respectively. | ||
FTIR spectroscopy results for CF and CB 7.1, are presented in Fig. 6c. The FTIR analysis revealed notable differences in absorption peak one at 1735 cm−1, assigned to the free CO stretching vibration.
Thermogravimetric Analysis (TGA) curves provide information about the thermal stability and degradation behavior of polyurethane materials. The TGA curves for CF and CB 7.1 are shown in Fig. 6b. Both samples exhibited an onset of thermal degradation at 332 °C; however, CF underwent a two-step degradation process, with 80% of the mass loss occurring in the first step.
The size and distribution of hard domain in polyurethane systems were observed using an optical microscope. Optical microscopy was performed on the surface of the films, and images at 20× magnification for CF and CB 7.1 solution-cast films are shown in Fig. 7 and b respectively. The intensity and size of the hard domains were larger in CF, with the hard domains appearing elongated. Optical microscopy revealed a less pronounced distribution of hard domains in CB 7.1, while the dispersed hard domain phase was more prominent in the CF sample. The size of these rigid phase domains ranged from 20 to 100 microns in length.
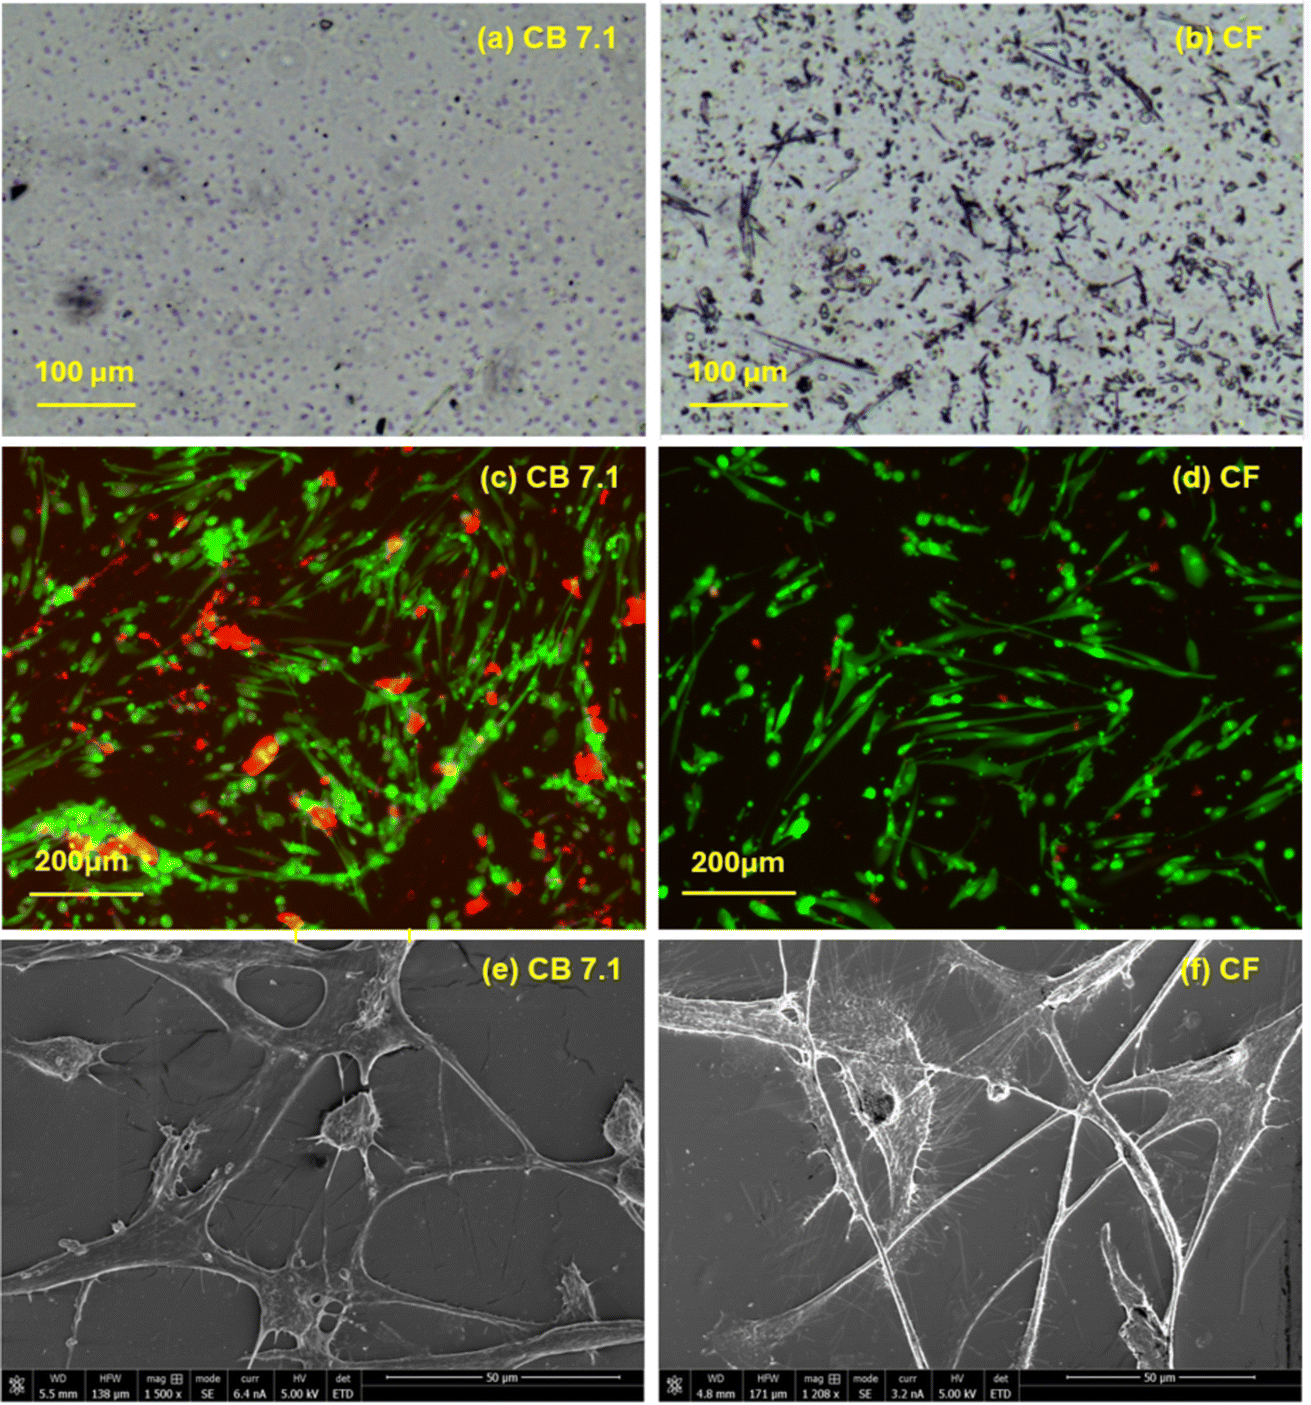 | ||
| Fig. 7 (a) Optical microscopy images of CB 7.1 and (b) CF surfaces at 20× magnification. Small blue circles on the CB 7.1 surface represent hard domains. On the CF surface (b), the mix of elongated lines and darker circles represents hard domains. The intensity and size of the hard domains were greater in CF, with the hard domains appearing elongated. The size of the rigid-phase domains ranged from 20 to 100 microns in length. (c and d) show live/dead staining of cells on CB 7.1 (c) and CF (d) films after 3 days of culture at 10× magnification. Green areas indicate live cells, while red areas indicate dead cells. (e and f) SEM images of cells on CB 7.1 (e) and CF (f) films after 7 days of culture: Cells on CB 7.1 films exhibited a less elongated morphology, with some areas showing a tendency for cells to adopt a rounded shape. In contrast, cells on CF films displayed a more dispersed arrangement, forming elongated strands with minimal clustering. CF films exhibited a more homogeneous distribution of elongated live cells, while cells on CB 7.1 films tended to aggregate and form clusters. | ||
3.2 Wettability and plasma treatment
Plasma treatment has been shown to enhance cell adhesion and proliferation on polyurethane (PU) surfaces by modifying their surface properties. This process introduces polar functional groups and increases surface wettability, creating a more favorable environment for cell attachment and growth. It has been reported that adhesion strength of human coronary artery endothelial (HCAE) cells improved from 89%, compared to 42% on collagen-treated PU surfaces. This indicates that plasma treatment provides a more stable surface for endothelial cell attachment.16 The contact angles were measured for CF and CB 7.1 and the results (n = 5) are reported in Table 3, the effect of plasma treatment was significant for both CF and CB samples where contact angle reduced 40.5 and 36% respectively for CF and CB films. The contact angle values for both CF and CB were similar.| Sample | CF | CB | ||
|---|---|---|---|---|
| Plasma | Untreated | Treated | Untreated | Treated |
| Contact angle ° | 87.4 ± 1.7 | 52 ± 1.5 | 83.9 ± 3.4 | 53.1 ± 7.7 |
3.3 Cytotoxicity analysis, cell proliferation and culture results
Live/dead staining of cells on CB7.1 and CF films after 3 days of culture are shown in Fig. 7c and d respectively. A more homogeneous distribution of elongated live cells was observed on the CF film while cells tended to aggregate and create clusters on the CB 7.1 film. The results of the cytotoxicity test were reported at 85 and 95% viability for CF and CB 7.1 films respectively. Cytotoxicity was expressed as the percentage of viability of L929 cells in contact with the extracts of the films. Viability was higher than 70% for both films and there was no significant difference in cell viability between CB7.1 and CF films. Cell proliferation on CB 7.1 and CF was assessed after 7 days of culture; the results for CB 7.1 and CF for 1 and 7 days were 5502 and 5,635, 5410 and 5917 cells, respectively. There was no statistically significant difference in cell proliferation between CB 7.1 and CF films for one day (p = 0.71); however, cell number for 7 days was slightly higher for CF (p = 0.182).3.4 Cell morphology on CB and CF films
SEM imaging was performed on the cell cultered film samples to further investigate cell morphology, The SEM results for CB 7.1 and CF films samples are shown in Fig. 7e and f, respectively, The morphology of the cells appeared less elongated on CB film, with some areas showing a tendency for the cells to adopt a rounded shape. In contrast, cells on CF film displayed a more dispersed arrangement, forming elongated strands with minimal clustering.3.5 Histological studies on CF mesh
Histological studies were performed on CF Mesh (laser perforated CF film) and images of H&E-stained samples are shown in Fig. 8. A uniform sheet of collagen gel matrix with small numbers of individual cells scattered through the matrix was observed on top, bottom, and through the hole of the mesh. | ||
| Fig. 8 Cross section images of H&E-stained CF mesh at 4× magnification (left) and 10× magnification (right). A uniform sheet of collagen gel matrix with small numbers of individual cells scattered through the matrix was formed on top, bottom, and through the hole of the CF mesh. Yellow arrows: cells. | ||
4 Discussion
The selection of suitable polymeric materials for implantable medical devices remains a critical challenge due to the need to balance mechanical properties, biocompatibility, and degradation resistance. Polycarbonate polyurethane (PCU) resins, widely recognized for their robust mechanical performance and compatibility, must be further understood in terms of how their material properties—such as hardness, molecular weight, and phase composition—affect biological interactions. Despite their prevalent use, there is limited data linking the mechanical and thermal characteristics of PCU resins to cellular responses, which are essential for optimizing these materials for biomedical applications. To address this challenge, we evaluated three PCU resins as potential implant materials: Chronoflex (CF) with a hardness of 65D and two variants of Carbothane(CB) with a hardness of 95A but differing molecular weights. The study involved comprehensive characterization of these materials, including melt and solution viscosity, dynamic mechanical properties, tensile behavior, and phase separation. Additionally, cytotoxicity testing and cell culture experiments with Normal Human Lung Fibroblasts (NHLF) were conducted to assess their biological performance. We found that (i) higher molecular weight resins exhibited greater viscosity, while stiffness was influenced by hard segment content, with increased elasticity at higher frequencies and lower temperatures, (ii) moisture softened the materials, and lower hardness samples (CB) showed better strain recovery, (iii) both CF and CB films supported cell viability above 70%. NHLF cells on CF exhibited uniform, elongated morphology, while CB promoted clustered cell aggregation, and (iv) CF displayed a higher degree of phase separation, which correlated with its superior cell adhesion and organization compared to CB.Molecular weight analysis as shown in Table.1, revealed that CB 4.3 possesses the highest molecular weight among the samples. Reboredo et al.17 emphasized the significant role of molecular weight in influencing the viscosity of TPUs. They demonstrated that viscosity is primarily a function of molecular weight rather than hardness, increasing non-linearly with molecular weight. Although CB 7.1 exhibits a broader molecular weight distribution (Mn/Mw) than CF, its hardness is lower. The TPUs' molecular weight is strongly influenced by the molecular weight of the polyol and the choice of chain extender, with higher molecular weight polyols generally yielding higher molecular weight TPU.18,19
Viscosity frequency sweep tests showed that CB 4.3 has significantly higher viscosity than CF and exhibits pronounced shear-thinning behavior (Fig. 2a). This aligns with its lower melt flow index (MFI), indicating higher molecular weight. Shear-thinning in polyurethanes is attributed to the alignment and disentanglement of polymer chains under flow, reducing molecular interactions and viscosity.20 The results are consistent with the molecular weight results presented in Table 1. Despite CF's higher hardness, its melt viscosity is significantly less than CB's (Fig. 2a). Higher soft segment concentrations, as indicated by longer polyol chains, contribute to increased viscosity in CB (Fig. 2a). Oscillatory viscometry also highlighted enhanced elasticity of CB 4.3 at low frequencies due to greater chain entanglement (Fig. 2b), correlating with its broader molecular weight distribution (Table 1).21 However, the difference in viscosity for solution viscosity is less as observed in Fig. 2c, highlighting the interaction between polymer and solvent. Such polymer solutions are commonly used for dip molding certain implantable polymers, including those used in heart valves.22
Dynamic mechanical analysis (DMA) indicated that CB's longer soft segments result in lower storage modulus (G′), signifying reduced stiffness in the solid state23 (Fig. 3a). Moisture acted as a softening agent, significantly reducing the storage modulus, especially under high humidity (60%). At higher frequencies, CF exhibited a greater increase in storage modulus due to restricted polymer chain mobility, which is linked to its higher hard segment ratio (Fig. 3b).24 Temperature ramp tests revealed that storage modulus decreases with increasing temperature (Fig. 3c), with CF experiencing a larger drop compared to CB when transitioning from room temperature to body temperature (37 °C). The tan delta results shown in Fig. 3d provide insights into the elasticity of the material. A higher tan delta indicates greater hysteresis, leading to increased energy loss per cycle. Conversely, a lower tan delta signifies reduced energy dissipation, meaning the material behaves more elastically,23 with a smaller hysteresis loop and improved energy recovery. The tan delta for CB is relatively lower, which could be reflected in better strain recovery during hysteresis. This behavior is consistent with the observations in Fig. 5a.
In melt-molded samples, solidification occurs through cooling and crystallization of the melt, without the influence of solvent evaporation. Tensile testing performed on both melt molded and solution cast polymer to analyze the impact of solution casting on mechanical properties such as tensile strength. Compression-molded samples exhibited higher tensile strength for CF compared to solution cast, attributed to its greater hard segment ratio (Fig. 4).25 However, CB 4.3 exhibited slightly higher strain at break, likely due to its higher molecular weight. The tensile behavior differences between melt-molded and solution-cast samples stem from variations in entanglement density, with solution-cast films showing lower strain at break.26
It is also important to note that, within a specific range of hardness for commercial polymers, the effect of molecular weight on mechanical properties is not significant. Polyol molecular weight influences the overall molecular weight of the polyurethane, and if the ratio of soft to hard segments is not adjusted, an increase in polyol molecular weight can lead to a decrease in tensile strength, while percent elongation increases. This behavior is attributed to the polymer becoming softer as the length of the soft segment chains increases.27
The simulated hydrolysis results indicate that harder samples are more stable and resistant to hydrolysis. The hydrolytic stability of thermoplastic polyurethanes (TPUs) is influenced by their chemical composition and structural characteristics. Studies have shown that higher hardness and increased chain stiffness improve hydrolysis resistance. These factors contribute to enhanced mechanical stability, which correlates with better resistance to hydrolytic degradation.28
Stress–strain recovery analysis (Fig. 5) highlighted the importance of hysteresis behavior in TPUs. This characteristic is particularly important for implant applications, such as in heart valves, where the material is subjected to cyclic loading and fatigue testing.29 CB exhibited superior strain recovery compared to CF, likely due to its lower hard domain content (Fig. 5a). The higher hysteresis area for CF is attributed to its higher hard domain concentration and associated energy dissipation during cyclic loading. Kim et al.30 discussed hysteresis behavior in TPUs, stating that residual strain results from plastic deformation of the hard domains, and this residual strain can be minimized if the block length of the hard segments decreases. In such cases, increased phase mixing between the hard and soft segments reduces hysteresis during cyclic loading and unloading. However, if the amount of hard domains decreases below a certain threshold, the effect could be opposite, leading to an increase in residual strain. The difference between CB 4.3 and CB 7.1 was minimal, underscoring the limited influence of molecular weight (Fig. 5b). It is important to note that at 37 °C and 95% relative humidity, both CF and CB exhibited comparable responses (Fig. 5c). Under these conditions, moisture acted as a softening agent, diminishing the influence of the hard domain on material behavior.
The absence of a distinct melting point endothermic peak in the differential thermograms is a known characteristic of non-crystalline polymers like TPU (Fig. 6a) and has been previously reported for polyurethane.31 The lack of a pronounced melting peak in polyurethanes can be attributed to their complex thermal behavior, where the hard and soft segments exhibit different arrangement of chains that have complex thermal characteristics.32 The arrangement of chains in the hard and soft segments lacks a highly ordered structure, making it difficult to identify a specific transition temperature. A minor transition temperature was observed at 60 °C in both CB and CF samples, likely attributable to microstructural movements.
TGA typically display a multi-step thermal decomposition profile for polyurethanes, where the material undergoes weight loss at different temperature ranges.33 This multi-stage decomposition is attributed to the complex and segmented morphology of polyurethane, which is composed of both hard and soft segments. The hard and soft segments have different bond dissociation energies, leading to the multi-stage thermal degradation behavior observed in the TGA curves. The step transition in the CF curve (Fig. 6b) could be attributed to the higher content of hard domains.33
The FTIR spectroscopy results for CF and CB 7.1, used to characterize their phase structure—particularly the content of hard and soft segments—The FTIR analysis uncovered notable differences in the degree of phase separation (DPS) between the thermoplastic polyurethanes studied, specifically CB and CF, with DPS values of 0.46 and 0.52, respectively (Fig. 6c). A higher DPS in the CF material corresponds to a bigger phase separation. This increased phase separation is associated with stronger segregation of the hard and soft segments within the polyurethane, potentially enhancing the mechanical strength and thermal stability of the material. The results for CB formulations, specifically CB 7.1 and 4.3, were similar, thereby focusing the analysis on CB 7.1 for consistency. This similarity suggests that both formulations exhibit comparable structural characteristics and interactions between phases, indicative of consistent material behavior in this aspect.
Optical microscopy revealed that both the intensity and size of the hard domains are larger in CF, with the hard domains being elongated (Fig. 7a and b). The size of these rigid phase domains ranged from 20 to 100 microns in length, which is consistent with findings reported by other researchers.34 Chen et al.35 reported the distribution of hard domains in the form of a dispersed phase within the soft domain, as observed through optical microscopy.35 Consistent with findings reported by other researchers.34
Cell culture studies are fundamental for evaluating polyurethane implants, as the quality and distribution of cell growth on polymer surfaces provide key insights into biocompatibility, cell behavior, and the material's integration within biological systems. CF films exhibited a more uniform distribution of live cells (Fig. 7d) with elongated morphologies compared to CB 7.1 films (Fig. 7c), where cell aggregation was more prominent. Cytotoxicity testing provides an initial assessment of how materials interact with biological systems, serving as a preliminary step before more complex in vivo evaluations. Both CF and CB films demonstrated cell viability percentages exceeding 70%, confirming their non-cytotoxic nature.
SEM analysis (Fig. 7e and f) confirmed the distribution patterns observed in Fig. 7c and d, with cells on CF films conforming to the surface morphology, whereas CB 7.1 films promoted cell aggregation. This distinction highlights the influence of substrate composition on cell behavior. The CB films appear to promote localized cell adhesion and aggregation, while the CF films encourage cell spreading and alignment,. The structure for CF resembles the morphology of hard domain observed in Fig. 7b. However for CB 7.1, more of a cell aggregates observed on the surface. This difference aligns with the observed morphology of the hard domain structures. Previous studies, such as those by Lee et al.,36 have shown that the concentration and configuration of the hard domains in polyurethane significantly influence cell–material interactions.36 Variations in the hard domain composition affect the thermal and mechanical properties of the polymer, which in turn, impact cell responses. For example, an optimal hard-to-total segment ratio of 0.4 to 0.6 has been identified to enhance cell growth on polyurethane surfaces.36 Dicesare et al.37 reported similar findings, where cells preferentially migrated toward regions with higher concentrations of hard domains, associated with greater stiffness and favorable mechanical cues for cell attachment and spreading. These observations underscore the potential of CF films for applications requiring controlled cell alignment and distribution.
Plasma treatment had a significant impact on the wettability of the surface for both polymers; however, the plasma interaction with the surfaces of both CF and CB samples was very similar. Without plasma treatment, the polyurethane films (CB and CF) exhibited low hydrophilicity and poor wettability due to their inherently low surface energy and lack of polar functional groups, which hindered water interaction. As a result, the films displayed a high water contact angle, indicating limited wettability and reduced protein adsorption—both of which are essential factors for cell adhesion. Additionally, the smooth surface of the untreated films further impeded hydrophilic interactions, as increased surface roughness generally enhances wettability. Since cells prefer moderately hydrophilic surfaces (contact angle 40–70°) for optimal attachment, the poor wettability of the untreated films could negatively affect cell adhesion, proliferation, and overall biointegration. To address this issue, plasma treatment was applied to modify the surface properties and improve cell compatibility.
Cell proliferation studies revealed comparable cell numbers for both CF and CB 7.1 films, with CF showing a slightly higher count after 7 days of culture. This suggests that the microstructural differences between the films do not have a significant impact on cell proliferation cell count but rather on cell orientation and organization on the surface. These observations underscore the potential of CF films for applications requiring controlled cell alignment and distribution.
The stress–strain curves (Fig. 4) show that the CF sample exhibited higher stiffness and lower elongation at break compared to CB 4.3 and CB 7.1. Cells respond to substrate stiffness through mechanotransduction pathways.38 A stiffer material, such as CF, can promote focal adhesion formation, cytoskeletal organization, and cell spreading. The higher tensile strength of CF suggests better structural integrity, which may provide a more stable surface for cell attachment. The smaller strain at break of CF, compared to the CB 4.3 and CB 7.1, indicates differences in the material's molecular organization and microstructure. Higher stiffness may suggest a more rigid surface, which is known to enhance cell adhesion, particularly for fibroblasts and osteoblasts.39 CF's higher mechanical strength may correspond to a more favorable surface chemistry that supports the adsorption of adhesion-promoting proteins, such as fibronectin and vitronectin. Additionally, increased phase separation in CF (Fig. 7a) could create microdomains that enhance protein adsorption, leading to improved cell adhesion. Integrating these findings, it can be concluded that CF's structural and thermal characteristics contribute to a more conducive environment for cell adhesion.
Based on the results, the CF sample was selected for a pilot study using a CF mesh created by laser cutting holes in the CF film. This design was specifically developed to support tissue growth on both sides of the mesh, a critical feature for applications such as heart valves. H&E staining of CF mesh further demonstrated their suitability for tissue engineering applications. A uniform collagen gel matrix with scattered individual cells was observed (Fig. 8). The laser-cut holes in the CF film facilitated the infiltration and penetration of the collagen matrix and embedded cells, enabling uniform distribution across both sides of the scaffold. This mesh design effectively promotes cell integration and collagen deposition, underscoring its potential for enhancing tissue regeneration in biomedical applications.
5 Conclusions
Commercial grade polycarbonate TPUs, Carbothane and Chronoflex, were studied for potential biomedical implant applications. Analyzing molecular weight characteristics, mechanical behaviors, and biocompatibility revealed how these attributes affect cell viability, distribution, and potential for integration into the biomedical implants. Our study finds that Carbothane, with a higher molecular weight, demonstrates increased viscosity and improved strain recovery, while Chronoflex's higher hard segment ratio offers greater tensile strength and storage modulus. The study's detailed analysis includes rheological, thermomechanical, and cytotoxicity tests that confirm the importance of the polyol type and segment ratios in determining TPU performance. Our studies also demonstrated that these TPUs maintain high cell viability, highlighting their safety and effectiveness for implantable device applications. Additionally, the results showed that TPU with higher hard segment ratio supports better cell distribution and conformation due to its structural design and hard domain morphology, suggesting its enhanced potential for tissue engineering.Data availability
The raw data supporting the results in this article is available upon request from the authors.Conflicts of interest
The authors do not have any conflict of interest.Acknowledgements
This study was funded by the National Heart, Lung, and Blood Institute (NHLBI) grants: HL153724, HL162687, and HL157631, as well as the National Science Foundation (NSF) award #2109959. The authors extend their gratitude to Dr Dan Simionescu for his excellent suggestions on cell culture and cytotoxicity experiments.References
- I. Khan, N. Smith, E. Jones, D. S. Finch and R. E. Cameron, Biomaterials, 2005, 26, 633–643 CrossRef CAS PubMed.
- T. L. Berland, F. J. Veith, N. S. Cayne, M. Mehta, D. Mayer and M. Lachat, J. Vasc. Surg., 2013, 57, 272–275 Search PubMed.
- T. G. Mackay, D. J. Wheatley, G. M. Bernacca, A. C. Fisher and C. S. Hindle, Biomaterials, 1996, 17, 1857–1863 CAS.
- H. Huang, H. Pang, J. H. Huang, P. T. Yu, J. L. Li, M. G. Lu and B. Liao, Constr. Build. Mater., 2021, 284, 122388 CAS.
- M. S. Sanchez-Adsuar, M. M. Pastor-Blas and J. M. Martin-Martinez, J. Adhes., 1998, 67, 327–345 CAS.
- J. H. Jiang, H. Y. Gao, M. J. Wang, L. Gao and G. X. Hu, Polym. Eng. Sci., 2023, 63, 3938–3962 CAS.
- C. H. Wu, C. W. Chen, P. H. Chen, Y. S. Chen, F. S. Chuan and S. P. Rwei, Appl. Sci., 2021, 11(12), 5359 CAS.
- Y. H. Que, Y. Shi, L. Z. Liu, Y. X. Wang, C. C. Wang, H. C. Zhang and X. Y. Han, Polymers, 2021, 13(20), 3475 CAS.
- I. Koutsamanis, M. Spoerk, F. Arbeiter, S. Eder and E. Roblegg, Polymers, 2020, 12(12), 2950 CAS.
- Z. Miri, S. Farè, Q. L. Ma and H. J. Haugen, Prog. Biomed. Eng., 2023, 5, 042001 CAS.
- G. T. Howard, Int. Biodeterior. Biodegrad., 2002, 49, 245–252 CAS.
- E. M. Christenson, M. Dadsetan, M. Wiggins, J. M. Anderson and A. Hiltner, J. Biomed. Mater. Res., Part A, 2004, 69a, 407–416 CrossRef CAS PubMed.
- J. P. Santerre, K. Woodhouse, G. Laroche and R. S. Labow, Biomaterials, 2005, 26, 7457–7470 CrossRef CAS PubMed.
- C. F. Lee, C. W. Chen, S. P. Rwei and F. S. Chuang, Appl. Sci., 2021, 11(2), 698 CrossRef CAS.
- E. Yilgör, E. Yurtsever and I. Yilgör, Polymer, 2002, 43, 6561–6568 CrossRef.
- S. De, R. Sharma, S. Trigwell, B. Laska, N. Ali, M. K. Mazumder and J. L. Mehta, J. Biomater. Sci., Polym. Ed., 2005, 16, 973–989 CAS.
- M. M. Reboredo, A. J. Rojas and R. J. J. Williams, Polym. J., 1983, 15, 9–14 CrossRef CAS.
- P. Kulkarni, U. Ojha, X. Y. Wei, N. Gurung, K. Seethamraju and R. Faust, J. Appl. Polym. Sci., 2013, 130, 891–897 CrossRef CAS.
- I. Javni, O. Bilic, N. Bilic, Z. S. Petrovic, E. A. Eastwood, F. Zhang and J. Ilavsky, J. Appl. Polym. Sci., 2015, 132(47), 42830 CrossRef.
- D. C. Kong, M. H. Yang, X. S. Zhang, Z. C. Du, Q. Fu, X. Q. Gao and J. W. Gong, Macromol. Mater. Eng., 2021, 306(12) DOI:10.1002/mame.202100536.
- F. Sadeghi, A. Ajji and P. J. Carreau, Polym. Eng. Sci., 2007, 47, 1170–1178 CrossRef CAS.
- R. Zareian, S. D. Zuke, D. Morisawa, R. S. Geertsema, M. Majid, C. Wynne, J. C. Milliken and A. Kheradvar, J. Cardiovasc. Dev. Dis., 2024, 11(2), 69 CAS.
- E. CognetGeorjon, F. Mechin and J. P. Pascault, Macromol. Chem. Phys., 1996, 197, 3593–3612 CrossRef CAS.
- M. Hernández-Alamilla and A. Valadez-Gonzalez, J. Polym. Eng., 2016, 36, 31–41 CrossRef.
- L. Cong, G. H. Guo, F. Yang and M. D. Ren, Int. J. Transp. Sci. Technol., 2021, 10, 254–265 CrossRef.
- M. Gonzalez-Garzon, S. Shahbikian and M. A. Huneault, J. Polym. Res., 2018, 25(58), 1–13 CAS.
- J. H. Silver, C. W. Myers, F. Lim and S. L. Cooper, Biomaterials, 1994, 15, 695–704 CrossRef CAS PubMed.
- . C. S. S and F. D. Stewart, Angew. Makromol. Chem., 1973, 29–3, 413–430 Search PubMed.
- J. N. Gorce, J. W. Hellgeth and T. C. Ward, Polym. Eng. Sci., 1993, 33, 1170–1176 CAS.
- B. K. Kim, Y. J. Shin, S. M. Cho and H. M. Jeong, J. Polym. Sci., Part B: Polym. Phys., 2000, 38, 2652–2657 CrossRef CAS.
- P. E. Slade and L. T. Jenkins, J. Polym. Sci., Part C, 1964, 27 CrossRef CAS.
- J. T. Haponiuk, A. Balas and T. Kawka, J. Therm. Anal. Calorim., 1990, 36, 2249–2252 CAS.
- D. Filip, D. Macocinschi and S. Vlad, Compos. Part B, 2011, 42, 1474–1479 CrossRef.
- M. V. Mokeev and V. V. Zuev, Eur. Polym. J., 2015, 71, 372–379 CrossRef CAS.
- C. H. Y. Chen, R. M. Briber, E. L. Thomas, M. Xu and W. J. Macknight, Polymer, 1983, 24, 1333–1340 CrossRef CAS.
- P. C. Lee, L. W. Chen, J. R. Lin, K. H. Hsieh and L. L. H. Huang, Polym. Int., 1996, 41, 419–425 CrossRef CAS.
- P. Dicesare, W. M. Fox, M. J. Hill, G. R. Krishnan, S. Y. Yang and D. Sarkar, J. Biomed. Mater. Res., Part A, 2013, 101, 2151–2163 CrossRef PubMed.
- D. E. Discher, P. Janmey and Y. L. Wang, Science, 2005, 310, 1139–1143 CrossRef CAS PubMed.
- A. J. Engler, S. Sen, H. L. Sweeney and D. E. Discher, Cell, 2006, 126, 677–689 CrossRef CAS PubMed.
| This journal is © The Royal Society of Chemistry 2025 |