
 Open Access Article
 This Open Access Article is licensed under a Creative Commons Attribution-Non Commercial 3.0 Unported Licence
Synthesis, characterization, and application of mixed-addenda silicon vanado tungstate polyoxometalate integrated into nanoporous MIL-101(Cr) for the quick removal of organic dyes from water†
Hosna Malmira,
Farrokhzad M. Zonoz *a,
Mehdi Baghayerib and
Reza Tayebeea
*a,
Mehdi Baghayerib and
Reza Tayebeea
aDepartment of Chemistry, Faculty of Science, Hakim Sabzevari University, Sabzevar, Iran. E-mail: malmir.h921@gmail.com; f.zonoz@hsu.ac.ir; rtayebee@hsu.ac.ir; Tel: +989035940022 Tel: +989122311389 Tel: +989151713477
bResearch Core of Advance Photo-electro Materials (APEM), Faculty of Science, Hakim Sabzevari University, Sabzevar, Iran. E-mail: m.baghayeri@hsu.ac.ir; Tel: +989151735947
First published on 24th March 2025
Abstract
In this work, a polyoxometalate, namely, [SiW9V3O40]−7, was successfully encapsulated into the pores of a MIL-101(Cr) metal organic framework (MOF) via a water-based, eco-friendly impregnation method. This was supported by diverse characterization techniques, such as FT-IR spectroscopy, XRPD, FE-SEM, EDX spectroscopy, N2 adsorption–desorption method, and TGA. The resulting composite, SiW9V3@MIL-101(Cr), denoted as SiW9V3@MC, exhibited a high specific surface area (1463.3 m2 g−1), indicating a large capacity for dye adsorption. The composite demonstrated excellent performance in the removal of cationic dyes, such as Rhodamine B (RhB) and methylene blue (MB), from aqueous solutions. The adsorption efficiency was systematically studied using varying factors, including adsorbent amount, dye concentration, pH level, and temperature. The adsorption kinetics were observed to adhere to a pseudo-second-order model, while the adsorption isotherms conformed to the Langmuir model, suggesting the realization of monolayer adsorption onto the surface of the adsorbent. Furthermore, SiW9V3@ MC displayed exceptional reusability, maintaining its activity and selectivity after multiple adsorption–desorption cycles without significant structural degradation. This stability throughout the experiments underscores its ability as a sustainable and affective adsorbent for waste-water treatment applications. The high adsorption capacity, combined with its environmentally friendly synthesis method, positions SiW9V3@MC as a potential option for efficient water purification methods.
1. Introduction
Azo dyes are extensively used in textile, cosmetics, and leather industries owing to their remarkable water solubility and stability.1–3 However, addressing the environmental challenges posed by these dyes is crucial.4 Many azo dyes are recognized as toxic, non-biodegradable, and potentially carcinogenic, necessitating stringent controls to limit their release into the environment and mitigate their harmful effects.5–7 To effectively manage azo dye contamination, various treatment methods have been implemented. These include separation techniques, such as sedimentation and centrifugation, membrane filtration for purification, and physical adsorption processes to remove contaminants from dye solutions.8–10 Since adsorption methods may provide high-quality water with economically viable processes, they are the most commonly used among the suggested strategies for removing organic dyes and pigments from wastewater.6,11 In this context, identifying an effective adsorption material that can selectively separate and recover source materials while efficiently diminishing organic dyes present in waste-water, with great performance and minimal loss, is essential.12,13 Only a few review studies are available, including one that focuses on the adsorption of cationic and anionic dyes, like the examination of methylene blue (MB) removal using inexpensive adsorbents derived from agricultural solid wastes.14,15Metal organic frameworks (MOFs) are coordination polymers formed by the self-assembly of metal cations using organic linkers. MOFs have garnered significant attention across various fields including catalysis, organic pollutant purification, gas separation and storage, and luminescence. Their exceptional porosity, high surface area, and tunable pore size make them highly desirable for these applications.16–19 Among the numerous MOFs studied, MIL-101(Cr), denoted as MC, stands out owing to its remarkable porous structure, which positions it as a high-capacity adsorbent for water filtration.20 Its open-pore structure allows for the diffusion of large molecules of reactants into the pores owing to the size of its pore windows (1.5 nm) and pores (3.5 nm). This unique structural characteristic improves its ability to absorb both cationic and anionic dyes. Also, its large specific surface area and accessible cavities offer opportunities for additional functionalization.21,22 Modifying the framework allows for improved interactions with specific dye molecules, potentially enhancing the adsorption efficiency. The ability of MC to adsorption is affected by various factors.23 The pH of the solution plays a critical role by altering the charge of both the dye and the adsorbent surface, thereby affecting their interaction.24 Generally, stronger interactions lead to higher dye absorption, promoting deeper engagement between dye molecules and the MOF. The temperature also exerts a complex influence on adsorption; while elevated temperatures can enhance the kinetic energy and diffusion rates, they may also promote exothermic adsorption processes.25 Additionally, higher dye concentrations typically improve adsorption as they increase the availability of dye molecules for interaction with the adsorbent.26 One notable advantage of utilizing MOFs like MC for dye adsorption is their potential for regeneration and reuse following initial dye removal, provided that the structural integrity of the framework is maintained throughout the process.27 This characteristic significantly reduces water pollution by effectively removing organic dyes from aqueous solutions in wastewater treatment applications.28 To fully comprehend MC's dye removal performance, adsorption kinetics, and isotherm, investigations are crucial. The Freundlich and Langmuir isotherms are utilized as common models.29 In conclusion, MC exhibits unique structural characteristics and may be modified to improve its effectiveness in environmental applications, making it a viable material for the physical absorption of dyes.
Polyoxometalates (POMs) are metal oxide clusters composed of various metal cations in high oxidation states such as molybdenum, vanadium, and tungsten combined with anion oxides and heteroatoms such as silicon and phosphorus.30–32 It is easy to vary features including form, size, acidity, load density, and oxidation behavior by modifying the structural elements of POMs and the conditions of their reactions. The chemistry of POMs is of interest, as are some of its uses such as synthesizing novel materials, pharmaceuticals, catalysis, electrocatalysts, photochemistry, analytical chemistry, and biochemistry.33–35
Recent research exploring the embedment of POMs into MOFs, such as MC, seeks to leverage the unique properties of both material types.35 This combination enhances the porosity of MOFs while capitalizing on the ion exchange capabilities, redox properties, and catalytic activity of POMs. Adding POMs can modify the attributes of the MC framework, improving its functionality while maintaining the structural integrity of the MOF. POMs can interact with the MC framework via chemical bonding or encapsulation within pores.36,37 The stability of the POM@MC composite is advantageous for applications in adsorption and catalysis.38 Furthermore, MC is known for its stability under various conditions, which helps preserve the functional capabilities of POMs. POMs are notably recognized for their exceptional catalytic capabilities in redox reactions.38 The synergistic effects arising from the combination of MOFs and POMs can enhance the catalytic performance and enable reactions that would be challenging with either component alone.39 The hybrid structure may exhibit improved adsorption properties for organic molecules, pollutants, or gases due to these synergistic interactions. Additionally, POMs can influence the capacity or selectivity for specific pollutants or dyes. The POM@MC composite effectively merges the advantages of metal organic frameworks and polyoxometalates, resulting in materials with enhanced environmental and catalytic activities. This field of study holds significant potential for developing advanced materials with unique properties tailored for specific applications.40
In this study, a straightforward hydrothermal approach was used to fabricate a novel nanohybrid material comprising Keggin-type polyoxometalate (SiW9V37−) encapsulated within the MC MOF. The resulting SiW9V3@MC composite underwent comprehensive characterization using various analytical techniques, and its effectiveness in adsorbing organic dyes under ambient conditions was systematically evaluated. The findings showed that the SiW9V3@MC nanohybrid acts as a useful adsorbent for quickly eliminating cationic dyes from water-based solutions, specifically focusing on MB and Rhodamine B (RhB). If the nanocomposite changes its morphology due to environmental stressors, this can lead to decreased efficiency in capturing target molecules. The stability of SiW9V3@MC at different pH levels and temperatures affects its structural integrity, which is crucial for maintaining a high specific surface area, porosity, and the availability of active sites for adsorption. Because of its stability, SiW9V3@MC may be used in various wastewater conditions, guaranteeing dependable color elimination in various industries. These compounds are widely used in textiles, pharmaceuticals, and cosmetics, making them common pollutants in wastewater. Both dyes were chosen as model dyes to evaluate the adsorption performance of SiW9V3@MC due to their cationic nature and size. Both dyes are positively charged, making them ideal for studying electrostatic interactions with the highly electronegative SiW9V3 (POM) in the nanocomposite. MB, a smaller molecule, can diffuse faster into porous materials, and RhB, a larger molecule, tests the composite's ability to incorporate bulkier dyes. The adsorption process was thoroughly investigated, considering several parameters including temperature, adsorbent dosage, pH, and dye concentration. These data underscore the potential of SiW9V3@MC as a promising material for environmental applications, particularly in the treatment of wastewater contaminated with organic dyes. The hydrothermal synthesis approach not only facilitates the integration of polyoxometalates into MOFs but also enhances the material's overall performance in dye adsorption.
2. Experimental
2.1 Materials and apparatus
All analytical-grade reagents were used as received from commercial sources without further purification. [A-β-SiW9O34]10−, K7SiW9V3O40, and MIL-101(Cr) were constructed following the methods reported in the existing literature and characterized with the IR spectra.41–43 Elemental analysis was performed using an Integra XL inductively coupled plasma spectrometer. Powder X-ray diffraction (PXRD) data were acquired using an XD-3A diffractometer with Cu Kα radiation at 2θ ranging from 5° to 80°. The IR spectra were recorded using a Shimadzu 8400S FTIR spectrometer with KBr pellets. The BET surface area was obtained in the relative pressure range (P/P0) from 0.385 to 0.985. The total pore volume P/P0 was calculated to be 0.987. Nitrogen adsorption/desorption isotherms of the samples were performed using a Belsorp Mini2 pore size analyzer (Japan) at −196 °C. Thermogravimetric analyses were performed using a Shimadzu TGA-50 thermal analyzer in a flowing air atmosphere at a temperature in the range of 30–700 °C at a heating rate of 10 °C min−1. Before measurement, the sample was annealed at 150 °C for 12 hours. Surface observations were performed using a Hitachi S-4700 FESEM.2.2 Preparation of SiW9V3@MIL-101 (Cr), SiW9V3@MC
In this synthesis, a mixture containing 0.2 g of TPA (0.12 mmol), 0.5 g of SiW9V3 (0.17 mmol), 0.5 g of Cr (NO3)3·9H2O (1.25 mmol), and 0.03 L of deionized water was sonicated for 20 min. The resulting dark-blue suspension was heated at 200 °C for 72 h in a 0.05 L Teflon-lined autoclave. After cooling to ambient temperature, the filtered product was collected, washed several times with ethanol, acetone, and deionized water, and dried at 60 °C for 24 h.In this synthesis method, TPA acts as an organic linker in MIL-101(Cr), stabilizing the porous framework and providing coordination sites for Cr3+. SiW9V3 enhances the adsorption capacity by introducing negatively charged sites and improving electrostatic interactions with cationic dyes, and Cr(NO3)3·9H2O serves as the chromium source, forming the MIL-101(Cr) framework, ensuring high stability, porosity, and structural integrity for encapsulating SiW9V3.
2.3 Adsorption experiments
Solid RhB and MB were dissolved in deionized water to prepare aqueous stock solutions at a concentration of 250 mg L−1 for each cationic dye. Subsequently, these dye solutions were gradually diluted with distilled water. The concentrations of RhB and MB were determined using a UV-vis spectrophotometer, measuring absorbance at wavelengths of 553 nm and 664 nm, respectively. The calibration curves were established by analyzing standard solutions with concentrations ranging from 0.01 to 0.15 g L−1 for RhB and 0.15 to 0.2 g L−1 for MB. To optimize the adsorption conditions, various techniques including primary dye concentration, adsorbent dosage, pH adjustments, and temperature effects were applied. Specifically, 0.03 L of MB and RhB dye solutions with concentrations between 25 and 250 mg L−1 were mixed with 0.03 g of accurately weighed SiW9V3@MC adsorbent to assess the impact of primary dye concentration on adsorption efficiency. To evaluate the influence of pH on the adsorption process, sodium hydroxide (NaOH) or hydrochloric acid (HCl) solutions were added to the RhB and MB solutions, adjusting their initial pH levels within the range of 2 to 10. To achieve the best results, the solution's pH was adjusted to 6. After mixing, the solution was stirred (25 °C, 20 minutes) before being transferred to an Erlenmeyer flask. The SiW9V3@MC adsorbent was then separated using a centrifuge at 300 rpm. The equilibrium concentrations of MB and RhB were subsequently analyzed using a UV-vis spectrophotometer. Finally, the adsorbent was dried and readied for reuse in future adsorption experiments. C0 is the primary concentration of the dye, Ceq is the equilibrium concentration after adsorption, V is the volume of the solution, and m is the mass of the adsorbent used. This comprehensive approach allows for a detailed understanding of the factors influencing dye adsorption and highlights the potential effectiveness of SiW9V3@MC as an adsorbent in wastewater treatment applications.| qe = [(C0 − Ceq.)m − 1] × V | (1) |
Eqn (2) was used to calculate the nanohybrid's dye removal efficiency:
| R = [(C0 − Ct)/C0] × 100 | (2) |
The dye concentration is initially represented by C0 (mg L−1) and finally by Ct (mg L−1), the mass of SiW9V3@MC is defined by m and the dye volume (L) is determined by V in the adsorption process. After adding 0.03 g of SiW9V3@MC, adsorption kinetic experiments were conducted using the same system with 0.03 L of RhB solutions at concentrations of 100, 125, and 150 mg L−1, and 0.03 L of MB solution at concentrations of 150, 175, and 200 mg L−1, at pH = 6. A UV-vis spectrophotometer was used to test the residual concentration of dyes in a predetermined time interval. Under the optimized conditions, RhB and MB adsorption isotherms were investigated on nanocomposites. The dye concentration varied from 0.025 to 0.2 g L−1 with 0.03 g nanocomposite.
3. Results and discussion
3.1 FT-IR spectroscopy
The FT-IR spectra of samples in the wavenumber range of 500–1800 cm−1 are shown in Fig. 1. The band at 1404 cm−1 corresponds to the O–C–O symmetric stretching vibration and that at 1625 cm−1 to the water adsorbed inside MC (Fig. 1(b)). The presence of the benzene ring is confirmed by the bands between 600 and 1600 cm−1, with the C–H deformation vibrations at 750, 884, 1018, and 1160 cm−1, respectively, and the C![[double bond, length as m-dash]](https://www.rsc.org/images/entities/char_e001.gif) C stretching vibration at 1508 cm−1.44 In this spectrum, the peak at 674 cm−1 is related to the Cr–O vibration, and the peaks related to the stretching vibrations of oxygen with metals are usually observed in the range of 400–800 cm−1.45 The FT-IR spectrum for SiW9V3 POM is shown in Fig. 1(a). The stretching bands between 700–1100 cm−1 are characterized as νas (M–Oc–M), νas (M–Ob–M), νas (Si–Oa), and νas (M–Od), (M = W, V) of POM.46 As shown in Fig. 1(c), after the formation of the POM/MC composite, the peaks related to POM and the peaks associated with MC are well preserved in the spectrum of POM/MC.
C stretching vibration at 1508 cm−1.44 In this spectrum, the peak at 674 cm−1 is related to the Cr–O vibration, and the peaks related to the stretching vibrations of oxygen with metals are usually observed in the range of 400–800 cm−1.45 The FT-IR spectrum for SiW9V3 POM is shown in Fig. 1(a). The stretching bands between 700–1100 cm−1 are characterized as νas (M–Oc–M), νas (M–Ob–M), νas (Si–Oa), and νas (M–Od), (M = W, V) of POM.46 As shown in Fig. 1(c), after the formation of the POM/MC composite, the peaks related to POM and the peaks associated with MC are well preserved in the spectrum of POM/MC.
 | ||
| Fig. 1 FTIR spectra of (a) SiW9V3, (b) MC, and (c) SiW9V3@MC. | ||
3.2 X-ray diffraction pattern
The XRD patterns of samples in the 2θ range of 5–80° are shown in Fig. 2. The MC XRD patterns show five prominent peaks at 2θ = 5.2°, 5.6°, 5.9°, 8.4°, and 9.1°, which correspond to the 511, 440, 351, 822, and 911 reflections, respectively.47,48 As shown in Fig. 2, the diffraction peaks corresponding to the obtained MC agree with the standard sample. Both the distinctive peaks of MC and SiW9V3 silicon vanado tungstate are included in the diffraction peaks of the SiW9V3@MC that demonstrate the presence of SiW9V3, and the crystalline characteristics of the parent metal–organic framework are essentially unaltered. The less-ordered structural pattern of XRD of SiW9V3@MC suggests that polyoxometalate has occupied the pore channels of MC and that the electrical environment surrounding the Cr atoms has changed.49 | ||
| Fig. 2 XRD patterns of simulated MC, SiW9V3, and SiW9V3@MC. | ||
3.3 FE-SEM and EDX analysis
The morphology of the samples was made more evident by FE-SEM investigations. The samples' SEM pictures are depicted in Fig. 3. The pristine MC particles' FE-SEM picture is shown in Fig. 3(a). It demonstrates that the MC particles have a high porosity and an asymmetric polyhedral form. These polyhedral crystals have diameters between 0.5 and 2 μm. The shape and morphology of the SiW9V3@MC composite are identical to those of the MC, as shown by the FE-SEM picture in Fig. 3(b). They verify that SiW9V3 anions are incorporated into MC without affecting its crystalline structure. Furthermore, adding SiW9V3 anions caused MC's porosity to decrease. The presence of polyoxometalate anions in POM@MC is confirmed by EDX tests, which show all of the elements of compounds in the samples (Fig. 4). | ||
| Fig. 3 FESEM images of (a) MC and (b) SiW9V3@MC. | ||
 | ||
| Fig. 4 EDX spectra of (a) MC and (b) SiW9V3@MC. | ||
3.4 BET specific surface area investigation
The samples' BET surface area and pore volume were calculated using the N2 adsorption–desorption isotherms at 77 K. The SiW9V3@MC adsorption–desorption isotherms (Fig. 5(a)) demonstrate distinctive type-I behavior consistent with the mesoporous materials and feature an excellent H4 hysteresis loop.50,51 This hysteresis is typically observed in materials composed of aggregates of particles that create slit-like pores, indicative of uniform or non-uniform structures. These observations align with the pore size distribution of both SiW9V3@MC and MC, which was analyzed using the Barrett–Joyner–Halenda (BJH) method based on the adsorption branch. Based on the distribution curves, the samples exhibit a wide pore size distribution in the 1.2–30 nm range. | ||
| Fig. 5 (a) N2 adsorption–desorption isotherm and (b) BJH distribution plots for MC and SiW9V3@MC. | ||
SiW9V3@MC exhibits a reduced pore volume of 0.7394 cm3 g−1 and a BET surface area of 1463.3 m2 g−1, in contrast to MC, which has a pore volume of 1.8786 cm3 g−1 and a BET surface area of 2238.6 m2 g−1. Since SiW9V3 was placed in MOF cages, the encapsulated sample showed a significant reduction in pore volume and surface area in comparison to pristine MC (Table 1).
| Entry | Sample | BET surface area (m2 g−1) | Langmuir surface area (m2 g−1) | Total pore volume (cm3 g−1) | Average pore diameter (nm) |
|---|---|---|---|---|---|
| 1 | MC | 2238.6 | 2378.9 | 1.8776 | 3.355 |
| 2 | SiW9V3@MC | 1463.3 | 1614.6 | 0.7394 | 2.021 |
Moreover, the pore sizes of MC and SiW9V3@MC were 3.355 and 2.021 nm (Fig. 5(a) and Table 1). SiW9V3@MC exhibited a smaller average pore size than that of MC. This diversity allowed the larger SiW9V3 anions to fit into the pores of MC, thereby occupying some of the available pore space.
3.5 Thermogravimetric analyses
The MC and SiW9V3@MC samples were subjected to thermogravimetric analysis (TGA) by heating from 50 to 700 °C at a constant rate of 10 °C per minute. As demonstrated in Fig. 6, the porous framework of MC and SiW9V3@MC could retain up to temperatures 368 and 365 °C, respectively, displaying a similar thermal stability. In contrast, SiW9V3@MC guest molecules lose a significantly smaller weight than MC. The varied weight loss verified that the framework and mixed-addenda silicon vanado tungstate ions worked well together. | ||
| Fig. 6 TGA of samples in an O2 atmosphere. | ||
3.6 Dye adsorption studies
The UV-vis spectra of pure SiW9V3 and MIL-101-(Cr) are shown in Fig. S1.† Pure SiW9V3 provides strong electrostatic interactions due to its high negative charge but lacks a structured porous network. Adsorption is effective but limited by surface area, leading to slower kinetics and possible aggregation. MIL-101(Cr) has a high surface area of 2238.6 m2 g−1 and a large pore size of 3.35 nm, facilitating dye diffusion. It adsorbs cationic dyes effectively, but lacks sufficient electrostatic interaction sites, reducing the efficiency compared to the nanocomposite SiW9V3@MC. Two organic dyes, MB and RhB, which vary in charge and size, were utilized to assess the adsorption capacity of the nanocomposite for removing dyes from polluted water. The distinctive UV-vis adsorption band was used to characterize their adsorption. These bands showed a progressive dye reduction in the solution as the adsorption time increased. Fig. 7(a) and (b) display the dye adsorption by this compound. The findings show that the adsorption peaks for MB and RhB at 665 nm and 550 nm, respectively, vanished after 12 and 18 minutes, demonstrating an excellent adsorption efficiency of 98%. The POM ([SiW9V3O40]7−) carries a high negative charge. The incorporation of the highly electronegative POM significantly increased the adsorption valency of the porous MC material. This enhancement is likely attributed to the abundant negative charges on the POM, which facilitate stronger interactions with the positively charged dyes. The composite maintains a high surface area of 1463.3 m2 g−1, providing more active sites for adsorption. The encapsulation of SiW9V3 into MIL-101(Cr) slightly reduces the pore size from 3.35 nm to 2.02 nm, optimizing it for effective dye molecule trapping. MIL-101(Cr) provides a stable, porous framework. At the same time, POM enhances the surface reactivity, making the nanohybrid highly efficient for dye removal. Consequently, the SiW9V3@MC nanohybrid demonstrated exceptional performance in adsorbing cationic dyes such as MB and RhB. These results underscore the potential of this composite material for effective dye removal in wastewater treatment applications, leveraging its unique structural properties to achieve high adsorption efficiencies. | ||
| Fig. 7 UV-vis spectral variations of dye solutions in water with SiW9V3@MC observed at different time intervals for (a) MB dye and (b) RhB dye. [Dye] = 10 mg L−1, adsorbent: 30 mg (at 25 °C). | ||
3.7 Effects of critical parameters on dye adsorption
The primary pH of the dye solution significantly influences the adsorption capacity of the adsorbent surface. While MC and SiW9V3 compounds exhibit stability under normal conditions, they are prone to hydrolysis in highly alkaline aqueous solutions, which can lead to the release of tungsten, chromium, and vanadium ions. In SiW9V3@MC nanocomposite at lower pH levels (acidic conditions), the SiW9V3 POM, which are located at the nanocomposite surface, undergoes redox reactions to preserve its negative charge. Moreover, at higher pH levels (basic conditions), the adsorbent surface has a negative charge. The underlying mechanism involves electrostatic interactions that the adsorption of cationic dyes such as RhB and MB is primarily governed by electrostatic interactions between the dye molecules (which are positively charged) and the negatively charged sites on the adsorbent.Consequently, adsorption studies for RhB and MB were conducted across a pH range of 2 to 10. To assess the adsorption capacity at various pH levels, 0.03 L of dye solution was mixed with 30 mg of the adsorbent. The pH of the solution was adjusted using hydrochloric acid (HCl) or sodium hydroxide (NaOH). After stirring the mixture for 17 minutes, a UV-vis spectrophotometer was used to determine the remaining dye concentration. According to the results, the stability of the nanocomposite was observed in the blue solution of organic dyes. For RhB and MB in solutions with different pH values, the absorption rate of the nanohybrid was compared, as shown in Fig. 8(a). This nanohybrid works in a wide range of pH.
 | ||
| Fig. 8 Influence of (a) pH, (b) adsorbent dosage, (c) dye concentration, and (d) reaction temperature on the elimination of MB and RhB dyes using nanocomposite adsorbents. | ||
It is essential for the absorption process of primary adsorbent doses such as wastewater treatment. Applying the same parameters, 30 mL of dye solution at a concentration of 50 mg L−1 at pH = 6 for RhB and 0.03 L dye solution (0.1 g L−1) at pH 6 for MB, the effect of adsorbent dose in the mass range of 10 to 40 mg was checked. According to Fig. 8(b), the removal efficiency increased with the increase in adsorption from 0.01 to 0.03 g and was affected by increasing the adsorbent concentration to 0.04 g. According to this profile, 30 mg of adsorbent could provide more accessible adsorption sites and a sufficiently large surface area. The flux (concentration gradient) between the adsorbent and the adsorbate may have a splitting impact on this. Therefore, 30 mg was determined to be the appropriate adsorbent dosage. It was investigated how dye removal was affected by the initial dye concentration. The experiments used 30 mL dye solution, pH 6, and different dye concentrations (5, 10, 20, 30, and 40 mg L−1) with MB and RhB at 30 mg L−1.
As illustrated in Fig. 8(c), removal decreased as the primary dye concentration enhanced, because the number of active sites on the adsorbent that are available for dye elimination declines as concentration rises. The adsorption studies were conducted at various temperatures, precisely 25, 35, 45, 55, 65, and 75 °C, as displayed in Fig. 8(d). The adsorption rate increases as the temperature rises, indicating that the process is endothermic and spontaneous. This may increase the dye mobility as the temperature rises.52 It is likely that an increasing number of molecules will gain adequate energy to interact with the active sites on the surface. Additionally, a rise in temperature could cause the internal structure of SiW9V3@MC to expand, enabling larger dye molecules to infiltrate more deeply.
Fig. 9 illustrates how the adsorption process is influenced by the amount of SiW9V3 loaded into the SiW9V3@MC adsorbent. The loading amount of SiW9V3 in MIL-101(Cr) was determined by evaluating its influence on the dye adsorption efficiency for RhB and MB, as shown in Fig. 9. The key steps in determining the optimal loading are: different weight percentages (18 wt%, 29 wt%, 37 wt%, and 50 wt%) of SiW9V3 were incorporated into MIL-101(Cr). The adsorption efficiency was measured for each loading level. The adsorption efficiency increased from 85% (MB) and 80% (RhB) at 18 wt% to 100% at 29 wt%, indicating an optimal loading level. Further increasing the SiW9V3 content to 37% and 50% reduced the adsorption efficiency, probably due to the blocked MIL-101(Cr) pores, reducing available active sites. Excess SiW9V3 aggregation limits dye accessibility. To ensure the maximum dye removal efficiency, 29 wt% was identified as the ideal loading amount to balance high electrostatic interaction and sufficient pore availability.
 | ||
| Fig. 9 Influence of different amounts of POMs loaded into MC on the elimination of RhB and MB dyes. | ||
An analysis of the results obtained using the synthesized nanocomposite compared with several reported adsorbents for removing dye pollutants is presented in Table 2. It is evident that, considering factors such as adsorption time, starting concentration of the dye, and overall efficiency of adsorption, the current procedure demonstrates superior effectiveness. Notably, traditional adsorbents often require longer reaction times than the SiW9V3@MC nanocomposite. The polyanion SiW9V3, characterized by its abundant anionic groups within the composite, exhibits a strong affinity for the cationic charges present in dyes such as MB. The high efficiency of adsorption of SiW9V3@MC can be attributed to the synergistic interactions between MC and the polyanion SiW9V3.
| Adsorbent | Dye pollutant | Concentration of dye (mg L−1) | Removal yield (%) | Time (minutes) | Ref. |
|---|---|---|---|---|---|
| H6P2W18O62@Cu3(BTC)2 | MB | 20 | 80 | 60 | 53 |
| PV2Mo10/M (membrane) | MB | 20 | 100 | 48 h | 54 |
| P2W18@MIL-101 (Cr) | MB | 25 | 100 | 0.5 | 55 |
| RhB | 25 | 100 | 2 | ||
| P2W18O62@Fe3O4/MIL-101(Fe) | MB | 35 | 100 | 9 | 56 |
| RhB | 35 | 100 | 40 | ||
| H3PW12O40/ZIF-8 | MB | 60 | 100 | 30 | 57 |
| PW11V@MIL-101(Cr) | MB | 10 | 98 | 60 | 58 |
| RhB | 10 | 60 | 60 | ||
| MoS2@ MIL-101 (Cr) | RhB | 20 | 90 | 10 | 59 |
| Fe3O4/reduced graphene oxide | RhB | 5 | 91 | 120 | 60 |
| PW12@MIL-101(Fe) | MB | 100 | 100 | 30 | 61 |
| SiW9V3@MIL-101(Cr) | MB | 10 | 100 | 12 | This work |
| RhB | 10 | 100 | 18 |
As shown in Fig. 10, the samples were examined for their adsorption abilities with the UV-vis time-dependent adsorption spectra. These materials had removal efficiencies of 25–100% for MB dyes and 22–100% for RhB dyes over extended adsorption durations of 1 to 70 minutes and 4 to 70 minutes, respectively. For cationic RhB and MB dyes, the hybrid nanomaterial has far higher removal efficiencies than bare materials. Therefore, investigating the nanohybrid as an effective adsorbent for cationic MB and RhB dyes is still essential.
 | ||
| Fig. 10 Adsorption yields of MB and RhB dyes with the components of the POM/MC. | ||
3.8 Adsorption kinetics
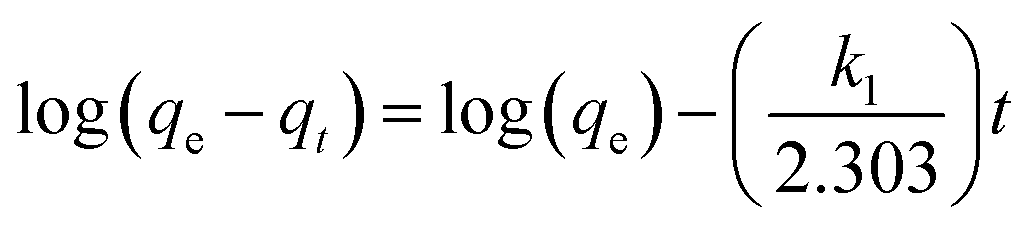
To optimize the parameters for removing contaminants from wastewater, understanding the adsorption kinetics is essential, as it provides insights into the adsorption mechanisms and rates. Ultimately, determining the rate at which adsorption occurs for a specific system is a critical aspect of designing an effective adsorption system. In this study, adsorption kinetics were investigated to develop a rapid and efficient model. Two kinetic models, namely the pseudo-first-order (PFO) and pseudo-second-order (PSO) models, were applied to analyze the experimental data and examine the governing mechanisms of the adsorption process, including chemical reactions and mass transfer dynamics. The pseudo-first-order (PFO) equation is expressed as follows:
 | (3) |
| Dye | qe,exp (mg g−1) | PFO kinetic | PSO kinetic | ||||
|---|---|---|---|---|---|---|---|
| k1 (1/min) | qe,cal (mg g−1) | R12 | k2 (mg g−1 min−1) | qe,cal (mg g−1) | R22 | ||
| MB | |||||||
| 150 | 146.8 | 0.06 | 12.42 | 0.5856 | 0.007 | 151.51 | 0.9998 |
| 175 | 170.2 | 0.04 | 23.57 | 0.7531 | 0.004 | 172.41 | 0.9995 |
| 200 | 192.2 | 0.01 | 36.59 | 0.4970 | 0.003 | 196.07 | 0.9993 |
![[thin space (1/6-em)]](https://www.rsc.org/images/entities/char_2009.gif) |
|||||||
| RhB | |||||||
| 100 | 95.3 | 0.04 | 33.78 | 0.7740 | 0.002 | 101.01 | 0.9980 |
| 125 | 117 | 0.04 | 31.5 | 0.8967 | 0.002 | 123.45 | 0.9979 |
| 150 | 131.3 | 0.05 | 44 | 0.8954 | 0.001 | 149.25 | 0.9942 |
The correlation coefficient R12 values for MB dye ranged from 0.5856 to 0.4970, while those for RhB ranged from 0.7740 to 0.8954.
The pseudo-second-order (PSO) model equation is as follows:
 | (4) |
Fig. 11 and 12 depict the relationship between t/qt and t, and the findings are presented in Table 3. The data demonstrate that the adsorption of MB and RhB by the compound exhibits linear correlations between t/qt and t, with high correlation coefficients (R22 = 0.9993–0.9998 for MB and R22 = 0.9942–0.9980 for RhB). The correlation coefficient (R2) for the PSO model exceeded 0.99, indicating strong significance. The correlation coefficients for the PSO model exceeded 0.99, indicating strong significance, whereas the PFO model did not perform adequately. Moreover, the calculated qe,cal values derived from the PSO model showed significantly better agreement with the experimental qe,exp values than those obtained from the PFO model. These findings suggest that the PSO model provides a more accurate representation of the adsorption process, indicating that the adsorption of RhB and MB on SiW9V3@MC follows second-order kinetics. The low R2 values in the PFO model indicate that it cannot accurately describe the adsorption kinetics, confirming that adsorption is primarily chemisorptive rather than physisorption. The pseudo-second-order model fitted all adsorption processes better than the pseudo-first-order model in terms of correlation factor (R2). The fitting degree is high (R2 > 0.99), which proves that the adsorption rate is controlled by the chemisorption mechanism (e.g., hydrogen bond). Methylene blue shows higher adsorption capacity than Rhodamine B, likely because its smaller molecular size allows for better penetration into the adsorbent's structure. Rhodamine B, due to its larger molecular size, experiences more diffusion limitations, resulting in a lower adsorption rate than that of MB. The differences in adsorption rates across dye concentrations highlight strong electrostatic interactions between the negatively charged SiW9V3@MC surface and cationic dyes, making it a promising adsorbent for wastewater treatment. In conclusion, understanding these kinetic models is crucial for optimizing adsorption systems in wastewater treatment applications, allowing for more effective removal of contaminants through tailored operational parameters.
 | ||
| Fig. 11 Influence of the contact time and initial dye concentration on the uptake of (a) MB and (b) RhB onto SiW9V3@MC. | ||
 | ||
| Fig. 12 PSO kinetics for dye adsorption: (a) MB and (b) RhB. | ||
3.9 Adsorption isotherm
Adsorption isotherms are essential for elucidating the interactions between adsorbed dye molecules and adsorbents. Understanding the optimal relationship between the dye concentration in solution (liquid phase) and its adsorption onto the adsorbent is critical. Different isotherm models such as the Freundlich, Temkin, and Langmuir adsorption isotherms were examined in adsorption studies to interpret the experimental data effectively.62The most commonly used Langmuir isotherm model shows that adsorption occurs at a specific homogeneous place within the adsorbent. This model is mathematically represented by the following equation:
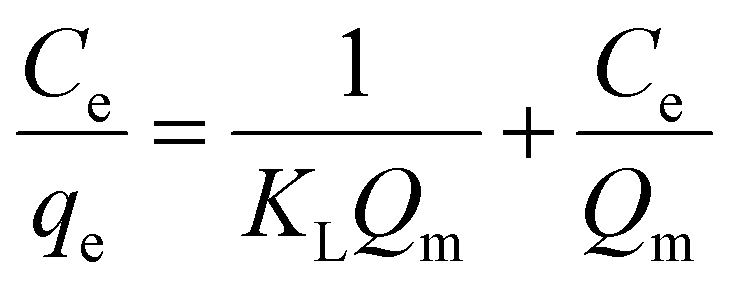 | (5) |
Table 4 displays the adsorption parameters including Ce, which represents the equilibrium concentration of the dye solution (mg L−1), KL, representing the Langmuir constant (mg L−1), Qm, indicating the maximum adsorption capacity (mg g−1), and linear correlation coefficients R2. For SiW9V3@MC, the maximum adsorption capacities for MB and RhB were found to be 188.67 mg g−1 and 167.06 mg g−1, respectively, highlighting the remarkable adsorption capabilities of this magnetic nanohybrid. Notably, MB exhibited a higher adsorption capacity than that of RhB, which may be attributed to the larger molecular size of RhB than MB. The Freundlich isotherm equation is expressed as follows:
| Qe = KFC1/ne | (6) |
| Dye | Langmuir | Freundlich | Temkin | ||||||
|---|---|---|---|---|---|---|---|---|---|
| R2 | KL (L m−1) | Qm (mg g−1) | R2 | KF (mg g−1) | n (mg L−1) | R2 | KT | B1 | |
| MB | 0.9890 | 0.4 | 188.67 | 0.9765 | 1.7364 | 2.4 | 34.195 | 66.42 | 0.9778 |
| RhB | 0.9891 | 0.3 | 167.06 | 0.9806 | 1.6817 | 3.17 | 23.9905 | 49.96 | 0.9801 |
As illustrated in Fig. S2,† the linear regression for the Langmuir model exhibited a significantly better fit with R2 = 0.9890 for MB and R2 = 0.9891 for RhB than that of the Freundlich model with R2 = 0.9765 for MB and R2 = 0.9806 for RhB. Consequently, the adsorption behavior of the compound towards MB and RhB was more accurately described by the Langmuir isotherm model, suggesting that the adsorption process for both dyes on the compound is monolayer in nature.63 In contrast, the Freundlich and Temkin models, which are more suited for heterogeneous surfaces and multi-layer adsorption, show lower fit coefficients in this instance. This indicates that the adsorption process is not following the more complex dynamics these models represent, reinforcing the conclusion that the adsorption sites on SiW9V3@MC behave uniformly, facilitating monolayer coverage. Parameters such as contact time, adsorbent dosage, and initial dye concentrations can be fine-tuned to achieve maximum adsorption efficiency, utilizing the finite number of sites effectively. In conclusion, the strong fit of the Langmuir isotherm not only validates the potential of SiW9V3@MC in wastewater treatment applications but also offers a pathway to optimize the adsorption process for effective dye removal, potentially transforming treatment approaches for industries dealing with dye-laden effluents.
The Temkin equation is stated as follows:
 | (7) |
Because this isotherm ignores both very low and high concentration values, it assumes: (a) up to the maximal binding energy, the adsorption is characterized by a uniform distribution of binding energies, and also (b) because of adsorbent–adsorbate interactions, the heat of adsorption reduction for all molecules in the layer is linear instead of logarithmic.3 Here, KT represents the equilibrium binding constant (L mol−1) associated with maximum binding energy, while B1 relates to the heat of adsorption. The findings indicate that the isotherm data for RhB and MB adhered closely to the Langmuir isotherm model (Fig. S2†). These results underscore the significance of selecting appropriate adsorption models to accurately describe dye removal processes in wastewater treatment applications.
3.10 Recyclability and sustainability of the nanocomposite SiW9V3@MC
The ability to reuse nanocomposites is an essential aspect for their effective application in eliminating colored contaminants from wastewater. Some parameters including structural stability, efficient adsorption–desorption process, high electrostatic interaction, reduced operational costs, reusability, and scalability determine the effectiveness of the SiW9V3@MC and among them, structural stability plays the most important role. To evaluate the reusability of the SiW9V3@MC nanocomposite, cyclic tests were conducted using a mixture of ethanol and water as desorption solvents, along with a 0.1 M NaCl solution. In each cycle, 0.03 g of the adsorbent was added to 0.03 L of a colored solution at a concentration of 0.05 g L−1 and stirred for 25 minutes. The adsorbent was then recovered using the waste solvents including water, ethanol, and NaCl, rinsed several times with deionized water, and dried for reuse. As illustrated in Fig. 13(a), the adsorbent maintained its ability to remove up to 98% of both MB and RhB across all three cycles. The stability of the nanocomposite was further confirmed through analyses of SEM images, FT-IR spectra, and XRD patterns after three cycles, presented in Fig. 13(b)–(d). These results indicate that the structural integrity of the SiW9V3@MC nanocomposite remains intact under reaction conditions and is not adversely affected by the reactants. Overall, these findings demonstrate that the SiW9V3@MC nanocomposite is not only effective in removing colored pollutants, but it also exhibits excellent reusability, making it a promising candidate for sustainable waste-water treatment applications. | ||
| Fig. 13 (a) Reusability of SiW9V3@MC for the elimination of MB. (b) SEM images, (c) FT-IR spectrum, and (d) XRD pattern of the fresh and recovered nanohybrids after three runs. | ||
4. Conclusion
In this study, we successfully synthesized a novel nanocomposite, SiW9V3@MC, using a straightforward one-step hydrothermal method. Following comprehensive characterization, we investigated its application in the adsorption and elimination of organic dyes, specifically MB and RhB. The influence of various factors affecting adsorption was explored, including adsorbent dosage, dye concentrations, pH levels, temperatures, and contact time. High adsorption capacity, adsorption kinetics, adsorption isotherms, environmental suitability, and reusability showed that the SiW9V3@MC nanocomposite demonstrated remarkable adsorption efficiency for the elimination of MB and RhB dyes. The SiW9V3@MC nanocomposite has high adsorption capacity with a maximum of 188.67 mg g−1 for MB and 167.06 mg g−1 for RhB, which indicates strong potential for dye removal from aqueous solutions. The adsorption kinetics of the nanocomposite for these cationic dyes was also analyzed. The adsorption followed a pseudo-second-order model, suggesting a chemisorption process that may involve chemical interactions between the dye molecules and the adsorbent. The adsorption data closely fit the Langmuir isotherm model, implying that the adsorption occurs on a homogenous surface, with a monolayer coverage of dye molecules. The adsorbent performs well across a wide range of pH levels (pH 2–10), ensuring applicability under diverse wastewater conditions. The SiW9V3@MC nanocomposite exhibited excellent reusability, maintaining high efficiency (up to 98%) across multiple adsorption–desorption cycles, underscoring its potential for sustainable environmental applications. These findings emphasized the innovative combination of polyoxometalates and metal organic frameworks for enhancing the material's performance in water treatment applications. This research highlights the potential of this nanocomposite for practical applications in wastewater treatment and underscores its effectiveness in addressing environmental challenges associated with dye pollution.Data availability
The authors confirm that the data supporting the findings of this study are available within the article and/or its ESI.†Conflicts of interest
There are no conflicts to declare.References
- J. Sokolowska-Gajda, H. S. Freeman and A. Reife, Dyes Pigm., 1996, 30, 1–20 CrossRef CAS.
- I. Kabdaşli, O. Tünay and D. Orhon, Water Sci. Technol., 1999, 40, 261–267 Search PubMed.
- C. Yang, S. Wu, J. Cheng and Y. Chen, J. Alloys Compd., 2016, 687, 804–812 CrossRef CAS.
- L. Sun, S. Hu, H. Sun, H. Guo, H. Zhu, M. Liu and H. Sun, RSC Adv., 2015, 5, 11837–11844 RSC.
- M. T. Yagub, T. K. Sen, S. Afroze and H. M. Ang, Adv. Colloid Interface Sci., 2014, 209, 172–184 CrossRef CAS PubMed.
- Y. Wang, J. Wu, W. Zhang, L. Zhong, D. Zhang, S. Yan and J. Shi, React. Chem. Eng., 2024, 1276–1291 RSC.
- X. An, Y. Wang, C. Yu and X. Hu, J. Hazard. Mater., 2024, 480, 136414 CrossRef CAS PubMed.
- A. Barbary, C. Djian-Caporalino, A. Palloix and P. Castagnone-Sereno, Pest Manage. Sci., 2015, 71, 1591–1598 CrossRef CAS PubMed.
- P. Bhomick, A. Supong and D. Sinha, Int. J. Hydrol., 2017, 1, 91–92 Search PubMed.
- X. Sun, M. Mao, K. Lu, Q. Hu, W. Liu and Z. Lin, J. Hazard. Mater., 2022, 424, 127585 CrossRef CAS PubMed.
- C.-C. Huang and Y.-J. Su, J. Hazard. Mater., 2010, 175, 477–483 CrossRef CAS.
- S. Farhadi, F. Mahmoudi, M. M. Amini, M. Dusek and M. Jarosova, Dalton Trans., 2017, 46, 3252–3264 RSC.
- B. Xu, Z. Lin, F. Li, T. Tao, G. Zhang and Y. Wang, Proc. Natl. Acad. Sci. U. S. A., 2024, 121, e2317702121 CrossRef PubMed.
- M. A. M. Salleh, D. K. Mahmoud, W. A. W. A. Karim and A. Idris, Desalination, 2011, 280, 1–13 CrossRef CAS.
- N. A. Khan, Z. Hasan and S. H. Jhung, J. Hazard. Mater., 2013, 244, 444–456 CrossRef PubMed.
- Y.-R. Chen, K.-H. Liou, D.-Y. Kang, J.-J. Chen and L.-C. Lin, Langmuir, 2018, 34, 4180–4187 CAS.
- Y.-Z. Chen, R. Zhang, L. Jiao and H.-L. Jiang, Coord. Chem. Rev., 2018, 362, 1–23 CAS.
- M. Wang, Y. Yue, Y. Wang, X. Mou, R. Chang, Z. Chen, R. Lin, J. Zhao and Y. Ding, J. Energy Chem., 2022, 69, 541–554 CAS.
- S. Liu, A. M. Ndago, B. Chen, S. Han, W. Chen, J. Zhang and X. Zheng, J. Water Process Eng., 2025, 70, 107009 Search PubMed.
- J. Hermannsdörfer and R. Kempe, Synfacts, 2011, 2011, 1142 Search PubMed.
- E. Naseri and R. Khoshnavazi, RSC Adv., 2018, 8, 28249–28260 CAS.
- A.-A. Hoseini, S. Farhadi, A. Zabardasti and F. Siadatnasab, RSC Adv., 2020, 10, 40005–40018 CAS.
- T. K. Vo, T. P. Trinh, V. C. Nguyen and J. Kim, J. Ind. Eng. Chem., 2021, 95, 224–234 CAS.
- S. Karmakar, D. Roy, C. Janiak and S. De, Sep. Purif. Technol., 2019, 215, 259–275 CAS.
- T. Wang, P. Zhao, N. Lu, H. Chen, C. Zhang and X. Hou, Chem. Eng. J., 2016, 295, 403–413 CAS.
- L. Wu, M. Zhao, X. Xin, Q. Ye, K. Zhang and Z. Wang, Molecules, 2023, 28, 5530 CAS.
- Y. Tan, Z. Sun, H. Meng, Y. Han, J. Wu, J. Xu, Y. Xu and X. Zhang, Powder Technol., 2019, 356, 162–169 CrossRef CAS.
- E. Gökırmak Söğüt, ChemistrySelect, 2023, 8, e202205000 CrossRef.
- S. Cheng, Y. Li, Z. Yu and Y. Su, Sep. Purif. Technol., 2025, 354, 128985 CrossRef CAS.
- B. Xu, Y. Wei, C. L. Barnes and Z. Peng, Angew. Chem., Int. Ed., 2001, 40, 2290–2292 CAS.
- D. L. Long, R. Tsunashima and L. Cronin, Angew. Chem., Int. Ed., 2010, 49, 1736–1758 CAS.
- L. Cronin and A. Müller, Chem. Soc. Rev., 2012, 41, 7333–7334 CAS.
- S. Vanhaecht, G. Absillis and T. N. Parac-Vogt, Dalton Trans., 2012, 41, 10028–10034 CAS.
- F. M. Zonoz, Electrocatalysis, 2016, 7, 215–225 CAS.
- X. Liu, J. Luo, X. Chen, Y. Yang and S. Yang, Chem. Res. Chin. Univ., 2017, 33, 268–273 CAS.
- J. Juan-Alcañiz, E. V. Ramos-Fernandez, U. Lafont, J. Gascon and F. Kapteijn, J. Catal., 2010, 269, 229–241 Search PubMed.
- Y. Liu, C. Tang, M. Cheng, M. Chen, S. Chen, L. Lei, Y. Chen, H. Yi, Y. Fu and L. Li, ACS Catal., 2021, 11, 13374–13396 CAS.
- F. Abbasi, J. Karimi-Sabet, Z. Abbasi and C. Ghotbi, J. Cleaner Prod., 2022, 347, 131168 CAS.
- Y. Wang, Y. Xie, M. Deng, T. Liu and H. Yang, Eur. J. Inorg. Chem., 2021, 2021, 681–687 CAS.
- S. Ribeiro, C. M. Granadeiro, P. Silva, F. A. A. Paz, F. F. De Biani, L. Cunha-Silva and S. S. Balula, Catal. Sci. Technol., 2013, 3, 2404–2414 CAS.
- G. Herve and A. Teze, Inorg. Chem., 1977, 16, 2115–2117 CrossRef CAS.
- F. Bannani, H. Driss, R. Thouvenot and M. Debbabi, J. Chem. Crystallogr., 2007, 37, 37–48 CrossRef CAS.
- L. Bromberg, Y. Diao, H. Wu, S. A. Speakman and T. A. Hatton, Chem. Mater., 2012, 24, 1664–1675 CrossRef CAS.
- K. Yang, Q. Sun, F. Xue and D. Lin, J. Hazard. Mater., 2011, 195, 124–131 CrossRef CAS.
- M. K. Trivedi, R. M. Tallapragada, A. Branton, D. Trivedi, G. Nayak, O. Latiyal and S. Jana, Powder Metall. Min., 2015, 4, 1–4 Search PubMed.
- F. Hajizadeh, F. M. Zonoz, S. Duval, B. Maleki and A. Amiri, J. Mol. Struct., 2021, 1224, 129003 CrossRef CAS.
- O. Lebedev, F. Millange, C. Serre, G. Van Tendeloo and G. Férey, Chem. Mater., 2005, 17, 6525–6527 CrossRef CAS.
- Y. Zhang, J. Wan, Y. Wang and Y. Ma, RSC Adv., 2015, 5, 97589–97597 RSC.
- D. A. Islam, A. Chakraborty and H. Acharya, New J. Chem., 2016, 40, 6745–6751 RSC.
- A. Aijaz, T. Akita, N. Tsumori and Q. Xu, J. Am. Chem. Soc., 2013, 135, 16356–16359 CrossRef CAS PubMed.
- C. Roch-Marchal, T. Hidalgo, H. Banh, R. A. Fischer and P. Horcajada, Eur. J. Inorg. Chem., 2016, 2016, 4387–4394 CrossRef CAS.
- N. M. Mahmoodi, B. Hayati, M. Arami and C. Lan, Desalination, 2011, 268, 117–125 CrossRef CAS.
- X. Liu, J. Luo, Y. Zhu, Y. Yang and S. Yang, J. Alloys Compd., 2015, 648, 986–993 CrossRef CAS.
- S.-i. Noro, R. Kitaura, M. Kondo, S. Kitagawa, T. Ishii, H. Matsuzaka and M. Yamashita, J. Am. Chem. Soc., 2002, 124, 2568–2583 CrossRef CAS PubMed.
- A. Jarrah and S. Farhadi, Acta Chim. Slov., 2019, 66, 85–102 CAS.
- A. Jarrah and S. Farhadi, J. Solid State Chem., 2020, 285, 121264 CrossRef CAS.
- R. Li, X. Ren, J. Zhao, X. Feng, X. Jiang, X. Fan, Z. Lin, X. Li, C. Hu and B. Wang, J. Mater. Chem. A, 2014, 2, 2168–2173 CAS.
- A. X. Yan, S. Yao, Y. G. Li, Z. M. Zhang, Y. Lu, W. L. Chen and E. B. Wang, Chem.–Eur. J., 2014, 20, 6927–6933 CrossRef CAS PubMed.
- C. Yang, J. Cheng, Y. Chen and Y. Hu, J. Colloid Interface Sci., 2017, 504, 39–47 CrossRef CAS PubMed.
- H. Sun, L. Cao and L. Lu, Nano Res., 2011, 4, 550–562 CrossRef CAS.
- T.-T. Zhu, Z.-M. Zhang, W.-L. Chen, Z.-J. Liu and E.-B. Wang, RSC Adv., 2016, 6, 81622–81630 RSC.
- A. Maleki, B. Hayati, M. Naghizadeh and S. W. Joo, J. Ind. Eng. Chem., 2015, 28, 211–216 CrossRef CAS.
- D. P. Dutta and S. Nath, J. Mol. Liq., 2018, 269, 140–151 CrossRef CAS.
Footnote |
| † Electronic supplementary information (ESI) available. See DOI: https://doi.org/10.1039/d5ra00443h |
| This journal is © The Royal Society of Chemistry 2025 |