 Open Access Article
Creative Commons Attribution 3.0 Unported Licence
Fumed silica-based composite phase change materials with effective electric and magnetic heating abilities for wearable thermotherapy†
Giang Tien Nguyen *a,
Lam Truong Nguyena,
Nhung Tran Thia,
Nguyen Thanh Nhob,
Le Thi Duy Hanha,
Huynh Nguyen Anh Tuana and
Thanh Vy Nguyena
aFaculty of Chemical and Food Technology, Ho Chi Minh City University of Technology and Education (HCMUTE), 1 Vo Van Ngan, Thu Duc, Ho Chi Minh City 700000, Vietnam. E-mail: ntgiang@hcmute.edu.vn
bInstitute of Applied Technology and Sustainable Development, Nguyen Tat Thanh University, 300A, Nguyen Tat Thanh, Ward 13, District 4, Ho Chi Minh City 700000, Vietnam
First published on 11th April 2025
Abstract
In this study, paraffin wax (PW) was combined with fumed silica (FS) as a porous support and Fe3O4-incorporated expanded graphite (EG@Fe3O4) as a thermal conductivity enhancer and multifunctional thermal conversion agent. This combination resulted in the development of PW/FS/EG@Fe3O4 composite phase change materials (CPCMs) with varying PW content (60–80%). FS provided ample space to stabilize a significant amount of PW (up to 75%) without liquid leakage. The crystallization fractions of the confined PW exceeded 97%, outperforming most reported values for other PCMs confined in SiO2-based materials and enabling high phase change enthalpies (e.g., 146.1 J g−1 for the composite with 75% PW). The thermal conductivities of the 60–80% PW CPCMs were significantly enhanced to 2.215–1.395 W (m K)−1, representing an increase of 9.8–6.2 times compared to pristine PW. Additionally, EG@Fe3O4 endowed the CPCMs with electrothermal and magnetothermal conversion capabilities due to the high electrical conductivity of EG and the superparamagnetism of Fe3O4. Experimental testing of the 75% PW composite demonstrated its ability to exceed its melting point under the application of either a DC voltage or an alternating magnetic field. When used as a heat pack, the 75% PW CPCM maintained a consistent heat release within the 50–55 °C range for 12 minutes on a volunteer's back, meeting and surpassing the requirements for high-temperature thermotherapy. Overall, the combination of high thermal conductivity, substantial phase change enthalpy, excellent cycling durability, and multifunctional thermal conversion makes PW/FS/EG@Fe3O4 CPCMs highly promising for practical thermotherapy applications.
1. Introduction
Thermotherapy, a non-invasive therapeutic technique that uses controlled heat to treat various medical conditions, has gained significant attention due to its potential to alleviate pain, enhance blood circulation, and promote tissue healing.1,2 The maintenance of therapeutic temperatures is critical to its efficacy and can be categorized into high level (50–55 °C for 4–6 min), moderate level (40–50 °C for 15–60 min), and low level (35–40 °C for 6–72 h).3,4 Traditional thermotherapy methods, such as hot water bottles and electric heating pads often face challenges in maintaining stable temperatures over extended periods, limiting their effectiveness and safety in clinical and home-care settings.5,6 Advanced methods such as ultrasounds are expensive and require patients not to move during the treatment, which also causes certain limitations.Phase change materials (PCMs), known for their ability to absorb and release large amounts of latent heat during solid–liquid phase transitions, present an innovative solution to these limitations.7,8 PCMs can maintain near-constant temperatures during their phase transition, making them ideal for applications requiring controlled heat delivery. The utilization of PCMs for thermotherapy offers significant advantages, including prolonged heat retention, precise temperature control, adaptability to diverse treatment protocols, and high mobility. Chen et al.9 prepared a functional facemask incorporated with polyethylene glycol (PEG) PCM, which could provide heat at ∼43.5 °C for ∼33 min for the thermotherapy of allergic rhinitis. Lin et al.6 demonstrated that a wearable thermotherapy pack based on paraffin PCM maintained a temperature above 40 °C for 30 min when applied to a volunteer. Similarly, Shao et al.,10 Chen et al.,1 and Zhang et al.11 demonstrated effective thermotherapy methods based on various PCMs. However, pure PCMs are subjected to liquid leakage during solid–liquid phase transitions. Therefore, they always need to be stabilized by impregnation into porous structures or encapsulation in core–shell systems.8,12
Fumed silica (FS) has been commonly utilized as a porous support for stabilizing various PCMs for its high PCM adsorption capacity (70–80%), low cost, high availability, and non-toxicity. The biggest disadvantage of FS-based composite phase change materials (CPCMs) is the low thermal conductivity and infeasible thermal conversion ability, limiting their thermal charging performance.13–15 Indeed, for thermal charging, the FS-based CPCMs need to be placed in elevated-temperature environments such as heated air or heated water, which causes inconveniences or even damages due to the low convection heat transfer of the hot air and the high permeability of hot water. Currently, thermotherapy devices possessing multifunctional thermal conversion abilities (electrothermal and magnetothermal conversion) exhibit highly desired features due to facile usage and effective charging performance. To possess these advanced functions, energy converters (electrothermal and magnetothermal converters) need to be added to CPCMs. Lin et al.6 took advantage of the high thermal and electrical conductivity of expanded graphite (EG) to equip an accelerated electrothermal conversion for paraffin PCM. Gao et al.16 employed Fe3O4-anchored Mxene as a magnetothermal converter for PEG PCM owing to the superparamagnetic nature of Fe3O4. Shen et al.17 employed a carbon aerogel@Fe3O4 as an electrothermal and magnetothermal converter for PEG PCM, achieving multifunctional thermal conversion and storage. Alternatively, graphene,18 graphene aerogel,19 Co nanoparticles/MOF/carbonized melamine foam,4 and polypyrrole-decorated melamine foam (PPy@MF)1 have been utilized as electro/magnetothermal converters in various CPCMs. In the above-mentioned reports, however, the single thermal conversion, i.e., electrothermal conversion, of EG, PPy@MF, graphene, graphene aerogel, and the high cost of multifunctional Fe3O4-anchored Mxene and Co nanoparticles/MOF/carbonized melamine foam thermal converters may greatly limit their practical applications in thermotherapy.
In this work, we demonstrated a facile and low-cost strategy to prepare advanced multifunctional FS-based CPCMs with high thermal conductivity and effective electro/magnetothermal conversion and storage ability for thermotherapy. We used paraffin wax (PW, crystallization temperature ∼53 °C) as a PCM because of its relatively high phase change enthalpy, appropriate phase transition temperature, low cost, and high stability. We first prepared Fe3O4 incorporated-EG (EG@Fe3O4) and then combined it with PW and FS to form PW/FS/EG@Fe3O4 CPCMs with varying PW contents (60, 70, 75, and 80%). In the composites, the porous network of FS stabilized a large amount of PW without liquid leakage. Meanwhile, the electrothermal and magnetothermal conversion was achieved owing to the ultrahigh electric conductivity of EG and the superparamagnetic nature of Fe3O4, respectively. The electro/magneto-converted heat was stored in the CPCMs during the melting of PW and then applied for practical thermotherapy during the crystallization, achieving sustained heat release for a desirable duration. This work provided new insights into the preparation and multifunctional energy conversion and storage of PW/FS/EG@Fe3O4 CPCMs toward wearable thermotherapy applications.
2. Materials and characterization methods
2.1 Materials
Fumed silica (Aerosil 200) was bought from Evonik Operations (German). Expandable graphite was purchased from Sigma Aldrich (US). Paraffin wax (crystallization point ∼53 °C) was purchased from Sinopec Chemical (China). Iron(III) chloride (FeCl3, AR), iron(II) chloride tetrahydrate (FeCl2·4H2O, AR), ammoniac (NH3, 25–28%, AR), absolute ethanol, and hexane (AR) were purchased from Xylong Chemical (China).2.2 Preparation of EG@Fe3O4
First, 0.1714 g FeCl2·4H2O and 0.1398 g FeCl3 were dissolved in a solution of water:ethanol (3.5![[thin space (1/6-em)]](https://www.rsc.org/images/entities/char_2009.gif) :
:![[thin space (1/6-em)]](https://www.rsc.org/images/entities/char_2009.gif) 1 (v/v)) with the assistance of ultrasonication. Then, EG (0.1 g) was added to the solution, and the as-obtained mixture was stirred at ambient temperature for 1 hour using a glass rod. Next, the mixture was raised to 80 °C, and 20 mL of concentrated NH3 solution was slowly added until reaching pH ∼11 while continuing to stir using the glass rod. The black product was collected by filtration and washed with distilled water until reaching neutral pH. Finally, the mixture was dried in an oven at 120 °C for 12 h to gain EG@Fe3O4 with an EG
1 (v/v)) with the assistance of ultrasonication. Then, EG (0.1 g) was added to the solution, and the as-obtained mixture was stirred at ambient temperature for 1 hour using a glass rod. Next, the mixture was raised to 80 °C, and 20 mL of concentrated NH3 solution was slowly added until reaching pH ∼11 while continuing to stir using the glass rod. The black product was collected by filtration and washed with distilled water until reaching neutral pH. Finally, the mixture was dried in an oven at 120 °C for 12 h to gain EG@Fe3O4 with an EG![[thin space (1/6-em)]](https://www.rsc.org/images/entities/char_2009.gif) :
:![[thin space (1/6-em)]](https://www.rsc.org/images/entities/char_2009.gif) Fe3O4 ratio of 1
Fe3O4 ratio of 1![[thin space (1/6-em)]](https://www.rsc.org/images/entities/char_2009.gif) :
:![[thin space (1/6-em)]](https://www.rsc.org/images/entities/char_2009.gif) 1 (w/w).
1 (w/w).
2.3 Preparation of PW/FS/EG@Fe3O4 CPCMs
The preparation of PW/FS/EG@Fe3O4 CPCMs was conducted using a well-known solvent-assisted method.7 First, a predetermined amount of PW was dissolved in hexane. Then, predetermined contents of EG@Fe3O4 and FS were added, and the mixture was stirred at ambient temperature for 2 hours using a glass rod. Afterward, the mixture was raised to 70 °C and stirred with the glass rod for the evaporation of hexane. The resulting sample was further treated in an oven at 70 °C for 12 hours, obtaining PW/FS/EG@Fe3O4 CPCMs with PW contents of 50–80 wt%. For comparison, a composite containing 75% PW and 25% FS was also prepared using the same procedure without the addition of EG@Fe3O4. The detailed compositions of the prepared composites and their abbreviated names are shown in Table 1.| CPCM | Abbreviated name | PW (%) | FS (%) | EG@Fe3O4 (1![[thin space (1/6-em)]](https://www.rsc.org/images/entities/char_2009.gif) : :![[thin space (1/6-em)]](https://www.rsc.org/images/entities/char_2009.gif) 1 w/w) (%) 1 w/w) (%) |
|---|---|---|---|---|
| 60% PW/FS/EG@Fe3O4 | 60% PW | 60 | 26.7 | 13.3 |
| 70% PW/FS/EG@Fe3O4 | 70% PW | 70 | 20.0 | 10.0 |
| 75% PW/FS/EG@Fe3O4 | 75% PW | 75 | 16.7 | 8.3 |
| 80% PW/FS/EG@Fe3O4 | 80% PW | 80 | 13.3 | 6.7 |
| 75% PW/FS | 75% PW/FS | 75 | 25 | 0 |
2.4 Characterization methods
The morphology was observed using scanning electron microscopy (SEM, Hitachi S-4800, Japan). The porous properties were characterized using N2 adsorption–desorption isotherm (MicroActive TriStar II Plus 2.03). The functional groups were scanned using Fourier-transform infrared spectroscopy (FTIR, JASCO FTIR 4600, Japan) within a wavenumber range of 4000–400 cm−1. The crystallization properties were determined using X-ray diffraction (XRD, Empyrean Diffractometer, Panalytical) within a 2θ range of 5–80°. The phase change properties were determined using differential scanning calorimetry (DSC, 214 Polyma, NETZSCH, German), which was performed under N2 gas of 20 mL min−1, a heating rate of 5 °C min−1, and a temperature range from 0 to 80 °C. The thermal stability was analyzed using thermogravimetric analysis (TGA, Labsys Evo TG-DSC 1600 analyzer, Setaram Instrument) within a temperature range of 30–800 °C with a heating rate of 10 °C min−1 under N2 gas of 20 mL min−1. Thermal conductivity was determined by a TPS 3500 instrument (Hot Disk AB, Sweden).3. Results and discussion
3.1 Characterization
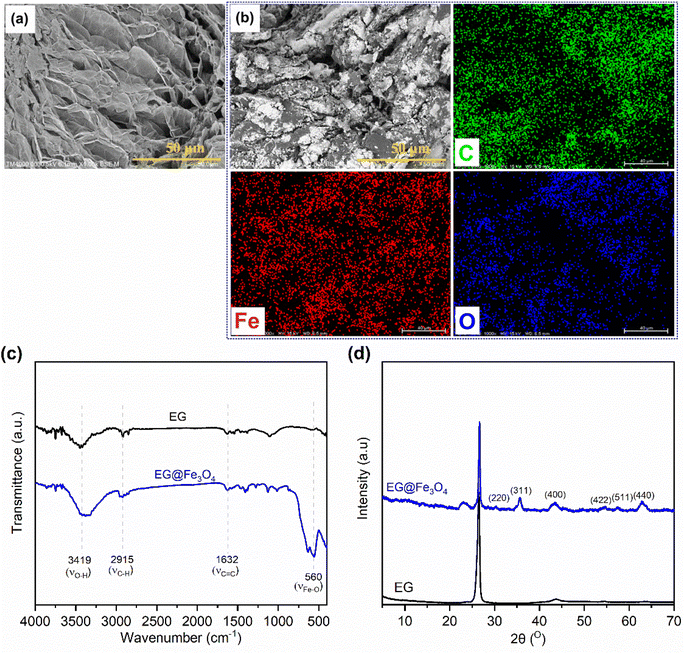
Fig. 1(a and b) exhibits SEM images of pristine EG and the prepared EG@Fe3O4. EG (Fig. 1a) consisted of stacked graphite sheets, forming a three-dimensional (3D) porous structure. After the modification with Fe3O4 (Fig. 1b), the surfaces of EG's sheets were densely attached by Fe3O4 particles, which was further characterized by the presence of Fe and O beside C elements in its corresponding EDS elemental mapping images (Fig. 1b). The FTIR spectrum of EG@Fe3O4 (Fig. 1c) fully exhibited characteristic absorption peaks of pristine EG, i.e., peaks at 3419, 2915, and 1632 cm−1 assigned to vibrations of surface O–H groups, C–H groups, and C![[double bond, length as m-dash]](https://www.rsc.org/images/entities/char_e001.gif) C groups, respectively.20,21 In addition, a new absorption peak at 560 cm−1 appeared, assigned to the vibrations of Fe–O groups.22 The XRD pattern of EG@Fe3O4 (Fig. 1d) also exhibited a characteristic diffraction peak of pristine EG at 26.5° and new peaks at 30.3, 35.8, 43.7, 54.7, 57.6, and 63.1° corresponding to planes (220), (311), (400), (422), (511), and (440) of magnetic Fe3O4 nanoparticles.17,23 Raman spectroscopy results also presented the presence of Fe3O4 in EG (see Section 1 in the ESI†). The SEM, FTIR, and XRD results successfully demonstrated a combination of EG and Fe3O4.
C groups, respectively.20,21 In addition, a new absorption peak at 560 cm−1 appeared, assigned to the vibrations of Fe–O groups.22 The XRD pattern of EG@Fe3O4 (Fig. 1d) also exhibited a characteristic diffraction peak of pristine EG at 26.5° and new peaks at 30.3, 35.8, 43.7, 54.7, 57.6, and 63.1° corresponding to planes (220), (311), (400), (422), (511), and (440) of magnetic Fe3O4 nanoparticles.17,23 Raman spectroscopy results also presented the presence of Fe3O4 in EG (see Section 1 in the ESI†). The SEM, FTIR, and XRD results successfully demonstrated a combination of EG and Fe3O4.
Fig. 2(a and b) exhibits the SEM images of pristine FS at different magnifications, from which it can be seen that FS was composed of SiO2 nanoparticles aggregated into a 3D porous structure. The N2 adsorption–desorption isotherm of FS and its relevant pore size distribution (PSD) are shown in Fig. 3, while the specific textural properties are shown in Table S1.† The surface area of FS was 205 m2 g−1, its pore sizes were in the range of micro and mesopores, and its micro–mesopore volume was 0.95 cm3 g−1. In addition, FS also consisted of macropores within 50–150 nm and a total pore volume of 17 m3 g−1, as obtained from the mercury intrusion porosimetry in our previous report.25 The large pore volume and interconnected system of micro–meso–macro pores of FS provided sufficient space and transport pathways for the infiltration of PCMs. FS was combined with PW and EG@Fe3O4 to form composite phase change materials with electro and magnetothermal conversion and storage ability. Fig. 2c–f shows the SEM images of PW/FS/EG@Fe3O4 CPCMs with 60–80% PW. FS was mixed with EG@Fe3O4 in the CPCMs, and their surfaces were gradually covered with PW with increasing PW contents. The EDS elemental mapping images of 75% PW sample confirmed the presence of all C, O, Fe, and Si elements, as shown in Fig. 2g. The N2 sorption isotherms (Fig. 3a) and corresponding PSDs (Fig. 3b) of 60–80% PW CPCMs exhibited a gradual decrease in N2 adsorption and disappearance of pores, indicating PW was infiltrated in the pores of FS. Raman spectroscopy results also demonstrated the confinement of PW in FS and EG@Fe3O4 pores (see Section 1 in the ESI†). Notably, FS and EG@Fe3O4 could not be seen clearly in the 80% PW CPCM due to the complete covering of PW (Fig. 2f), suggesting there was a surplus amount of PW at this PW content.
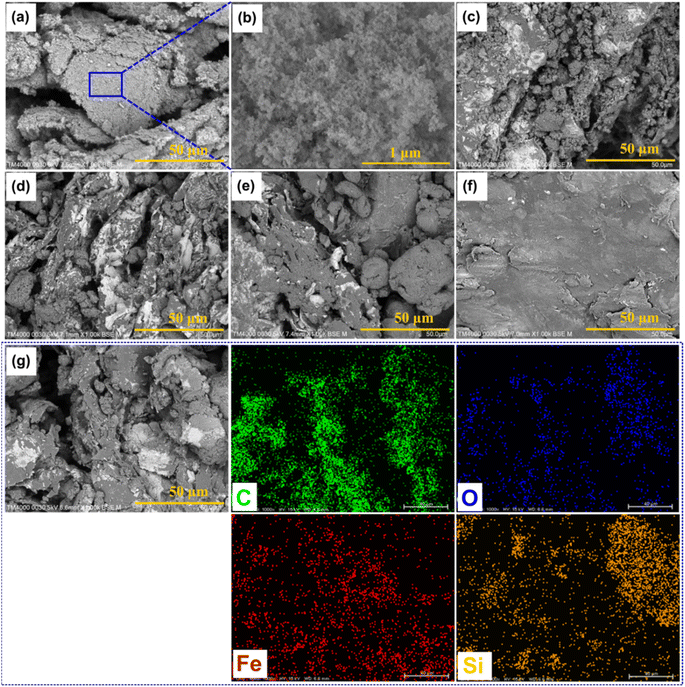 | ||
| Fig. 2 SEM images of (a and b) FS at different magnifications, (c–f) 60, 70, 75, and 80% PW CPCMs, and (g) EDS elemental mapping images of the 75% PW CPCM. | ||
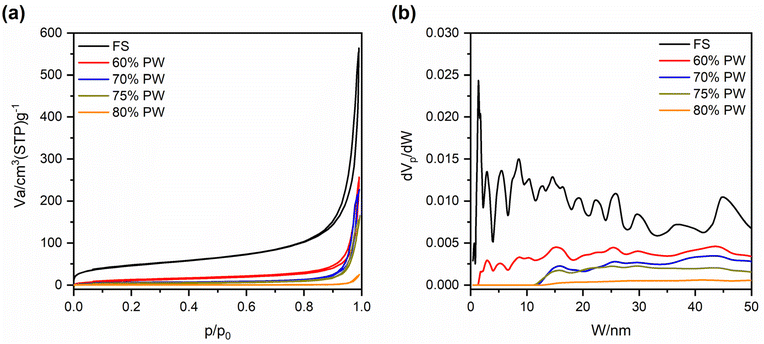 | ||
| Fig. 3 (a) N2 adsorption–desorption isotherms and (b) relevant pore size distribution of pristine FS and 60, 70, 75, and 80% PW CPCMs. Note that the data of pristine FS was taken from our previous report.24 | ||
Fig. 4a exhibits the FTIR spectra of two representative CPCMs (60% and 75% PW) compared to those of pristine PW, FS, and EG@Fe3O4. The two CPCMs fully combined the characteristic absorption peaks of the pristine components. For example, those originating from FS were found at 3419 cm−1 assigned to the stretching vibrations of surface –O–H groups, and 1112, 806, and 466 cm−1 assigned to the asymmetric stretching, symmetric stretching, and bending vibrations of the Si–O–Si groups, respectively FS.13 Meanwhile, the absorption peaks inherited from pristine PW could be seen at 2915, 2846, 1461, and 721 cm−1, assigned to the vibration modes of C–H groups.26 Notably, no new peaks appeared in the spectra of the two CPCMs. Similarly, the XRD patterns of the two CPCMs (Fig. 4b) fully exhibited the characteristic diffraction peaks of pristine PW at 21.5 and 23.9° and of EG at 26.5°. It is noted that the diffraction peaks of Fe3O4 could not be seen clearly in the two CPCMs because of their inherently low intensities. The FTIR and XRD results indicated that FS, PW, and EG@Fe3O4 were physically integrated, and their crystallization properties were intact in the CPCMs.
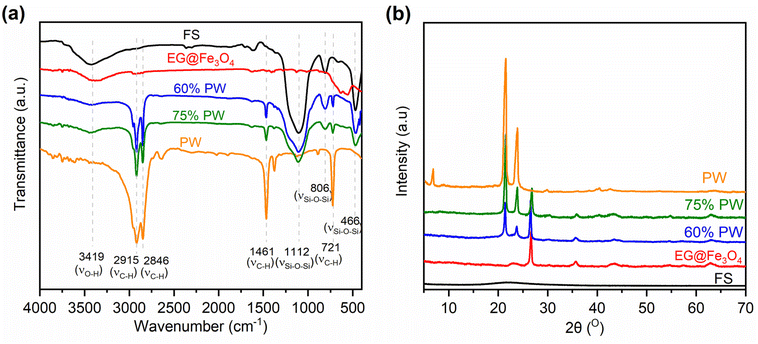 | ||
| Fig. 4 (a) FTIR spectra of pristine FS, EG@Fe3O4, pristine PW, 60% PW, and 70% PW CPCMs, and (b) XRD patterns of the corresponding materials. | ||
3.2 Phase change behaviors
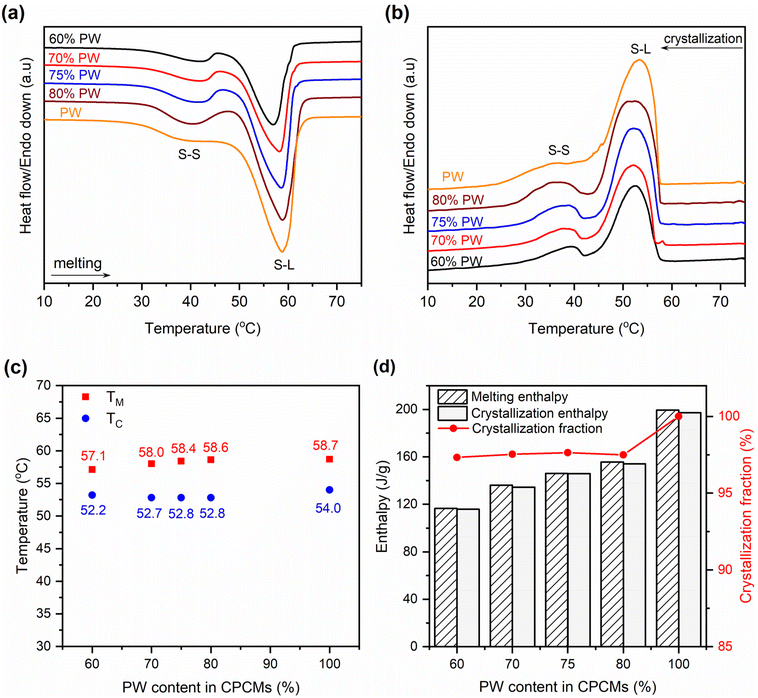
The phase change behaviors of the prepared 60–80% PW CPCMs compared to pristine PW were characterized by DSC, and the obtained thermograms are shown in Fig. 5(a and b). Both pristine PW and the CPCMs showed two peaks during the melting and crystallization processes. The small peaks at lower temperatures were attributed to solid–solid (S–S) phase transitions, while the larger ones at higher temperatures were due to the solid–liquid (S–L) phase transitions of PW,27,28 and the detailed S–L transition temperatures are shown in Fig. 5c. Compared to pristine PW, the 60–80% PW CPCMs exhibited slightly lowered S–L phase transition temperatures of 0.1–1.6 °C during the melting processes and 1.2–1.8 °C during the crystallization processes. This was consistent with previous reports showing that the phase change temperatures of PCMs in the form of CPCMs were reduced due to confinement effects and physical interactions with porous supports.29,30 The lowered phase change temperatures were also observed when other paraffin-based31 and non-paraffin-based PCMs such as stearic acid,24 CH3COONa·3H2O,13 and 1-octadecanol32 were confined in FS.The melting/crystallization phase change enthalpies (ΔHM/ΔHC) of the 60–80% PW CPCMs and pristine PW were presented in Fig. 5d. The CPCMs exhibited lower ΔHM/ΔHC than pristine PW and their ΔHM and ΔHC increased with the increasing PW contents, ranging from 116.5 and 115.8 J g−1 for 60% PW CPCM to 155.6 and 154.2 J g−1 for 80% PW one, respectively. These results could be readily understood as the phase change enthalpies of the CPCMs solely came from the melting and crystallization of PW, while the other components, including FS and EG@Fe3O4, made no contribution. Thus, an increase in PW content in the CPCMs induced greater phase change enthalpies. Another important parameter affecting the phase change enthalpies is the crystallization fraction (F (%)) of the confined PW in CPCMs, which could be calculated using eqn (1):29
 | (1) |
| CPCM | ΔHM (J g−1) | F (%) | TC/TC enhancementa (W per (m K)) per times | Ref. |
|---|---|---|---|---|
| a Thermal conductivity/thermal conductivity enhancement compared to pure PCM.b The 75% PW/FS/EG@Fe3O4 was selected for comparison because it was considered the optimal CPCM (see Section 3.4). | ||||
| 70% 1-octadecanol/FS | 147.2 | 91.2 | — | 32 |
| 70% CH3COONa·3H2O/FS | 132.6 | 86 | 0.560/0.87 | 13 |
| 70% PEG/SiO2 | 0 | 0 | — | 33 |
| 99.4% PW/aerogel | 141.8 | 77.4 | 0.3261/1.4 | 26 |
| 60% PW/nanoscroll | 128.5 | 96.1 | 0.52/2.0 | 28 |
| 74% PW/EG/SiO2 | 103.4 | 84.8 | 2.053/8.5 | 34 |
| 97.5% PW/melamine foam | 130.6 | 87.8 | 0.56/2.0 | 35 |
| 35.2% PW/sepiolite | 60.1 | 94.3 | — | 36 |
| 75% PW/FS/EG@Fe3O4b | 146.1 | 97.6 | 1.648/7.3 | This work |
3.3 Thermal stability, thermal conductivity, leakage resistance, and cycling durability
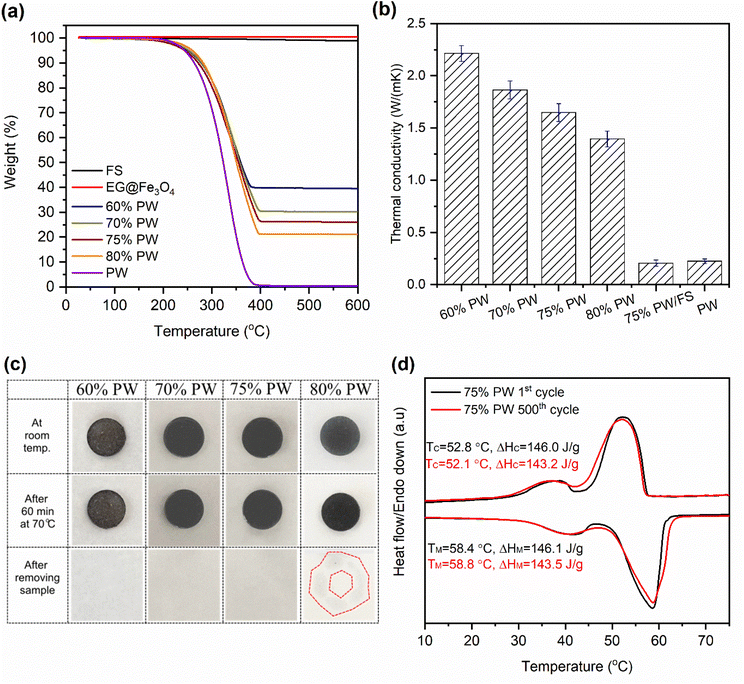
The thermal stability of the prepared 60–80% PW CPCMs compared to pristine FS, PW, and EG@Fe3O4 was analyzed by TGA, and the results are exhibited in Fig. 6a. FS and EG@Fe3O4 showed insignificant weight loss at up to 600 °C, indicative of excellent thermal stability. Meanwhile, PW was decomposed within 271–370 °C with almost 100% weight loss. The CPCMs exhibited better thermal stability than pure PW, characterized by a thermal composition temperature range of approximately 281–399 °C. This phenomenon was due to forces such as capillary and surface tension that hampered the spillover of PW from the pores of FS and EG@Fe3O4 before decomposition, thus promoting the stability of the CPCMs. This result demonstrated that once residing in the FS and EG@Fe3O4 porous networks, the surrounding inorganic supporters improved the thermal stability of PW as it was subjected to extreme conditions (i.e., elevated temperatures).The thermal conductivities of the 60–80% PW/FS/EG@Fe3O4 CPCMs compared to pristine PW are shown in Fig. 6b. Pristine PW exhibited a low thermal conductivity of 0.225 W (m K)−1. Notably, the 60–80% PW CPCMs possessed enhanced thermal conductivities of 2.215–1.395 W (m K)−1, which were 9.8–6.2 times greater than that of pristine PW. Of the components of the prepared PW/FS/EG@Fe3O4 CPCMs, FS was known to have extremely low thermal conductivity (∼0.045 W (m K)−1) because of the absence of a convection factor, caused by the similarity in its pore sizes and the mean free path (70 nm) of air.37,38 Previous reports showed that combining with FS even caused a decrease in the thermal conductivity of PCMs.13,39 Here, for confirmation, a composite containing 75% PW, 25% FS, and 0% EG@Fe3O4 (abbreviated as 75% PW/FS) was prepared and characterized for thermal conductivity. Compared to the thermal conductivity of pristine PW (0.225 W (m K)−1), that of the 75% PW/FS was decreased to 0.207 W (m K)−1 (Fig. 6b), consistently confirming the negative effect of FS on the PCM's thermal conductivity. Fe3O4 particles were also known to have a low thermal conductivity of 0.144–0.18 W (m K)−1.40,41 Therefore, the enhanced thermal conductivity of the prepared PW/FS/EG@Fe3O4 CPCMs was attributed to EG's extremely high thermal conductivity (25–470 W (m K)−1).42–45 This phenomenon was also observed elsewhere, showing thermal conductivity enhancements of 7.16–17.3 times for CPCMs with the addition of 6–15 wt% EG.42–44 As shown in Table 2, the thermal conductivities of PW/FS/EG@Fe3O4 CPCMs were comparable to or even surpassed those of other PW-based CPCMs including PW/aerogel (0.3261 W (m K)−1), PW/nanoscroll (0.52 W (m K)−1), PW/EG@SiO2 (2.053 W (m K)−1), and PW/melamine foam (0.56 W (m K)−1), with the corresponding thermal conductivities shown in the paratheses.
The leakage resistance of the 60–80% PW/FS/EG@Fe3O4 CPCMs was examined by treating them at 70 °C (∼12 °C above their melting points) for 60 min. The CPCMs were subsequently carefully observed for leakage stains, and the digital photos taken during the test are shown in Fig. 6c. The 60–75% PW CPCMs showed unnoticeable leakage after the thermal treatment, indicating good leakage resistance of up to 75% PW. This was due to the confinement of PW in the interconnected pores of FS and EG@Fe3O4 by the capillary and surface tension forces, which were capable of preventing PW from leakage even in its liquid state. Previous reports demonstrated that FS could stabilize up to 70–80% of various PCMs.13–15 In addition, the EG, with its 3D porous network, was also a good adsorbent for PCMs, thus contributing to the adsorption and stabilization of PW.34,46 Notably, the 80% PW CPCM was subjected to liquid leakage, which indicated an excessive PW content.
The prepared PW/FS/EG@Fe3O4 CPCMs were able to retain up to 75% PW without leakage, the 75% PW sample was thus selected as the optimal composite for further investigations. The cycling durability or so-called thermal reliability of the 75% PW was examined for 500 phase change cycles, and the DSC thermograms at the first and 500th cycles are shown in Fig. 6d. The DSC curves showed negligible change after the multiple thermal cycles. The TM and TC were altered by only 0.4 and 0.7 °C, respectively. In addition, the ΔHM and ΔHC after 500 thermal cycles reached 143.5 and 143.2 J g−1, which were only 1.8 and 1.9% lower than those of the first cycles, respectively. These results demonstrated that the 75% PW CPCM possessed excellent cycling durability, making it suitable for long-term utilization.
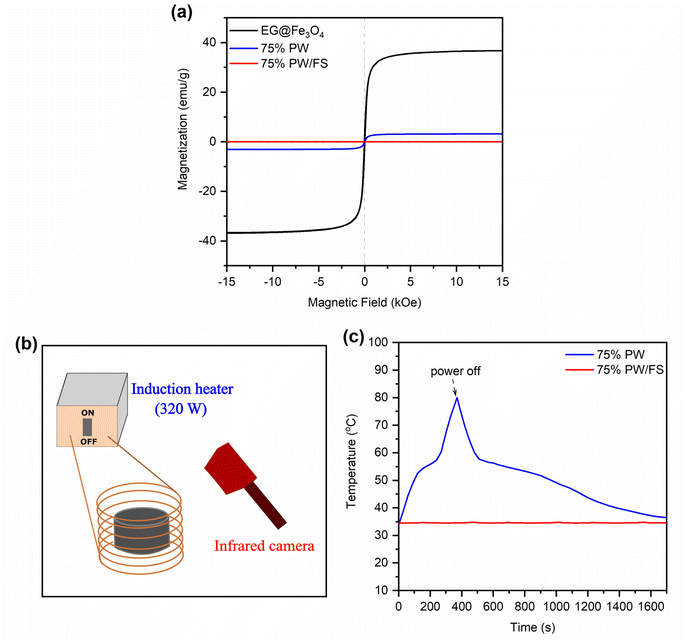
3.4 Magnetothermal conversion and storage
Fig. 7a shows the VSM curves of the prepared 75% PW/FS/EG@Fe3O4 CPCM compared to those of EG@Fe3O4 and 75% PW/FS samples. The EG@Fe3O4 and 75% PW/FS/EG@Fe3O4 CPCM (containing 4.1% Fe3O4) possessed saturation magnetizations of 36.8 and 3.1 emu g−1. In addition, they showed very small coercivity and remanence, indicative of superparamagnetism. Meanwhile, the 75% PW/FS sample exhibited zero saturation magnetization, readily attributed to its non-magnetic nature.Magnetic compounds can be heated in an alternating magnetic field due to the effects of Néel and Brownian relaxation effects.16,47 The combination of CPCMs with magnetic materials allows the CPCMs to convert magnetic energy into heat and store it in the CPCMs due to the high phase change enthalpies, thus providing an effective charging method for the CPCMs. Here, an alternating magnetic field of 320 W was applied to the 75% PW/FS/EG@Fe3O4 CPCM to evaluate the magnetothermal conversion and storage performance (Fig. 7b), and the temperature evolutions during the test are shown in Fig. 7c. The applied magnetic field was effectively converted into thermal energy, making the temperature of 75% PW/FS/EG@Fe3O4 CPCM rapidly increase from 33.8 to 80.1 °C in 167 s. The temperature growth during the test are divided into three phases. In the first phase (33.8–52.5 °C), the CPCM exhibited a fast temperature evolution because the magnetic energy was stored as sensible heat. The second phase (52.5–58.3 °C) was accompanied by the melting of PW, storing the magnetic energy as latent heat, and forming a temperature platform. After the melting was completed, the CPCM went to the last phase (58.3–80.1 °C) where the magnetic energy was again stored as sensible heat, generating rapid temperature evolution. When the magnetic field was switched off, the CPCM exhibited a rapid temperature decrease due to a high-temperature gap with ambient temperture (∼33 °C). A temperature platform could be observed at approximately 55–48 °C during the cooling, indicative of the crystallization (heat release) of the CPCM. For comparison, the 75% PW/FS sample showed no temperature change when applied with the same magnetic power due to its non-magnetism. These results demonstrated good magnetothermal conversion and storage for the prepared 75% PW/FS/EG@Fe3O4 CPCM.
3.5 Electrothermal conversion and storage
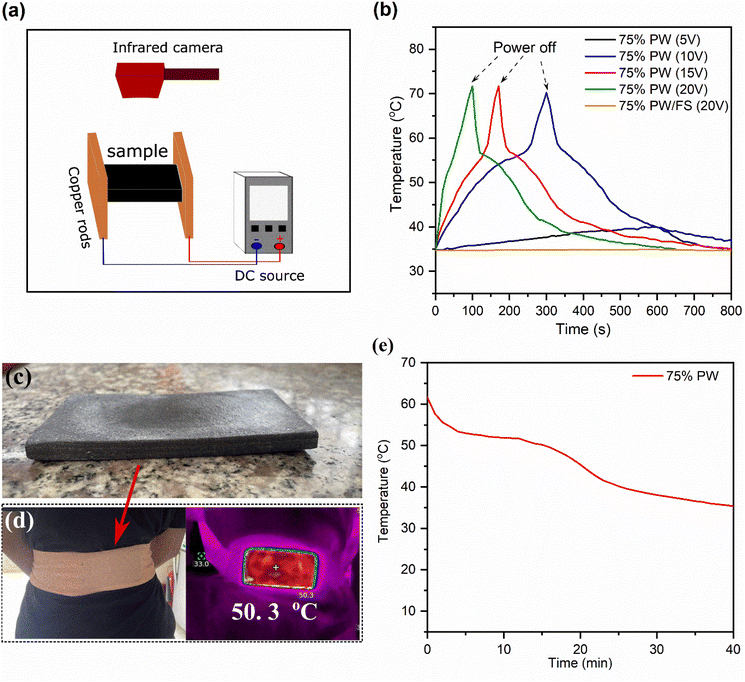
Due to the high availability and low cost of electricity networks worldwide, CPCMs possessing an electrothermal conversion ability can be easily heated by electricity, which is highly satisfactory for thermotherapy applications that require a fast and effective charge. Here, the electrothermal conversion and storage of the 75% PWPW/FS/EG@Fe3O4 CPCM were examined by applying a DC source at different voltages (5–20 V). The temperature evolutions during the experiment were obtained using an infrared camera, as illustrated in Fig. 8a, and the obtained temperature–time curves are exhibited in Fig. 8b. With an applied voltage of 5 V even for 600 s, the temperature of the CPCM only increased from ∼35 to 39.8 °C, which was below the melting temperture of the CPCM. This suggested that 5 V was not sufficient to charge the CPCM. With increasing the applied voltages to 10, 15, and 20 V, the temperatures of the CPCM could surpass its melting point, reaching 70 °C after 300, 161, and 90 s, respectively. The electrothermal conversion ability of the 75% PWPW/FS/EG@Fe3O4 CPCM was attributed to the EG's extremely high electrical conductivity (∼10![[thin space (1/6-em)]](https://www.rsc.org/images/entities/char_2009.gif) 000 S cm−1)48 and complied with Joule's law, which states that an electrical flow passing a material generates heat.1,49 For comparison, the 75% PW/FS showed no temperature evolution even at an applied voltage of 20 V (Fig. 8b) due to the poor conductivity of both PW and FS (∼10−16–10−12 S cm−1).50,51
000 S cm−1)48 and complied with Joule's law, which states that an electrical flow passing a material generates heat.1,49 For comparison, the 75% PW/FS showed no temperature evolution even at an applied voltage of 20 V (Fig. 8b) due to the poor conductivity of both PW and FS (∼10−16–10−12 S cm−1).50,51
The temperature evolutions of the 75% PW/FS/EG@Fe3O4 CPCM at applied voltages of 10, 15, and 20 V are divided into three phases. The first phase (35.0–51.0 °C) was accompanied by the conversion of electric energy into thermal energy, which was stored in the CPCM as sensible heat, leading to a rapid temperature increase. In the second phase (51–56 °C), the converted thermal energy was stored as latent heat during the melting of PW in the CPCM, characterized by a temperature plateau. In the final phase (56–70 °C) after the melting was completed, the CPCM exhibited a rapid temperature increase because the applied energy was stored as sensible heat. After the power was switched off and the material was left to cool naturally at an ambient environment (∼34 °C), its temperature went down quickly and then established temperature plateaus at ∼55–45 °C because of the crystallization (heat release) of PW. These results demonstrated good electrothermal conversion and thermal storage of the 75% PW/FS/EG@Fe3O4 CPCM.
3.6 Practical thermotherapy performance
CPCMs can be applied to thermotherapy applications during their crystallization processes, which release latent heat at nearly constant temperatures for certain durations. In this work, the 75% PW/FS/EG@Fe3O4 CPCM possessed a crystallization temperature of 52.8 °C, thus being applicable for high-temperature thermotherapies that require temperatures within 50–55 °C. To study the practical efficacy, the 75% PW CPCM (30 g) was compacted into a heat pack (110 × 55 × 5 mm) (Fig. 8c) and then electrically charged at 20 V to ∼65 °C to store the melting latent heat. The thermotherapy heat pack can be practically used to treat any body surface requiring a thermal treatment, e.g., the shoulder, the back, or the neck. Here, the heat pack was applied to the back of a volunteer (Fig. 8d), and the temperature variations at the center of the pack's inner face contacting with the volunteer's back were monitored using a thermocouple. As shown in Fig. 8e, the heat pack sustained the temperature within 50–55 °C for 12 min, which was due to the release of heat during the crystallization of PW. Compared to the high-temperature thermotherapy criteria that require sustaining temperatures within 50–55 °C for 6 min,3 the 75% PW heat pack meets or even surpasses the requirement, thus being suitable for actual applications.3.7 Future perspective
The overall performance of a CPCM in practical thermal energy storage applications is influenced by various parameters, including phase change temperature, phase change enthalpy, thermal conductivity, material mass, geometry, density change during solid–liquid transition, and ambient conditions (temperature and wind flow), etc. Previous reports demonstrated that the prediction and optimization of these parameters can be conducted using numerical analyses, saving human forces for experimental investigations. Zhang et al.52 conducted a numerical study on the performance of a CPCM for a thermotherapy mask. Liu et al.53 investigated the thermal performance of lightweight building walls incorporated with a CPCM using a numerical analysis. Wu et al.54 used a numerical analysis to study the solar energy storage of a CPCM. Recently, artificial intelligence (AI) tools have also been applied for the prediction and optimization of CPCMs in various applications, including molten salt incorporated-solar thermal power plants55,56 and CPCM-based concrete for building energy saving.57,58 Results showed that AI tools could provide quite exact predictions of the performance of CPCMs. In this work, although the prepared PW/FS/EG@Fe3O4 CPCMs were experimentally proven to be applicable in thermotherapy, the practical utilization still needs more investigations and optimizations. Therefore, we suggest using numerical simulations or AI tools to solve this issue in the future.4. Conclusion
The PW/FS/EG@Fe3O4 CPCMs were successfully prepared and studied for thermal properties and multifunctional thermal conversion and storage with varying PW contents of 60–80%. The 60–80% PW CPCMs exhibited high phase change enthalpies, ranging from 116.5 J g−1 for the 60% PW sample to 155.6 J g−1 for the 80% PW one, which was facilitated by high crystallization fractions (above 97%) of confined PW. The thermal conductivities of the prepared CPCMs were achieved at 1.395–2.215 W (m K)−1, which were 9.8–6.2 times greater than that of pristine PW. In addition, the leakage resistance test demonstrated a large amount of PW (75%) could be stabilized in the CPCMs. A cycling durability test also demonstrated that the 75% PW CPCM maintained its phase change behaviors even after 500 melting/crystallization cycles. In addition, the 75% PW CPCM exhibited a saturation magnetization of 3.1 emu g−1 and inherited the superparamagnetism from Fe3O4. This offered the CPCM a magnetothermal conversion and storage, showing a temperature increase from 33.8 to 80.1 °C in 370 s as applied with an alternating magnetic field of 320 W. The high electrical conductivity of EG further provided the CPCM with an electrothermal conversion and storage, showing a temperature increase from 34.7–71.7 °C in 100 s as applied with a DC voltage of 20 V. Moreover, the 75% PW, in the form of a heat pack, demonstrated a sustained heat release when applied to practical thermotherapy. The good thermal properties and electro/magnetothermal conversion and storage ability make the prepared CPCMs promising for practical thermotherapy applications.Ethical statement
The ethics responsibility is informed and acknowledged to all the authors and volunteers as a part of content of right of informed consent.Data availability
The data supporting this article have been included as part of the ESI.†Conflicts of interest
The authors declare no known competing interests.Acknowledgements
This work belongs to the project in 2025 funded by Ho Chi Minh City University of Technology and Education, Vietnam.References
- L. Chen, L. Luo, Z. Mao, B. Wang, X. Feng and X. Sui, ACS Appl. Mater. Interfaces, 2024, 16, 4089–4098 CrossRef CAS PubMed.
- J. Lv, J. Wang, J. Wang, T. Zhang, B. Yang, Z. Zhen, Y. Zheng and Y. Wang, J. Energy Storage, 2023, 60, 106609 CrossRef.
- R. W. Y. Habash, R. Bansal, D. Krewski and H. T. Alhafid, Crit. Rev. Biomed. Eng., 2006, 34, 459–489 CrossRef PubMed.
- Y. Li, H. Yu, P. Liu, X. Diao, Y. Feng, Y. Jiang and X. Chen, SusMat, 2024, 4, e214 CrossRef CAS.
- Y. Li, X. Wu, Y. Liao, H. Shao, Y. Chen, W. Yang, P. Lv, Y. Zhou and C. Tang, Polymer, 2024, 305, 127171 CrossRef CAS.
- X. Lin, Z. Ling, X. Fang and Z. Zhang, Appl. Energy, 2022, 327, 120141 CrossRef CAS.
- G. Wang, Z. Tang, Y. Gao, P. Liu, Y. Li, A. Li and X. Chen, Chem. Rev., 2023, 123, 6953–7024 CrossRef CAS PubMed.
- Z.-R. Li, N. Hu and L.-W. Fan, Energy Storage Mater., 2023, 55, 727–753 CrossRef.
- X. Chen, H. Gao, G. Hai, D. Jia, L. Xing, S. Chen, P. Cheng, M. Han, W. Dong and G. Wang, Energy Storage Mater., 2020, 26, 129–137 CrossRef.
- Y.-w. Shao, W.-w. Hu, M.-h. Gao, Y.-y. Xiao, T. Huang, N. Zhang, J.-h. Yang, X.-d. Qi and Y. Wang, Composites, Part A, 2021, 143, 106291 CrossRef CAS.
- C. Zhang, W. Lin, Q. Zhang, Z. Zhang, X. Fang and X. Zhang, Int. J. Therm. Sci., 2019, 142, 156–162 CrossRef CAS.
- E. M. Shchukina, M. Graham, Z. Zheng and D. G. Shchukin, Chem. Soc. Rev., 2018, 47, 4156–4175 RSC.
- T. Xu, J. Zhang, G. Fan, T. Zou, H. Hu, Y. Du, Y. Yang, H. Li and P. Huang, J. Build. Eng., 2023, 71, 106400 CrossRef.
- G. T. Nguyen, RSC Adv., 2023, 13, 7621–7631 RSC.
- W. Fu, T. Zou, X. Liang, S. Wang, X. Gao, Z. Zhang and Y. Fang, Appl. Therm. Eng., 2019, 162, 114253 CrossRef CAS.
- Y. Gao, Z. Tang, X. Chen, J. Yan, Y. Jiang, J. Xu, Z. Tao, L. Wang, Z. Liu and G. Wang, Aggregate, 2023, 4, e248 CrossRef CAS.
- R. Shen, M. Weng, L. Zhang, J. Huang and X. Sheng, Composites, Part A, 2022, 163, 107248 CrossRef CAS.
- C. Liu, L. Wang, Y. Li, X. Diao, C. Dong, A. Li and X. Chen, J. Colloid Interface Sci., 2024, 657, 590–597 CrossRef CAS PubMed.
- G. Li, X. Zhang, J. Wang and J. Fang, J. Mater. Chem. A, 2016, 4, 17042–17049 RSC.
- C. Ao, S. Yan, S. Zhao, W. Hu, L. Zhao and Y. Wu, Energy Rep., 2022, 8, 4834–4843 CrossRef.
- D. Huang, G. Ma, Z. Yu, P. Lv, Q. Zhou, Q. Liu, C. Peng, F. Xiong and Y. Huang, RSC Adv., 2023, 13, 13252–13262 RSC.
- K. Yang, H. Peng, Y. Wen and N. Li, Appl. Surf. Sci., 2010, 256, 3093–3097 CrossRef CAS.
- W. N. Jannah, A. Taufiq, S. Zulaikah, A. Hidayat, E. Suharyadi, S. T. Wicaksono and S. Sunaryono, Mater. Chem. Phys., 2023, 310, 128457 CrossRef CAS.
- G. T. Nguyen, H. N. Anh Tuan and I. Park, Energy Fuels, 2022, 36, 13337–13345 CrossRef CAS.
- G. T. Nguyen, H. S. Hwang, J. Lee, D. A. Cha and I. Park, Nanomaterials, 2021, 11, 566 CrossRef CAS PubMed.
- M. He, D. Xie, L. Yin, K. Gong and K. Zhou, Mater. Today Commun., 2023, 34, 105288 CrossRef CAS.
- Z. Zhang, Y. Liu, J. Wang, L. Sun, T. Xie, K. Yang and Z. Li, Colloids Surf., A, 2021, 625, 126905 CrossRef CAS.
- X. Zuo, J. Li, X. Zhao, H. Yang and D. Chen, Renewable Energy, 2020, 152, 579–589 CrossRef CAS.
- H. Gao, J. Wang, X. Chen, G. Wang, X. Huang, A. Li and W. Dong, Nano Energy, 2018, 53, 769–797 CrossRef CAS.
- W. Aftab, X. Huang, W. Wu, Z. Liang, A. Mahmood and R. Zou, Energy Environ. Sci., 2018, 11, 1392–1424 RSC.
- Y. Qu, J. Chen, L. Liu, T. Xu, H. Wu and X. Zhou, Renewable Energy, 2020, 150, 1127–1135 CrossRef CAS.
- G. T. Nguyen, M. H. Do, T. N. Ly, I. Park and T. H. Bui, J. Energy Storage, 2022, 52, 104772 CrossRef.
- J. Wang, M. Yang, Y. Lu, Z. Jin, L. Tan, H. Gao, S. Fan, W. Dong and G. Wang, Nano Energy, 2016, 19, 78–87 CrossRef CAS.
- S. Liu, X. Fei, B. Zhang, H. Zhao and M. Wan, Sol. Energy Mater. Sol. Cells, 2022, 236, 111484 CrossRef CAS.
- W. Cui, X. Li, X. Li, T. Si, L. Lu, T. Ma and Q. Wang, J. Cleaner Prod., 2022, 367, 133031 CrossRef CAS.
- Y. Luo, S. Xiong, J. Huang, F. Zhang, C. Li, Y. Min, R. Peng and Y. Liu, Sol. Energy Mater. Sol. Cells, 2021, 231, 111300 CrossRef CAS.
- M. Alam, H. Singh, S. Brunner and C. Naziris, Energy Build., 2014, 69, 442–450 CrossRef.
- T. Ohmura, T.-W. Lian, A. Kondo, R. Hayasaka, Y. Goto, T. Fujimoto and M. Naito, J. Soc. Powder Technol., 2018, 55, 153–157 CrossRef CAS.
- J. Chen, Z. Ling, X. Fang and Z. Zhang, Energy Convers. Manage., 2015, 105, 817–825 CrossRef CAS.
- M. Y. Razzaq, M. Anhalt, L. Frormann and B. Weidenfeller, Mater. Sci. Eng., A, 2007, 444, 227–235 CrossRef.
- I. Dayana, T. Sembiring, A. P. Tetuko, K. Sembiring, K. Sebayang, J. Marbun, M. Rianna, N. Maulida and Z. Cahyarani, AIP Conf. Proc., 2020, 2221 Search PubMed.
- F. Li, H. Zhen, L. Li, Y. Li, Q. Wang and X. Cheng, Mater. Today Energy, 2022, 26, 100999 CrossRef CAS.
- M. Yuan, Y. Ren, C. Xu, F. Ye and X. Du, Renewable Energy, 2019, 136, 211–222 CrossRef CAS.
- G. T. Nguyen, H. S. Hwang, J. Lee and I. Park, ACS Omega, 2021, 6, 8469–8476 CrossRef CAS PubMed.
- P. Murugan, R. D. Nagarajan, B. H. Shetty, M. Govindasamy and A. K. Sundramoorthy, Nanoscale Adv., 2021, 3, 6294–6309 RSC.
- L. Xia, P. Zhang and R. Z. Wang, Carbon, 2010, 48, 2538–2548 CrossRef CAS.
- M. Xing, D. Jing, H. Zhang and R. Wang, Int. J. Therm. Sci., 2023, 188, 108215 CrossRef CAS.
- Y. F. Zhao, M. Xiao, S. J. Wang, X. C. Ge and Y. Z. Meng, Compos. Sci. Technol., 2007, 67, 2528–2534 CrossRef CAS.
- Z. Liu, F. He, Y. Li, Z. Jiang, G. He, C. Lin, Q. Zhang, Y. Zhou and W. Yang, Sol. Energy Mater. Sol. Cells, 2023, 252, 112171 CrossRef CAS.
- K. Zhang, B. Han and X. Yu, Energy Convers. Manage., 2012, 64, 62–67 CrossRef CAS.
- T. R. Lenka and A. K. Panda, Pramana, 2012, 79, 151–163 CrossRef CAS.
- Q. Zhang, Z. He, X. Fang, X. Zhang and Z. Zhang, Energy Storage Mater., 2017, 6, 36–45 CrossRef.
- Z. a. Liu, J. Hou, X. Meng and B. J. Dewancker, Case Stud. Constr. Mater., 2021, 15, e00758 Search PubMed.
- S. Wu, T. Yan, Z. Kuai and W. Pan, Sol. Energy, 2020, 205, 474–486 CrossRef CAS.
- L. Sang, X. Lv and Y. Wu, Sol. Energy, 2023, 252, 322–329 CrossRef CAS.
- Y. Tian, X. Liu, L. Zhang, Q. Luo, Q. Xu, H. Yao, F. Yang, J. Wang, C. Dang and Y. Xuan, J. Energy Storage, 2022, 55, 105658 CrossRef.
- H. Tanyildizi, A. Marani, K. Türk and M. L. Nehdi, Constr. Build. Mater., 2022, 319, 126146 CrossRef CAS.
- A. Marani, L. Zhang and M. L. Nehdi, Eng. Appl. Artif. Intell., 2023, 118, 105652 CrossRef.
Footnote |
| † Electronic supplementary information (ESI) available. See DOI: https://doi.org/10.1039/d5ra00438a |
| This journal is © The Royal Society of Chemistry 2025 |

