
 Open Access Article
 This Open Access Article is licensed under a Creative Commons Attribution-Non Commercial 3.0 Unported Licence
Investigating the effects of silk fibroin on ultrasound-mediated ultrafine bubble drug transport and delivery systems†
Nguyen Le Hanh Tran,
Tam Vo Viet Tran,
Khoi Le Minh Tran,
Thu Phan Anh Le and
Khoi Tan Nguyen *
*
School of Biotechnology, International University, Vietnam National University of Ho Chi Minh City, 700000, Vietnam. E-mail: ntkhoi@hcmiu.edu.vn
First published on 7th April 2025
Abstract
Ultrafine bubbles with ultrasound stimuli have recently gained immense attention in developing drug delivery systems. However, research into their construction, stability and the factors influencing this aspect was conducted at the infant stage. This study aimed to utilize silk fibroin (a biocompatible protein extracted from Bombyx mori silkworm) in conjugation with polyethylene glycol 400 to stabilize the ultrafine bubble drug loading and releasing system. Light scattering laser imaging was used to examine the effects of SF and PEG on system stability. In addition, fluorescence laser imaging and optical absorbance measurements were performed to assess the role of these additives in the drug encapsulation and release process. Results confirmed the bubble stability was enhanced by the introduction of SF and PEG into the drug-carrier system. This study demonstrated that the proposed drug-transportation system possessed an encapsulation capacity of more than 80% and a substantial released drug content of up to 50% after the application of ultrasonic radiation.
Introduction
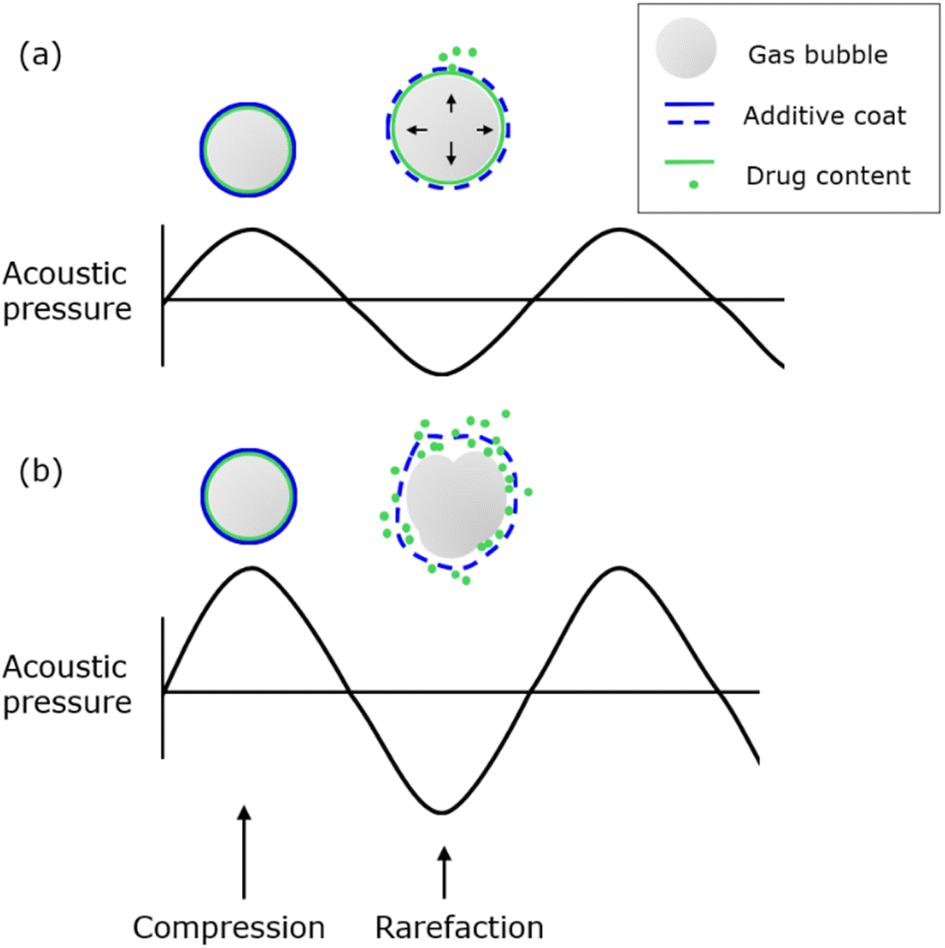
Drug delivery systems are methods or technologies designed to efficiently introduce drugs into the human body.1 Conventional drug delivery systems using powder, capsules, tablets, etc., however, have been criticized for their incapability to penetrate small blood vessels as well as the lack of release control.2 These issues are primarily due to the intrinsic non-polar nature of most pharmaceutical compounds, resulting in their poor solubility in water, the main component of the bloodstream.3 In addition, these drug-carrying vehicles are considerably large to pass through the narrow blood capillaries or overcome the immune system.4 Consequently, these systems frequently suffer from low absorption and poor bioavailability.5 Moreover, traditional delivery forms tend to release drugs in uncontrolled bursts with a high initial concentration that rapidly declines in the bloodstream, resulting in the inability to achieve the target release.6 With recent advancements in nanotechnology, smart nanocarriers can overcome these challenges. These carriers are small in size and equipped with a stimuli-responsive mechanism, in which medicine molecules can be released to biological sites in response to either internal or external stimuli (e.g., pH, optical, electrical, mechanical, and thermal)2 External stimuli techniques have gained more attention since they can be performed non-invasively and allow easier spatiotemporal manipulations of the releasing process.7 Among these methods, ultrasound (US) has been widely used due to its non-invasive properties and its ability to simultaneously monitor images during the US application.8,9Ultrasound refers to sound waves with a frequency greater than 20 kHz. All sound waves require a medium containing matters (in solid, liquid or gaseous phases) to propagate,10 as particles within these media undergo a compression phase (high air pressure or density) and rarefaction phase (low air pressure or density) repetitively, creating a pressure wave.11 Due to this nature, ultrasound can produce a series of thermal and mechanical bioeffects, in which the creation of cavitation is emphasized with the help of gas systems.12 Cavitation occurs when vibration and oscillation are applied to air bubbles by an ultrasonic field. With low-density air filled inside the core, bubbles can expand and contract, corresponding to the compression and rarefaction phase changes of ultrasound.12 The cavitation property of US and air bubbles was first harnessed in developing ultrasound contrast agents (UCAs) for diagnostics. Ultrasound contrast agents are small gas systems such as ultrafine bubbles (UFBs) and microbubbles (MBs).13 Microbubbles typically range in size from 1 to 10 μm, whereas ultrafine bubbles are smaller than 1 μm.14 MBs and UFBs were investigated to enhance the resolution of image generation via non-continuous (pulsed) ultrasound. The oscillation of the gas bubbles returns a secondary wave signal alongside the primary reflected ultrasound signal.10 Stimuli-responsive drug release from ultrasound has also been developed from a similar cavitation mechanism. Microbubbles and ultrafine bubbles decorated with additives (e.g., proteins, polymers, or monolayer lipids) can encapsulate hydrophobic drugs at their air/water interface.15–17 When the gas core oscillates in response to the compression–rarefaction phase change, two types of cavitation can be produced: non-inertial and inertial.18 Non-inertial cavitation exerts a repetitive oscillation on bubbles, thus gradually expanding the additive cover to release the pharmaceutical payload without rupturing the gas pockets (Fig. 1a).12 On the other hand, inertial cavitation causes bubbles to increase in size beyond their elastic threshold and eventually collapse. The complete destruction can release all inner contents simultaneously, along with undesirable effects such as microjets or heat shocks (Fig. 1b).12 These events can be controlled by selecting appropriate ultrasound waves. US beams with high-pressure amplitude and large mechanical index (an indication for the ability to cause cavitation effects) are known to produce inertial phenomena, whereas weaker ultrasound waves primarily cause non-inertial cavitation.19
 | ||
| Fig. 1 Ultrasound-mediated drug release mechanism in gas bubble systems. (a) Non-inertial cavitation under low-pressure amplitude sound wave. (b) Inertial cavitation under high-pressure amplitude sound wave. | ||
For drug delivery systems, the gas systems used in conjunction with ultrasonic waves include both microbubbles and ultrafine bubbles. Between these, ultrafine bubbles have recently attracted more attention in therapeutic applications.20–26 Compared with microbubbles, UFBs have a diameter of less than 1 μm, a more comparable size to effectively interact with biological cells. Consequently, these bubbles can travel in microvessels that are less than 20 μm![[thin space (1/6-em)]](https://www.rsc.org/images/entities/char_2009.gif) 27 in diameter, thereby enhancing target drug delivery.28 Additionally, the nanometer-scale dimensions of UFBs provide a larger surface area with more surface-active centers, thereby improving the drug-loading efficiency.8
27 in diameter, thereby enhancing target drug delivery.28 Additionally, the nanometer-scale dimensions of UFBs provide a larger surface area with more surface-active centers, thereby improving the drug-loading efficiency.8
An emerging concern regarding the use of UFBs in drug transportation is their stability in bulk solutions. Calculations have indicated that for sizes ranging from 10 to 100 nm, gas diffusion in and out of air pockets occurs rapidly; thus, ultrafine bubbles can only exist in nanoseconds.29 This transient existence raises questions about their reliability as a component in drug-delivery systems.29,30
One of the most common ways to enhance the lifetime of UFBs is to apply a monolayer surfactant coating on their gas/water interface to limit the mass transfer between the two phases. Surfactants, which can reduce the surface tension between two phases, are diverse in size and charge.31 Compared with low molecular weight surfactants, proteins are considered better bubble stabilizers because of their thicker adsorbed layer, which lessens gas diffusion. This study investigated the effect of SF on stabilizing bubbles within drug delivery systems.32,33 Silk fibroin (SF), a protein secreted from Bombyx mori silkworm, consists of heavy and light chains. The heavy chain contains 12 repetitive domains of GAGAGAGS (with G as glycine, S as serine, and A as alanine), forming a hydrophobic β-sheet crystallite.34,35 On the other hand, its light chain is more hydrophilic due to its more non-repetitive charged and uncharged amino acid composition. Generally, proteins in bulk solution first dewet some hydrophobic side chains to adhere to the air–water interface. Its native structure can be subsequently unfolded, allowing the interior nonpolar core to be exposed to air while maintaining hydrophilic chains at the aqueous side of the interface.36 Because of this sticking mechanism, silk fibroins reassemble into a rigid, branched structure to lower the surface tension and stabilize polar–nonpolar interfaces such as bubble surfaces, prolonging the bubble life.37,38 Beyond the substantial stabilizing role, silk fibroin has been proven to be biocompatible, environmentally stable, biodegradable, and low-immunogenic, therefore, suitable for the introduction into a biological matrix.39 In addition to surfactants, a low electrolyte concentration, typically the physiological salt level in blood, has been found to enhance UFB stability by forming an ionic shield to prevent bubbles from coalescence.40 Therefore, in this study, a solution with sodium chloride at physiological concentration and SF was prepared to promote both stabilizing effects.41,42 Another water-soluble and non-toxic additive, polyethylene glycol-400 (PEG-400), can also be introduced to preserve protein integrity and prevent its denaturation from any undesirable physical condition.43,44 Along with being a protein stabilizer, PEG-400 can act as a cosurfactant. PEG-400 is expected to spread a stable film at the air–water or oil–water interface as its fairly hydrophobic –CH2–O–CH2– group can stick to the nonpolar air side. The aligned PEG chains on the interface can disturb the hydrogen network and reduce surface tension.45 This property facilitates the emulsification of drugs to enhance the loading efficiency of oral, nasal, and intravenous delivery formulations.46–50
In our earlier research, we concentrated on albumin, a globular protein,26 whereas this study focused on silk fibroin, a fibrous protein. The fibril-like characteristics of silk fibroin may lead to unique interactions at the air–water interface, potentially influencing drug release kinetics. The applied loading and release mechanism is best suitable for hydrophobic drugs, such as flavonoids, which have an intrinsic high affinity to the bubble air/water interface facilitated by their aromatic rings. In this study, quercetin was used as the model drug.
As a flavonoid, quercetin comprises two phenyl rings (A and B) connected by a heterocyclic ring (C).51 These hydrophobic rings enable quercetin to interact with hydrophobic sites on proteins, potentially inhibiting their activity. This mechanism contributes to its anti-cancer effects by suppressing leukocyte membrane proteins.52 Additionally, quercetin's hydroxyl groups act as antioxidants, scavenging reactive oxygen species (ROS) and further supporting its anti-inflammatory properties.53 The aforementioned surfactants and cosurfactants should be expected to enhance the stability of the matrix as well as provide certain effects on the quercetin loading and release capabilities.54 This study contributes to the existing literature by providing additional data on silk fibroin's behavior at the air–water interface. It also explores the feasibility of using silk fibroin as an encapsulating agent in drug delivery systems, particularly bubble-based systems. Furthermore, this investigation examines the impact of incorporating PEG additives, offering insights into their role in enhancing system stability and efficiency.
Experimental
Materials
Bombyx mori silk fibroin 5% (w/v) was purchased from Sigma Aldrich. The other chemicals used in this study were ethanol (99.7%, Xilong Scientific), quercetin (Sigma Aldrich), and polyethylene glycol-400 (Sigma Aldrich). Sodium chloride (99.5%, Sigma Aldrich) was heated to 300 °C for 8 hours to remove impurities. A Milli-Q ultrapure water system (Millipore, USA) with a resistivity of 18.2 MΩ cm was used to prepare the solutions in this research.Table-top ultrasonic bath (Derui, DR-MS13, 20 kHz), UV-Vis spectrophotometer (JASCO, model V-730), high-frequency acoustic wave generator (Portable Ultrasound, 1 MHz), centrifuge (HERMLE LaborTechnik, model Z306), monochromatic 10 mW 532 nm continuous wave laser (PGL-XII-E-532, CNI laser), continuous wave diode laser source of the 405 nm violet beam, and CCD camera (Matsushita, 7.5 MP, Venus Engine III) were the instruments employed in the experiments.
Methods
In the subsequent 20 minutes, SF and PEG-400 were carefully transferred into the container to develop a protective film outside the quercetin-UFB system. The loading procedure is illustrated in Fig. 2a. Throughout the procedure, the sonication bath was coupled with a cooling system to strictly control the experimental conditions.
 | ||
| Fig. 2 Illustration of (a) quercetin loading and surfactant introduction procedure with two consecutive sonication periods and (b) different controls for removal of one or both additives in the later sonication period. | ||
The silk fibroin concentration was first chosen at 10 μg mL−1 (or 0.10 μM), whereas PEG-400 at 2% compared with the introduced SF volume (v/vSF) (or 564 μM) was chosen due to their good performance during preliminary research. This sample was named S10P2. In this study, investigations on these two additives were conducted using formulations of lower amounts since the smaller the amounts of these proteins and polymers, the less impact the drug delivery system imposes on the biological matrix. For instance, silk fibroin concentration could be reduced to 5 μg mL−1 (0.05 μM) and PEG-400 to 1%(v/vSF) (282 μM), giving another three tested samples, namely, S10P1 – with 0.10 μM of SF and 282 μM PEG, S5P2 – with 0.05 μM of SF and 564 μM of PEG, and S5P1 – with 0.05 μM of SF and 282 μM of PEG.
In addition to the different formulations of SF and PEG-400, three control formulations were prepared for the experiments, as illustrated in Fig. 2b. Each would lack one or both of those additives, listed as control without both silk fibroin and polyethylene – C-Ø, control containing only SF – C-SF, and control containing only PEG – C-PEG, to demonstrate the imperative role of the protein and polymer in the proposed drug transportation and delivery system. Table S1† summarizes the details of the samples and controls used in this study.
 | ||
| Fig. 3 Diagram of the green laser scattering experiment for loaded samples/controls. | ||
The solutions were observed over 1 hour, starting after the completion of 20 kHz sonication, with images captured every 10 minutes. This timeframe was chosen considering that the infusion time for the UFB system into a host system persists for 15–30 minutes and the transit time of bubble systems through the bloodstream to reach target sites ranges from seconds to minutes. The initial points (at 0th min) served as a reference to normalize the later data from the green channel value into relative scattering intensity (%). Subsequently, the relative scattering intensities were used to calculate Δscattering of the solutions using the following formula:
| Δscattering = I(scattering at 0th min) − I(scattering at 60th min) | (1) |
Two similar S10P2 samples were prepared but underwent different treatments: one with the same 20 kHz sonication procedure as the bubble system preparation step described and one without any sonication. The two samples were subsequently analyzed using a UV-Vis spectrophotometer over a wavelength range of 300–500 nm. The measured spectra were evaluated to provide several insights into the loading success.
 | (2) |
The S10P2 sample was prepared five times independently, and its ‘before released’ and ‘after released’ red channel values were used to perform the Wilcoxon signed-rank test. The p-value was compared with α = 0.1 to confirm the success.
 | ||
| Fig. 4 Diagram of developing the standard curve between loaded quercetin concentrations and their red value as well as illustrating how to use the curve in calculating the released quercetin amount in released samples/controls. | ||
Releasing efficiency RE% was then computed using the following formula:
 | (3) |
Results and discussions
The development of a drug-delivery system encompasses two critical aspects: drug transport and drug delivery. Drug transport accounts for the distribution of molecules in the bloodstream to the target site; therefore, this process depends on the stability of the system. Conversely, drug delivery can be broken down into drug loading and drug release processes. The experimental results from this study indicate that the surfactants, silk fibroin and PEG-400, might influence these two phases.Stability of loading systems
 | ||
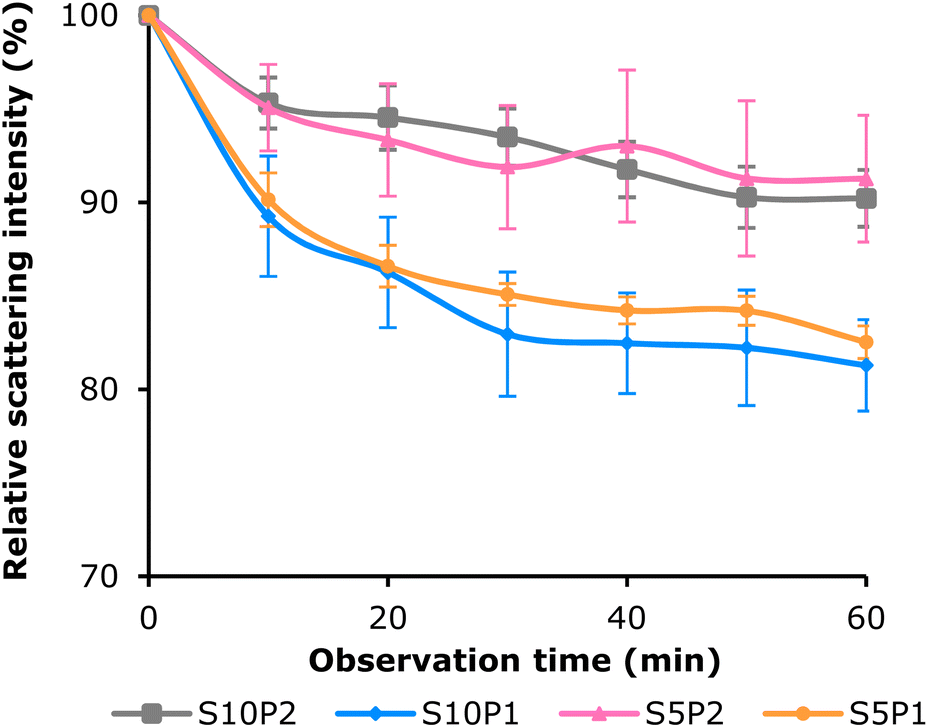
| Fig. 5 532 nm laser light scattering intensity monitored in an hour from four samples: the chosen formulae S10P2 and three controls C-Ø, C-SF, and C-PEG. The error bars represent the standard error of the mean (SEM) of five repetitions for each sample at each observation time point. | ||
The statistical results from the one-tailed Mann–Whitney U test comparing the S10P2 system with the three controls (Table S2†) showed that the formulation with both surfactants showed a significantly lower Δscattering. The comparison elucidated that the combined presence of SF and PEG improved the stability of the drug-loading UFB system over time compared with the presence of no surfactant or only one surfactant.
 | ||
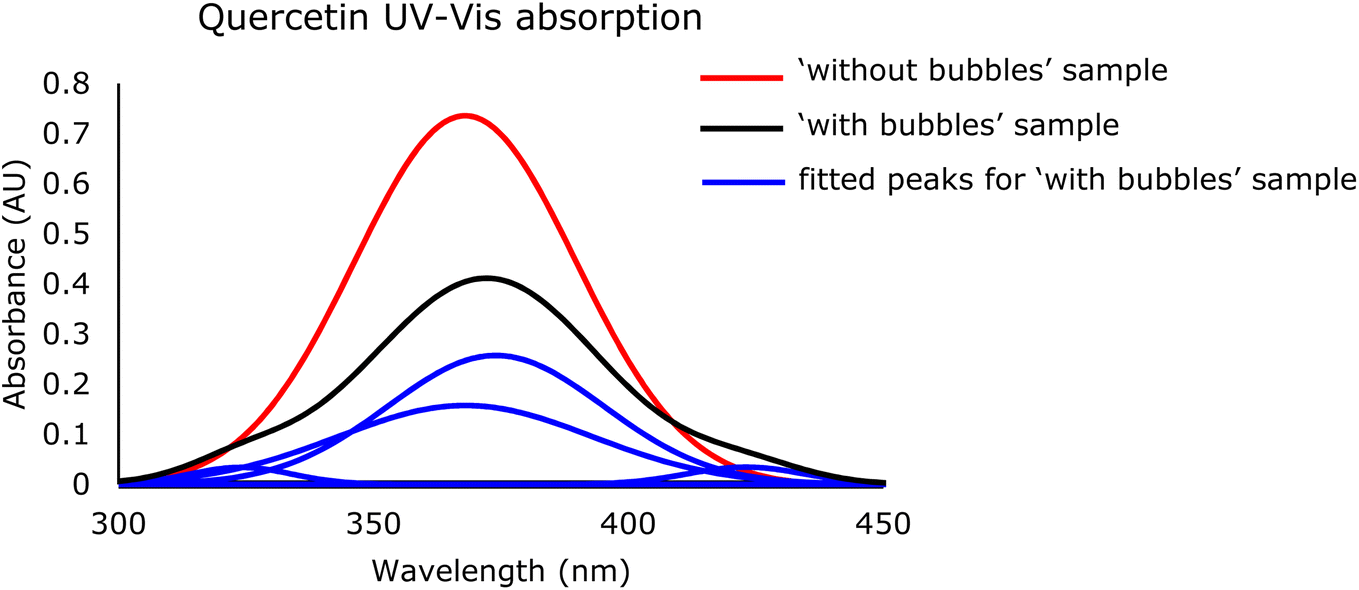
| Fig. 6 UV-Vis spectra change from without bubbles (black curve with one fitted peak at 368 nm) to with bubbles (four red curves with fitted peaks at 324, 368, 374, and 423 nm from left to right) in quercetin-containing samples with both SF-PEG. | ||
Specifically, S10P2 was significantly more stable than S10P1 and S5P1, but comparable to S5P2. It also showed that S10P2 had smaller error bars, demonstrating better consistency in the loading system. These results indicated that different ratios of SF and PEG present different influences on system performance.
The most stable formulations were those with both surfactants, and the large amount of PEG-400 contributed greatly to the system, as can be seen in S10P2 (Fig. 5) and S5P2 (Fig. 6).
An explanation for this was that SF might work as the primary surfactant to create a rigid shell outside the bubbles, thereby extending their lifetime. However, due to its small size (MWPEG-400 = 0.3 kDa), the addition of PEG-400 allows it to fill in the intermolecular gaps between large silk fibroin structures (average MWSF = 100 kDa), thus preventing further gas diffusion, which reduces bubble collapse.66 In addition, it is worth noting that in C-Ø, although there were no surfactants, the scattering intensity appeared to be as high as the other controls. As mentioned, quercetin can adsorb on the air/water interface of bubbles and help prevent mass transfer. This phenomenon may help to preserve a high concentration of freshly produced UFBs, nevertheless, the effects are only temporary, resulting in poor stability over time.
Although the scattering laser imaging results showed a noticeable difference in intensity reduction between test samples and controls, there was uncertainty due to the lack of investigation into the size of the bubbles inside the solution, which may have contributed to the scattering phenomenon.67 Here in this study, it is hypothesized that adsorbed SF, PEG-400 and NaCl layers can effectively prevent cross-bubble interactions.
Loading effects of the bubble system
 | ||
| Fig. 7 532 nm laser light scattering intensity monitored in an hour from four samples: selected S10P2 and three other formulations, S5P2, S10P1, and S5P1. The error bars represent the standard error of the mean (SEM) of five repetitions for each sample at each observation time point. | ||
 | ||
| Fig. 8 Quercetin structure with the named rings, A, B, and C.69 | ||
Their resulting cinnamoyl system is commonly observed with a maximum peak at 368 nm.58,59 This phenomenon was demonstrated clearly in the sample without bubbles, confirming that quercetin might still be in the fully solvated form, without any interactions with air bubbles or surfactants.
When bubbles were introduced into the system, the 368 nm peak declined. As mentioned, flavonoids like quercetin possess the ability to adsorb onto the air/water interfaces due to their hydrophobic interactions with the gas core.68 Since silk fibroin has both negative and positive sites as well as a hydrophobic core, it is likely to have SF perform the aforementioned interactions with quercetin, resulting in emerging peaks.
The decrease in absorbance at 368 nm might have resulted from the movement of quercetin from being fully solvated in bulk solution to partially bound on the bubble surface, indicating the successful loading of the drug to the system. In addition, the other three shifted peaks besides the 368 nm peak in Fig. 7 illustrate that quercetin interacts with the surfactant layer adsorbed on the air/liquid interface of the bubbles. Amphiphilic structures such as surfactants were found to shift quercetin's maximum absorption to longer wavelengths by both hydrophobic and electrostatic forces.59 In this case, anionic surfactants were more likely to interact with quercetin by hydrophobic force at ring B, thus changing the corresponding absorption band 300–400 nm and creating new peaks at 374 and 423 nm. Conversely, cationic surfactants can deprotonate quercetin at 3 and 7 positions (Fig. 8), altering another absorption band from rings A and C, 240–280 nm, and causing a new peak at 324 nm.
It appeared that the high concentrations of surfactants in S10P2 and S5P2 seemed to replace a small amount of quercetin at the interface during the 20 kHz sonication, which led to their slightly lower LE% compared to C-Ø and C-SF (Fig. 9). Regarding C-PEG, the SD error bars showed the inconsistency of loading capability when introducing PEG alone to the bubble system. Compared with the apparent hydrophobic regions on SF, PEG-400 contains only an uncharged but polar chain, which means it has less affinity to the air/water interface of the bubbles.70 Together with the poorer adsorption to the interface, polyethylene glycol 400 does not display significant interactions with quercetin like SF; thus, the loading efficiency in the replicates was more arbitrary as a result from the unstable coating.
 | ||
| Fig. 9 Loading efficiency of samples and controls, with the report of SD error bars (* means P < 0.05, ns means no significant difference). | ||
Overall, it can be inferred that the lower the surfactant concentration in the system, the higher the drug loading efficiency due to less adsorption competition against the bubble decorating layer. According to the chart, the sample without any additives (C-Ø) showed the highest LE%. Whereas the sample with only SF dropped the efficiency slightly, the addition of only PEG significantly affected the LE%.
Releasing effects of the bubble system
 | ||
| Fig. 10 Red channel values of sample ‘before the releasing process’ and ‘after the releasing process’. *Red channel value was the average red color intensity of all pixels in images, ranging from 0–255 (8 bit), detected by ImageJ. | ||
 | ||
| Fig. 11 Releasing efficiency of the samples and controls, with report of SD error bars (ns means no significant difference). | ||
In alignment with a previous study of using human serum albumin (HSA) and PEG in UFB systems,26 the incorporation of PEG-400 alongside protein surfactants might enhance the release effect, as the RE% values of S10P2 and S5P2 surpassed their controls. In addition, most existing quercetin delivery systems focused on a controlled release mechanism. This is only preferable when a long time is available for drug release.
One study used a graphene oxide (GO) sheet attached with quercetin, with a loading efficiency of at most 92% and releasing efficiency of approximately less than 10% after 1–2 hours after the formulation.71 A study using pH as a stimuli for releasing quercetin was conducted on chitosan liposomes. The results showed that the polymer scheme can enhance the encapsulating efficiency but block drug release, with approximately 5% of the drug released within the first hour.72 On the other hand, using cellulose-porous beads can produce a cumulative release of approximately 40% after 200 minutes.73 Superparamagnetic iron nanoparticles were tested for loading and releasing quercetin under magnetic field stimulation. The RE% can achieve nearly 100%; however, the condition of the released drug was in 50% ethanol solution, and this might not reflect the true physiological condition of biological systems.74 Another study using ultrasound to trigger the release of quercetin-coated polymer nanodroplets achieved an RE% of 3% after 5 minutes and 8% after 25 minutes.55 Compared with these results, the UFB system might represent a promising stimuli-response mechanism for encapsulated flavonoid drug delivery. The LE% values of both samples (S10P2 and S5P2) were higher than 80%, and the RE% was nearly 50% after 5 minutes. Further pharmacokinetic and pharmacodynamic examinations can be performed to evaluate the effectiveness of the UFB system in the biological matrix. In this study, in vitro release analysis of the UFB systems has not been conducted because the common Franz diffusion method can cause shear stress at the pores and damage the carrier bubbles. However, with a well-protected carrier and a prolonged lifetime, these stabilized bubbles are expected to perform good drug liberation at the target site.
Conclusions
This study used silk fibroin, physiological NaCl, and conjugated PEG-400 to support an ultrasound-mediated ultrafine bubble drug transport and delivery system. Although these surfactant coatings did not substantially enhance the encapsulation compared with the negative controls, the light scattering measurements confirmed the notable bubble stabilizing effects when incorporating both additives into the system. These stabilizing effects are crucial during the transportation of drug molecules. In addition, the adsorbed SF-PEG layer did not substantially hinder drug loading and release, as demonstrated by the 80% loading efficiency. The UFB system showed a potential triggered release mechanism with ultrasound, as it was able to release nearly 50% of the loaded content after 5 minutes of ultrasound exposure.While these results primarily highlighted the potential of the SF-PEG conjugated bubble system, several challenges must be addressed in future research. Particularly, the interactions between surfactants, drugs, and the bubble surface are complex and not yet fully understood. More detailed surface-sensitive techniques are highly desirable to better understand the decorating adsorption layer at the air/water interface of bubbles and to deeply evaluate the performance of the delivery carrier. Future studies can also benefit from real-time imaging to track UFB dynamics, drug encapsulation, and release processes at the tissue level. Finally, to advance this silk fibroin-stabilized drug delivery system in clinical settings, in vivo studies are needed to gain a more comprehensive understanding of the pharmacokinetics, bioavailability, and therapeutic efficacy of UFB-based drug delivery systems.
Data availability
The data supporting this article are included in the manuscript and ESI.†Author contributions
N. T. (investigation, methodology, writing – OD, formal analysis, and data curation), T. T. (investigation, data curation, validation, and writing – R&E), K. T. (investigation, validation, and writing – R&E), T. L. (investigation and writing – R&E), K. N. (investigation, methodology, formal analysis, data curation, and funding acquisition).Conflicts of interest
There are no conflicts of interest to declare.Notes and references
- Z. Urbán-Morlán, L. E. Serrano-Mora, L. Martínez-Acevedo, G. Leyva-Gómez, N. Mendoza-Muñoz and D. Quintanar-Guerrero, in Drug Delivery Devices and Therapeutic Systems, 2021, pp. 601–622, DOI:10.1016/b978-0-12-819838-4.00018-3.
- D. Pandita, Vakar, N. Poonia, G. Chaudhary, G. K. Jain, V. Lather and R. K. Khar, in Smart Polymeric Nano-Constructs in Drug Delivery, 2023, pp. 65–107, DOI:10.1016/b978-0-323-91248-8.00004-0.
- L. Zhao, B. Wu and F. Chen, Int. J. Pharm., 2023, 634, 122704 Search PubMed.
- S. Kim, W.-K. Oh, Y. S. Jeong, J.-Y. Hong, B.-R. Cho, J.-S. Hahn and J. Jang, Biomaterials, 2011, 32, 2342–2350 Search PubMed.
- M. Kakran, L. Li and R. H. Müller, Pharm. Eng., 2012, 32, 82–89 Search PubMed.
- S. Adepu and S. Ramakrishna, Molecules, 2021, 26(19), 5905 CrossRef CAS PubMed.
- P. Vinchhi, S. U. Rawal and M. M. Patel, in Drug Delivery Devices and Therapeutic Systems, 2021, pp. 267–288, DOI:10.1016/b978-0-12-819838-4.00023-7.
- J. Jin, L. Yang, F. Chen and N. Gu, Interdiscip. Mater., 2022, 1, 471–494 Search PubMed.
- I. Lentacker, S. C. De Smedt and N. N. Sanders, Soft Matter, 2009, 5, 2161–2170 RSC.
- C. M. I. Quarato, D. Lacedonia, M. Salvemini, G. Tuccari, G. Mastrodonato, R. Villani, L. A. Fiore, G. Scioscia, A. Mirijello, A. Saponara and M. Sperandeo, Diagnostics, 2023, 13(5), 855 CrossRef PubMed.
- B. E. Polat, D. Hart, R. Langer and D. Blankschtein, J. Controlled Release, 2011, 152, 330–348 CrossRef CAS PubMed.
- S.-L. Huang and D. D. McPherson, in Cancer Theranostics, 2014, pp. 269–283, DOI:10.1016/b978-0-12-407722-5.00016-5.
- M. J. K. Blomley, Bmj, 2001, 322, 1222–1225 CrossRef CAS PubMed.
- H. Yusefi and B. Helfield, Front. Phys., 2022, 10, 791145 Search PubMed.
- I. Lentacker, S. C. De Smedt, J. Demeester, V. Van Marck, M. Bracke and N. N. Sanders, Adv. Funct. Mater., 2007, 17, 1910–1916 CrossRef CAS.
- J. P. Christiansen, B. A. French, A. L. Klibanov, S. Kaul and J. R. Lindner, Ultrasound Med. Biol., 2003, 29, 1759–1767 Search PubMed.
- J. L. Tlaxca, C. R. Anderson, A. L. Klibanov, B. Lowrey, J. A. Hossack, J. S. Alexander, M. B. Lawrence and J. J. Rychak, Ultrasound Med. Biol., 2010, 36, 1907–1918 CrossRef PubMed.
- D. Dalecki, Annu. Rev. Biomed. Eng., 2004, 6, 229–248 CrossRef CAS PubMed.
- A. Bouakaz, M. Versluis and N. de Jong, Ultrasound Med. Biol., 2005, 31, 391–399 CrossRef PubMed.
- R. Abdalkader, S. Kawakami, J. Unga, Y. Higuchi, R. Suzuki, K. Maruyama, F. Yamashita and M. Hashida, Drug Delivery, 2017, 24, 320–327 CrossRef CAS PubMed.
- D. V. B. Batchelor, R. H. Abou-Saleh, P. L. Coletta, J. R. McLaughlan, S. A. Peyman and S. D. Evans, ACS Appl. Mater. Interfaces, 2020, 12, 29085–29093 Search PubMed.
- S. Ibsen, M. Benchimol, D. Simberg, C. Schutt, J. Steiner and S. Esener, J. Controlled Release, 2011, 155, 358–366 Search PubMed.
- C. Pellow, M. A. O'Reilly, K. Hynynen, G. Zheng and D. E. Goertz, Nano Lett., 2020, 20, 4512–4519 CAS.
- Y. Peng, L. Zhu, L. Wang, Y. Liu, K. Fang, M. Lan, D. Shen, D. Liu, Z. Yu and Y. Guo, Int. J. Nanomed., 2019, 14, 9139–9157 CAS.
- L. Yang, B. Huang, S. Hu, Y. An, J. Sheng, Y. Li, Y. Wang and N. Gu, Nano Res., 2022, 15, 4285–4293 Search PubMed.
- T. H. Le, A. H. T. Phan, K. C. M. Le, T. D. U. Phan and K. T. Nguyen, RSC Adv., 2021, 11, 34440–34448 CAS.
- G. Guven, M. P. Hilty and C. Ince, Blood Purif., 2020, 49, 143–150 CAS.
- R. Wu, X. Yang, X. e. Li, N. Dong, Y. Liu and P. Zhang, J. Drug Delivery Sci. Technol., 2021, 65, 102749 CAS.
- S. Ljunggren and J. C. Eriksson, Colloids Surf., A, 1997, 129–130, 151–155 Search PubMed.
- M. S. Plesset and S. S. Sadhal, Appl. Sci. Res., 1982, 38, 133–141 Search PubMed.
- J. H. Collier and P. B. Messersmith, in Encyclopedia of Materials: Science and Technology, 2001, pp. 602–606, DOI:10.1016/b0-08-043152-6/00115-7.
- G. Narsimhan and N. Xiang, Annu. Rev. Food Sci. Technol., 2018, 9, 45–63 CAS.
- X. Qiao, R. Miller, E. Schneck and K. Sun, Colloids Surf., A, 2020, 591, 124553 CAS.
- Y. Qi, H. Wang, K. Wei, Y. Yang, R.-Y. Zheng, I. Kim and K.-Q. Zhang, Int. J. Mol. Sci., 2017, 18(3), 237 Search PubMed.
- T. Asakura, Y. Suzuki, Y. Nakazawa, G. P. Holland and J. L. Yarger, Soft Matter, 2013, 9, 11440–11450 CAS.
- R. M. Glaeser, Curr. Opin. Colloid Interface Sci., 2018, 34, 1–8 CAS.
- O. Y. Milyaeva, A. V. Akentiev, A. G. Bykov, R. Miller, A. R. Rafikova, K. Y. Rotanova and B. A. Noskov, Colloids Interfaces, 2024, 8(3), 35 Search PubMed.
- X. Qiao, R. Miller, E. Schneck and K. Sun, Soft Matter, 2020, 16, 3695–3704 RSC.
- J. J. Kwan and M. A. Borden, Adv. Colloid Interface Sci., 2012, 183–184, 82–99 CrossRef CAS PubMed.
- J. R. T. Seddon, D. Lohse, W. A. Ducker and V. S. J. Craig, ChemPhysChem, 2012, 13, 2179–2187 CrossRef CAS PubMed.
- Q. Zhang, N. Wang, R. Hu, Y. Pi, J. Feng, H. Wang, Y. Zhuang, W. Xu and H. Yang, Mater. Lett., 2015, 161, 576–579 CrossRef CAS.
- A. Teimouri, M. Azadi, R. Emadi, J. Lari and A. N. Chermahini, Polym. Degrad. Stab., 2015, 121, 18–29 Search PubMed.
- O. Annunziata, N. Asherie, A. Lomakin, J. Pande, O. Ogun and G. B. Benedek, Proc. Natl. Acad. Sci. U. S. A., 2002, 99, 14165–14170 CrossRef CAS PubMed.
- S. Rawat, C. Raman Suri and D. K. Sahoo, Biochem. Biophys. Res. Commun., 2010, 392, 561–566 CrossRef CAS PubMed.
- K. Prasitnok and M. R. Wilson, Phys. Chem. Chem. Phys., 2013, 15, 17093–17104 RSC.
- H. Juhling McClung, H. R. Sloan, P. Powers, A. John Merola, R. Murray, B. Kerzner and J. Dennis Pollack, Pediatr. Res., 1990, 28, 227–231 CrossRef PubMed.
- Y.-S. Chen, Y.-H. Chiu, Y.-S. Li, E.-Y. Lin, D.-K. Hsieh, C.-H. Lee, M.-H. Huang, H.-M. Chuang, S.-Z. Lin, H.-J. Harn and T.-W. Chiou, Int. J. Nanomed., 2019, 14, 3601–3613 CAS.
- M. Van Woensel, N. Wauthoz, R. Rosière, K. Amighi, V. Mathieu, F. Lefranc, S. Van Gool and S. De Vleeschouwer, Cancers, 2013, 5, 1020–1048 CAS.
- B.-q. Li, X. Dong, S.-h. Fang, J.-y. Gao, G.-q. Yang and H. Zhao, Drug Chem. Toxicol., 2011, 34, 208–212 CrossRef CAS PubMed.
- C.-F. Lin and W. L. Hayton, Age, 1983, 6, 52–56 CAS.
- S. Kumar and A. K. Pandey, Sci. World J., 2013, 2013, 1–16 Search PubMed.
- M. Rossi, L. F. Rickles and W. A. Halpin, Bioorg. Chem., 1986, 14, 55–69 CAS.
- G. Cao, E. Sofic and R. L. Prior, Free Radical Biol. Med., 1997, 22, 749–760 CrossRef CAS PubMed.
- Z. Gharehnazifam, R. Dolatabadi, M. Baniassadi, H. Shahsavari, A.-M. Kajbafzadeh, K. Abrinia, K. Gharehnazifam and M. Baghani, Int. J. Pharm., 2022, 621, 121787 Search PubMed.
- T.-H. Tsai, L.-W. Chang, M.-L. Hou, S.-H. Hung and L.-C. Lin, Int. J. Nanomed., 2015, 10, 3031–3042 Search PubMed.
- A. H. T. Phan, K. C. M. Le, T. H. Le, A. V. Nguyen and K. T. Nguyen, New J. Chem., 2021, 45, 14149–14157 Search PubMed.
- M. A. Wheatley, F. Forsberg, N. Dube, M. Patel and B. E. Oeffinger, Ultrasound Med. Biol., 2006, 32, 83–93 Search PubMed.
- D. Carvalho, Â. Jesus, C. Pinho, R. F. Oliveira, F. Moreira and A. I. Oliveira, Pharmaceuticals, 2023, 16(12), 1736 CrossRef CAS PubMed.
- W. Liu and R. Guo, J. Colloid Interface Sci., 2006, 302, 625–632 CrossRef CAS PubMed.
- M. Hauck, C. Noronha Martins, M. Borges Moraes, P. Aikawa, F. da Silva Paulitsch, R. D. Méa Plentz, S. Teixeira da Costa, A. M. Vargas da Silva and L. U. Signori, Physiotherapy, 2019, 105, 120–125 CrossRef CAS PubMed.
- T. Prutskij, A. Deriabina, F. J. Melendez, M. E. Castro, L. Castillo Trejo, G. D. Vazquez Leon, E. Gonzalez and T. S. Perova, Chemosensors, 2021, 9(11), 315 CrossRef CAS.
- J. C. Alva-Ensastegui, M. Palomar-Pardavé, M. Romero-Romo and M. T. Ramírez-Silva, RSC Adv., 2018, 8, 10980–10986 Search PubMed.
- M. G. Campo and G. M. Corral, J. Phys.: Condens. Matter, 2022, 34(29) DOI:10.1088/1361-648x/ac6a99.
- W. B. Cai, H. L. Yang, J. Zhang, J. K. Yin, Y. L. Yang, L. J. Yuan, L. Zhang and Y. Y. Duan, Sci. Rep., 2015, 5, 13725 Search PubMed.
- Z. K. Alabri, J. Hussain, F. Mabood, N. U. Rehman, L. Ali, A. Al-Harrasi, A. Hamaed, A. L. Khan, T. S. Rizvi, F. Jabeen, A. Khan, Z. Naureen and S. Farooq, Measurement, 2018, 121, 355–359 Search PubMed.
- S. Suzuki, R. Dawson, T. Chirila, A. Shadforth, T. Hogerheyde, G. Edwards and D. Harkin, J. Funct. Biomater., 2015, 6, 345–366 CAS.
- P. L. Marston, D. S. Langley and D. L. Kingsbury, Appl. Sci. Res., 1982, 38, 373–383 Search PubMed.
- Z. Luo, B. S. Murray, A. Yusoff, M. R. A. Morgan, M. J. W. Povey and A. J. Day, J. Agric. Food Chem., 2011, 59, 2636–2645 Search PubMed.
- R. G. R. Pinheiro, M. Pinheiro and A. R. Neves, Nanomaterials, 2021, 11(10), 2658 Search PubMed.
- S. S. Taher, K. K. Al-Kinani, Z. M. Hammoudi and M. m. Ghareeb, J. Adv. Pharm. Educ. Res., 2022, 12, 63–69 CAS.
- M. Islami, A. Zarrabi, S. Tada, M. Kawamoto, T. Isoshima and Y. Ito, Int. J. Nanomed., 2018, 13, 6059–6071 CAS.
- J. S. Seong, M. E. Yun and S. N. Park, Carbohydr. Polym., 2018, 181, 659–667 CAS.
- T. Zhang, H. Wang, X. Pan, X. Zhang, C. Shi and X. Zhang, J. Food Meas. Charact., 2024, 8233–8244 CAS.
- L. Mandić, M. Matković, G. Baranović and S. Šegota, Antioxidants, 2023, 12(3), 732 Search PubMed.
Footnote |
| † Electronic supplementary information (ESI) available. See DOI: https://doi.org/10.1039/d5ra00334b |
| This journal is © The Royal Society of Chemistry 2025 |