
 Open Access Article
 This Open Access Article is licensed under a Creative Commons Attribution-Non Commercial 3.0 Unported Licence
Silane modified nitrogen-doped graphene quantum dots as a high-efficiency hybrid sorbent for NSAIDs†
Abdullah Alhendal *
*
Department of Chemistry, Faculty of Science, Kuwait University, Safat 13060, State of Kuwait, Kuwait. E-mail: abdullah.alhendal@ku.edu.kw
First published on 27th March 2025
Abstract
A hybrid sorbent material was developed by modifying nitrogen-doped graphene quantum dots (N-GQDs) with 3-glycidyloxypropyltrimethoxysilane (GPTMS) and 3-aminopropyltriethoxysilane (APTS), producing functionalized GQDs (f-GQDs) with enhanced extraction capabilities. Combining the adsorption properties of GQDs with the functional versatility of silanes, this material effectively serves as a solid-phase extraction sorbent for non-steroidal anti-inflammatory drugs (NSAIDs) from aqueous matrices. The f-GQDs composite was thoroughly characterized by transmission electron microscopy (TEM), scanning electron microscopy (SEM), X-ray photoelectron spectroscopy (XPS), Fourier transform infrared spectroscopy (FT-IR), thermogravimetric analysis (TGA), atomic force microscopy (AFM), and zeta potential analysis, confirming structural integrity and functional enhancements. The synergistic effects of silanes on the N-GQDs surface provided increased hydrophobicity and additional adsorption sites, resulting in superior extraction efficiency compared to conventional materials. Analytical parameters were optimized to yield maximum extraction performance, with the method showing excellent linearity (r2 ≥ 0.99) over a concentration range of 50–500 μg L−1, and low limits of detection (15.72–23.60 μg L−1) and quantification (51.89–70.62 μg L−1). High enrichment factors, recovery rates (95–98.7%), and reproducibility (RSDs < 10%, n = 3) demonstrate the robustness of this approach. Successfully applied to NSAID determination in an acetate buffer solution, this method is both efficient and sustainable, requiring minimal sorbent to achieve high extraction yields, showing strong potential for environmental and pharmaceutical analyses.
1. Introduction
Recent advances in nanotechnology have opened new avenues for addressing various scientific challenges. In particular, graphene quantum dots (GQDs) have emerged as promising candidates in diverse applications, including cancer theragnostics,1 sensing,2 water treatment,3 and adsorption.4 GQDs, along with their derivatives such as graphene oxide and reduced graphene oxide, are attracting significant attention due to their unique physical and chemical properties, including an impressive surface area of up to 2600 m2 g−1 and a rich variety of functional groups (e.g., carbonyl, hydroxyl, and epoxide) on their surfaces, which are particularly beneficial for adsorption applications.5,6To enhance the adsorption capabilities of GQDs, extensive surface modifications have been explored. Various ligands, including oxygen- and hydroxyl-functionalized graphene, amine-functionalized graphene oxide, and thiol-functionalized magnetic graphene oxide, have been employed to improve performance in adsorption applications.7,8 GQDs, as the latest addition to functional carbon nanomaterials, exhibit multifunctionality due to their inherent properties, such as water solubility, biocompatibility, and the ability to be easily functionalized.9–12 Notably, the incorporation of nitrogen as a dopant significantly impacts electron distribution, enhancing the ability of GQDs to serve as effective substrates for selective fluorescence sensors, particularly in imaging applications for mercury ions in living cells.13–20
Among the pharmaceutical compounds of interest, nonsteroidal anti-inflammatory drugs (NSAIDs) have gained substantial attention since the discovery of aspirin.21 These medications are widely used to treat various ailments, including pain, fever, and inflammatory conditions such as osteoarthritis and rheumatoid arthritis.22,23 Despite their therapeutic efficacy, NSAIDs are associated with several adverse side effects, including gastrointestinal toxicity and cardiovascular risks. Consequently, there is a growing demand for efficient protocols and methods to enrich and preconcentrate NSAIDs for their detection and separation from complex matrices, including water,24 urine, human plasma,25 and various food products.26–29
High-Performance Liquid Chromatography (HPLC) remains a cornerstone technique for NSAID analysis in environmental and biological contexts.21 However, the need for efficient sample preparation methods is increasingly critical. Several methodologies have been explored, such as solid-phase extraction (SPE) utilizing carbon nanotubes and electro-membrane extraction coupled with HPLC.30,31 Advances in HPLC methods have enabled the simultaneous determination of multiple NSAIDs in various formulations,32,33 while ultra-performance liquid chromatography–tandem mass spectrometry (UPLC–MS/MS) has shown promise for quantification in environmental samples.34,35 GQD hybrids represent a promising class of sorbents, owing to their easy preparation and specific adsorption properties, such as surface area, pore size, and functional group composition.36
In this study, we introduce a novel approach for functionalizing nitrogen-doped GQDs (N-GQDs) with the silane coupling agent 3-glycidoxypropyltrimethoxysilane (GPTMS), which introduces epoxy functional groups on the N-GQDs surface, resulting in sol–gel active GQDs (Si-GQDs). Further modification through the epoxide ring-opening of GPTMS with the amino group of aminopropyltrimethoxy silane (APTS) will yield a stable, epoxy-functionalized GQD sorbent, referred to as functionalized GQDs (f-GQDs). The modification of N-GQDs with silanes significantly enhances the hydrophobicity of the material, this increased hydrophobicity improves the adsorption of non-polar compounds, such as non-steroidal anti-inflammatory drugs (NSAIDs), from aqueous matrices. The interaction between the hydrophobic surface and the hydrophobic analytes leads to improved extraction efficiency compared to conventional materials. The incorporation of inorganic silicon with organic GQDs is anticipated to enhance the physicochemical properties, thermal and chemical stability, and provide unique intermolecular interactions essential for improving the extraction affinity and selectivity of the prepared hybrid sorbent. This study will utilize a modified SPE method employing f-GQDs as a selective and efficient sorbent for the determination of six commonly used NSAIDs: aspirin (ASP), naproxen (NAP), ibuprofen (IBU), loxoprofen (LOX), diclofenac sodium (DC), and mefenamic acid (MEF) from an acetate buffer solution, simulating real sample conditions.
2. Experimental
2.1. Reagents and materials
The chemicals used in this work were of analytical reagent grade and brought into use without further purification. The reagents and the solvents used were all HPLC grade. Citric acid (>99.5%, Anhydrous), urea (ACS reagent, 99.0–100.5%), acetonitrile (ACN, 99.9%), 3-glycidoxypropyltrimethoxysilane (GPTMS, 99%), 3-aminoprppyltriethoxy silane (APTS, 98%), ethanol (≥99.9% (GC)), acetic acid (CH3COOH, ≥ 99.9%), hydrochloric acid (HCl, 37%, ACS reagent), and sodium acetate trihydrate (CH3COONa·3H2O, ACS reagent, ≥99%) were obtained from Sigma Aldrich Chemical Co. The NSAIDs were extracted from different tablets containing aspirin (ASP), naproxen (NAP), ibuprofen (IBU), loxoprofen sodium (LOX), diclofenac sodium (DC) and mefenamic acid (MEF) drugs. The different information related to these tablets is given in Table 1S.† Deionized water was purified by a Milli-Q (IQ 7005) system.2.2. Instrumentation and chromatographic conditions
Fourier transform infrared (FTIR) spectroscopy is used to get the absorption spectra of the sorbent particles in the range of 400–4000 cm−1 from JASCO FTIR Spectrometer-6300. X-ray photoelectron spectroscopy (XPS) was used to determine the surface elemental composition of C, O, N and Si to identify the functional groups present. The XPS spectra were recorded with a Thermo ESCALAB 250 Xi using a monochromatic radiation source. Scanning electron microscopy (SEM) was used to study the morphology of the sorbent particles. To get SEM micrographs the particles were fixed on the stub by using a double-sided tape and then coated with gold Multimode atomic force microscope with nanoscope IV controller was used for Atomic Force Microscopy (AFM) analysis. Images were acquired with the tapping mode (RTESP tips). Transmission electron microscopy (TEM) images were obtained by a JEOL JEM-1200 microscope at an acceleration voltage of 120 kV. Samples were subjected to ultrasonic treatment in absolute ethanol for 20 minutes and then applied to 100-mesh copper grids coated with continuous carbon support films. Thermogravimetry (TGA) was performed on approximately 10 mg of the sample from ambient to 800 °C at a heating rate of 10 °C min−1 in air using TGA-50 TA automatic analyzer. ZETA potential was used to test the surface charges on the sorbent particles. Zetasizer Nano Zs with MPT Titrator was used. The pH range was fixed between 3- and 12 with an increment rate of 0.5. The chromatographic analyses were performed on ODS Hypersil C18 column (3 μm, 100 × 2.1 mm), that was equipped with a PDA detector. NSAIDs were analyzed at 25 °C with acetonitrile-water (0.1% phosphoric acid) (55![[thin space (1/6-em)]](https://www.rsc.org/images/entities/char_2009.gif) :45, v/v) as the mobile phase at a constant flow rate of 1 mL min−1 with a total time of 10 min. The detection wavelengths are 204 nm and 225 nm for aspirin and naproxen respectively. For others 200 nm was found the best. The sample injection volume was 10 μL. Chromatographic data were processed using Empower software.
:45, v/v) as the mobile phase at a constant flow rate of 1 mL min−1 with a total time of 10 min. The detection wavelengths are 204 nm and 225 nm for aspirin and naproxen respectively. For others 200 nm was found the best. The sample injection volume was 10 μL. Chromatographic data were processed using Empower software.
2.3 Modified epoxy functionalized GQD sorbent (f-GQD)
The preparation of the f-GQD sorbent follows a three-step process as outlined in Fig. 1, initially, N-GQDs are synthesized using citric acid and urea. Subsequently, Si-GQD is formed by employing GPTMS. The last step involves curing through the amine end group of APTS. The N-GQDs was synthesized by pyrolysis of citric acid according to previously reported procedure37,38 with modification. Briefly, a clear solution of citric acid (0.21 g, 1 mmol) and urea (0.18 g, 3 mmol) in water was heated at 200 °C for 30 min. The orange liquid had been diluted with 20 mL distilled water and filtered through a 0.2 μm membrane. Evaporated the filtrate, and the solid was dried under vacuum at 80 °C.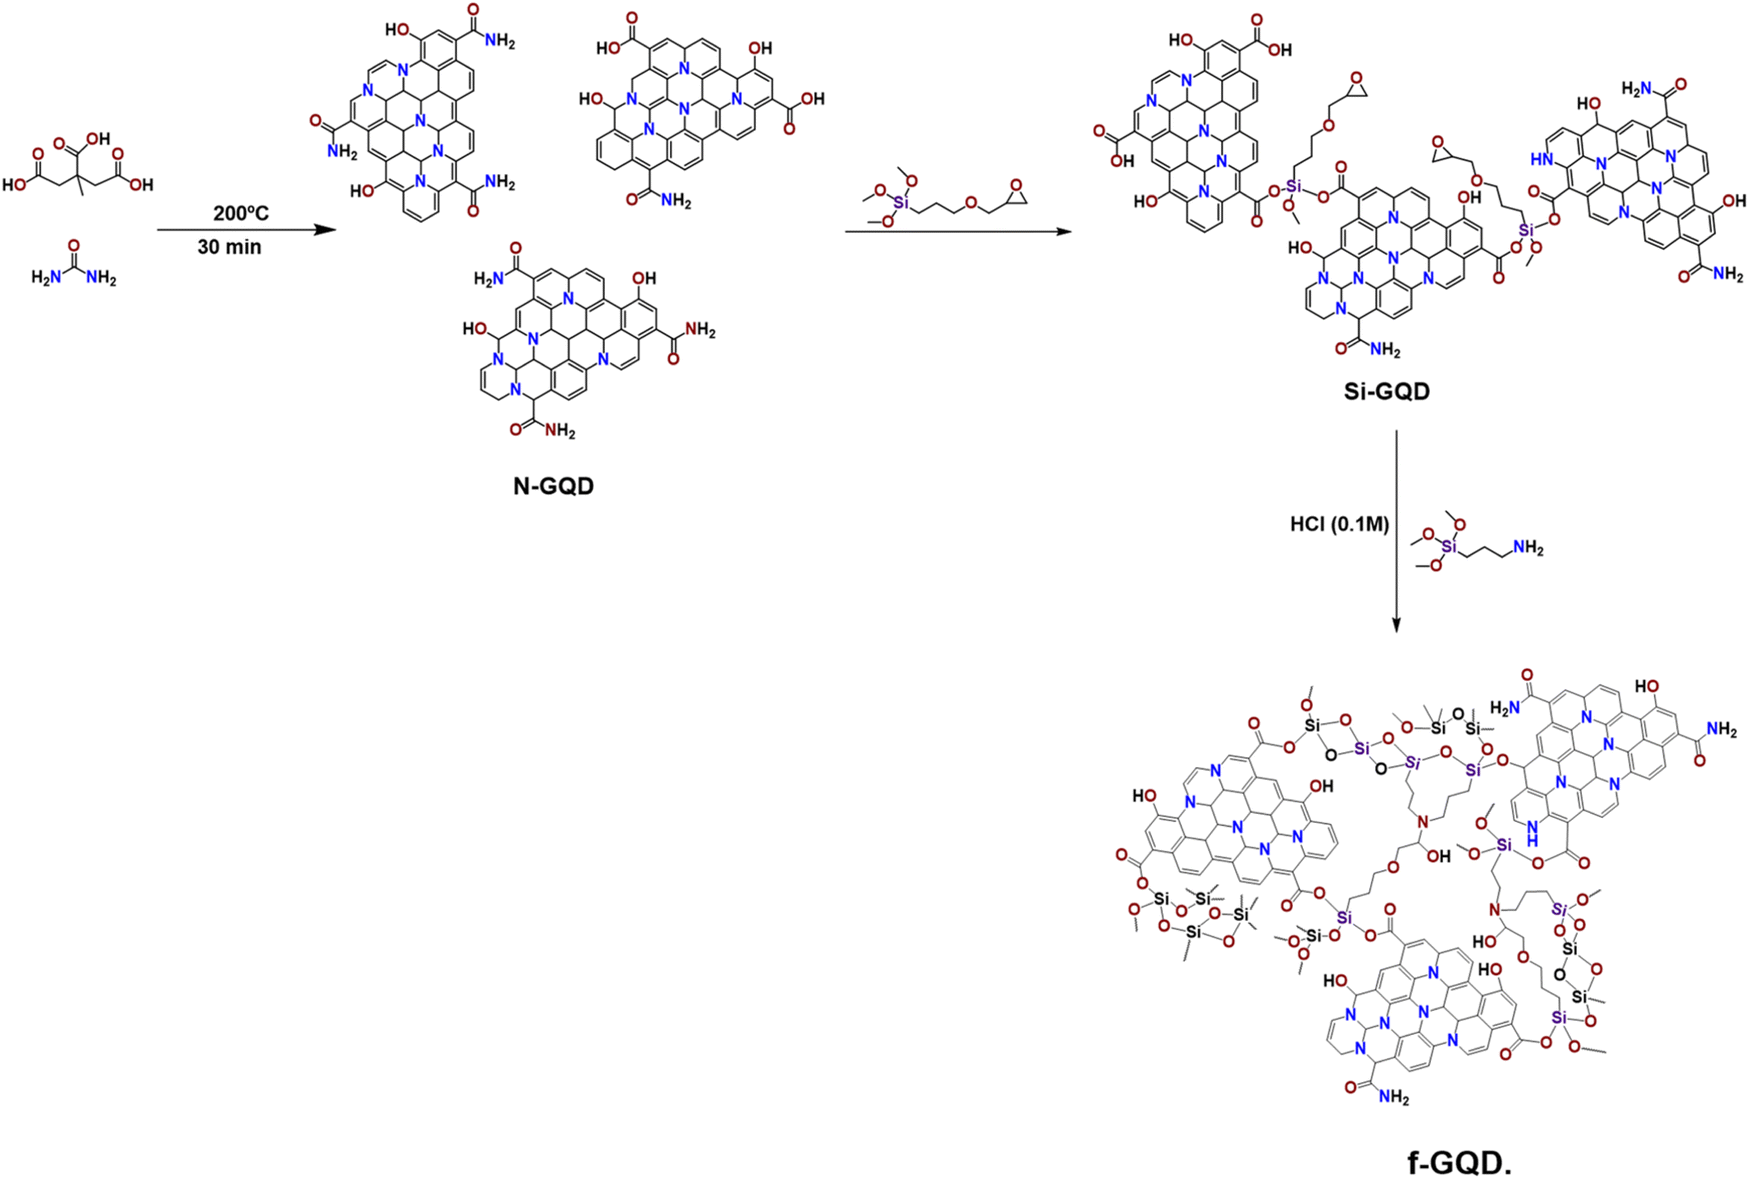 | ||
| Fig. 1 Scheme for the chemical process to prepare f-GQD. | ||
GPTMS silane functionalized GQDs were prepared using a simple method. In a typical procedure, 20 mg of N-GQDs were dispersed in 40 mL of deionized water by sonicating for 30 minutes. Then, GPTMS was added in specific ratios of 1:1, 1:2, 1:4, and 1:5 relative to the amount of GQDs. The obtained solution was stirred at 80 °C for 24 h. The GPTMS functionalized GQDs with dark brown color were washed with ethanol and DI water and dried at 60 °C to do characterization to identify the epoxy end group on it. Then the average peak area tried with each set and 1:4 ratio was found the best). After the silanization with GPTMS, the epoxide end group of the GPTMS is cured by using the amine end group of the 3-amino propyl trimethoxy silane. To do the epoxy ring opening the GQD- GPTMS mixture was first stirred at 60 °C for 5 minutes and then calculated amount of APTS is added to that mixture. To enhance sol–gel reaction 0.01 M HCl is used and stirred vigorously at 60 °C for 3 h And stirring continued till next day at room temperature. The particle is washed several times with distilled water and ethanol and dried at 60 °C. and stirring continued till next day at room temperature. The particle is washed several times with distilled water and ethanol and dried at 60 °C.
2.4. Sample preparation and HPLC condition
A stock solution of each component (ASP, NAP, IBU, LOX, DC, MEF: 25, 3, 40, 5, 5, 3.75 g mL−1 respectively) is formed by dissolving one drug tablet in 20 mL methanol (Table 1S†). A separate 0.5 mg mL−1 stock solution was prepared for each of the six chosen NSAIDs by dilution with 20 mL of the mixture of water and ethanol. Subsequent dilution with 0.1 M acetate buffer solution (pH = 3.5) was carried out to create working solutions spanning concentrations from 50 to 500 μg L−1. All stock solutions exhibited stability for at least one month when stored in a refrigerator. The physio-chemical properties of the targeted analytes are detailed in Table 1S.†Acetate buffer (pH 3.5) was made by mixing acetic acid (CH3COOH, 8.33 g, 0.139 mol) and sodium acetate trihydrate (CH3COONa·3H2O, 1.2 g, 8.8 mmol) in 1 L deionized water. The acetate buffer solution was used as a solvent in the sample mixture preparation which upon the use of HCl solution (0.1 M), the desired solution pH was adjusted. All potentiometric studies were proceeded with a digital pH meter. The chromatographic analyses of the mixture were carried out by isocratic elution mode at room temperature. The mobile phase composition was 55:45 (v/v) of acetonitrile, and acetic acid (0.1 M). The flow rate was 1 mL min−1. In addition, the UV spectra of individual drugs were recorded in the wavelength range from 200 to 400 nm and compared. The drugs loxoprofen, diclofenac sodium and mefenamic acid could produce peaks with good resolution at 200 nm and its mixture were made one set analytes. But the choice to use a common wavelength for the second set of analytes (ASP, NAP, IBU) was difficult and so different wavelengths 204, 230, and 204 nm were considered satisfactory, permitting the detection of all drugs with adequate sensitivity and different room temperature.
2.5. Dispersive SPE procedure
The extraction strategy for the targeted NSAIDs involved the utilization of the f-GQD sorbent. In each set of three NSAIDs, 2.0 mg of the prepared f-GQD composite was dispersed in 10 mL of sample solution (50 to 500 μg L−1), followed by shaking the mixture for 30 minutes to facilitate adsorption. Subsequently, the f-GQD composite with adsorbed analytes was separated by vortex. The analytes were then desorbed from the sorbent using 0.15 mL of a mixture of (acetonitrile: acetic acid: 70:30% v/v) as the desorption solvent, with a vortex time of another 30 minutes. Finally, an aliquot was extracted for analysis using the HPLC system.
3. Results and discussion
The structure and surface functional groups of pristine N-GQDs (A), Si-GQD (B) and f-GQD (C) were probed by FTIR analysis (Fig. 2). The N-GQDs shows bands at 3400 cm−1, 3200 cm−1 that can be attributed to the stretching and bending vibrations of O–H and N–H groups, respectively. Individual peaks appeared at 1710 cm−1 and 1667 cm−1 for C–O in –COOH and –CONH groups.39,40 The peak appeared at 1575 cm−1 and 1401 cm−1 correspond to the bending vibrations of C![[double bond, length as m-dash]](https://www.rsc.org/images/entities/char_e001.gif) C and C–N, respectively.37 The broad peak from 3000–3500 cm−1 reveals the presence of a lot of amino and hydroxyl groups on the GQD surface. The oxirane peak at 913 cm−1 from the Si-GQD due to GPTMS got diminished in the f-GQD which enhances the successful epoxide curing by the amino group of the APTS.41 As Shown in the Fig. 2, the –CH2 stretching bands appeared at 2938 to 2875 cm−1 and the Si–O–C and Si–O–Si bands in the region 1200–1000 cm−1.42 The peak at 1106 cm−1 increased in f-GQDs due to the addition of APTS. FTIR comparison has been done via overlay and all peaks have been given either in N-GQDs or in silanised GQDs. Negligible changes are only there in the peak values. The synthetic GQDs were found to contain aromatic rings, as evidenced by the bond at 1409 cm−1 and the bond around 1575 cm−1 (depends on conjugation and will vary slightly) assigned to the CC stretching vibration of the aromatic ring.
C and C–N, respectively.37 The broad peak from 3000–3500 cm−1 reveals the presence of a lot of amino and hydroxyl groups on the GQD surface. The oxirane peak at 913 cm−1 from the Si-GQD due to GPTMS got diminished in the f-GQD which enhances the successful epoxide curing by the amino group of the APTS.41 As Shown in the Fig. 2, the –CH2 stretching bands appeared at 2938 to 2875 cm−1 and the Si–O–C and Si–O–Si bands in the region 1200–1000 cm−1.42 The peak at 1106 cm−1 increased in f-GQDs due to the addition of APTS. FTIR comparison has been done via overlay and all peaks have been given either in N-GQDs or in silanised GQDs. Negligible changes are only there in the peak values. The synthetic GQDs were found to contain aromatic rings, as evidenced by the bond at 1409 cm−1 and the bond around 1575 cm−1 (depends on conjugation and will vary slightly) assigned to the CC stretching vibration of the aromatic ring.
 | ||
| Fig. 2 FTIR spectra of pristine (A) N-GQDs, (B) Si-GQD, and (C) f-GQD. | ||
The surface composition and elements of N-GQDs, Si-GQD, f-GQD were further confirmed by XPS characterization to study the functional group changes. Its full scan XPS spectrum of N-GQD (Fig. 3A) exhibits C 1s (284 eV), N 1s (401 eV) and O 1s (532 eV) peak, indicating that nitrogen doped GQD preparation was successful.43,44 In Si-GQD and in f-GQDs, the silica peaks appeared because of silanization.45 In Fig. 3B, the deconvoluted oxygen peaks of Si-GQD show O–Si–C bonding while that of f-GQD has been transformed to Si–O–Si due to APTS addition and the increased silica inclusion thereby. The Si–O–Si peak in f-GQD is shifted to a higher binding energy region due to Si–O–Si network structure. The C 1s region's high-resolution scan reveals five carbon peaks at various chemical environments: 284.66, 285.13, 286.81, and 288.67 eV. These peaks are attributed to C–C, CC, CN, C–O, and COOH groups (N–CO), respectively, and were primarily contributed by N-GQDs. Three peaks were identified in the O 1s XPS spectra of N-GQDs at 531.24, 532.05, and 533.21 eV, respectively, and were ascribed to O–C, OC, OC, and O–C. Three peaks are obtained at 399.69, 400.38, and 401.5 eV, as can be seen from the N 1s spectra. The primary peak at 399.69 eV is ascribed to pyrrolic N, which is a lattice oxygen substitution for nitrogen. N–H bands are responsible for the peaks at 400.4 and 401.2 eV in the meantime. The N peak shows that there is doping of GQDs with The N peak indicates that GQDs are doped with N which was obtained from urea during synthesis.46–49
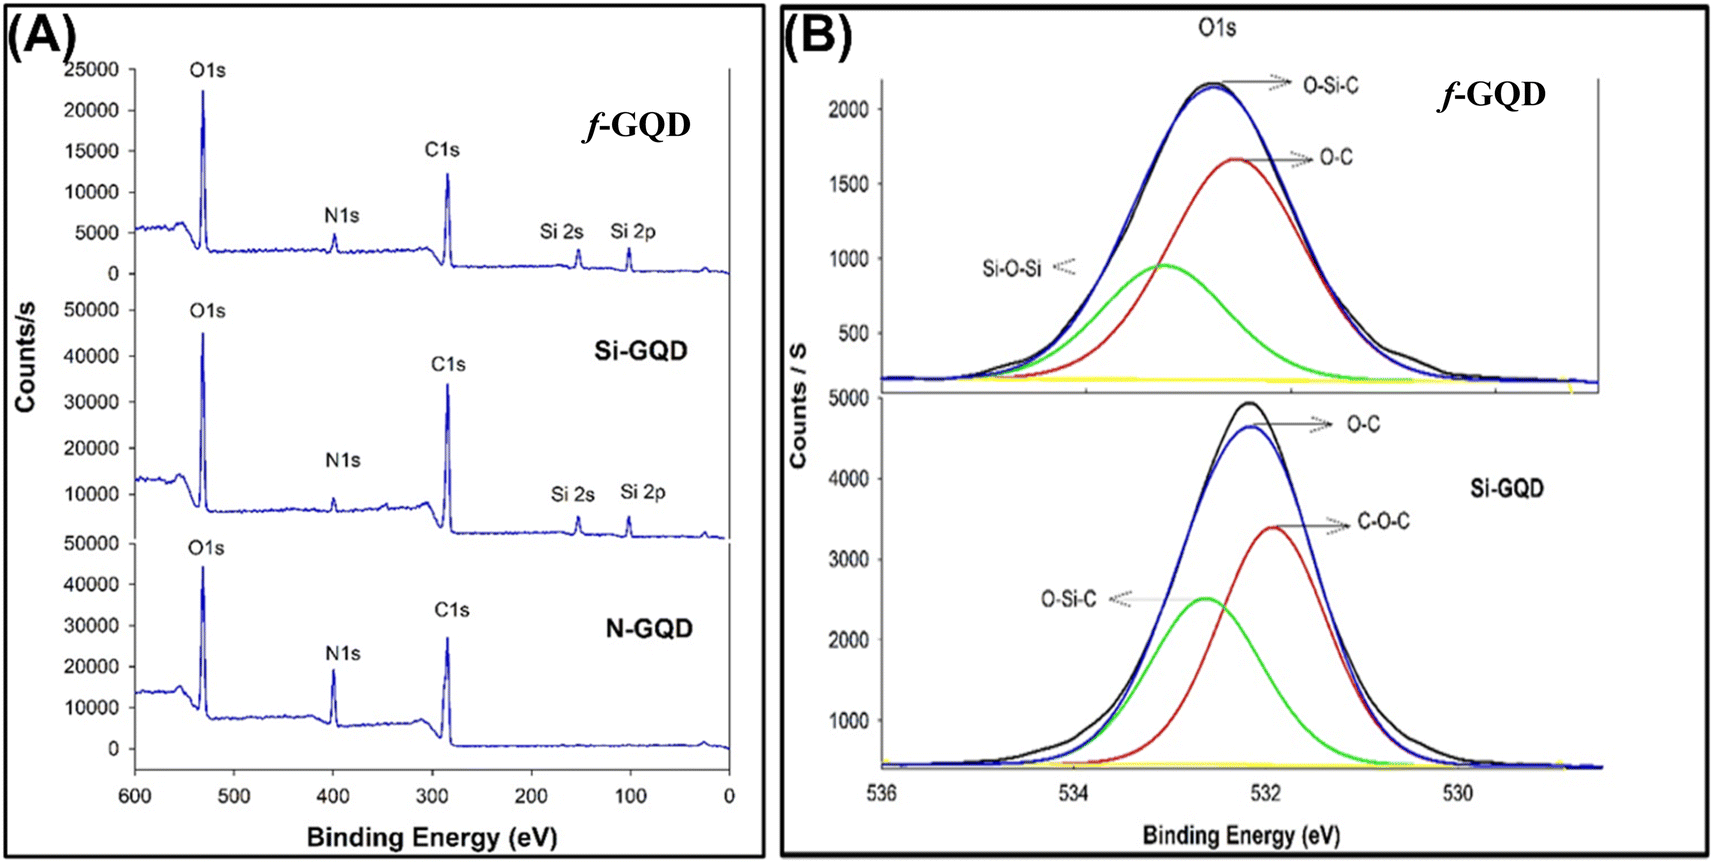 | ||
| Fig. 3 XPS spectrum of (A) pristine N-GQDs, Si-GQD, and f-GQD; (B) deconvoluted oxygen peaks of Si-GQD and f-GQD. | ||
Fig. 4 shows the morphology of N-GQDs and Si- GQD and f-GQD nanocomposites via images captured by FE-SEM instruments. The prepared N-GQDs surface morphology can be seen in the SEM picture as exfoliated sheets with good lamellar structure that exhibit ring formation as a result of strong sp2 bonds between carbon atoms, or as the shape of GQDs smaller than 10 nm in size. Since local chemical and physical factors have a sizable secondary impact on binding energy, XPS can provide explicit and convincing proof by outlining them in order to prevent incorrect interpretations of nitrogen doped GQD structure.50,51 The N-GQDs may contain amide, amine, carboxyl, and hydroxyl as surface functional groups. These surface functional groups would have interacted very well with the surface functional groups of the GPTMS and the Si-GQD formed with sharp boundaries with nanometer size. The surface of almost all particles in f-GQD is rather blurred or aggregated whereas the size became smaller due to the formation of modified epoxy from APTS and GPTMS. Which could increase the surface area and increase the number of voids.
 | ||
| Fig. 4 SEM images of pristine N-GQDs (A and B), Si-GQD (C and D) and f-GQD (E and F) with different magnification. | ||
Fig. 5 shows the transmission electron microscopy of (A): N-GQDs, (B): Si-GQDs, and (C): f-GQD. The TEM investigation verified the existence of the N-doped GQDs nanoparticle, which has a spherical shape morphology with particle sizes of approximately 10–50 nm. Because of the silica inclusion from GPTMS, the size development in Si-GQD is evident, but the shape is nearly spherical, just like it was in N-GQDs before. The GQDs may be linked together by the epoxy ring opening caused by APTS, creating pores between them, and making the f-GQD a unique NSAID sorbent. Non-aggregated GQD was produced by GPTMS silanization; however, as the TEM image demonstrates, the modified epoxy structure of f-GQD creates much more pores, and the inclusion of inorganic silica gives the sorbent enough rigidity to maintain its original pore size and shape even after multiple uses.
 | ||
| Fig. 5 TEM images of, (A) N-GOD, (B) Si-GOD, and (C) f-GQD. | ||
GQD's topography, size, and shape were all determined using AFM characterization, and the height profile gives information on the number of layers. If the height is less than 0.5 nm, the GQDs are single-layered, and if it is greater than 2 nm, there are up to three levels. The height chart of these showed that their height varied from 1 to 3.5 nm, typically less than 1.5 nm.52–54 The bright spots in the AFM images of N-GQDs imply the presence of nanosized GQDs which are non-aggregated. Whereas the f-GQD appears like clusters without sharp boundaries.45 The line profile measurements in Fig. 6, for the samples show maximum height in the case of f-GQD and minimum for N-GQDs, explicit the successful composite formation from N-GQDs. The SEM figure shows a little more size of the GQD particle because of stalked nature, it was not that much separated in the SEM image. For AFM analysis, a few droplets of the GQD solution were placed onto a mica substrate of 1 cm diameter to form ultra-thin film and allowed to air dry. In Si-GQD and in f-GQD, the corresponding height profile indicates the size enlargement or height increment due to silica inclusion by silanization and modified epoxy formation. In Si-GQD, pointed structures are present due to silica particles but it is covered by the organic part of the f-GQD and seems flat in the hybrid.
 | ||
| Fig. 6 AFM images of pristine (A) N-GQDs, (B) Si-GQD, and (C) f-GQD. | ||
Fig. 7 shows the thermo-grams of f-GQD in comparison to N-GQDs and Si-GQDs. The initial weight loss is due to decomposition of moisture and the sol–gel by-products in the case of Si-GQD and f-GQD. The main weight-loss occurs in the temperature range 360–420 °C which corresponds to the degradation of modified epoxy matrix. The decomposition temperature has been increased in proportion to the silica amount and that is the reason for higher TDT/thermal stability of f-GQD hybrid than that of Si-GQD.45 The bonding network between the GQD and the silanes can protect the hybrid by decreasing the mobility of free radicals produced during the degradation process.
 | ||
| Fig. 7 TGA thermograms of pristine N-GQDs, Si-GQD and f-GQD. | ||
In order to further prove the success preparation of f-GQD hybrid, the zeta potential of Si-GQD and f-GQD hybrid was measured in different pH solutions varying from 3 to 12. Fig. 8 indicated that the point of zero charge (PZC) of f-GQD hybrid reaches 8.66 due to numerous amine groups and that of the Si-GQD was 5.3.
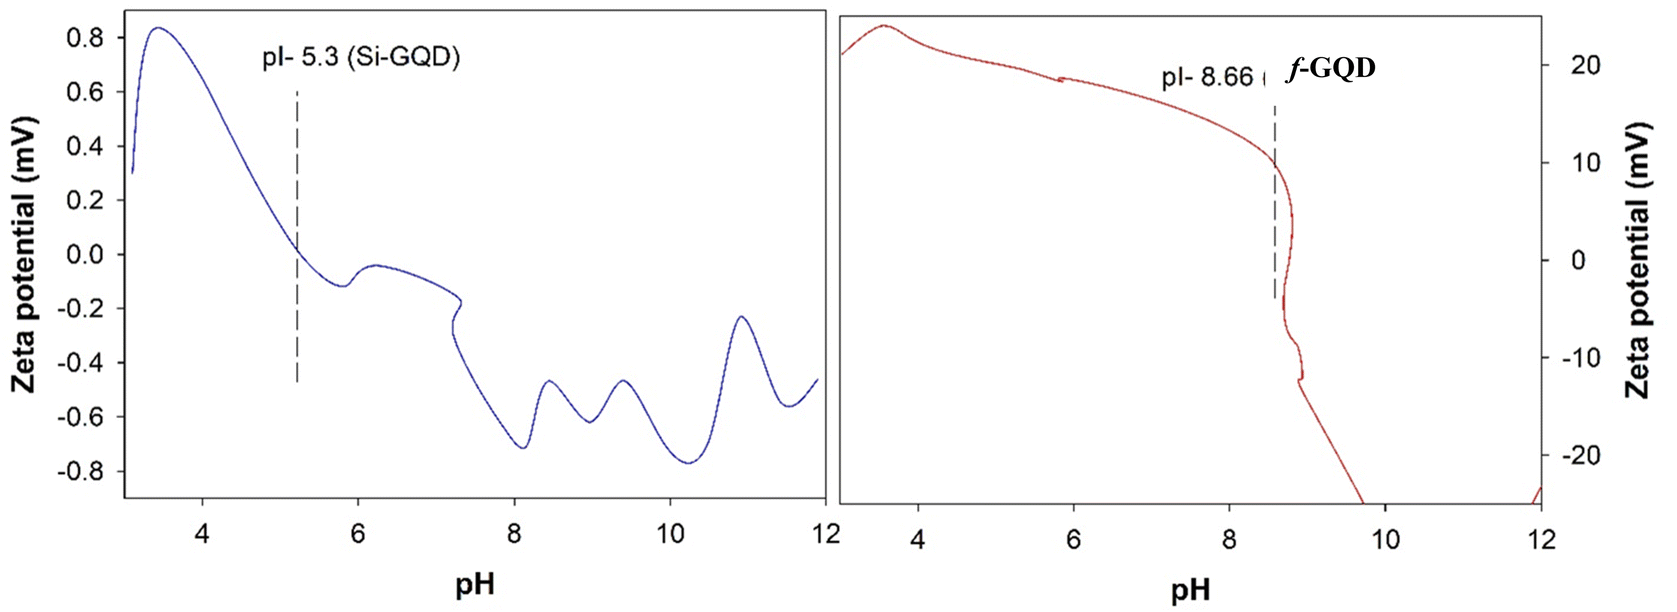 | ||
| Fig. 8 Zeta potentials of Si-GQD and f-GQD hybrid in different pH solution. | ||
3.1. Optimization of the dispersive SPE procedure
The selection of the desorption solvent is a critical aspect of the desorption process when utilizing f-GQD sorbent. In this study, four distinct solvents (ACN, and ACN: acetic acid at ratios of 70:30, 80:20, and 90:10% v/v) were carefully chosen to investigate the desorption of target analytes adsorbed on the sorbent's surface. Elution of NSAIDs from the sorbent was carried out using 0.5 mL of each solvent, with the ACN: acetic acid (70:30% v/v) yielding the highest elution efficiency. Fig. 9 illustrates the percentage increase in average peak area with various extraction parameters, including desorption solvent, sample pH, and the amounts of sorbent and sample. The percent increase in peak area was calculated to quantify the enhancement in analytical sensitivity after the implementation of the new method. This calculation provides a clear measure of improvement, demonstrating the effectiveness of the proposed approach in increasing the detection capabilities of the analysis. Fig. 9A illustrates the effect of the desorption solvents on the average peak area. Using ACN: acetic acid (90:10% v/v), the average peak area increased by 43.3%, 21.7%, and 21.7% for ASP, NAP, DIC, and MEF, respectively, while it decreased by 13.7% and 9.5% for IBU and LOX, respectively. Furthermore, by increasing the percentage of acetic acid in the solvent mixture (acetonitrile: acetic acid 70:30% v/v), the average peak area increased to 100.0%, 116.7%, 115.7%, 117.4%, 117.4%, and 118.2% for ASP, NAP, IBU, LOX, DIC, and MEF, respectively.
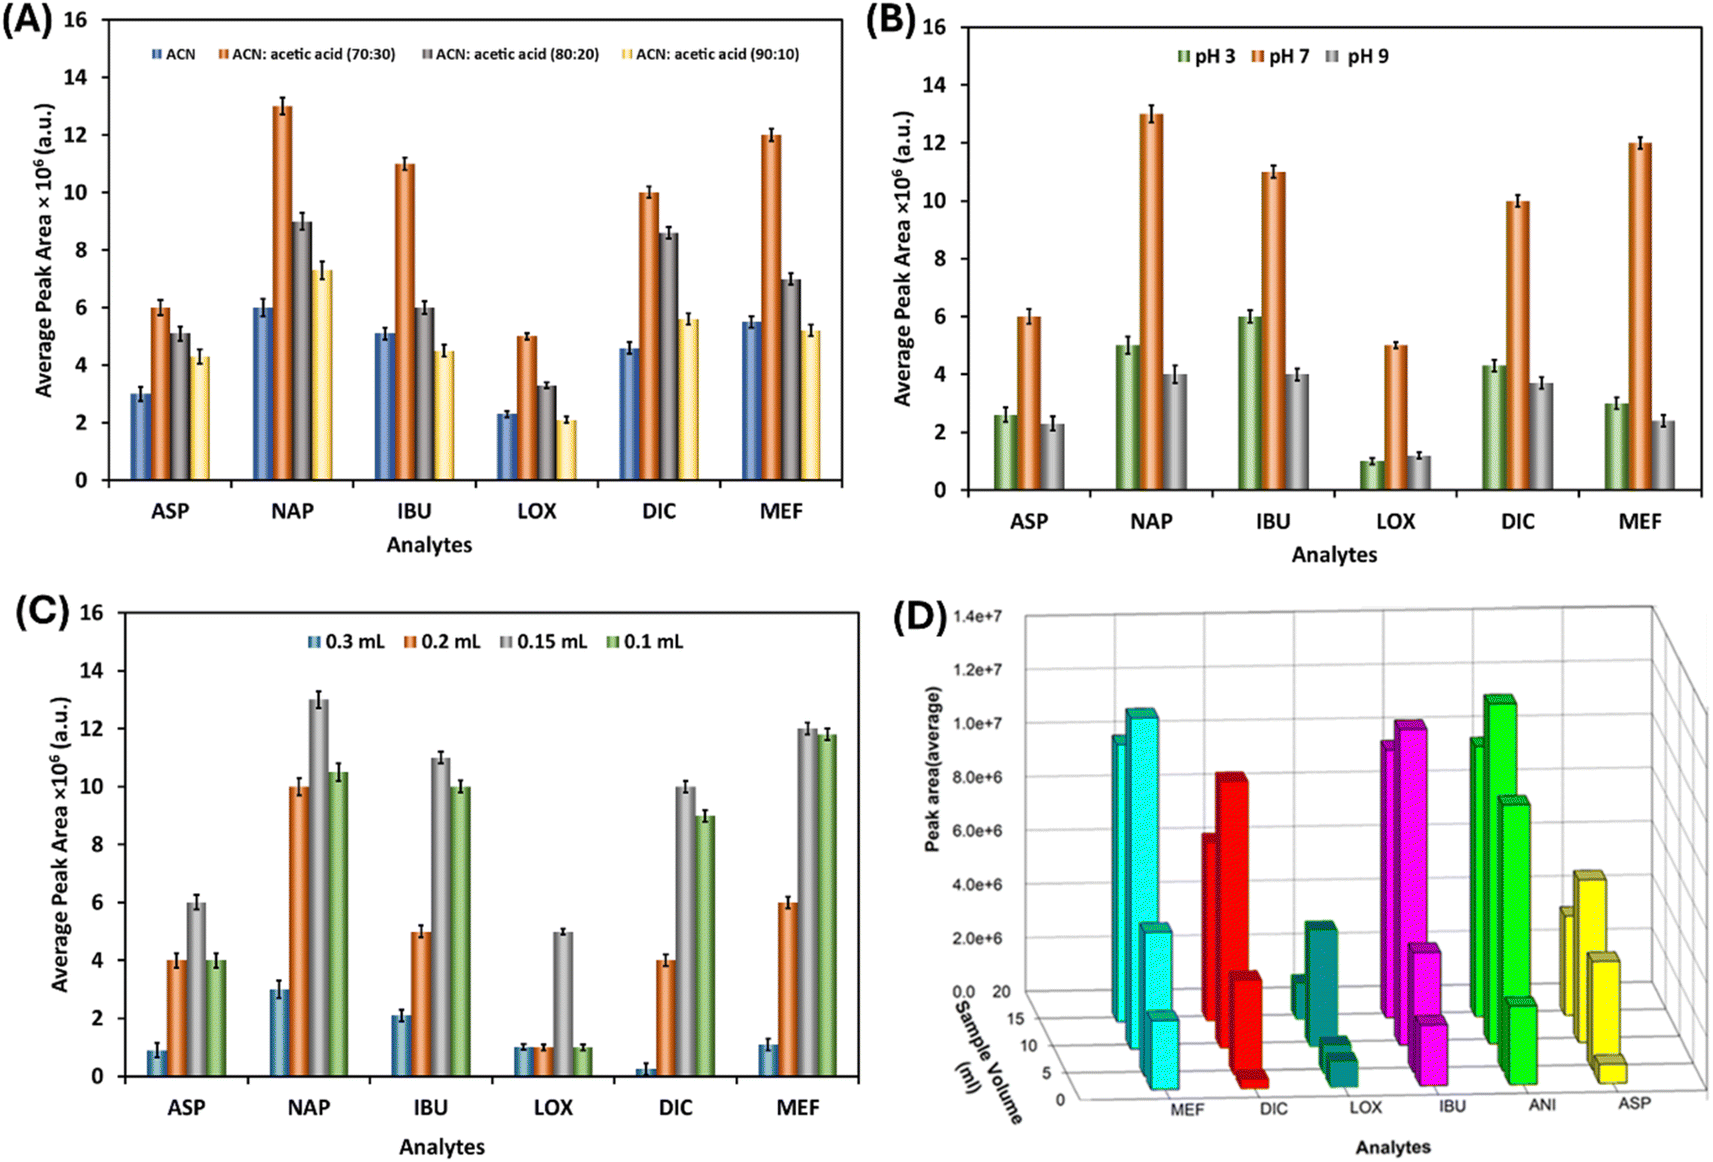 | ||
| Fig. 9 Effect of (A) desorption solvent, (B) pH of the NSIDs sample, (C) desorption solvent amount, and (D) sample volume on the average peak area of NSAIDs extracted by f-GQD sorbent. | ||
The pH of the sample liquids is crucial because it not only affects the charge of the sorbent but also the form in which analytes and impurities are present. A series of sample solutions with three different pH (pH-3, pH-7, and pH-9) was examined in detail. The experimental results showed that the highest average peak area was obtained for all of the analytes when the sample pH was at 7 (only DI water). The pKa of the absorbent is 8.66, and these NSAIDs are organic acids with pKa values less than 5 (Table 1S†). The sorbent and the analytes would both be protonated at pH 3, and they would both be deprotonated above 8.66. This may be the reason why pH-7 could produce a large yield. In order to achieve high extraction efficiency, different volumes of extraction solvents were studied. Fig. 9B shows an increase in the average peak area by 130.8%, 160%, 83.3%, 400%, 132.6%, and 300% for ASP, NAP, IBU, LOX, DIC, and MEF, respectively, when changing the pH from 3 to 7.
The investigation into the impact of extraction time on extraction efficiency was conducted by varying the volume of desorption solvent. The desorption solvent volumes were adjusted to 0.1, 0.15, 0.2, and 0.3 mL, and the extraction efficiency was evaluated based on the average peak area of the analytes. Fig. 9C shows that the percentage increase of NSAIDs improved as the desorption volume was reduced from 0.3 mL to 0.15 mL, resulting in percentage increases of 567.4%, 250%, 376.2%, 0.99%, 3500%, and 972.7% for ASP, NAP, IBU, LOX, DIC, and MEF, respectively. Therefore, the best extraction efficiency was achieved using a 10 mL sample volume and 0.15 mL of desorption solvent.
The effect of sample volume on extraction efficiency was assessed by adjusting the volumes to 5, 10, and 15 mL, and analyzing the resulting extraction performance through the average peak area of the analytes. As illustrated in Fig. 9D, the extraction efficiency of NSAIDs increased as the sample volume was raised from 5 mL to 10 mL, leading to notable percentage improvements. Consequently, the optimal extraction efficiency was observed with a 10 mL sample volume and 0.15 mL of desorption solvent. The impact of varying concentrations of NaCl solution on extraction efficiency was investigated. The addition of salt causes a decrease in the solubility of analytes in the aqueous sample, attributed to the salting-out effect. Additionally, it tends to elevate the viscosity of the solution, leading to a reduction in the diffusion coefficient. Salt addition is commonly employed to enhance the extraction of various compounds.21 Contrary to the expected outcome, the results depicted in this study reveal a decrease in the average peak area of analytes with an increase in the concentration of NaCl solution. This decrease could be attributed to the elevated viscosity of the sample solutions, which proved unfavourable for the extraction process. Consequently, no salt addition was incorporated into this study. Fig. 10 presents an HPLC chromatogram depicting NSAID extraction by f-GQD at a 200 μg L−1 sample concentration level.
 | ||
| Fig. 10 HPLC chromatogram for NSAID (200 μg L−1) after treatment with f-GQD. | ||
4. Method validation
The method has successfully identified NSAIDs concentrations, detecting as low as 200 μg L−1 at ambient temperature. Specificity, a crucial aspect of analytical methods, refers to their ability to differentiate between the analyte(s) and other elements in the sample matrix.55 In the case of HPLC, specificity is ensured by completely separating analyte peaks from other peaks originating from the sample matrix. To demonstrate specificity, specificity samples were injected in triplicate (n = 3), and representative chromatograms were generated. These chromatograms illustrated the clear resolution of all NSAIDs present in the sample matrix without interference, affirming the method's specificity. Linearity studies were conducted using different concentrations (50–500 μg L−1) of a mixture of each drug. Precision and accuracy were expressed as %RSD and are detailed in Table 1. The Limit of Detection (LOD) and Quantitation (LOQ) for each standard were determined from the calibration curves. The LOD, and LOQ values for the selected NSAIDs are provided in Table 1. Table 2 presents a comparison between the developed SPE method, and several relevant solid-phase extraction techniques described in the literature for the analysis of NSAIDs in aqueous samples using HPLC detection.| Analyte | Linear range (μg L−1) | r2 | LOD (μg L−1) | LOQ (μg L−1) | Recovery % | (Repeatability RSD, %) (n = 3) |
|---|---|---|---|---|---|---|
| ASP | 50–500 | 0.9963 | 23.60 | 71.62 | 98.6 | 4.7 |
| NAP | 50–500 | 0.9977 | 20.46 | 62.02 | 97.54 | 0.44 |
| IBU | 50–500 | 0.9966 | 17.37 | 57.32 | 98.7 | 6.1 |
| LOX | 50–500 | 0.9999 | 15.72 | 51.89 | 97.8 | 0.68 |
| DIC | 50–500 | 0.9996 | 18.40 | 60.72 | 99.8 | 0.79 |
| MEF | 50–500 | 0.9989 | 19.41 | 64.05 | 95.8 | 6.9 |
| Matrix | Analytes | Detection method | LOD | Ref |
|---|---|---|---|---|
| Wastewater and river water | NAP, IBU, DIC | SPE, UPLC | 0.15–1 μg L−1 | 56 |
| Human plasma and urine samples | LOX | HPLC-UV | — | 57 |
| Human urine | KET, DIC, MEF, NAP | SPMTE-HPLC-UV | 5.7–10.6 μg L−1 | 58 |
| Water | KET, NAP, DIC, IBU | (RP)-HPLC | 2–32 μg L−1 | 15 |
| Human serum | MEF | HPLC | 15 μg L−1 | 59 |
| Human urine | NAP, IBU, DIC, MEF | HPLC | — | 60 |
| Water | LOX, NAP, DC | HPLC-UV | 0.33–1.46 μg mL−1 | 21 |
| Acetate buffer solution | ASP, NAP, IBU, LOX, DIC, MEF | SPE-UPLC-UV | 15.72–23.60 μg L−1 | This work |
Conclusion
Here, a GQD hybrid sorbent was synthesized and put forth for the removal of NSAIDs from aqueous media, including ASP, LOX, DC, IBU, NAP, and ME. The NSAIDs were separated using acetonitrile-water (0.1% phosphoric acid) (55:45, v/v) as the mobile phase. The best extraction conditions for the 10 mL sample solutions at a concentration of 200 μg L−1 were selected as follows: pH 7, a 0.15 mL mixture of acetonitrile and acetic acid buffer (70:30) as the desorption solvent, without salt addition. The developed SPE-HPLC-UV resulted in good analytical performance: LOQs: 51.89 μg L−1, LODs: 15.72–23.60 μg L−1, and low RSD% values (0.44–6.9%) that was found comparable to the literature data. The calibration curves were plotted by the average peak response of the analytes versus the concentration, and each concentration was performed in triplicate. This newly proposed approach was compared with the previously reported method and was found to be capable of offering superior detection sensitivity for NSAIDs extraction. By showing how effective GQDs are at removing drugs from aqueous media and acetate buffer solution.
Data availability
Data are available on request from the author.Conflicts of interest
There are no conflicts to declare.Acknowledgements
The authors acknowledge the Research Administration of K. U. for the grant under Project SC02/19. We sincerely acknowledge the technical support from the EMU unit. We sincerely acknowledge the technical support from the EMU unit of K. U. for SEM and TEM analysis and the RSPU projects GS 01/05 and GS 01/01 for FTIR and TGA analysis.References
- M. K. Kumawat, M. Thakur, R. Bahadur, T. Kaku, R. S. Prabhuraj, A. Suchitta and R. Srivastava, Mater. Sci. Eng. C, 2019, 103, 11 CrossRef PubMed.
- M. S. Mehata and S. Biswas, Ceram. Int., 2021, 47, 19063–19072 CrossRef CAS.
- C. S. Tshangana, A. A. Muleja, A. T. Kuvarega, T. J. Malefetse and B. B. Mamba, J. Water Process Eng., 2021, 43, 102249 CrossRef.
- F. Wang, B. Pang, T. Yang and J. Liu, J. Mol. Liq., 2022, 362, 119690 CrossRef CAS.
- A. T. Smith, A. M. LaChance, S. Zeng, B. Liu and L. Sun, Nano Mater. Sci., 2019, 1, 31–47 CrossRef.
- R. L. White, C. M. White, H. Turgut, A. Massoud and Z. R. Tian, J. Taiwan Inst. Chem. Eng., 2018, 85, 18–28 CrossRef CAS.
- S. Nigar, H. Wang, M. Imtiaz, J. Yu and Z. Zhou, Appl. Surf. Sci., 2019, 481, 1466–1473 CAS.
- J. Liu, P. Wu, S. Li, M. Chen, W. Cai, D. Zou, N. Zhu and Z. Dang, Chemosphere, 2019, 225, 115–125 CAS.
- C.-Y. Tang, P. Yu, L.-S. Tang, Q.-Y. Wang, R.-Y. Bao, Z.-Y. Liu, M.-B. Yang and W. Yang, Ecotoxicol. Environ. Saf., 2018, 165, 299–306 CAS.
- Z. Wang, F. Lin, L. Huang, Z. Chang, B. Yang, S. Liu, M. Zheng, Y. Lu and J. Chen, Environ. Pollut., 2019, 254, 112854 Search PubMed.
- F. Amini Tapouk, R. Nabizadeh, S. Nasseri, A. Mesdaghinia, H. Khorsandi, A. H. Mahvi, E. Gholibegloo, M. Alimohammadi and M. Khoobi, J. Hazard. Mater., 2019, 368, 163–177 CAS.
- A. Kazemi, N. Bahramifar, A. Heydari and S. I. Olsen, J. Taiwan Inst. Chem. Eng., 2019, 95, 78–93 CAS.
- F. Khodadadei, S. Safarian and N. Ghanbari, Mater. Sci. Eng. C, 2017, 79, 280–285 CAS.
- C. Qu, D. Zhang, R. Yang, J. Hu and L. Qu, Spectrochim. Acta, Part A, 2019, 206, 588–596 CrossRef CAS PubMed.
- L. A. Al-Khateeb and F. A. Dahas, Arabian J. Chem., 2021, 14, 103226 CrossRef CAS.
- S. K. Debnath and R. Srivastava, Frontal Nanotechnol. Res., 2021, 3, 1–22 Search PubMed.
- W. Chen, G. Lv, W. Hu, D. Li, S. Chen and Z. Dai, Nanotechnol. Rev., 2018, 7, 157–185 CAS.
- P. Zheng and N. Wu, Chem.–Asian J., 2017, 12, 2343–2353 CAS.
- M. J. Sweetman, S. M. Hickey, D. A. Brooks, J. D. Hayball and S. E. Plush, Adv. Funct. Mater., 2019, 29, 1–18 Search PubMed.
- P. Tian, L. Tang, K. S. Teng and S. P. Lau, Mater. Today Chem., 2018, 10, 221–258 CAS.
- A. Alhendal, M. Rashad, A. Husain, E. Seyyal, F. Mouffouk and S. Makhseed, Microporous Mesoporous Mater., 2022, 344, 112152 CAS.
- C. S. Sharanya and K. Natarajan, in Drugs from Nature: Targets, Assay Systems and Leads, ed. M. Haridas, S. Abdulhameed, D. Francis and S. S. Kumar, Springer Nature Singapore, Singapore, 2024, pp. 179–203 Search PubMed.
- N. K. Panchal and E. Prince Sabina, Food Chem. Toxicol., 2023, 172, 113598 CrossRef CAS PubMed.
- V. Rodríguez-Saldaña, C. Castro-García, R. Rodríguez-Maese and L. O. Leal-Quezada, TrAC, Trends Anal. Chem., 2023, 169, 117409 CrossRef.
- N. Aranda-Merino, M. Ramos-Payán, M. Callejón-Mochón, M. Villar-Navarro and R. Fernández-Torres, Anal. Bioanal. Chem., 2020, 412, 6811–6822 CAS.
- M. del C. Gómez-Regalado, L. Martín-Pozo, J. Martín, J. L. Santos, I. Aparicio, E. Alonso and A. Zafra-Gómez, Molecules, 2022, 27, 48 Search PubMed.
- M. H. El-Maghrabey, N. Kishikawa and N. Kuroda, Biomed. Chromatogr., 2020, 34, e4756 CAS.
- H. Duo, J. Yue, X. Zhang, S. Li, Y. Yin, L. Wang, J. Li, W. Rong, A. Wang, Y. Zhang and Q. Zhu, Microchem. J., 2024, 196, 109557 CAS.
- T. S. Castilhos, F. Barreto, L. Meneghini and A. M. Bergold, Food Addit. Contam.,:Part A, 2016, 33, 1166–1174 CAS.
- I. Reinholds, I. Pugajeva, D. Zacs, E. Lundanes, J. Rusko, I. Perkons and V. Bartkevics, Environ. Monit. Assess., 2017, 189, 568 CAS.
- M. R. Payán, M. Á. B. López, R. F. Torres, M. V. Navarro and M. C. Mochón, Talanta, 2011, 85, 394–399 Search PubMed.
- M. H. Alqarni, F. Shakeel, S. Alshehri, A. I. Foudah, T. M. Aljarba, F. M. Abdel Bar and P. Alam, Green Process. Synth., 2024, 13, 20230220 CAS.
- H. K. Ashour, M. A. Korany, A. G. Abdelhamid, T. S. Belal and D. A. Gawad, Microchem. J., 2024, 199, 110092 CAS.
- T. Ganesan, N. H. Mukhtar, H. N. Lim and H. H. See, Separations, 2020, 7, 1–10 Search PubMed.
- M. Szőgyi and T. Cserháti, Pharm. Anal. Acta, 2012, 03, 3–6 Search PubMed.
- P. L. Yap, M. J. Nine, K. Hassan, T. T. Tung, D. N. H. Tran and D. Losic, Adv. Funct. Mater., 2021, 31, 1–25 CrossRef.
- F. S. Freitas, A. S. Gonçalves, A. De Morais, J. E. Benedetti and A. F. Nogueira, J. NanoGe J. Energy Sustain, 2012, 11002–11003 Search PubMed.
- T. Ogi, H. Iwasaki, K. Aishima, F. Iskandar, W. N. Wang, K. Takimiya and K. Okuyama, RSC Adv., 2014, 4, 55709–55715 RSC.
- M. T. Hasan, R. Gonzalez-Rodriguez, C. Ryan, N. Faerber, J. L. Coffer and A. V. Naumov, Adv. Funct. Mater., 2018, 28, 1–10 CrossRef.
- J. Diao, T. Wang and L. Li, R. Soc. Open Sci., 2019, 6, 9 Search PubMed.
- S. Ma, W. Liu, Z. Wei and H. Li, J. Macromol. Sci., Part A:Pure Appl. Chem., 2010, 47, 1084–1090 CrossRef CAS.
- S. H. Liu, M. Y. Shen, C. F. Kuan, H. C. Kuan, C. Y. Ke and C. L. Chiang, Polymers, 2019, 11, 1–16 Search PubMed.
- B. Shi, Y. Su, Y. Duan, S. Chen and W. Zuo, Microchim. Acta, 2019, 186, 397 CrossRef PubMed.
- Z. Xing, Z. Ju, Y. Zhao, J. Wan, Y. Zhu, Y. Qiang and Y. Qian, Sci. Rep., 2016, 6, 1–10 CrossRef PubMed.
- A. Alhendal, J. Shiju, M. Rashad, F. Al-sagheer and Z. Ahmad, RSC Adv., 2022, 12, 26753–26762 RSC.
- A. Afzal, H. M. Siddiqi, S. Saeed and Z. Ahmad, RSC Adv., 2013, 3, 3885–3892 CAS.
- P. F. Lim and K. H. Leong, Environ. Sci. Pollut. Res., 2019, 3455–3464 CAS.
- B. Shi, Microchim. Acta, 2019, 186, 397 Search PubMed.
- Y. Hao, H. Guo, L. Tian and X. Kang, RSC Adv., 2015, 5, 43750–43755 CAS.
- A. Mikhraliieva, V. Zaitsev, O. Tkachenko, M. Nazarkovsky, Y. Xing and E. V. Benvenutti, RSC Adv., 2020, 10, 31305–31315 CAS.
- C. Zhao, X. Song, Y. Liu, Y. Fu, L. Ye, N. Wang, F. Wang, L. Li, M. Mohammadniaei, M. Zhang, Q. Zhang and J. Liu, J. Nanobiotechnol., 2020, 18, 1–32 Search PubMed.
- C. Hadad, J. M. González-Domínguez, S. Armelloni, D. Mattinzoli, M. Ikehata, A. Istif, A. Ostric, F. Cellesi, C. M. Alfieri, P. Messa, B. Ballesteros and T. Da Ros, Nano Res., 2021, 14, 674–683 CAS.
- A. Ghorai, A. Midya and S. K. Ray, New J. Chem., 2018, 42, 3609–3613 CAS.
- S. Chinnusamy, R. Kaur, A. Bokare and F. Erogbogbo, MRS Commun., 2018, 8, 137–144 CAS.
- T. H. H. Le, T. H. Phung and D. C. Le, J. Anal. Methods Chem., 2019, 2019, 6143061 Search PubMed.
- L. M. Madikizela and L. Chimuka, J. Pharm. Biomed. Anal., 2016, 128, 210–215 CAS.
- K. S. Choo, I. W. Kim, J. K. Jung, Y. G. Suh, S. J. Chung, M. H. Lee and C. K. Shim, J. Pharm. Biomed. Anal., 2001, 25, 639–650 CAS.
- S. Kamaruzaman, M. M. Sanagi, S. Endud, W. A. Wan Ibrahim and N. Yahaya, J. Chromatogr. B:Anal. Technol. Biomed. Life Sci., 2013, 940, 59–65 CAS.
- M. R. Rouini, A. Asadipour, Y. H. Ardakani and F. Aghdasi, J. Chromatogr. B:Anal. Technol. Biomed. Life Sci., 2004, 800, 189–192 CAS.
- T. Hirai, S. Matsumoto and I. Kishi, J. Chromatogr. B:Biomed. Sci. Appl., 1997, 692, 375–388 CAS.
Footnote |
| † Electronic supplementary information (ESI) available. See DOI: https://doi.org/10.1039/d5ra00253b |
| This journal is © The Royal Society of Chemistry 2025 |