
 Open Access Article
 This Open Access Article is licensed under a Creative Commons Attribution-Non Commercial 3.0 Unported Licence
Yolk–shell SnSe2@NC nanocubes: synergistic interior void and spatial confinement for superior sodium-ion battery anodes†
Yanan Dua,
Zhilong Wub,
Siying Wangb,
Ran Sunb,
Zhiya Lin c,
Hai Jiac,
Xiaohui Huangb,
Shaoming Ying*b and
Zhiqiang Huang*b
c,
Hai Jiac,
Xiaohui Huangb,
Shaoming Ying*b and
Zhiqiang Huang*b
aCollege of Chemistry and Materials Science, Fujian Normal University, Fuzhou 350117, China
bCollege of New Energy and Materials, Ningde Normal University, Fujian Provincial Key Laboratory of Featured Materials in Biochemical Industry, Ningde 352100, China. E-mail: huangzq003@126.com; yingshaoming@126.com
cCollege of Mathematics and Physics, Ningde Normal University, Ningde, 352100, China
First published on 24th February 2025
Abstract
Rationally designed nanostructured electrode materials, especially yolk–shell metal selenide@void@C architectures, are gaining prominence as potential anode candidates for sodium-ion batteries (SIBs) due to their exceptional sodium-ion storage capabilities. In this work, we propose a template-assisted carbon coating route to fabricate nitrogen-doped carbon nanocubes encapsulating SnSe2 nanoparticles, forming a yolk–shell structure with an internal void space (SnSe2@NC), resulting in a high-performance anode for SIBs. The yolk–shell architecture, with SnSe2 nanoparticles embedded within a nitrogen-doped carbon shell, significantly boosts structural integrity and sodium storage performance. The SnSe2@NC electrode delivers a high reversible capacity of 368.9 mA h g−1 after 50 cycles at 0.5 A g−1 and an impressive capacity retention of 324.2 mA h g−1 at 5 A g−1 after 1000 cycles. Electrochemical analyses reveal that the enhanced performance is attributed to the improved Na-ion diffusion kinetics, reduced charge-transfer resistance, and the structural stability conferred by the nitrogen-doped carbon shell and the internal void space. The yolk–shell SnSe2@NC nanocubes demonstrate superior electrochemical properties, representing a potential strategy for the development of advanced SIB anode materials.
1. Introduction
With the increasing prominence of energy and environmental issues, the development of new energy sources and the promotion of electric vehicles are emerging as an inevitable trend.1–3 The pursuit of advanced energy storage systems has led to a surge in the development of sodium-ion batteries (SIBs) as a viable alternative to lithium-ion batteries (LIBs), considering the abundance and cost-effectiveness of sodium resources and the similar working principles to those of LIBs.4–6 Central to the high performance of SIBs are high-capacity anode materials that can endure the volumetric changes during sodium intercalation and de-intercalation without sacrificing structural integrity.7–9 However, the larger ionic radius of Na+ compared to Li+ leads to slower diffusion kinetics within anode materials during cycling, making some LIBs anode materials, such as graphite, ineffective in SIBs.10–13 Thus, developing high-performance anode materials for SIBs is a significant challenge.Tin diselenide (SnSe2), possessing a high theoretical capacity (756 mA h g−1) and a large interlayer spacing, stands out as a potential anode material for SIBs. Despite this promise, its practical use faces challenges due to substantial volume expansion (≈420%) and particles aggregation during cycling, which lead to rapid capacity fading and poor rate capability.14,15 In recent years, considerable progress has been made by researchers in enhancing the sodium storage capabilities of SnSe2 anode for sodium-ion batteries.16–18
In this context, the design of SnSe2 based anode materials with structural features of accommodating volume changes and maintaining electronic and ionic conductivity is of crucial importance.19–21 Wang et al.22 proposed a self-templated strategy to fabricate porous carbon-fiber coated SnSe2 nanoparticles (SnSe2/NPC), which exhibited superior sodium storage performance in sodium-ion batteries (SIBs). The SnSe2/NPC electrode demonstrated high reversible capacity, fast charge/discharge rate performance, and enduring cycling stability, delivering substantial desodiation capacities of 416, 396, 385, 365, 332, and 305 mA h g−1 at current densities ranging from 0.1 to 5.0 A g−1. The remarkable performance was ascribed to the interconnected and porous architecture of SnSe2/NPC, which encapsulated SnSe2 nanoparticles within a porous carbon-fiber network. The porosity of the structure facilitated sodium ion diffusion, and the carbon-fiber layer enhanced electrical conductivity and maintained structural integrity. Park et al.23 constructed a unique yolk–shell structured SnSeS@C anode with goat pupil-like configuration of S-doped SnSe yolk and a hollow carbon shell, showing superior electrochemical performance, with a long cycle life of 186 mA h g−1 over 1000 cycles at 0.5 A g−1 and a rate capability of 112 mA h g−1 at 5 A g−1. The sophisticated structure and composition contributed to the enhanced electrochemical properties of the SnSeS@C anode.
Based on the literature review, an innovative strategy involves the use of hollow structures to encapsulate SnSe2 nanoparticles, providing a unique combination of interior void space for volume expansion and spatial confinement to maintain structural integrity. Additionally, incorporating an electrically conductive outer framework enhances both the electrical conductivity and chemical stability of the anode materials.24 Chen et al.25 developed a SnSe2/C–N anode material derived from Sn-MOFs, demonstrating outstanding performance in SIBs with stable capacities of 259 mA h g−1 at 0.1 A g−1 after 100 cycles. The key advancements were the use of MOFs as precursors to create a robust carbon framework, the enhancement of electrical conductivity, and the improvement in structural stability through nitrogen doping. Song et al.26 prepared SnSe/NC hollow nanospheres as SIB anodes with superior performance with 77.05% capacity retention (120.50 mA h g−1) after 900 cycles at 1 A g−1 and good rate capability, maintaining 285.69 mA h g−1 at 100 mA h g−1 after high-rate testing. The nitrogen-doped carbon matrix inhibited volume expansion and polyselenide loss, ensuring structural stability throughout cycling.
Incorporating heteroatoms like nitrogen into carbon to create a sturdy outer framework that encapsulates SnSe2 nanoparticles with an internal void space is a strategic approach to enhance the electrochemical performance of SnSe2. The nitrogen doping enhances the electronic conductivity of the carbon matrix, while the inner hollow structure provides mechanical support and limits the aggregation of SnSe2 nanoparticles, ensuring uniform distribution of stress during the sodiation/desodiation processes. This design effectively alleviates the mechanical strain associated with volume changes, thereby prolonging the lifespan of the anode material and enhancing its rate capability.
In this research, nitrogen-doped carbon nanocubes were fabricated as a shell to encapsulate SnSe2 nanoparticles (forming the yolk structure) with an internal void space (SnSe2@NC) by combining a template method with a polydopamine pyrolytic carbon coating approach (see ESI†). Compared to pristine SnSe2 without the nitrogen-doped carbon coating, the yolk–shell SnSe2@NC nanocubes leverage the physical buffering and chemical bonding between the nitrogen-doped carbon matrix and SnSe2 nanoparticles to suppress volume expansion and polyselenide loss, thereby achieving excellent long-term cycling stability for sodium storage. As a result, SnSe2@NC exhibits outstanding electrochemical performance as an anode material for sodium-ion batteries (SIBs), with a high capacity of 368.9 mA h g−1 at 0.5 A g−1 and remarkable rate cycle stability, retaining 324.2 mA h g−1 at 5 A g−1 after 1000 cycles. Moreover, the SnSe2@NC electrode demonstrates superior rate capability, with discharge capacities of 395.0, 363.5, 356.7, 347.0, and 324.4 mA h g−1 at current rates of 0.2, 0.5, 1, 2, and 5 A g−1, respectively. We further discuss structural characterization and the mechanisms underlying the enhanced electrochemical performance of SnSe2@NC, emphasizing the significance of structural design in the advancement of SIBs. This study is believed to offer valuable insights for the design and synthesis of high-performance metal selenide anodes for SIBs.
2. Results and discussion
Fig. 1 illustrates the schematic diagram of the controllable synthesis process for hollow nanocubes of SnSe2@NC. Firstly, uniform ZnSn(OH)6 nanocubes, approximately 100 nm in size, it were synthesized using the coprecipitation method (as the SEM picture shown in Fig. 2a). Then polydopamine (PDA) was in situ coated onto the ZnSn(OH)6 nanocubes, constructing core–shell structured ZnSn(OH)6@PDA nanocubes (as shown in Fig. 2b). Subsequently, ZnSn(OH)6@PDA were calcined at 600 °C in an Ar atmosphere, which was then etched with HCl dissolution to remove impurities and produce SnO2@NC hollow nanocubes (as shown in Fig. S1a†). Finally, SnO2@NC hollow nanocubes and Se powders were thoroughly mixed and calcined to obtain SnSe2@NC hollow microcubes (as shown in Fig. 2c). As a control sample, ZnSn(OH)6 nanocubes without PDA coating were subjected to the same preparation process as the SnSe2@NC to obtain pure SnSe2 (as shown in Fig. S1b and c†). Due to the robust shell of the pyrolytic carbon from PDA, the nanocube structure remained intact even after the selenization process (Fig. 2c). Transmission electron microscopy (TEM) unveiled the inner architecture of the yolk–shell nanocubes (as depicted in Fig. 1d), showcasing a densely packed core encircled by a substantial void within the carbon shell, which measures approximately 10.9 nm in thickness. This observation is likely due to the fact that, during selenization under an Ar/H2 atmosphere, SnO2 is concurrently reduced to Sn, a metal with a melting point as low as 232 °C, leading to its evaporation and subsequent bead formation.27,28 In the high-resolution TEM images presented in Fig. 2e and f, the SnSe2 core exhibits distinct lattice fringes with an interplanar spacing of 0.191 nm, which matches the (110) plane of the hexagonal SnSe2 crystal structure. The SAED patterns (Fig. 2g) clearly show diffraction rings of the (100) and (001) planes of hexagonal SnSe2. Concurrently, elemental mapping (as shown in Fig. 2h–k) was utilized to examine the distribution of C, N, Sn, and Se within an individual yolk–shell nanocube. It is evident that the majority of Sn and Se elements are concentrated within the dense core of the hollow carbon shell, whereas C and N elements are predominantly found at the periphery. The N element is derived from the carbon residue resulting from the pyrolysis of PDA. Generally, the structure of large void space inside the N-rich carbon shell for SnSe2-based anodes would be expected to have superior performance for sodium storage.29,30 | ||
| Fig. 1 Schematic of formation process of Cube SnSe2@NC. | ||
 | ||
| Fig. 2 SEM images of (a) ZnSn(OH)6, (b) ZnSn(OH)6@PDA, (c) SnSe2@NC, (d) TEM, (e and f) HRTEM, (g) SAED, (h–k) elemental mapping of SnSe2@NC powders. | ||
The composition and crystal structure information of precursors, SnSe2 and SnSe2@NC were investigated using X-ray diffraction (XRD). Fig. 3a shows the XRD patterns of SnSe2 and SnSe2@NC. Both the diffraction peaks display the characteristic hexagonal SnSe2 diffraction peaks (JCPDS No. 89-2939),31 indicating the successful synthesis of SnSe2@NC. The X-ray diffraction (XRD) patterns of the precursor of ZnSn(OH)6 and intermediate product of SnO2@NC are shown in Fig. S2.† In the Raman spectra (Fig. 3b), the SnSe2@NC sample exhibits a pronounced peak at 1360 cm−1, attributed to the D-band, and a significant peak at 1570 cm−1, corresponding to the G-band of carbon.32 The D-band typically originates from the carbon's defective and disordered structures, whereas the G-band is indicative of the sp2-hybridized, graphitic carbon framework.33 The intensity ratio of these peaks (ID/IG) serves as an indicator of defect concentration. Based on the area fitting analysis, SnSe2@NC has an ID/IG ratio of 2.3, which suggests a substantial presence of defects. X-ray photoelectron spectroscopy (XPS) spectra are also collected to further determine the bonding states and valence states of SnSe2@NC (shown in Fig. S3†), presenting the signal at high resolution from C 1s, N 1s, Sn 3d, and Se 3d (Fig. 3c–f). As depicted in Fig. 3c, the high-resolution C 1s spectrum is primarily resolved into three distinct peaks. The peaks located at approximately 284.8 eV and 286.3 eV are attributed to C–C and C![[double bond, length as m-dash]](https://www.rsc.org/images/entities/char_e001.gif) O bonds, respectively.34 In the N 1s spectrum presented in Fig. 2d, the peaks at 398.4 eV, 399.8 eV, and 400.7 eV correspond to pyridinic, pyrrolic, and graphitic nitrogen.24,35 The existence of pyrrolic and graphitic nitrogen serves to create active sites that facilitate Na+ intercalation and deintercalation, which in turn enhances the reaction kinetics and subsequently improves the rate performance of the battery.36 Fig. 3e displays the high-resolution energy spectrum of Sn 3d, with characteristic peaks at 486.9 eV and 495.4 eV, which correspond to the binding energies of Sn4+ 3d5/2 and Sn4+ 3d3/2, respectively.37 From the Se 3d high-resolution spectrum (Fig. 2f), four distinct peaks can be clearly identified, with two at 53.9 eV and 55.3 eV, which can be assigned to the Se2− 3d5/2 and Se 3d3/2 of Se2−, respectively.22,24 The peak at 59.1 eV is associated with Se–O bonds,37 resulting from surface oxidation due to prolonged exposure to air. Meanwhile, the peak at 56.2 eV represents the binding energy of the Se–C bond.38 It has been discussed that the Se–C bond plays a crucial role in battery performance, primarily by bolstering the structural stability of the electrode materials.38–40
O bonds, respectively.34 In the N 1s spectrum presented in Fig. 2d, the peaks at 398.4 eV, 399.8 eV, and 400.7 eV correspond to pyridinic, pyrrolic, and graphitic nitrogen.24,35 The existence of pyrrolic and graphitic nitrogen serves to create active sites that facilitate Na+ intercalation and deintercalation, which in turn enhances the reaction kinetics and subsequently improves the rate performance of the battery.36 Fig. 3e displays the high-resolution energy spectrum of Sn 3d, with characteristic peaks at 486.9 eV and 495.4 eV, which correspond to the binding energies of Sn4+ 3d5/2 and Sn4+ 3d3/2, respectively.37 From the Se 3d high-resolution spectrum (Fig. 2f), four distinct peaks can be clearly identified, with two at 53.9 eV and 55.3 eV, which can be assigned to the Se2− 3d5/2 and Se 3d3/2 of Se2−, respectively.22,24 The peak at 59.1 eV is associated with Se–O bonds,37 resulting from surface oxidation due to prolonged exposure to air. Meanwhile, the peak at 56.2 eV represents the binding energy of the Se–C bond.38 It has been discussed that the Se–C bond plays a crucial role in battery performance, primarily by bolstering the structural stability of the electrode materials.38–40
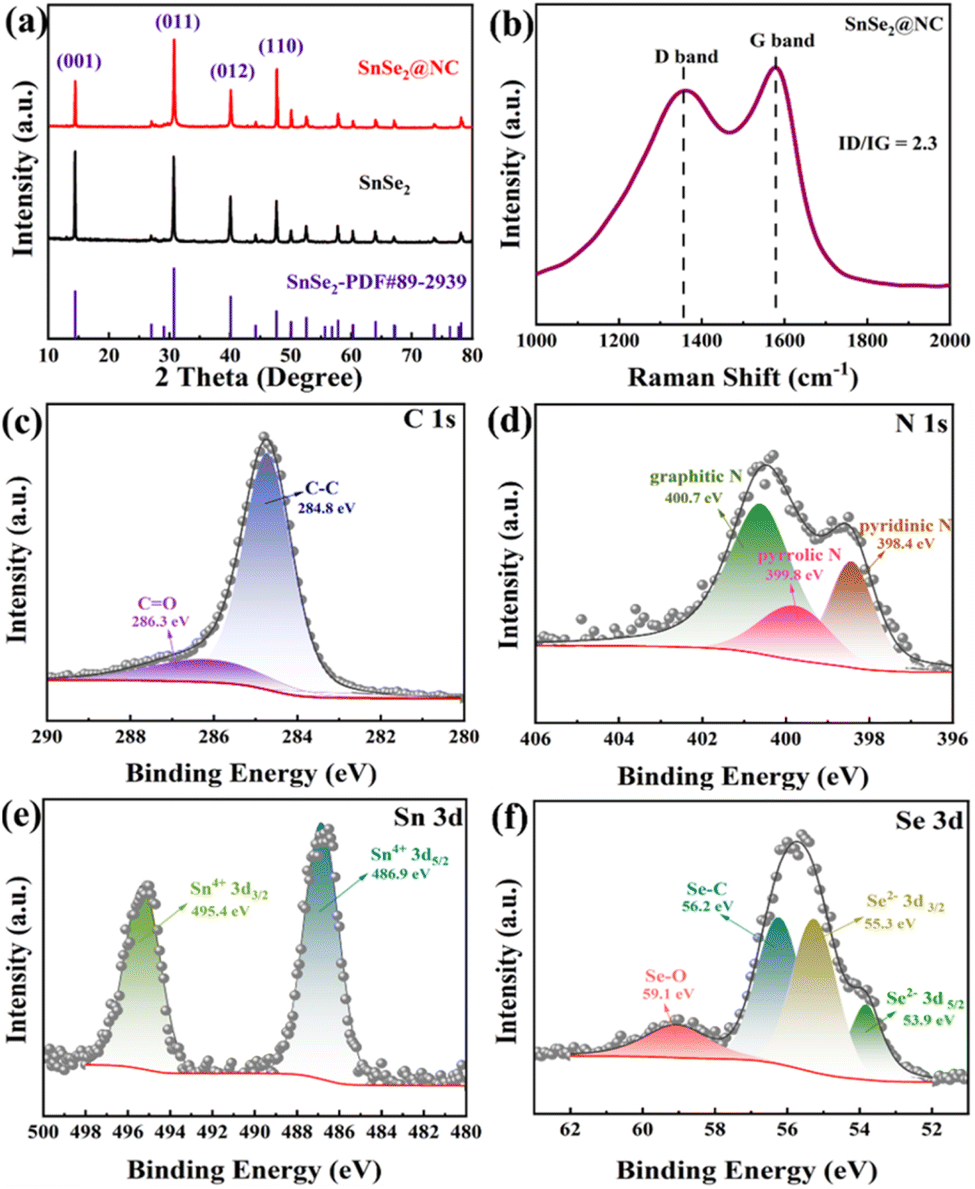 | ||
| Fig. 3 (a) XRD patterns of SnSe2@NC and SnSe2; (b) Raman spectra test of the SnSe2@NC materials; XPS survey spectrum of SnSe2@NC and the corresponding high-resolution spectra of (c) C 1s, (d) N 1s, (e) Sn 3d, (f) Se 3d. | ||
The electrochemical performance of SnSe2@NC as an anode for SIBs was elucidated using a half cell configuration with sodium metal foil as the counter electrode. For comparative analysis, SnSe2 was also evaluated. Cyclic voltammetry (CV) was employed to elucidate the various electrochemical reactions occurring throughout the charge/discharge cycles recorded at the rate of 0.1 mV s−1 over a potential range of 0.01–3.0 V. Drawing from prior research on SnSe2 anodes for sodium storage, the initial charging process is believed to involve both intercalation and conversion reactions:41
| xNa+ + SnSe2 + xe− → NaxSnSe2 | (1) |
| 4Na+ + SnSe2 + 4e− → 2Na2Se + Sn | (2) |
| Sn + 3.75Na+ + 3.75e− → Na3.75Sn | (3) |
The initial discharging process of the CV profile (Fig. 4a) exhibits a reduction peak near 1.65 V, which is associated with the intercalation of Na+ into the interlayer space of SnSe2 crystal structure with the formation of NaxSnSe2 (eqn (1)). The peak observed at 0.71 V (vs. Na/Na+) corresponds to the formation of SnSe2 to metallic Sn and Na2Se, and the formation of irreversible solid electrolyte interphase (SEI) layer (eqn (2)). During the initial anodic sweep, the broad peaks at near 0.20 can be attributed to the conversion process from metallic Sn to Na3.75Sn (eqn (3)), while the peaks at 1.35 V and 1.55 V are indicative of the desodiation process, and the minor peak at 2.16 V (vs. Na/Na+) is attributed to the reformation of SnSe2.40 It merits emphasis that the CV curve from the third cycle closely aligns with that of the second, signifying excellent reversibility in the sodium storage reaction of SnSe2@NC.42 By comparison, the bare SnSe2 shares a similar CV profile with the SnSe2@NC composite (referring to Fig. S4†) during first scan, but the peak currents in the CV curves of SnSe2 in the 2nd and 3rd cycles are considerably weaker compared to those of SnSe2@NC. This indicates a poorer reversibility for SnSe2, suggesting that the composite material outperforms the pure SnSe2 under the same experimental conditions.
 | ||
| Fig. 4 Electrochemical performances of SnSe2@NC as anode materials. (a) CV curves of SnSe2@NC at 0.1 mV s−1 with in 0.01–3.00 V, (b) cycling performance at 0.5 A g−1, (c) rate capabilities at various current densities from 0.2 to 5 A g−1, (d) EIS curves and (e) long-term cyclic capability at 5 A g−1 of SnSe2 and SnSe2@NC. | ||
The results of the galvanostatic charge/discharge measurements are depicted in Fig. 4b and c. As shown in Fig. 4b, SnSe2@NC electrode demonstrates the superior electrochemical performance, achieving a high reversible capacity of 368.9 mA h g−1 after 50 cycles at 0.5 A g−1, much higher than that of pure SnSe2 with a capacity of 159.0 mA h g−1 at the same current density. As shown in Fig. S5,† SnSe2@NC delivers a specific discharge capacity value of 686.6 and a specific charge capacity value of 515.5 mA h g−1, corresponding to a high initial coulombic efficiency (ICE) of 75.08% during the first cycle. For comparison, pure SnSe2 delivers a specific discharge capacity value of 617.7 mA h g−1 and a specific charge capacity value of 391.9 mA h g−1 with an ICE of 63.44%. The observed capacity loss is attributed to the formation of an irreversible solid electrolyte interphase (SEI) film on the electrode surface and the decomposition of the electrolyte. Compared to pure SnSe2 shown in Fig. 4c, SnSe2@NC also exhibits better rate capability and higher average capacity at different current densities.
As illustrated in Fig. 4c, we probed the rate performance of the SnSe2@NC electrode across a range of current densities from 0.2 to 5 A g−1. The electrode exhibited average discharge capacities of 395.0, 363.5, 356.7, 347.0 and 324.4 mA h g−1 at 0.2, 0.5, 1, 2 and 5 A g−1, respectively. These values markedly surpass those of the pristine SnSe2 electrode, which delivered 138.9, 109.1, 92.3, 76.5 and 59.6 mA h g−1 under the same current densities. Notably, when the current density was reduced back to 0.2 A g−1, the SnSe2@NC electrode's discharge capacity swiftly rebounded to approximately 470.6 mA h g−1. EIS tests were measured to further investigate the reaction kinetics of SnSe2@NC and pure SnSe2 electrodes to investigate the reaction kinetics for SIBs. As shown in Fig. 4d, each Nyquist plot is composed of a semicircle and a straight line. The semicircle, evident in the high and medium frequency ranges, is typically associated with the charge transfer impedance (Rct) of the electrode. Conversely, the straight line observed in the low frequency range is ascribed to the Warburg impedance, which is indicative of mass transport limitations. The fitting results of equivalent circuits are shown in Table S1.† The charge transfer resistance (Rct) of SnSe2@NC is 28.7 Ω, much lower than that of SnSe2 (Rct = 127.8 Ω), indicating that existence of N doped carbon layer improves the electronic conductivity of SnSe2@NC. As detailed in the quantitative data of the low-frequency region (Table S1†), the SnSe2@NC electrode exhibits reduced charge transfer impedance and accelerated ion diffusion compared to the pure SnSe2, thereby enhancing the reaction kinetics.43,44 To delve deeper into the assessment of the sustainable stability, endurance, and structural integrity of SnSe2@NC and pristine SnSe2, high current density of 5 A g−1 was applied after the cells activated at 0.1 A g−1 for the starting 10 cycles (Fig. 4e). The discharge capacity of SnSe2@NC electrode sustains at 324.2 mA h g−1 after 1000 cycles at 5 A g−1, much higher than that of SnSe2 with a discharge capacity of 52.7 mA h g−1 after 200 cycles. The yolk–shell-structured SnSe2@NC exhibited enhanced structural integrity following electrochemical reactions, which was instrumental in its exceptional stable cycling performance. Conversely, the electrochemical behavior of pure SnSe2 underscored its structural fragility, leading to a precipitous decline in capacities over cycling and diminished reversible capacities in subsequent cycles.
To elucidate the exceptional electrochemical performance of SnSe2@NC electrode, cyclic voltammetry (CV) tests were conducted at various scan rates ranging from 0.1 to 1.0 mV s−1, as depicted in Fig. 5a. The CV curves are fundamentally aligned with the expected profiles, indicating a swift charge transfer within SnSe2@NC during the alloying and dealloying processes. The electrode's reaction kinetics and sodium storage mechanism can be explored by using the relationship between the measured current (i) and the related scanning rate (v):45
| i(V) = avb | (4) |
| i(V) = k1v + k2 v1/2 | (5) |
 | ||
| Fig. 5 (a) CV curves of the SnSe2@NC electrode in the Na coin-cell at various scan rates from 0.1 to 1 mV s−1, (b) calculation of b-values using the relationship of the scan rate and peak current, (c) the CV curve of the SnSe2@NC electrode at 0.6 mV s−1 with the separation of capacitive and diffusion currents, (d) contribution ratio of the capacitive and diffusion controlled capacity at different scan rates. | ||
By fitting calculations, k1 can be calculated, and based on it, the proportion of pseudocapacitance at each scanning speed can be calculated. As shown in Fig. 5c, the red shaded area of the CV is the pseudocapacitive contribution area (92.94%), which is mainly the pseudocapacitive contribution at 0.6 mV s−1. As indicated in Fig. 5d, the capacitance contributions at scanning speeds of 0.1, 0.2, 0.4, 0.6, 0.8, and 1 mV s−1 are 89.30%, 89.94%, 90.66%, 92.94%, 94.79%, and 96.35%, respectively. The significantly higher contribution of pseudocapacitance in SnSe2@NC suggests that the dominant energy storage behavior is governed by pseudocapacitive effects, thereby endowing SnSe2@NC with the capability to facilitate rapid Na+ transmission and exhibit excellent high-speed cycling stability. In order to further illustrate the superior ions diffusion process, the diffusion coefficients of Na+ (DNa+) were evaluated by the galvanostatic intermittent titration technique (GITT) test (Fig. S6†), the detailed calculation process is based on eqn (6).
 | (6) |
The solid electrolyte interphase (SEI) is crucial for maintaining both the performance and stability of anode materials for SIBs. It serves as a protective barrier that insulates the electrolyte from the electrode, thereby preventing undesired reactions and the subsequent degradation during electrochemical reaction process.47 A robust and well-formed SEI film is indispensable for sustaining the energy density, extending the lifespan, and ensuring the overall safety of the battery.38,48 To further gain a better understanding the origin of the excellent electrochemical performances of SnSe2@NC and pure SnSe2, XPS characterizations of electrodes after cycling was carried out (Fig. 6). As depicted in Fig. 6a and b, the distinct C 1s spectrum peaks for SnSe2@NC and pure SnSe2 were resolved into three peaks at approximately 288.6, 285.8, and 284.8 eV, corresponding to CO32−, C–O–C, and C–C, respectively.49 In the O 1s XPS spectrum as shown in Fig. 6c and d, the peaks at 531.7, 532.5, 532.9, and 536.9 eV correspond to CO32−, RSO3Na, C–O, and NaKLL, respectively. The detection of RSO3Na and Na2CO3 in both the O 1s and C 1s XPS spectra is indicative of the reduction derived from NaCF3SO3 electrolyte within diethylene glycol dimethyl ether. However, it is important to highlight that these compounds are thermodynamically unstable.24 As an adverse outcome of this side reaction, RSO3Na and Na2CO3, which possess inferior electronic and ionic conductivities, lead to heightened electrode polarization. This, in turn, exacerbates the kinetics of Na+ diffusion, ultimately degrading the system's overall performance. In comparison to pristine SnSe2 electrodes, SnSe2@NC exhibits significantly lower levels of RSO3Na and Na2CO3, indicating that the SnSe2 nanoparticles confined within nitrogen-doped carbon nanocubes featuring inner void spaces could effectively minimize side reactions and facilitate the formation of a more stable SEI layer. Consequently, this configuration helps prevent the growth of sodium dendrites and enhances the overall lifespan of the electrodes.
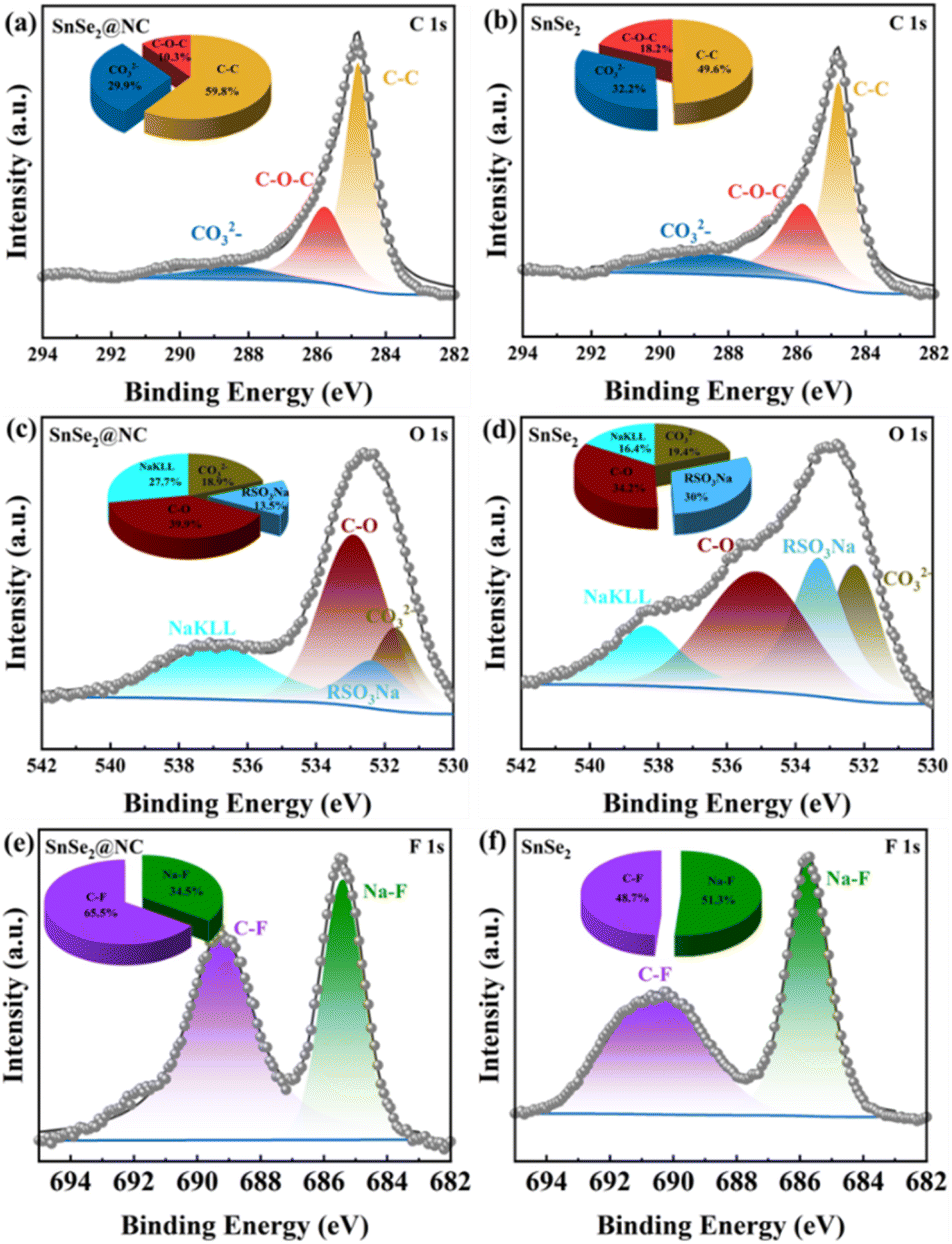 | ||
| Fig. 6 (a and b) C 1s, (c and d) O 1s (e and f) F 1s XPS of SnSe2 and SnSe2@NC extract from the electrode after the first charge and discharge, respectively. | ||
The F 1s spectra depicted in Fig. 6e and f reveal two distinct peaks corresponding to C–F and Na–F bonds, which serve as evidence for the presence of NaF and C–F species within the SEI film on the electrodes. The formation of these NaF and C–F species is believed to stem from the decomposition of NaCF3SO3.50 It is evident that the modified SnSe2@NC has a reduced content of Na–F bonds compared to the pristine SnSe2 electrode. This indicates that the N-doped carbon layer can effectively inhibit the decomposition of NaCF3SO3 during the sodiation/de-sodiation process. In summary, the SEI layer of the SnSe2@NC electrode is significantly more stable than that of the pristine SnSe2 electrode throughout the entire sodiation/desodiation process. This enhanced stability suggests that the SnSe2@NC yolk–shell nanocubes has improved Na+ diffusion kinetics, likely owing to its structural robustness and excellent conductivity. Consequently, the SnSe2@NC electrode shows superior capacity retention, particularly at high current densities.
3. Conclusions
In conclusion, the yolk–shell SnSe2@NC nanocubes with a nitrogen-doped carbon shell and internal void space have proven to be an outstanding anode material for SIBs, providing high specific capacity, superior rate performance and enduring cycling stability. Electrochemical analysis revealed that the observed improvements could be attributable to enhanced sodium-ion diffusion kinetics, diminished charge-transfer impedance, and bolstered structural stability, which are consequences of the nitrogen-doped carbon shell and the presence of internal void spaces. Additionally, XPS results of electrodes after cycling confirm the formation of a stable solid electrolyte interphase layer of SnSe2@NC, crucial for battery performance and safety. The structural design and material composition of SnSe2@NC provide valuable insights for the development of high-performance anode materials for next-generation energy storage systems.Data availability
The data used in this study is available upon request from the corresponding author.Conflicts of interest
There are no conflicts to declare.Acknowledgements
This work is supported by a grant from Scientific Research Projects of Ningde Normal University (Grant No. 2024ZX01, 2024T02, 2020ZDK05), the Natural Science Foundations of Fujian Province of China (Grant No. 2023J05203, 2024J08226).References
- G. W. Gao, X. M. Huo, B. X. Li, J. X. Bi, Z. K. Zhou, Z. Z. Du, W. Ai and W. Huang, Energy Environ. Sci., 2024, 17, 7850–7859 RSC.
- H. J. Li, X. Q. Cheng, J. Y. Zhao, M. Y. Gao, H. Xu and X. M Wang, J. Alloys Compd., 2025, 1010, 178237 CrossRef CAS.
- J. . M. Tao, J. J. Han, Y. B. Wu, Y. M. Yang, Y. Chen, J. X. Li, Z. G. Huang and Y. B. Lin, Energy Storage Mater., 2024, 64, 103082 CrossRef.
- J. L. Liang, C. B. Wei, D. X. Huo and H. Li, J. Energy Storage, 2024, 85, 111044 CrossRef.
- Z. W. Hu, L. Y. Liu, X. Wang, Q. Q. Zheng, C. Han and W. J. Li, Adv. Funct., 2024, 34, 2313823 CrossRef CAS.
- B. W. Xiao, T. Rojo and X. L. Li, ChemSusChem, 2019, 12, 133–144 CrossRef CAS PubMed.
- Z. Y. Lin, J. S. Wu, Z. L. Wu, M. X. Yu, H. Jia, K. Q. Zhou, X. H. Huang and S. M. Ying, J. Energy Storage, 2025, 106, 114924 CrossRef.
- L. Wang, Z. X. Wei, M. L. Mao, H. X. Wang, Y. T. Li and J. M. Ma, Energy Storage Mater., 2019, 16, 434–454 CrossRef.
- H. Li, Y. Y. He, Q. Wang, S. N. Gu, L. Wang, J. X. Yu, G. W. Zhou and L. Q. Xu, Adv. Energy Mater., 2023, 13, 2302901 CrossRef CAS.
- H. J. Li, X. M. Wang, Z. X. Zhao, R. Pathak, S. Y. Hao, X. M. Qiu and Q. Q. Qiao, J. Mater. Sci. Technol., 2022, 99, 184–192 CrossRef CAS.
- Y. Jiang, Y. C. Wang, J. F. Ni and L. Li, InfoMat, 2021, 3, 339–352 CrossRef CAS.
- J. M. Tao, L. W. Liu, J. J. Han, J. J. Peng, Y. Chen, Y. M. Yang, H. R. Yao, J. X. Li, Z. G. Huang and Y. B. Lin, Energy Storage Mater., 2023, 60, 102809 CrossRef.
- H. H. Kim, T. H. Kim, G. B. Cho, H. S. Ryu and J. H. Ahn, J. Energy Storage, 2024, 76, 109848 CrossRef.
- M. H. Luo, H. X. Yu, F. Y. Hu, T. T. Liu, X. Cheng, R. T. Zheng, Y. Bai, M. Shui and J. Shu, Chem. Eng. J., 2020, 380, 122557 CrossRef CAS.
- M. J. Liu, J. L. Xu, L. Y. Shao, X. Y. Shi, C. S. Li and Z. P. Sun, Chem. Commun., 2024, 60, 6860 RSC.
- Y. T. Gong, Y. Li, M. Q. Liu, Y. Bai and C. Wu, Small, 2023, 19, 2206194 CrossRef CAS PubMed.
- H. H. Li, L. F. Zhai, J. M. Yu, J. H. Luo, B. H, C. H. Hou, Y. M. Han, W. B. Pei and W. W. Xiong, ACS Appl. Energy Mater., 2024, 7, 9255–9266 CrossRef CAS.
- T. W. Zhao, G. Q. Feng, L. L. Zhou, X. Wang, X. Q. Li, F. Jiang, H. Y. Li, Y. S. Liu, Q. Yu, H. J. Gao, Y. Xu and Y. Y. Zhu, ACS Appl. Nano Mater., 2024, 7, 13434–13446 CrossRef CAS.
- S. Tian, X. Cheng, H. Li, M. Wang and X. Wang, Mater. Today Chem., 2023, 30, 101524 CrossRef CAS.
- W. W. Wang, L. J. Hu, L. X. Li, C. X. Liu, X. J. Liu, H. Wang and G. H. Zhai, Electrochim. Acta, 2023, 449, 142239 CrossRef CAS.
- F. Zhang, Y. Shen, M. Shao, Y. C. Zhang, B. Zheng, J. S. Wu, W. N. Zhang, A. P. Zhu, F. W. Huo and S. Li, ACS Appl. Mater. Interfaces, 2020, 12, 2346–2353 CrossRef CAS PubMed.
- C. Wang, L. Z. Sheng, M. H. Jiang, X. R. Lin, Q. Wang, M. Q. Guo, G. Wang, X. M. Zhou, X. Zhang, J. Y. Shi and L. L. Jiang, J. Power Sources, 2023, 555, 232405 CrossRef CAS.
- G. D. Park and Y. C. Kang, Small Methods, 2021, 15, 2100302 CrossRef PubMed.
- Z. Y. Lin, J. S. Wu, Q. W. Ye, Y. L. Chen, H. Jia, X. H. Huang and S. M. Ying, Dalton Trans., 2024, 53, 765–771 RSC.
- Z. Y. Chen, Z. Zhang, L. Z. Wang, Y. F. Li, Y. T. Wang, Y. C. Rui, A. l. Song, M. Li, Y. Y. Chu, L. Jiang, B. H. J. Tang, N. H, G. X. Wang and H. Tian, Nanoscale, 2024, 16, 14339–14349 RSC.
- H. H. Song, Q. Zhou, Z. C. Song, K. Tian, C. H. Guan, Z. Y. Fang, G. Y. Yuan, M. Lu, D. Wei and X. D. Li, Dalton Trans., 2023, 52, 14088–14099 Search PubMed.
- H. An, M. Yoo, H. Ha, H. Choi, E. Kang and H. Y. Kim, Sci. Rep., 2019, 9, 16702 Search PubMed.
- H. Ha, M. Yoo, H. An, K. Shin, T. Han, Y. Sohn, S. Kim, S. R. Lee, J. H. Han and H. Y. Kim, Sci. Rep., 2017, 7, 14427 CrossRef PubMed.
- F. J. Kong, Z. S. Han, S. Tao and B. Qian, J. Energy Chem., 2021, 55, 256–264 CrossRef CAS.
- S. H. Xiao, Z. Z. Li, J. T. Liu, Y. S. Song, T. S. Li, Y. Xiang, J. S. Chen and Q. Y. Yan, Small, 2020, 16, 2002486 CrossRef CAS PubMed.
- P. Liu, J. Han, K. J. Zhu, Z. H. Dong and L. F. Jiao, Adv. Energy Mater., 2020, 10, 2000741 CrossRef CAS.
- Z. Y. Lin, X. Q. Tan, Y. P. Lin, J. P. Lin, W. Y. Yang, Z. Q. Huang, S. M. Ying and X. H. Huang, RSC Adv., 2022, 12, 28341 Search PubMed.
- Z. H. Sun, X. L. Wu, J. N. Xu, D. Y. Qu, B. L. Zhao, Z. Y. Gu, W. H. Li, H. J. Liang, L. F. Gao, Y. Y. Fan, K. Zhou, D. X. Han, S. Y. Gan, Y. W. Zhang and L. Niu, Small, 2020, 16, 1907670 Search PubMed.
- Y. Xin, S. Pan, X. Z. Hu, C. Miao, S. Q. Nie, H. Y. Mou and W. Xiao, J. Colloid Interface Sci., 2023, 639, 133–144 CrossRef CAS PubMed.
- D. Li, J. Q. Zhang, S. M. Ahmed, G. Q. Suo, W. Wang, L. Feng, X. J. Hou, X. H. Ye and L. Zhang, J. Colloid Interface Sci., 2020, 574, 174–181 CrossRef CAS PubMed.
- H. J. Wang, J. L. Lan, H. C. Yuan, S. C. Luo, Y. Q. Huang, Y. H. Yu, Q. Cai and X. P. Yang, Appl. Surf. Sci., 2020, 518, 146221 CrossRef CAS.
- H. Li, Y. Y. He, Q. Wang, S. N. Gu, L. Wang, J. X. Yu, G. W. Zhou and L. Q. Xu, Adv. Energy Mater., 2023, 13, 2302901 CrossRef CAS.
- K. W. Yang, X. X. Zhang, L. M. Song, J. Y. Zhang, C. T. Liu, L. W. Mi, Y. Y. Wang and W. H. Chen, Electrochim. Acta, 2020, 337, 135783 CrossRef CAS.
- Y. Y. Wang, F. Y. Xiao, X. Chen, P. X. Xiong, C. Y. Lin, H. E. Wang, M. D. Wei, Q. R. Qian, Q. H. Chen and L. X. Zeng, InfoMat, 2023, 5, e12467 CrossRef CAS.
- F. Zhang, C. Xia, J. J. Zhu, B. Ahmed, H. F. Liang, D. B. Velusamy, U. Schwingenschlögl and H. N. Alshareef, Adv. Energy Mater., 2016, 6, 1601188 CrossRef.
- D. L. Cheng, L. C. Yang, R. Z. Hu, J. W. Liu, R. C. Che, Y. N. Chen, W. Y. Chen, J. L. Huang, M. Zhu and Y. J. Zhao, ACS Appl. Mater., 2019, 11, 36685–36696 Search PubMed.
- Z. L. Wu, Z. Q. Huang, M. X. Yu, Y. N. Du, J. W. Li, H. Jia, Z. Y. Liu, X. H. Huang and S. M. Ying, Dalton Trans., 2024, 53, 15920–15927 RSC.
- X. C. Ren, J. S. Wang, D. M. Zhu, Q. W. Li, W. F. Tian, L. Wang, J. B. Zhang, L. Miao, P. K. Chu and K. F. Huo, Nano Energy, 2018, 54, 322–330 CrossRef CAS.
- T. T. Wang, K. W. Ynag, J. Shi, S. R. Zhou, L. W. Mi, H. P. Li and W. H. Chen, J. Energy Chem., 2020, 46, 71–77 CrossRef.
- H. H. Liu, D. Li, H. L. Liu, X. Wang, Y. X. Lu, C. Wang and L. Guo, J. Colloid Interface Sci., 2023, 634, 864–873 Search PubMed.
- W. F. Fan, J. P. Xue, D. P. Wang, Y. X. Chen, H. . B. Liu and X. H. Xia, ACS Appl. Mater. Interfaces, 2021, 13, 61055–61066 Search PubMed.
- L. W. Ji, M. Gu, Y. Y. Shao, X. L. Li, M. H. Engelhard, B. W. Arey, W. Wang, Z. M. Nie, J. Xiao, C. M. Wang, J. G. Zhang and J. Liu, Adv. Mater., 2014, 26, 2901–2908 CrossRef CAS PubMed.
- S. K. Heiskanen, J. J. Kim and B. L. Lucht, Joule, 2019, 3, 2322–2333 CrossRef CAS.
- J. Sun, L. A. O'Dell, M. Armand, P. C. Howlett and M. Forsyth, ACS Energy Lett., 2021, 6, 2481–2490 CrossRef CAS.
- K. Varghese, D. S. Baji, S. Nair and D. Santhanagopalan, Front. Mater. Sci., 2022, 16, 220601 Search PubMed.
Footnote |
| † Electronic supplementary information (ESI) available. See DOI: https://doi.org/10.1039/d5ra00119f |
| This journal is © The Royal Society of Chemistry 2025 |