
 Open Access Article
 This Open Access Article is licensed under a Creative Commons Attribution-Non Commercial 3.0 Unported Licence
Optimized design of a high-solid-content liquid elbow: an anti-erosion 3D twisted swirl plate structure
Jinwei Maa,
Fopeng Wenb,
Zhaofu Dengc,
Liping Wei *cd,
Yiming Maa,
Haisheng Sunae,
Dejia Xiea and
Xiaohu Lif
*cd,
Yiming Maa,
Haisheng Sunae,
Dejia Xiea and
Xiaohu Lif
aLanpec Technologies Limited, Lanzhou, Gansu 730070, China
bEnergy Development Center of Ganzhou, Ganzhou, Jiangxi 341000, China
cSchool of Chemical Engineering, Northwest University, Xi'an, 710069, China. E-mail: vuut977@163.com
dThe Research Center of Chemical Engineering Applying Technology for Resource of Shaanxi, Xi'an, 710069, China
eSchool of Mechanical and Power Engineering, East China University of Science and Technology, Shanghai, 200237, China
fThe Eighth Oil Production Plant of Changqing Oilfield Company, Xi'an, Shanxi 710016, China
First published on 27th June 2025
Abstract
This study addresses the critical issue of erosion in slag discharge pipelines caused by uneven particle distribution due to particle deposition. To address this issue, a novel 3D twisted swirl plate (PRSS) was designed based on the principle of adjusting particle positions within a swirling flow field to achieve a uniform distribution. Comparative analysis showed that the new 3D twisted swirl plate outperformed similar designs, significantly reducing erosion caused by non-uniformly distributed small particles. Furthermore, response surface analysis combined with genetic algorithms enabled the dual-objective optimization of the swirl plate structure. The optimization yielded two optimal designs: the first achieved a 45% reduction in the maximum erosion rate (MER) and a 1043 Pa increase in the pressure drop (DP) for 50 µm particles, while the second optimal design reduced MER by 36% and increased DP by 659 Pa. These findings highlight the enhanced performance of the proposed design over conventional elbow pipes, demonstrating its potential for mitigating erosion in high-solid-content flow systems.
1. Introduction
Coal continues to serve as the dominant energy source in China, playing a central role in China's energy development strategy for a considerable period.1 Coal gasification technology plays a crucial role in promoting the green transformation and efficient utilization of coal resources. Approximately 6% of China's annual coal consumption is allocated to coal gasification processes,2 resulting in over 33 million tons of coal gasification slag annually.3 The slag discharge system is a vital component of coal gasification systems because the high wear potential of slag particles, which are primarily composed of Al2O3, SiO2, CaO, and Fe2O3, poses significant challenges to pipeline durability.4 Notably, particle-impact-induced failures account for over 40% of pipeline breakdowns, with the elbow sections of pipelines being particularly susceptible to erosion and leakage.5To mitigate erosion in pipeline elbows, researchers have explored strategies such as increasing the elbow’s radius of curvature to reduce peak erosion rates,6,7 employing vortex chambers to shield walls from direct impacts, and incorporating biomimetic or structurally modified surfaces like hemispherical protrusions, transverse grooves,8,9 and ribbed designs. Innovations such as knot-like inner wall structures10 and ASDEIPS11 guide plates have also demonstrated effectiveness by disrupting vortex formation and optimizing the internal flow field.
Nonuniform particle distribution within pipeline elbows is a critical phenomenon in industrial applications, particularly due to particle settling behavior. This phenomenon becomes more significant at low flow velocities and with larger particles.12 In horizontal pipelines, material loss caused by settling particles at the bottom of the pipe has been reported to be significantly higher, up to 8.6 times greater than the material loss at the top.13 Gas–solid two-phase flow studies have shown that certain particles released from the lower part of the inlet surface do not contribute to erosion.14 Additionally, the centrifugal force acting on the particles increases with the fluid velocity, intensifying erosion effects.15 Uneven particle distribution and particle flux have been identified as key contributors to localized erosion and punctures, with the bending direction of the elbow being a significant influencing factor.16 Furthermore, previous studies on soot particles from aircraft combustors highlight how particle morphology and nanostructure, such as shape, coating, and graphitization, substantially influence their behavior and interaction with surfaces, underscoring the need to consider particle properties in erosion prediction and mitigation strategies.17 Recent advancements in Raman spectral analysis of combustion-derived soot particles using optimized fitting models and machine learning—highlight the significance of accurate microstructural characterization in understanding particle behavior, which can offer valuable insights for improving pipeline durability and environmental monitoring.18
The non-uniform distribution of particles is a critical determinant of pipeline erosion. For smaller particles, impacts near the L/M points of the elbows can mitigate erosion, whereas for larger particles, achieving a more uniform particle distribution is essential for minimizing erosion.19 To address severe erosion challenges, particularly in horizontal pipeline configurations, a particle redistribution swirl structure (PRSS) was developed. To the best of our knowledge, the Plate-Reinforced Spiral Structure (PRSS) proposed in this study is a novel configuration, introduced here for the first time to mitigate erosion in high-solid-content flow pipelines. The PRSS begins at a twisting angle, initiating a 90° twist from a cross-shaped configuration (Fig. 1(a)). This structure divides the flow and particles into four sections, introducing rotational stirring to achieve uniform particle distribution. During this process, particles are either carried toward the L point by the swirl plate or settle toward the M point due to gravity (Fig. 1(b)).
 | ||
| Fig. 1 Particle distribution when the twist angle of PRSS is 90°: (a) overall particle distribution across the entire elbow, (b) schematic showing particle distribution at the inlet, PRSS, and exit sections. L-point (left point), M-point (middle point), R-point (right point), 15D (i.e., a point located upstream from the elbow center at a distance equal to 15 times the pipe diameter) and 0D (a position located at the elbow center). | ||
In contrast to conventional elbows, where particles are concentrated near the R point, PRSS promotes migration toward the L/M points. The swirling effect enhances particle dispersion, uniformity, and migration, thereby significantly reducing erosion.
This study builds on the PRSS concept by investigating its performance against similar structures to identify its advantages. Computational fluid dynamics (CFD) simulations were conducted to develop regression models that correlate the maximum erosion rate (MER) and total pressure drop (DP) with PRSS structural parameters. The NSGA-II algorithm was used to obtain the Pareto front, and a probabilistic optimization method was applied to identify the optimal design. These findings offer valuable insights into the optimization of swirl plate structures and their application in industrial pipelines.
2. Experimental
2.1. Design of a 3D twisted swirl plate
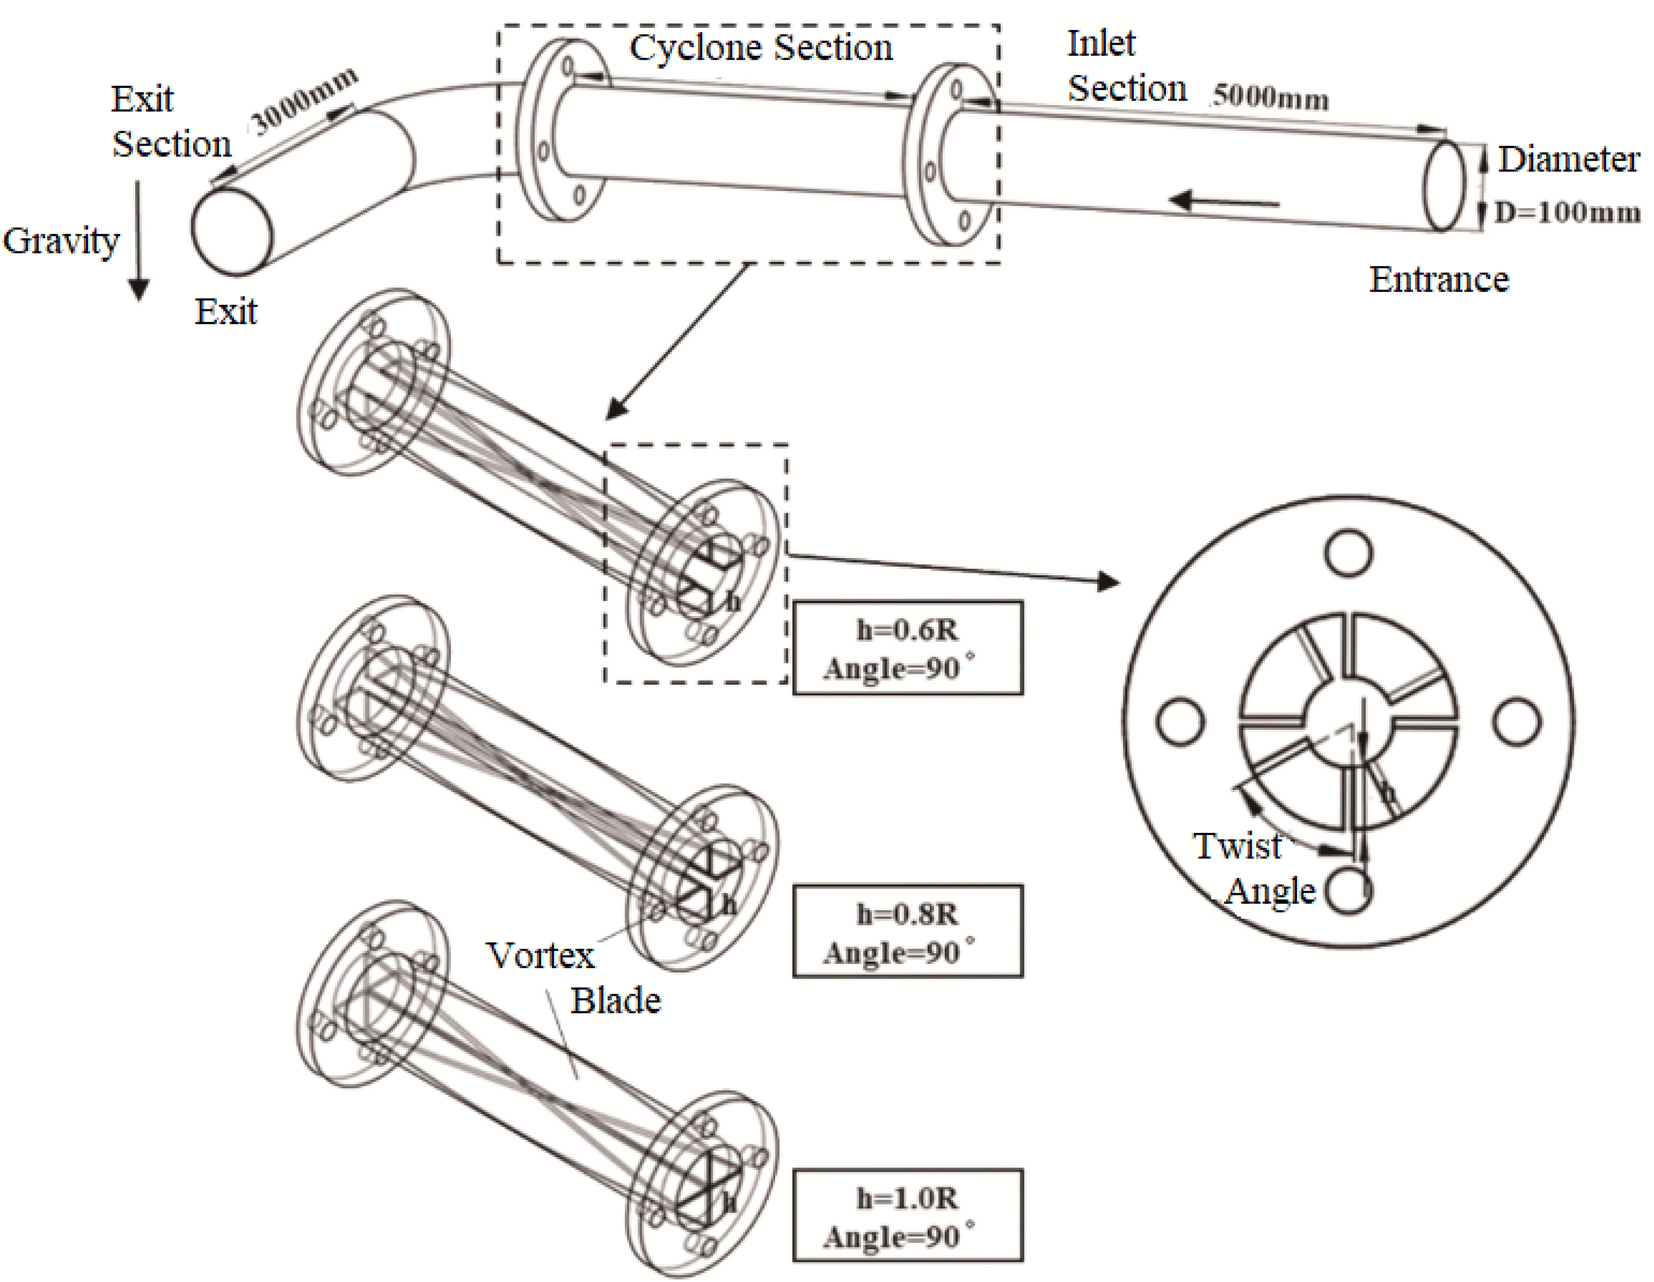
In this study, the pipeline model comprised four sections: an inlet section (5000 mm), a swirl section, a 90° elbow section, and an outlet section (3000 mm), with a uniform pipeline diameter of 100 mm. The 3D twisted swirl plate (PRSS) is arranged within the swirl section and consists of four 4 mm-thick swirl plates welded to the inner wall of the pipeline. These plates were configured in a cross-shaped configuration, starting from the inlet section, to induce a swirling flow.The structural parameters of the swirl plates were characterized by the twisting angle (angle), blade height (h), and swirl plate length (L). The twisting angle is the rotation degree of the swirl plates around the pipeline axis. The blade height (h) was set to match the radius of the pipeline, ensuring interconnection among the swirl plates.
The structural optimization focuses on three key ratios: the swirl plate length-to-diameter ratio (A − L/D), the blade height-to-radius ratio (B − h/R), and the twisting angle of the swirl plates (C-angle). The optimization was guided by two objectives: minimizing the maximum erosion rate (MER) and controlling the pressure drop (DP) across the pipeline. The proposed design aims to balance erosion resistance and hydraulic performance. A schematic of the 3D-twisted swirl plate structure is presented in Fig. 2, which illustrates the configuration and geometrical parameters that govern its performance.
 | ||
| Fig. 2 Schematic of the three-dimensional twisted swirl vane structure. | ||
2.2. Numerical simulation of elbow erosion
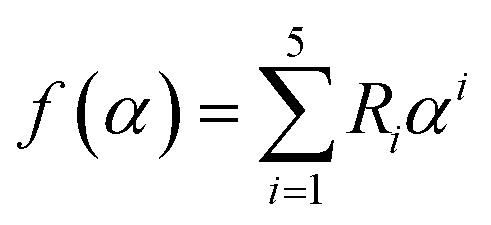
The standard k–ε turbulence model, which is known for its high accuracy and broad applicability, was used to resolve the flow field.20,21 A particle volume fraction of 1.27% was used in the simulation, with the Discrete Particle Model (DPM) applied to track particle trajectories.22 Previous studies have indicated that under varying particle sizes and concentrations, the coupling between fluid and particles has minimal influence on curvature-induced erosion. A recent study by Ghosh and Goswami (2022) investigated the dynamics of particle-laden turbulent Couette flow and found that two-way coupling effects become significant at particle volume fractions as low as approximately 0.08%. Their direct numerical simulations revealed a discontinuous decrease in turbulence intensity beyond a critical volume fraction of around 0.08%, indicating the onset of two-way coupling effects. This suggests that even at relatively low particle concentrations, the feedback from the particles to the fluid flow can no longer be neglected.23In contrast, Elghannay and Tafti (2018) proposed a more conservative threshold, suggesting that one-way coupling is valid for particle volume fractions below 0.0001% (1 × 10⁻⁶), with two-way coupling becoming necessary for volume fractions above 0.1% (1 × 10⁻³). They emphasized that at higher concentrations, particle–particle interactions and the influence of particles on the fluid flow become significant, necessitating more complex coupling models.24 Previous studies have indicated that under varying particle sizes and concentrations, the coupling between the fluid and particles has a minimal influence on curvature-induced erosion. To enhance computational efficiency, the simulation begins by solving the continuous phase until convergence is achieved.25 Subsequently, a distinct phase is introduced to track the particle trajectories and predict the erosion patterns. The erosion prediction used the E/CRC model for X65 carbon steel, which was derived from the reported experimental data.26
| ER = C(BH)−0.59FSupnf(α) | (1) |
 | (2) |
| R1 | R2 | R3 | R4 | R5 |
|---|---|---|---|---|
| 5.3938 | −10.1068 | 10.9327 | −6.3283 | 1.4234 |
The flowing medium in the elbow consists of water and coal slag. The boundary conditions include a velocity inlet and a free-flow outlet. The density and viscosity of water were set to 988 kg m−3 and 0.001 kg m−1 s−1, respectively. The particle density was 2500 kg m−3, and particles entered the domain at the same velocity as water. Spherical particles with a diameter of 50 µm were considered with a flow velocity of 2 m s−1 and a flow rate of 0.5 kg s−1.
The wall boundary was set to a reflective condition to account for particle–wall interactions. The SIMPLE algorithm was used to solve the pressure and velocity fields. The pressure term was discretized using the standard scheme, whereas the convection term was discretized using a second-order upwind scheme to ensure solution accuracy. The convergence criterion was established such that the residual of the governing equations was less than 10−3 within a maximum of 3000 iterations. Once the flow field converged, sufficient particles were introduced to accurately compute the pipe wall erosion. This setup effectively captured the interaction between flow dynamics and particle-induced erosion, ensuring reliable predictions for the 90° elbow under study.
2.3. Mesh independence and erosion model validation
The pipeline geometry was discretized using a tetrahedral mesh with a five-layer boundary layer mesh to enhance near-wall resolution.Tetrahedral meshes are fast to generate, adaptable to complex geometries, and highly automated; thus, they can effectively fill the space when dealing with complex geometry problems, making the model closer to the actual situation. Therefore, the model employs a tetrahedral meshing method. Taking an incident particle diameter of 0.1 mm and an incident velocity of 2 m s−1 as examples, the same meshing method was used for the other schemes. In order to ensure the correctness of the calculation, we also encrypt the mesh to various degrees, as shown in Fig. 3(a). After the calculation is completed, the evaluation indicators for different mesh numbers are shown in Fig. 3(b). As the number of meshes increased, the maximum erosion rate gradually tended to be stable. In particular, when the number of grid nodes increased to 1.04 million, the change in evaluation indicators was negligible, and the number of grids continued to lead to an increase in computing resources. Therefore, a grid with a quantity of 1.04 million was used for the calculations in this study.
 | ||
| Fig. 3 (a) Schematic of pipeline and component mesh division. (b) Verification results for grid independence. | ||
The thickness of the near-wall mesh was optimized to ensure that the dimensionless wall distance (y+) ranged from 30 to 120, which was suitable for turbulence modeling. To balance computational efficiency with accuracy, a grid independence analysis was conducted by evaluating the stability of the Maximum Erosion Rate (MER) and maximum shear stress. As shown in Table 2, mesh refinement beyond 1.5 million cells yielded negligible variation in the results, indicating grid independence.
| Number of grids (in ten thousand) | 28 | 70 | 100 | 150 | 200 | 300 |
|---|---|---|---|---|---|---|
| MER/10−8 kg m−2 s−1 | 6.82 | 3.76 | 2.84 | 2.93 | 2.78 | 2.82 |
| Maximum shear stress/Pa | 53.3 | 56.3 | 34.5 | 38.8 | 38.7 | 38.8 |
The reliability of the numerical model was validated against experimental data previously reported24 on the liquid–solid erosion of 316L stainless steel. The experimental configuration featured an elbow with a diameter of 40 mm and a curvature ratio of 1.5, arranged in a horizontal–horizontal configuration. The liquid–solid flow velocity was 4.09 m s−1, and the particle characteristics included a diameter of 300 µm, density of 2650 kg m−3, and mass flow rate of 0.1027 kg s−1.
The experimental data indicate that the maximum erosion occurred at points 61, 56, and 76 on the outlet sidewall, forming a triangular region (Fig. 4(a)). The numerical simulation also predicted a triangular erosion pattern at the same location, with an MER of 1.62 × 10⁻⁶ kg m−2 s−1 (Fig. 4(b)). Compared with the experimentally measured MER of 1.75 × 10⁻⁶ kg m−2 s−1, the simulation error was 7.3%. Fig. 4(c) provides a quantitative comparison of erosion values across various test points, showing an average error of 7.7% within an 85% confidence interval. These results validate the accuracy and reliability of the numerical methods used in this study.
 | ||
| Fig. 4 Erosion model validation: (a) measured locations and values of severe erosion,27 in units of 10−7 kg m−2 s−1. (b) Simulated locations and values of severe erosion. (c) Quantitative comparison of the numerical and experimental results at selected elbow locations. | ||
2.4. Probabilistic optimization for multi-objective optimization
The optimization process is illustrated in Fig. 5. Initially, univariate analysis is performed to determine the levels of critical factors, followed by the implementation of Box–Behnken Design (BBD) experiments across a predefined range. Analysis of variance (ANOVA) is then performed to validate the adequacy and reliability of the regression models while determining the significance of individual terms within the quadratic models. Subsequently, a response surface analysis was performed to elucidate the interaction effects between the pairs of design parameters. | ||
| Fig. 5 Schematic of the multi-objective optimization process. | ||
The Non-dominated Sorting Genetic Algorithm II (NSGA-II) is executed to obtain the Pareto front and identify the optimal design parameters that satisfy the imposed constraints. NSGA-II is widely recognized for its ability to efficiently achieve a wall-distributed Pareto-optimal front when applied to response surface method (RSM) fitting functions.28,29
Through genetic operators such as crossover and mutation, a new population is generated in each cycle, while the elitism strategy is implemented to ensure the preservation of superior individuals.
The proposed algorithm employs two key functions:
(1) Non-dominated sorting function: this function ranks the population and selects the most optimal individuals for subsequent iterations.
(2) Crowding distance function: this function maintains diversity within a population by preventing the clustering of nearby individuals.
The traditional ideal point method, which is additive, has significant drawbacks in terms of selecting the optimal solution from the Pareto front. Specifically, the use of weighted sums and normalization methods often introduces variability, and the reliance on union set theory conflicts with the concept of “simultaneous multi-objective optimization”. To address these limitations, this study employs a probabilistic optimization multi-objective method, which interprets “simultaneous multi-objective optimization” as the joint probability of multiple objectives treated as independent events.30
The primary goal of optimization in this study is to minimize both the Maximum Erosion Rate (MER) and the Pressure Drop (DP). Following the principles derived from probability theory, normalization ensures that the partial optimization probability (Pij) of a specific undesirable performance indicator for the i-th candidate structure is linearly and negatively correlated with its utility value. The partial optimization probability Pij for the j-th objective is expressed as follows:
 | (3) |
The total optimization probability (Pi) for the i-th candidate structure is calculated as the product of all its partial optimization probabilities (Pij) as follows:
 | (4) |
The optimal solution corresponds to the candidate structure with the highest total optimization probability (Pi). The structure identified using this probabilistic approach was subsequently compared with an elbow pipe configuration without swirl plates to confirm its superior performance.
3. Results and discussion
3.1. Comparison of PRSS and three-blade swirl plate
Zhao et al. previously designed a swirl structure with a three-blade swirl plate and conducted experimental validation.31 The primary difference between their three-blade swirl plate design and the PRSS (Particle Redistribution Swirl Structure) presented in this study lies in its positioning and design. Zhao's swirl plate was installed 15D upstream of the elbow, whereas the PRSS in this study was placed directly at the elbow (0D). This placement optimizes the performance by addressing erosion at the most critical location. This strategic positioning allows the PRSS to act precisely where particle redistribution and erosion mitigation are needed the most, enhancing its efficacy.Zhao's study demonstrated that their three-blade swirl plate did not effectively reduce the MER for coal dust particles smaller than 2 mm in diameter (density 1460 kg m−3). For example, 0.5 mm particles experienced erosion rates five times higher than those of a standard elbow pipe.
In contrast, for larger coal dust particles, the three-blade swirl plate effectively reduced the erosion.
A numerical comparison between the three-blade swirl plate (installed at both elbow 0D and 15D) and the PRSS under the conditions of a coal gasification slag discharge pipeline is depicted in Fig. 6.
 | ||
| Fig. 6 MER of ordinary bend, PRSS bend, and three-vane swirl structures installed at 15D and 0D: (a) 50 µm; (b) 100 µm; and (c) 200 µm. | ||
The results indicate that:
(1) 50 µm particles: the three-blade swirl plate installed 15D from the elbow failed to reduce MER due to insufficient mitigation of the nonuniform distribution of smaller particles. On the other hand, the PRSS at 0D effectively reduced MER by altering the particle distribution. The twisting angle of the PRSS shifts the particle concentration from near the R-point to the M/L-point, resulting in reduced erosion.
(2) 100 µm particles: the three-blade swirl plate installed at 15 D achieved some erosion reduction, but it was less effective than the PRSS at 0D.
(3) 200 µm particles: for larger particles, both the three-blade swirl plate (at 15D) and the PRSS significantly reduced erosion. The three-blade swirl plate achieved slightly better results due to its upstream positioning, which prevented the turbulence energy from dissipating before the particles entered the elbow.
The inability of the three-blade swirl plate at 0D to reduce erosion can be attributed to the enhanced turbulence generated by its placement. This turbulence intensifies the particle impact on the pipe wall, sharply increasing the MER. Conversely, at 0D, the PRSS redistributes the particles more uniformly and alters their trajectories, effectively minimizing erosion.
For the three-blade swirl plate at 15 D, its inability to reduce MER 50 µm particles stems from insufficient particle distribution to counteract turbulence effects. In contrast, the PRSS achieves this by designing a precise twisting angle. For larger particles (20 µm), the three-blade swirl plate at 15D performs effectively by ensuring uniform particle distribution while allowing turbulence to dissipate upstream of the elbow.
To validate the erosion model, experimental data were obtained from the literature using 316L stainless steel specimens. The validation used 316L stainless steel, which has higher erosion resistance than X65 carbon steel. Thus, absolute erosion rates for X65 may have been underestimated in the validation case; however, the relative trends remained consistent. The simulation results showed good agreement with the experimental trends, confirming the model's capability to capture erosion behavior.
The PRSS demonstrates significant advantages over the three-blade swirl plate, particularly for nonuniformly distributed coal slag particles and smaller particle sizes (50 µm). This is due to its ability to precisely redistribute particles and effectively reduce erosion at the elbow. The next phase of this study will focus on optimizing the PRSS structure based on erosion conditions for 50 µm particles at a flow velocity of 2 m s−1. The aim is to refine the design to achieve quick and efficient mitigation of particle-induced erosion. While spherical particles simplify the simulation, non-spherical (irregular) particles typically produce higher localized erosion because of their sharp edges and varied impact dynamics. Incorporating shape factors can improve model realism in future studies.
3.2. Box–Behnken experimental design
The Box–Behnken Design (BBD) is commonly used in experiments to investigate the non-linear effects of factors and their interactions. It is particularly advantageous for its predictive accuracy, reliability, and efficiency in exploring experimental factors. In this study, the BBD method was employed using a 3-factor, 3-level experimental design, where the experimental points were chosen at the midpoints of the edges of a cube, as shown in Fig. 7. | ||
| Fig. 7 BBD experimental design. | ||
Numerical simulations were performed for the Maximum Erosion Rate (MER) and the inlet and the Pressure Drop (DP) at the inlet and outlet. The results are summarized in Table 3, which provides insight into the effects of the design parameters on the optimization targets.
| Sequence | Design parameters | Optimization targets | |||
|---|---|---|---|---|---|
| L/D | h/R | Angle/° | MER/10−8 kg m−2 s−1 | DP/Pa | |
| 1 | 3 (−1) | 0.6 (−1) | 75 (0) | 3.25 | 2884 |
| 2 | 7 (1) | 0.8 (0) | 45 (−1) | 3.77 | 3282 |
| 3 | 5 (0) | 0.8 (0) | 75 (0) | 3.21 | 3111 |
| 4 | 5 (0) | 1 (1) | 45 (−1) | 2.34 | 3460 |
| 5 | 5 (0) | 0.6 (−1) | 105 (1) | 2.71 | 2949 |
| 6 | 3 (−1) | 1 (1) | 75 (0) | 2.37 | 3367 |
| 7 | 7 (1) | 1 (1) | 75 (0) | 2.01 | 3630 |
| 8 | 5 (0) | 1 (1) | 105 (1) | 2.15 | 3515 |
| 9 | 7 (1) | 0.8 (0) | 105 (1) | 2.85 | 3191 |
| 10 | 7 (1) | 0.6 (−1) | 75 (0) | 2.55 | 2996 |
| 11 | 3 (−1) | 0.8 (0) | 45 (−1) | 3.16 | 2999 |
| 12 | 5 (0) | 0.8 (0) | 75 (0) | 3.21 | 3111 |
| 13 | 3 (−1) | 0.8 (0) | 105 (1) | 4.11 | 3084 |
| 14 | 5 (0) | 0.6 (−1) | 45 (−1) | 2.78 | 3155 |
| 15 | 5 (0) | 0.8 (0) | 75 (0) | 3.21 | 3111 |
Response surface analysis facilitates the exploration and optimization of response objectives through a limited number of experimental points within a specified design space.32,33 The second-order polynomial model commonly used in such analysis is expressed as follows:
 | (5) |
The fitted model for MER and DP is as follows:
| MER = −8.845 − 0.083125A + 30.65B + 0.024292C + 0.2125AB − 0.007792AC 0.005BC + 0.039062A2 − 20.53125B2 + 0.000118C2 | (6) |
| DP = 4769.000 + 55.4375A − 4825B − 12.22917C + 94.375AB − 0.733333AC + 10.875BC − 2.8125A2 + 2987.5B2 + 0.0436111C2 | (7) |
These regression models describe the dependence of MER and DP on the design parameters (L/D, h/R, and angle). The results form the basis for optimization and provide a clear understanding of the effects of structural modifications on erosion rates and pressure drop.
In this study, equal weighting was applied to MER and DP. However, future optimization models could incorporate weighted multi-objective functions where MER may be prioritized using methods such as AHP or entropy weight methods.
3.3. Significance testing and variance analysis
Analysis of Variance (ANOVA) was used to assess the fit and significance of the regression models for the Maximum Erosion Rate (MER) and pressure Drop (DP). The results summarized in Tables 4 and 5 indicate that the fitting functions for both MER and DP are statistically significant, with p-values less than 0.05. Statistically significant terms in the model (p-values < 0.05) were retained, while non-significant terms were considered for removal to refine the model.| Project | Seq. SS | Degrees of freedom | Mean square | F-value | P-value |
|---|---|---|---|---|---|
| a A, B, and C represent the regression coefficients determined from the response surface fitting. | |||||
| Model | 4.77 | 9 | 0.5298 | 49.45 | 0.0002 |
| A − L/D | 0.3655 | 1 | 0.3655 | 34.11 | 0.0021 |
| B − h/R | 0.7321 | 1 | 0.7321 | 68.32 | 0.0004 |
| C-angle | 0.0066 | 1 | 0.0066 | 0.6171 | 0.4677 |
| AB | 0.0289 | 1 | 0.0289 | 2.70 | 0.1615 |
| AC | 0.8742 | 1 | 0.8742 | 81.59 | 0.0003 |
| BC | 0.0036 | 1 | 0.0036 | 0.3360 | 0.5873 |
| A2 | 0.0901 | 1 | 0.0901 | 8.41 | 0.0338 |
| B2 | 2.49 | 1 | 2.49 | 232.41 | <0.0001 |
| C2 | 0.0417 | 1 | 0.0417 | 3.89 | 0.1056 |
| Residuals | 0.0536 | 5 | 0.0107 | — | — |
| Project | Seq. SS | Degrees of freedom | Mean square | F-value | P-value |
|---|---|---|---|---|---|
| Model | 6.58 × 10⁵ | 9 | 73![[thin space (1/6-em)]](https://www.rsc.org/images/entities/char_2009.gif) 190.51 190.51 |
35.80 | 0.0005 |
| A − L/D | 73153.12 |
1 | 73153 |
35.79 | 0.0019 |
| B − h/R | 4.94 × 10⁵ | 1 | 4.94 × 10⁵ | 241.67 | <0.0001 |
| C-angle | 3081.13 | 1 | 3081.13 | 1.51 | 0.2742 |
| AB | 5700.25 | 1 | 5700.25 | 2.79 | 0.1558 |
| AC | 7744.00 | 1 | 7744.00 | 3.79 | 0.1092 |
| BC | 17030.25 |
1 | 17030.25 |
8.33 | 0.0343 |
| A2 | 467.31 | 1 | 467.31 | 0.2286 | 0.6527 |
| B2 | 52727.08 |
1 | 52727.08 |
25.79 | 0.0038 |
| C2 | 5688.23 | 1 | 5688.23 | 2.78 | 0.1562 |
| Residuals | 10220.75 |
5 | 2044.15 | — | — |
For MER, the significant terms are A(L/D), B(h/R), AC, A2, and B2, highlighting the complexity of the relationship between MER and structural parameters. Similarly, for DP, the significant terms are A, B, BC, and B2, indicating non-linear interactions among the parameters.
The variance analysis results presented in Table 6 demonstrate a high goodness-of-fit, with adjusted R2 values of 96.89% for MER and 95.72% for DP. This implies that only 3.11% and 4.28%, respectively, of the variations in the data are not explained by the quadratic regression models.
| Statistical item | MER/10−8 kg m−2 s−1 | DP/Pa |
|---|---|---|
| Calibration coefficient | 0.9689 | 0.9572 |
| Coefficient of variation (%) | 3.55 | 1.42 |
| Precision | 23.80 | 18.64 |
Large F-values of 49.45 (MER) and 35.80 (DP) indicate the high significance of these models. The coefficients of variation (CV), at 3.55% for MER and 1.52% for DP, confirm the reliability and accuracy of the simulations. Precision values of 23.80 (MER) and 18.64 (DP) exceed the benchmark value of 4, indicating that the models are suitable for predicting and analyzing responses.
These results confirm the robustness of the models and their applicability to optimizing design parameters.
3.4. Regression model analysis
The regression models were evaluated for accuracy and reliability using residual plots and predicted versus simulated comparisons. The normal probability plot of residuals for MER and DP, as shown in Fig. 8, indicates that the residuals align along a straight line. This alignment confirms that the errors follow a normal distribution, which supports the stability and suitability of the models. | ||
| Fig. 8 Normal probability distribution of residuals for MER (left) and DP (right). | ||
Fig. 9 illustrates the predicted and simulated values of MER and DP. The close alignment between these values suggests that the regression models accurately capture the underlying relationships between the design variables and the responses. The strong agreement highlights the efficacy of the developed regression equations in predicting system behavior with high precision. The swirl section induces secondary flows and enhances the turbulence intensity, particularly near the wall, leading to more frequent wall impacts. This localized increase in the near-wall velocity gradient causes a marginal rise in erosion compared to the straight pipe.
 | ||
| Fig. 9 Actual vs. predicted values of MER (left) and DP (right). | ||
3.5. Response surface analysis
To analyze the interaction effects between the design variables on the responses, two-dimensional response surface contour plots were generated (Fig. 10). | ||
| Fig. 10 Response surface plots showing the effects of bivariate interactions on MER and DP. (a)–(c) response surfaces for MER along the h/R direction; (d)–(f) increase in DP with rising L/D and h/R. | ||
In Fig. 10(a), the red zone indicates that the combination of a small L/D ratio and a sufficiently large twist angle (angle) leads to severe erosion. Such configurations generate a highly twisted flow field that intensifies the turbulence and promotes wall erosion. Similarly, Fig. 10(c) shows that a high L/D value of 7 coupled with a small twist angle causes poor dispersion, leading to particle accumulation and erosion worsening.
To minimize MER, a balance must be struck by employing moderate twisting angles and increasing h/R.
A comparison of the gradients of response surfaces for h/R and Angle shows that h/R plays a more dominant role in affecting DP, as the gradient in this direction is significantly steeper. Therefore, the height of the swirl vanes is a critical factor that influences the DP to be much larger. This indicates that the swirl vane height is the primary factor affecting the pressure drop (DP).
3.6. Acquisition of Pareto front and probabilistic multi-objective optimization
The primary objective of the optimization process was to identify the optimal design parameters that minimized both MER and DP. The response surface analysis confirmed the conflicting nature of these optimization goals because reducing the MER typically increases the DP. To address this challenge, NSGA-II was applied to generate the Pareto front.| Sequence | L/D | h/R | Angle/° | MER/10−8 kg m−2 s−1 | DP/Pa | Pi |
|---|---|---|---|---|---|---|
| No vortex vanes | — | — | — | 3.47 | 2589 | — |
| Optimal set 1 | 6.73 | 1 | 101.8 | 1.80 | 3614 | 0.02237 |
| Optimal set 2 | 3.01 | 1 | 46.0 | 2.14 | 3273 | 0.02230 |
The resulting Pareto front (Fig. 11) reflects the conflict between MER and DP, indicating that reducing MER will increase DP. The Pareto front exhibits three distinct segments:
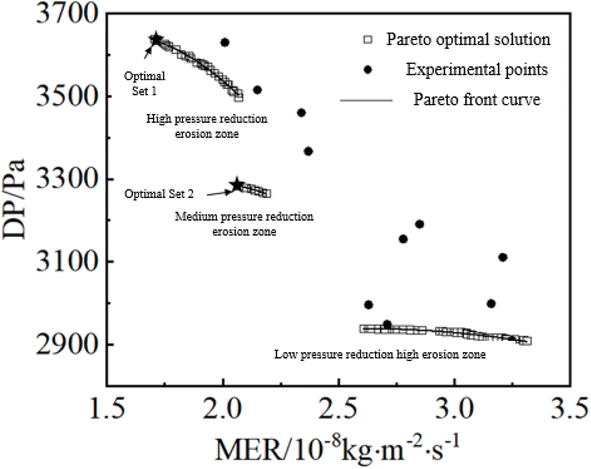 | ||
| Fig. 11 Pareto front and distribution of experimental points. | ||
• High DP and low MER: DP = 3502–3641 Pa, MER = 1.70 × 10⁻⁸–2.07 × 10⁻⁸ kg m−2 s−1.
• Medium DP and medium MER: DP = 3263–3287 Pa, MER = 2.07 × 10⁻⁸–2.20 × 10⁻⁸ kg m−2 s−1.
• Low DP and high MER: DP = 2905–2940 Pa, MER = 2.56 × 10⁻⁸–3.51 × 10⁻⁸ kg m−2 s−1.
Probability optimization was applied to the Pareto front, and two structural designs were found to have significantly higher optimal selection probabilities (Pi) than the others. The structural parameters of these two designs are summarized in Table 7.
• Group 1 (optimal set 1): MER = 1.91 × 10⁻⁸ kg m−2 s−1, DP = 3641 Pa, with relative errors of 6.1% (MER) and 0.7% (DP) compared to NSGA-II results.
• Group 2 (optimal set 2): MER = 2.22 × 10⁻⁸ kg m−2 s−1, DP = 3284 Pa, with relative errors of 3.7% (MER) and 0.3% (DP).
These results confirm the accuracy and reliability of the regression models and NSGA-II optimization.
 | ||
| Fig. 12 The maximum erosion rate for pipes without swirl vanes and those with optimized swirl design. (a) Is without swirl vanes, (b) is Group 1 (optimal set 1), (c) is Group 2 (optimal set 2). | ||
However, the swirl section induces secondary flows and enhanced turbulence intensity, particularly near the wall, leading to more frequent wall impacts. This localized increase in the near-wall velocity gradient causes a marginal rise in erosion compared to the straight pipe immediately after the swirl section. Nevertheless, this increase was spatially limited and did not affect the exit section, where critical erosion damage usually occurs. Thus, the overall erosion mitigation achieved by the optimized design, especially at high-risk elbow zones, outweighs this localized trade-off, resulting in a substantial net benefit for pipeline durability.
4. Conclusion
This study presents the design and optimization of a three-dimensional twisted swirl-vane erosion-resistant structure (PRSS) to reduce erosion in slag-water elbow pipelines. Through a combination of numerical simulations, response surface methodology, and multi-objective optimization, this study demonstrated that the PRSS can significantly reduce erosion rates while maintaining acceptable pressure drops.Key findings include the identification of optimal structural parameters, specifically, twist angles and a vane height-to-radius ratio (h/R) of 1, which effectively reduced the maximum erosion rate (MER) by up to 45%. However, these structure modifications introduced a trade-off in the form of increased pressure drop, which was rigorously evaluated using the NSGA-II algorithm and probabilistic selection methods. The analysis revealed two Pareto-optimal configurations, balancing erosion reduction and energy efficiency.
The CFD validation results confirmed the reliability of the regression models and the optimization strategy, with errors in the MER and DP predictions maintained below 7%. The visualization analysis further showed that although the swirl section slightly increased the erosion due to localized turbulence, it significantly reduced the overall erosion at the elbow exit, where damage was most critical. This suggests that PRSS design redistributes particle impacts away from vulnerable regions, thereby extending the pipeline lifespan.
From an industrial perspective, the PRSS structure provides practical and scalable solutions. The modest increase in the pressure drop is acceptable considering the substantial reduction in the maintenance frequency and material degradation. Its application is especially promising in coal gasification and slurry transport pipelines, where erosion control is essential for operational stability and cost-effectiveness.
Future work should consider real-time monitoring of erosion under variable operating conditions, experimental validation under multiphase flow regimes, and the inclusion of non-spherical particle effects to further enhance prediction accuracy. Additionally, the integration of this design with smart monitoring technologies may pave the way for adaptive pipeline systems capable of real-time erosion mitigation.
Data availability
All the data supporting the findings of this study entitled “Optimized design of a high-solid-content liquid elbow: an anti-erosion 3D twisted swirl plate structure”, including experimental results and computational simulations, are included within the manuscript. Any additional information can be provided by the corresponding author upon reasonable request.Conflicts of interest
There are no conflicts to declare.References
- H. Xiang, Y. Yang and Y. Li, Chem. Ind. Eng. Prog., 2022, 41, 1399–1408 Search PubMed.
- H. Gao, L. Liang, K. Jin and J. Tan, Coal Sci. Technol., 2024, 52, 192–208 Search PubMed.
- F. Wang, Clean Coal Technol., 2021, 27, 1–33 Search PubMed.
- W. Shuo, Z. Yaxin and Z. Botao, Chem. Ind. Prog., 2023, 42, 3431–3442 Search PubMed.
- H. Yu, H. Liu, S. Zhang, J. Zhang and Z. Han, Powder Technol., 2023, 422, 118457 CrossRef CAS.
- J. Pei, A. Lui, Q. Zhang, T. Xiong, P. Jiang and W. Wei, Powder Technol., 2018, 333, 47–59 CrossRef CAS.
- C. A. R. Duarte, F. J. de Souza and V. F. dos Santos, Powder Technol., 2016, 288, 6–25 CrossRef CAS.
- R. Li, Z. Sun, A. Li, Y. Li and Z. Wang, Powder Technol., 2022, 398, 117128 CrossRef CAS.
- Z. Guo, J. Zhang, H. Li and H. He, Powder Technol., 2022, 412, 117976 CrossRef CAS.
- C. A. R. Duarte and F. J. de Souza, Wear, 2017, 380, 176–190 CrossRef.
- L. Xu, F. Wu, Y. Yan, X. Ma, Z. Hui and L. Wei, Powder Technol., 2021, 393, 670–680 CrossRef CAS.
- Y. Lü, K. Lu, Y. Bai, Y. Ma and Y. Ren, Chin. J. Chem. Eng., 2021, 35, 143–151 CrossRef.
- G. Liu, W. Zhang, L. Zhang and J. Cheng, Materials, 2021, 14, 4099 CrossRef CAS.
- X. Song, P. Luo, S. Luo, S. Huang and Z. Wang, Adv. Mech. Eng., 2017, 9 DOI:10.1177/1687814017733249.
- L. Yao, Y. Liu, Z. Xiao and Y. Chen, Energy, 2023, 270, 126891 CrossRef.
- T. Deng, M. Patel, I. Hutchings and M. S. A. Bradley, Wear, 2005, 258, 426–433 CrossRef CAS.
- L. Chen, B. Cui, C. Zhang, X. Hu, Y. Wang, G. Li, L. Chang and L. Liu, Environ. Sci. Technol., 2024, 58, 10558–10566 CrossRef CAS.
- L. Chen, Y. Cao, X. Hu, B. Zhang, X. Chen, B. Cui, J. Xu, T. Yu and Z. Xu, Build. Environ., 2025, 271, 112600 CrossRef.
- F. Wen, L. Xu, Y. Chen, Z. Deng, S. Zhang, W. Song, Y. Li and L. Wei, Particuology, 2024, 90, 323–339 CrossRef.
- T. A. Sedrez and S. A. Shirazi, Wear, 2021, 476, 203683 CrossRef CAS.
- K. Wang, X. Li, Y. Wang and R. He, Powder Technol., 2017, 314, 490–499 CrossRef CAS.
- W. Peng and X. Cao, Powder Technol., 2016, 294, 266–279 CrossRef CAS.
- S. Ghosh and P. S. Goswami, Phys. Fluids, 2022 DOI:10.1063/5.0097173.
- H. A. Elghannay and D. K. Tafti, J. Comput. Multiph. Flows, 2018, 10, 215–227 CrossRef CAS.
- R. Zhao, Y. Zhao, Q. Si and X. Gao, Powder Technol., 2022, 398, 117043 CrossRef CAS.
- Y. Zhang, E. Reuterfors, B. S. McLaury, S. Shirazi and E. Rybicki, Wear, 2007, 263, 330–338 CrossRef CAS.
- W. Peng, Study on the Solid Particle Erosion Mechanism of Pipe Bend for Multiphase Flow, China University of Petroleum, Qingdao, China, 2017 Search PubMed.
- X. Pan, H. Liu, A. Liao, L. Yan and B. Shi, Chem. Ind. Eng. Prog., 2015, 34, 1236 Search PubMed.
- H. Han, R. Yu, B. Li and Y. Zhang, Appl. Therm. Eng., 2019, 159, 113731 CrossRef.
- M. Zheng, H. Teng, J. Yu, Y. Cui and Y. Wang, Probability-based Multi-Objective Optimization for Material Selection, Springer, 2023 Search PubMed.
- S. Zhao, J. Bao, S. Ge, Z. Wang, Y. Yin and Y. Li, Tribol. Int., 2023, 186, 108635 CrossRef.
- H. Han, B. Li and W. Shao, Appl. Therm. Eng., 2014, 70, 250–262 CrossRef.
- J. Zhang, X. Wang, Y. Yang, Y. Ren and L. Chen, Chem. Ind. Eng. Prog., 2023, 42, 5363 Search PubMed.
| This journal is © The Royal Society of Chemistry 2025 |