DOI:
10.1039/D4RA08890E
(Paper)
RSC Adv., 2025,
15, 8594-8608
Facile synthesis of ZIF-8@GO composites for enhanced adsorption of cationic and anionic dyes from their aqueous solutions
Received
19th December 2024
, Accepted 27th February 2025
First published on 20th March 2025
Abstract
In this study, zeolitic imidazolate frameworks (ZIFs) and ZIF-8-graphene oxide (ZIF-8@xGO) composites were prepared at room temperature to be used as adsorbents for cationic (methylene blue (MB)) and anionic dyes (methyl orange (MO)) from their aqueous solutions. The structural characteristics confirmed the successful preparation of amorphous ZIF-8 and its ZIF-8@GO composites at room temperature. The BET surface area of the ZIF-8@0.5GO composite was estimated to be 286.22 m2 g−1, with a mean pore diameter of 3.34 nm. The adsorption study confirmed that dye removal efficiency of ZIF-8 was significantly enhanced when blended with GO. The maximum removal efficiency of the ZIF-8@0.5GO composite was achieved within 60 min, and the removal percentages of MB and MO dyes were 95.2% and 94.6%, respectively. These values were close to those achieved by GO at 60 min (96.2% for MB and 96.3% for MO). The kinetic study confirmed that the adsorption data of MB onto GO, ZIF-8, and the ZIF-8@xGO composites fitted the non-linear pseudo-first-order kinetic model, while the adsorption of MO dye obeyed the non-linear pseudo-second-order kinetic model. Moreover, the adsorption isotherm study confirmed that the adsorption of both MB and MO dyes onto the ZIF-8 and its ZIF-8@xGO composites were fitted to the Langmuir model, which indicates a chemical adsorption process. The estimated maximum adsorption capacity of the ZIF-8@0.5GO composite towards MB and MO were 87.39 and 82.78 mg g−1, which are much higher than that achieved by pure ZIF-8 and very close to that obtained by pure GO. This indicates that our prepared ZIF-8@GO composites are comparable to pure GO. The thermodynamic study confirmed that adsorption of both the dyes onto the prepared materials is endothermic, spontaneous, and thermodynamically favorable.
1 Introduction
Due to the rapid increase in industrialization and urbanization, the global ecosystem has been seriously contaminated by various pollutants, such as heavy metals, dyes, and other chemicals.1 Therefore, there is an urgent need to eliminate these pollutants.2 Due to the extensive use of dyes in the textile, pharmaceutical, food, cosmetic, plastic, photographic, and paper industries, their effluents are considered as major sources of water pollution.3 It has been reported that synthetic dyes are implicated in health risks, such as cancer, allergic reactions, and mutagenesis. In addition, the presence of dyes usually prevent sunlight from penetrating the water, leading to the eutrophication of water bodies and death of plants and animals.4 Therefore, the recovery of dyes from polluted water is highly recommended to save the environment and human health.5 However, effluents released into the environment contain dyes majorly due to their incomplete degradation during the dyeing process.6 Recently, great efforts have been made to develop innovative, effective, and sustainable techniques to remove these polluting dyes from wastewater.
Various techniques, such as ion exchange,7 coagulation,8 precipitation,9 advanced oxidation processes (AOP),10 photodegradation,11 and biodegradation,12 have been used for dye removal from wastewater. Adsorption is a promising technique widely utilized for the removal of various pollutants from wastewater due to its simplicity and high efficiency.13–15 Adsorbent material is the cornerstone of the adsorption process, which determines the overall adsorption performance. Various adsorbent materials, including carbon-based materials,16 metal oxides,17,18 polymers,19 and agricultural wastes,20 have been utilized as efficient adsorbents for dye removal from wastewater. Metal–organic frameworks (MOFs) have received great attention as promising crystalline materials with unique three-dimensional (3D) porous nanostructures, which are composed of organic–inorganic composites with metal ions and organic linkers.21 Based on their outstanding properties, such as high surface area, ordered structure, and high thermal and chemical stability, MOFs have great attention in various applications, including hydrogen production,22 CO2 uptake,23 and third-generation solar cells.24,25 MOF materials also display high performance in toxic dye removal.26,27 Recently, zeolitic-imidazolium frameworks (ZIFs), a famous class of MOFs, have received great interest due to their outstanding chemical and physical properties besides the high surface area.28 Typically, ZIF-8 can be synthesized by various techniques, such as solvothermal and microemulsion methods. For instance, Cao et al.,29 reported that ZIF-8 prepared by reverse microemulsion displayed high adsorptive affinity toward Congo red (CR) dye with an adsorption capacity of 1339.8 mg g−1. However, pure ZIF-8 generally possesses poor solvent tolerance and a relatively smaller size, which restricts its adsorption efficiency.30 Therefore, great efforts have been devoted to improving the adsorption performance of ZIF-8 via various techniques. Combining ZIF-8 with other materials is a promising strategy to improve its overall adsorption performance. For example, ZIF-8@ZIF-67 bimetallic composite fabricated in a simple way at room temperature31 displayed high adsorption affinity toward rhodamine B (RhB), with a maximum adsorption capacity of 143.26 mg g−1, which is much higher than those of ZIF-8 (56.40 mg g−1) and ZIF-67 (81.63 mg g−1). The isotherm analysis confirmed that the adsorption of RhB by the ZIF-67, ZIF-8, and ZIF-8@ZIF-67 adsorbents occurred via chemical processes. In another study, core-shell-structured ZIF-8@ZIF-67 with a BET surface area of 1518.75 m2 g−1 was effectively utilized as an adsorbent for Direct blue-86, Reactive Yellow, and Congo red dyes from their aqueous solutions.32 Additionally, ZIF-8/oxidized nanodiamond (OND) composites were prepared as adsorbents for methylene blue (MB).33 The maximum adsorption capacity of ZIF-8/OND (343 mg g−1) was much higher than that achieved by ZIF-8 (242 mg g−1). Metal oxides have also been used to improve the adsorptive ability of ZIF-8. For instance, D. Tuncel, and A. N. Ökte reported that the adsorption capacity of the ZnO-ZIF-8 composite toward methyl orange (MO) and MB dyes was much higher than that achieved by pure ZIF-8 due to the high surface area and porous structure inherited from ZIF-8.34
Graphene oxide (GO) is a promising 2D carbon material with a high specific area and mechanical and chemical stability. The functional groups on the surface of GO, such as carboxyl, epoxy, and hydroxyl groups, contribute to its high specific surface energy, good hydrophilicity, and mechanical properties. Additionally, these groups allow GO to be separated in water and peeled via simple ultrasonication. Therefore, combining ZIF-8 with GO leads to the formation of composites with higher surface area, larger pore volume, layered structures, and variable pore functions, all of which enhance the adsorption ability of ZIF-8. Moreover, due to coordination between the metal ions in ZIF-8 and the carboxyl groups of GO, the ZIF-8 particles can be uniformly distributed on the surface of the GO layers, which minimizes the agglomeration of ZIF-8 and thus enhances the overall adsorption performance. Therefore, in this study, we combined ZIF-8 with small amounts of GO to prepare ZIF-8@xGO composites by a one-step process at room temperature. The prepared composites were utilized as adsorbents for cationic (MB) and anionic (MO) dyes (representative pollutants) from their aqueous solutions. The results indicate that the removal efficiency of MB and MO dyes by ZIF-8 remarkably enhanced after introducing a small amount of GO, and the overall adsorption efficiency of the ZIF-8@0.5GO composite toward MB and MO dyes was very close to those achieved by GO. To the best of our knowledge, only a few studies have explored the use of ZIF-8-based adsorbents to remove both MB and MO dyes from wastewater. Thus, our work paves the way for developing new ZIF-based materials to recover dyes from wastewater on a large scale.
2 Experimental section
2.1 Materials
Sodium hydroxide (NaOH, ≥98%, anhydrous), hydrochloric acid (HCl, 37%), sulfuric acid (H2SO4, 95%), phosphoric acid (H3PO4, ≥85 wt% in H2O), H2O2 (30% w/w in water), zinc acetate dihydrate (Zn(CH3COO)2·2H2O, ≥98%), and absolute alcohol (C2H5·OH, ≥95%) were purchased from Merck, Darmstadt, Germany. Methylene blue (MB; C16H18ClN3S; Mw 319.85 g mol−1) and methyl orange (MO; C14H14N3NaO3S; Mw 327.34 g mol−1) were obtained from Alpha Chemika, India. 2-Methylimidazole (C4H6N2; Mw 82.10 g mol−1) was purchased from Sigma Aldrich, USA. Graphite (325 mesh, 98% metal basis) was supplied by Alfa Aesar. All reagents were of analytical purity and used as received. Distilled water was used to prepare all solutions.
2.2 Preparation of adsorbent materials
In our study, ZIF-8 and ZIF-8@xGO (x = 0.1 and 0.5 g) composites were prepared and utilized as adsorbents for cationic and anionic dyes from their aqueous solutions. For pure ZIF-8, aqueous solutions of zinc acetate (0.22 g/10 mL distilled water) and 2-methylimidazole (4 g/70 mL distilled water) were slowly mixed under magnetic stirring for 1 h. The obtained milk-white mixture was centrifuged at 4500 rpm for 10 min, and the obtained white precipitate was thoroughly washed using distilled water, followed by drying in a vacuum oven at 100 °C for 12 h, and the obtained material is called ZIF-8.35
Pure GO layers were prepared using a modified Hummers' method.36 Briefly, 27 mL of concentrated H2SO4 was mixed with 3 mL of concentrated H3PO4 under magnetic stirring for 10 min. Then, 0.225 g of graphite powder was slowly added, and the mixture was kept under a magnetic stirrer for another 20 min. After that, 1.32 g of KMnO4 was slowly added as an oxidizing agent, and the mixture was magnetically stirred for 24 h at 50 °C. To the above mixture, exactly 0.675 mL of an H2O2 solution (to aid the exfoliation of the GO layers) was slowly dropped, and the whole mixture was kept under magnetic stirring in an ice bath for 10 min. The brown precipitate was collected by centrifugation at 4500 rpm and washed with 50 mL distilled water and 20 mL of HCl (30%). Finally, the brown precipitate was washed thoroughly with distilled water till the pH of the filtrate reached ≈7. Finally, the solid product was subjected to drying at 100 °C for 12 h, and the obtained material is called GO.
The ZIF-8@xGO composites were prepared using a simple two-step method at room temperature. In the first step, x grams (x = 0.1 and 0.5) of prepared GO were added to 70 mL distilled water in two glass flasks; then both suspensions were sonicated for 15 min and subjected to stirring for another 30 min at room temperature.
The second step involved the precipitation of ZIF-8 crystals on the GO layers, for which 4 g of 2-methyl imidazole was slowly added to each of the above GO suspensions and kept under magnetic stirring for 30 min. Then, 0.22 g of zinc acetate dissolved in 10 mL distilled water was dropped into the above mixtures and mixed using a magnetic stirrer for 30 min. After that, the obtained products were collected by centrifugation at 4500 rpm and thoroughly washed with distilled water and finally subjected to drying at 100 °C for 12 h. The obtained materials are denoted as ZIF-8@0.1GO and ZIF-8@0.5GO composites. The schematic representing the synthesis of ZIF-8@xGO composites is shown in Fig. 1.
 |
| | Fig. 1 Scheme of the preparation of ZIF-8@xGO composites. | |
2.3 Characterization
The prepared ZIF-8, GO, and ZIF-8@GO materials were characterized by Fourier transform infrared spectroscopy (FT-IR) to identify the functional groups before and after dye adsorption. The FT-IR spectra were recorded in the 4000–400 cm−1 wavenumber range at a resolution of 2 cm−1 on a Nicolet spectrophotometer (model 6700). The crystalline nature of the prepared materials was investigated by X-ray diffraction (XRD) on a Bruker D8 advanced X-ray diffractometer operated at 40 kV with a Cu-Kα radiation source (λ = 0.15406 nm). The XRD patterns were recorded in the 2θ range of 5° to 90.02° with a step size of 0.06°. The morphology of the prepared materials was examined by field emission scanning electron microscopy (FE-SEM) using a JSM 7100F (JEOL Ltd, Japan). Transmission electron microscopy (TEM) images were obtained on a JEM-2100F field emission microscope (JEOL Ltd, Japan) at an accelerating voltage of 200 kV. The surface area was investigated based on nitrogen adsorption–desorption tests carried out on a Micromeritics ASAP 2020 HD88 system. The surface area and pore size of the prepared ZIF-8@0.5GO composite were studied by Brunauer–Emmett–Teller (BET) and Barrett–Joyner–Halenda (BJH) models, respectively.
The pH values of the prepared materials at the point of zero charge (pHPZC) were determined using the drift method.37 The experiments were performed in 50 mL flasks containing 20 mL of 0.1 M NaNO3 solution. The initial pH (pHi) values were adjusted from 2 to 12 using 0.1 M HCl and 0.1 M NaOH solutions. To each solution, exactly 0.05 g of ZIF-8 or ZIF-8@0.5GO adsorbent was added; after shaking for 24 h, then the final pH values (pHf) of the supernatant liquid were measured. By plotting pHi vs. pHf, the pHPZC values were determined.38
2.4 Adsorption studies
The prepared materials were utilized as adsorbents to remove MB cationic and MO anionic dyes from their aqueous solutions using the batch adsorption technique. The experiments were performed in 50 mL dark bottles; for each sample, exactly 0.05 g of either adsorbent was mixed with 25 mL of an MB or MO dye solution at an initial concentration of 20 mg L−1 The solid–liquid mixtures were kept under magnetic stirring at a constant speed of 300 rpm for the desired time. The effects of solution pH (2.5–11), contact time (5–90 min), initial dye concentration (20–200 mg L−1), and adsorbent dosage (0.4 to 4 g L−1) on the overall adsorption efficiency (R%) were investigated. The solution pH values of the dye solutions were adjusted using 0.1 M HCl and 0.1 M NaOH solutions. The remaining concentration of both MB and MO after adsorption was measured using a UV-visible spectrophotometer at wavelengths 664 and 465 nm, respectively. The percentage removal (R%) of dyes was determined using eqn (1), and the adsorption capacity (qe; mg g−1) of each adsorbent was determined using eqn (2).| |
 | (1) |
| |
 | (2) |
where C0 and Ce are the initial and final dye concentrations (mg L−1), respectively. V is dye volume (L), and M is adsorbent mass (g).
3 Results and discussion
3.1 Characterization of the adsorbent materials
The phase structure and crystallinity of the prepared ZIF-8, GO, and ZIF-8@0.5GO composites were investigated, and the XRD patterns are presented in Fig. 2a. The XRD pattern of the ZIF-8 crystal displayed a set of the characteristic diffraction peaks at 2θ = 7.4°, 10.4°, 12.7°, 14.7°, 16.4°, 18.0°, 22.1°, 24.5°, 26.7°, and 29.6°, which were assigned to the (011), (002), (112), (022), (013), (222), (114), (233), (134), and (044) planes, respectively. These reflections correspond to the sodalite structure (SOD), which is the typical structure of ZIF-8 (JCPDS no. 00-062-1030).24,39,40 The XRD pattern of GO showed two peaks located at 2θ values of 8.6° and 27.5°, which corresponded to the (001) and (100) diffraction planes, respectively.41 The peak at 2θ = ![[thin space (1/6-em)]](https://www.rsc.org/images/entities/char_2009.gif) 26° could be attributed to the presence of a small amount of unreacted graphitic carbon in GO.42 In the XRD pattern of the ZF-8@0.5GO composite, besides the presence of GO patterns, all peaks belonging to the ZIF-8 crystal were present. However, the relative intensity of the ZIF-8 crystal peak observed in the ZIF-8@0.5GO composite was lower than that of the pure ZIF-8 crystals, indicating the presence of ZIF-8 crystals on the surface of the GO layers.
26° could be attributed to the presence of a small amount of unreacted graphitic carbon in GO.42 In the XRD pattern of the ZF-8@0.5GO composite, besides the presence of GO patterns, all peaks belonging to the ZIF-8 crystal were present. However, the relative intensity of the ZIF-8 crystal peak observed in the ZIF-8@0.5GO composite was lower than that of the pure ZIF-8 crystals, indicating the presence of ZIF-8 crystals on the surface of the GO layers.
 |
| | Fig. 2 (a) XRD patterns of ZIF-8, GO, and the ZIF-8@0.5GO composite. FT-IR spectra of (b) ZIF-8, (c) GO, and (d) the ZIF-8@0.5GO composite before and after the adsorption of MO and MB dyes. | |
To understand the surface functional groups of the prepared materials, the FT-IR spectra of ZIF-8, GO, and ZIF-8@0.5GO powder with and without MB and MO adsorption were recorded, as plotted in Fig. 2(b–d). As presented in Fig. 2b, the FT-IR spectra of the ZIF-8 crystal displayed absorption peaks at 3420 cm−1 and 2930 cm−1, which were assigned to the aromatic and the aliphatic C–H stretching of imidazole, respectively. The peaks located at 1585 cm−1 and 1448 cm−1 were assigned to the –C![[double bond, length as m-dash]](https://www.rsc.org/images/entities/char_e001.gif) N stretching vibrations.43,44 The bands in the spectral region of 990–1310 cm−1 (990 cm−1, 1143 cm−1 and 1310 cm−1) were associated with the in-plane bending of the ring, and the bands below 800 cm−1 were attributed to its out-of-plane bending.38 The band below 500 cm−1 was attributed to the Zn–N stretching vibration.45 After the adsorption of MB and MO dyes onto the ZIF-8 crystals (Fig. 2b), the FT-IR spectra displayed no noticeable change, which indicates good stability of the ZIF-8 crystals in the dye solutions, as well as a physical adsorption process. As seen in Fig. 2c, the FT-IR spectrum of GO displayed a broad peak between 3600–3000 cm−1, indicating O–H groups from the adsorbed water molecules. The peak at 1625 cm−1 denoted CC stretching from the un-oxidized graphitic domain, while the peak at 1740 cm−1 was assigned to CO stretching of the carboxyl group, and 1080 cm−1 could be attributed to the C–O stretching vibrations of C–O–C.46 After the adsorption of MB onto GO, all absorption peaks exhibited higher intensity at the same positions, indicating the stability of GO, as well as a physical adsorption process. The adsorption of MO onto the GO led to noticeable changes in the absorption peaks, indicating chemical bonding between MO and GO. As in Fig. 2d, the FT-IR spectra of the ZIF-8@0.5GO composite before and after the adsorption of MO and MB were the same, indicating a physical adsorption process.
N stretching vibrations.43,44 The bands in the spectral region of 990–1310 cm−1 (990 cm−1, 1143 cm−1 and 1310 cm−1) were associated with the in-plane bending of the ring, and the bands below 800 cm−1 were attributed to its out-of-plane bending.38 The band below 500 cm−1 was attributed to the Zn–N stretching vibration.45 After the adsorption of MB and MO dyes onto the ZIF-8 crystals (Fig. 2b), the FT-IR spectra displayed no noticeable change, which indicates good stability of the ZIF-8 crystals in the dye solutions, as well as a physical adsorption process. As seen in Fig. 2c, the FT-IR spectrum of GO displayed a broad peak between 3600–3000 cm−1, indicating O–H groups from the adsorbed water molecules. The peak at 1625 cm−1 denoted CC stretching from the un-oxidized graphitic domain, while the peak at 1740 cm−1 was assigned to CO stretching of the carboxyl group, and 1080 cm−1 could be attributed to the C–O stretching vibrations of C–O–C.46 After the adsorption of MB onto GO, all absorption peaks exhibited higher intensity at the same positions, indicating the stability of GO, as well as a physical adsorption process. The adsorption of MO onto the GO led to noticeable changes in the absorption peaks, indicating chemical bonding between MO and GO. As in Fig. 2d, the FT-IR spectra of the ZIF-8@0.5GO composite before and after the adsorption of MO and MB were the same, indicating a physical adsorption process.
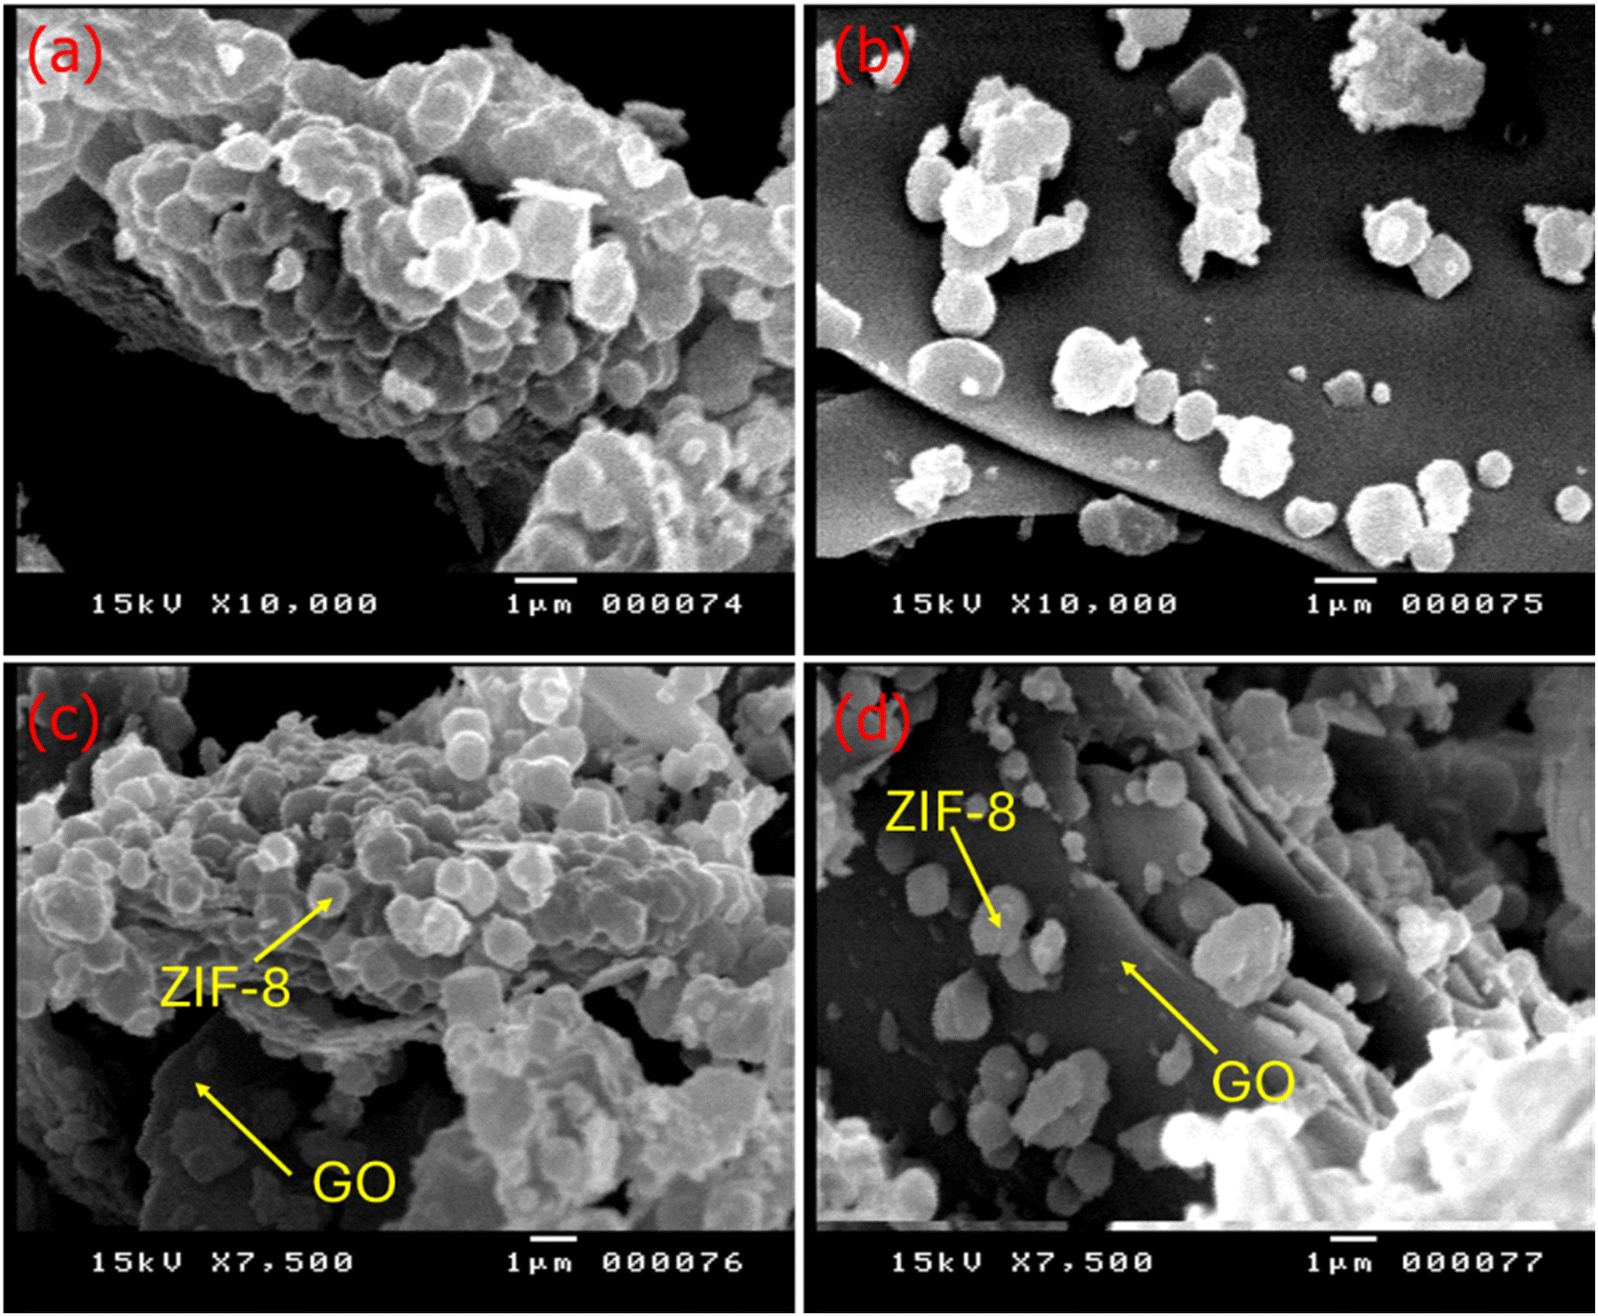
The surface morphology of ZIF-8 and the ZIF-8@0.5GO composite was characterized by SEM, as presented in Fig. 3. The pure ZIF-8 crystals in Fig. 3a and b display a rhombic dodecahedron morphology with an average particle size of 0.8 μm. On the other hand, the ZIF-8@0.5GO composite in Fig. 3c and d displays the growth of ZIF-8 crystals in a rhombic dodecahedral shape with an average particle size of 0.68 μm, which is about 15% smaller than the size of the pure ZIF-8 particles. In addition, the agglomeration of ZIF-8 on the GO layers was lower than that of pure ZIF-8, which is important for enhancing the adsorptive properties of the ZIF-8 crystals. The lower the particle size, the higher the surface area, which directly enhances the adsorptive properties. Additionally, the TEM images of the ZIF-8@0.5GO composite in Fig. 4a–c provide further evidence of the assembly of ZIF-8 over graphene oxide layers.
 |
| | Fig. 3 SEM images of (a) and (b) ZIF-8 and (c) and (d) the ZIF-8@0.5GO composite. | |
 |
| | Fig. 4 (a–c) TEM images of the ZIF-8@0.5GO composite. | |
Besides functional groups and the morphology of the adsorbent materials, its specific surface area plays a critical role in determining the overall adsorption performance. As presented in Fig. 5a, the nitrogen adsorption–desorption isotherm of the ZIF-8@0.5GO composite was of type I, which is a characteristic of mesoporous materials, according to IUPAC categorization.47 Additionally, the pore size distribution curve in Fig. 5b shows that the mesopores were concentrated. Based on the BET equation in the pressure range of applicability (P/Po = 0.05–0.30), the SBET and pore volume of the ZIF-8@0.5GO composite were 286.22 m2 g−1 and 0.225 cm3 g−1, respectively. In addition, the mean pore diameter was 3.34 nm.
 |
| | Fig. 5 (a) Nitrogen adsorption–desorption isotherms and (b) pore size distribution of the ZIF-8@0.5GO composite. (c) The pHPZC values of pure ZIF-8 and the ZIF-8@0.5GO composite. | |
The pHPZC value is used to determine the surface charge of an adsorbent, which is affected by the pH of the solution. Therefore, pHPZC is important to show the attraction and repulsion forces between the adsorbate and adsorbent during the adsorption process. As shown in Fig. 5c, the final pH values of ZIF-8 and the ZIF-8@GO composite determined using the NaNO3 solution increased with increasing the initial pH of the system, indicating the presence of positive surface charges. The pHPZC values were determined from the point of intersection of the final pH line and the initial pH line. Accordingly, the estimated pHPZC values were 6.7 and 7.4 for ZIF-8 and the ZIF-8@GO composite, respectively. It is known that, at pH values below pHPZC, the surface of a material is positive, and at higher pH values, the surface will be negatively charged.48
3.2 Adsorption studies
3.2.1 Effect of pH. The pH plays a key role in the adsorption process as the charge of the adsorbent surface and the ionization of the adsorbate depend on the pH value.49 Moreover, variations in the pH value are mainly responsible for the protonation and deprotonation of the functional groups on the adsorbents and adsorbate molecules, which promote their electrostatic interactions.50 Typically, the adsorption process depends on the pHPZC of the adsorbent and the pKa of the adsorbate.50 The reported pKa for MB and MO dyes are 3.8 and 3.6, respectively. At higher pH values (pH > pKa), the MB and MO dyes in solution are cationic. Additionally, at pH values below pHPZC, the surfaces of these materials are positively charged, and at higher pH values, the surfaces are negatively charged.48 Thus, the effect of pH on the adsorption of MB and MO dyes on ZIF-8, GO, and the ZIF-8@xGO composites was tested by varying the pH value in the range of 2.5–11. From Fig. 6a and b, it can be observed that the ZIF-8 crystal displayed the lowest efficiency of MB and MO removal, and GO displayed the highest removal efficiency. After mixing 0.1 and 0.5 g of GO with ZIF-8, the dye removal efficiency of ZIF-8 was significantly enhanced, and the dye removal efficiency of the ZIF-8@0.5GO composite was quite close to that of GO. As seen in Fig. 6a, the MB removal efficiency increased with increasing pH, and the maximum removal efficiency was achieved at pH ≈ 8 (i.e. at pH > pHpzc). This agrees with the findings of MB adsorption onto activated carbon reported by Al-Hawtali et al.51 On the other hand, the efficiency of MO dye removal (Fig. 6b) increased with increasing pH from 2.5 to 5.5 and then reduced.52 This is in accordance with the previous discussion, that is, when pH < pHpzc, the surface of the adsorbent is positive and thus attracts anionic dye molecules, leading to high removal efficiency.
 |
| | Fig. 6 Effect of pH on the removal of (a) MB and (b) MO dyes from their aqueous solutions [C0 = 50 mg L−1, adsorbent dose = 2 g L−1, t = 45 min, pH of 2.5–11] by the synthesized adsorbents. | |
3.2.2 Effect of contact time. Equilibrium time is a critical parameter for designing systems for wastewater treatment.53 The influence of contact time on the removal efficiency of MB and MO dyes was examined from 5 to 90 min. As shown in Fig. 7a and b, although ZIF-8 crystals displayed the lowest removal efficiency, adding a small amount of GO significantly enhanced the overall removal performance. By increasing the contact time from 5 to 60 min, the MB and MO removal percentages of the ZIF-8@0.5GO composite increased from 60% to 95.2% and from 53.58% to 94.6%, respectively. The optimum MB and MO adsorption efficiency values achieved were close to those achieved by GO at 60 min (96.2% for MB and 96.3% for MO). The higher adsorption in the early stage (i.e., until 60 min) can be attributed to the presence of more unoccupied adsorption sites. In the later stage, an adsorption plateau was observed because the interactions between the dye molecules on the adsorbent and the bulk phase became increasingly repulsive.54
 |
| | Fig. 7 Effects of (a) and (b) contact time [adsorbent dose = 2 g L−1, C0 = 50 mg L−1, pH of 8 for MB, and 5.5 for MO] and (c) and (d) adsorbent dosage [adsorbent dose = 0.4 to 4 g L−1, C0 = 50 mg L−1, pH of 8 for MB, and 5.5 for MO] on the removal of MB and MO dyes by the synthesized adsorbents. | |
3.2.3 Effect of adsorbent dosage. The adsorbent dose is an essential factor that aids in avoiding the wastage of adsorbent materials after reaching equilibrium. The effect of adsorbent dose on the adsorption of both MB and MO dyes was studied by varying the dosage from 0.4 to 4 g L−1. As mentioned in Fig. 7c and d, the MB and MO removal efficiency gradually enhanced with increasing adsorbent dose. The higher removal efficiency at higher adsorbent doses can be attributed to an increase in the number of active sites viable for the adsorption of MB and MO dye molecules.55,56
3.2.4 Adsorption capacity. The initial concentration of adsorbents significantly influences the overall adsorption efficiency. Fig. 8 illustrates the adsorption capacity of ZIF-8, GO, and their ZIF-8@0.1GO and ZIF-8@0.5GO composites toward MB and MO dyes at initial concentrations ranging from 20 to 200 mg L−1. As shown in Fig. 8, the equilibrium adsorption capacity of all materials gradually increased upon increasing the initial MB and MO dye concentrations, and this was followed by a slower increase. It has been reported that at low dye concentrations, there is a significantly low ratio between the initial number of dye molecules and the accessible surface area of the adsorbent. Thus, fractional adsorption is independent of the initial concentration.57 Higher concentrations, however, result in fewer accessible adsorption sites, which lowers the proportion of adsorbate removed. In Fig. 8(a) and (b) it can be observed that the ZIF-8 crystals displayed lower adsorption affinity to MB and MO dyes. The estimated capacities toward MB and MO dyes were 44.97 mg g−1 and 51.45 mg g−1, respectively. On the other hand, GO displayed the highest affinity toward both dyes, with adsorption capacity values of 85.63 mg g−1 and 74.25 mg g−1 for MB and MO dyes, respectively. After adding GO to ZIF-8, the adsorption capacity of ZIF-8 was remarkably enhanced, which can be attributed to the synergistic effect between GO and the ZIF-8 crystals. The adsorption capacities of the ZIF-8@0.5GO composite toward MB and MO dyes were 75.05 mg g−1 and 65.84 mg g−1, respectively, which are close to those achieved by GO and higher than the values of the composite.
 |
| | Fig. 8 Effect of (a) initial MB and (b) MO dye concentrations [adsorbent dose = 2 g L−1, t = 60 min, pH of 8 for MB, and 5.5 for MO] on the adsorption capacity of the synthesized adsorbents. | |
3.2.5 Adsorption kinetics. To investigate the kinetic behavior of the adsorption of MB and MO dyes by GO, ZIF-8 and the ZIF-8@GO composites, three kinetic models in their non-linear forms were used to test the experimental data, i.e., pseudo-first order, pseudo-second order, and intraparticle diffusion models. The pseudo-first-order model is expressed by eqn (3),58 and the pseudo-second-order model is expressed by eqn (4).59| |
 | (4) |
It is difficult to determine the rate-limiting step using the pseudo-first-order and pseudo-second-order models. To solve this issue, an intra-particle diffusion (IPD) model was used, and the non-linear form is expressed as eqn (5).60
where
qe and
qt are the amounts of adsorbed dye in mg g
−1 at equilibrium and time
t, respectively.
k1 (min
−1),
k2 (mg g
−1 min
−1), and
kdiff (mg g
−1 min
−1/2) are the pseudo-first-order, pseudo-second-order, and IPD model rate constants, respectively.
C (mg g
−1) is the boundary thickness of the porous medium.
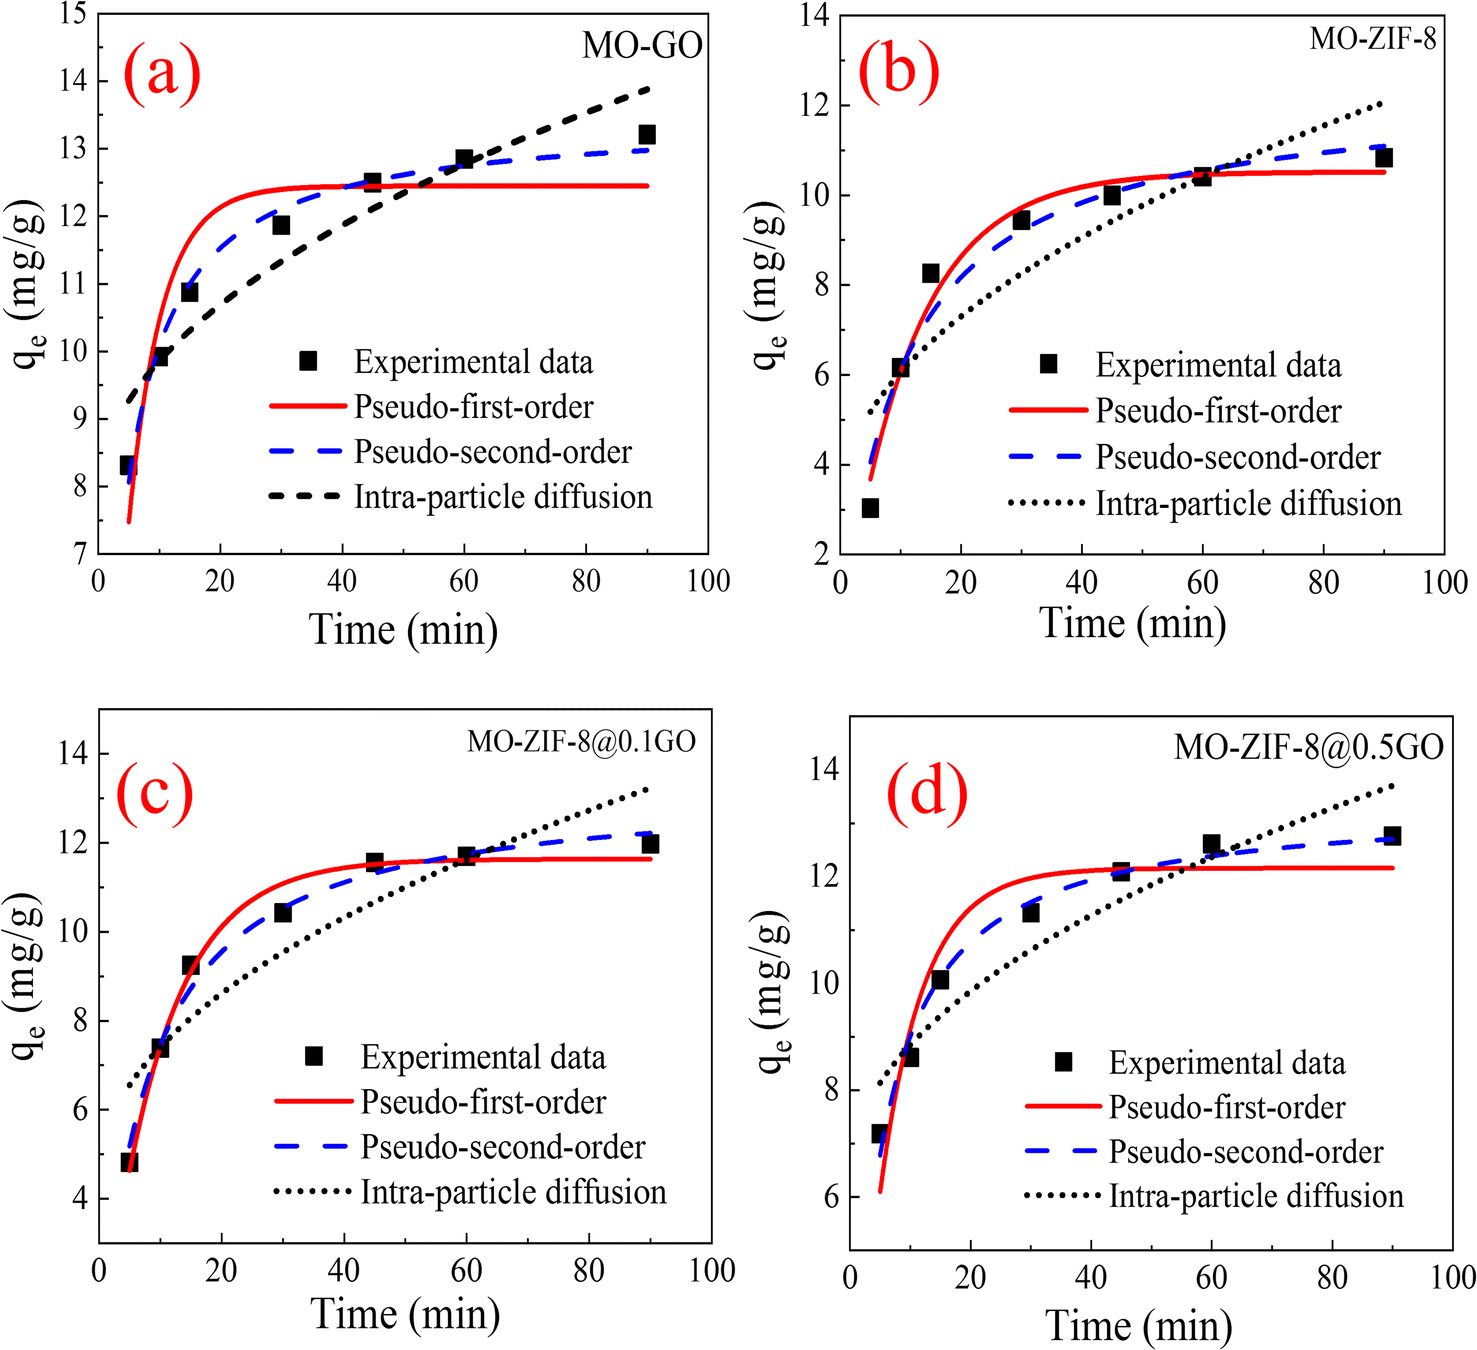
The fitted non-linear kinetic models for the adsorption of MB and MO are presented in Fig. 9 and 10, and their estimated kinetic parameters are listed in Table 1. It can be observed that the experimental data of MB adsorption onto GO, ZIF-8, and the ZIF-8@GO composite materials could be fitted to the pseudo-first-order kinetic model, as indicated by the higher correlation coefficient (R2) values. The qe values estimated for MB adsorption onto GO, ZIF-8, ZIF-8@0.1GO, and ZIF-8@0.5GO were 12.45, 7.71, 10.65, and 12.36 mg g−1, respectively. On the other hand, the experimental data of MO adsorption onto GO, ZIF-8, and the ZIF-8@GO composite materials fitted the pseudo-second-order kinetic model. The qe values estimated from MO adsorption onto GO, ZIF-8, ZIF-8@0.1GO, and ZIF-8@0.5GO were 13.46, 12.35, 13.27, and 13.39 mg g−1, respectively. Furthermore, as seen from the fitted data in Fig. 9 and the parameters in Table 1, despite the higher R2 values for the pseudo-second-order models, the pseudo-first-order models also display higher values (>0.9), which indicates the presence of both physical and chemical adsorption processes. However, the higher R2 values demonstrated that the adsorption process of MB and MO dyes mainly followed the pseudo-first-order and pseudo-second-order kinetic models. Notably, on the surface of an adsorbent, both physisorption and chemisorption may occur simultaneously, with one layer of molecules being physically adsorbed on top of the other.61 Many different mechanisms control adsorption processes, but diffusion mechanisms, such as external diffusion and intra-particle diffusion, are the most restricting.62 As a result, the rate-controlling phase of the adsorption process was estimated using the intra-particle diffusion model. According to the fitted plots presented in Fig. 9 and 10, the intraparticle diffusion model showed the least agreement with the experimental kinetic data. The plots did not pass through the origin as well, suggesting that intra-particle diffusion is also a part of the adsorption process in addition to rate regulation.63 Thus, the entire adsorption process may be controlled by external mass transfer and intraparticle diffusion.
 |
| | Fig. 9 Experimental data and non-linear kinetic models for the adsorption of MB dye onto (a) GO, (b) ZIF-8, (c) ZIF-8@0.1GO, and (d) ZIF-8@0.5GO composites. | |
 |
| | Fig. 10 Experimental data and non-linear kinetic models for the adsorption of MO dye onto (a) GO, (b) ZIF-8, (c) ZIF-8@0.1GO, and (d) ZIF-8@0.5GO composites. | |
Table 1 The kinetic parameters estimated from the non-linear kinetic models for the adsorption of MB and MO dyes
| Kinetic model |
Pseudo-first order |
Pseudo-second order |
Intra-particle diffusion |
| Kinetic parameters |
qe (mg g−1) |
k1 (min−1) |
R2 |
qe (mg g−1) |
k2 (g mg−1 min−1) |
R2 |
kdiff (mg g−1 min−0.5) |
C (mg g−1) |
R2 |
| GO |
MB |
12.45 |
0.160 |
0.996 |
13.98 |
0.018 |
0.941 |
0.655 |
7.89 |
0.628 |
| MO |
12.45 |
0.184 |
0.860 |
13.46 |
0.022 |
0.987 |
0.636 |
0.85 |
0.886 |
| ZIF-8 |
MB |
7.712 |
0.034 |
0.962 |
10.74 |
0.002 |
0.944 |
0.969 |
−0.98 |
0.891 |
| MO |
10.52 |
0.086 |
0.977 |
12.35 |
0.008 |
0.987 |
3.053 |
0.950 |
0.785 |
| ZIF-8@0.1GO |
MB |
10.65 |
0.028 |
0.993 |
15.04 |
0.001 |
0.986 |
1.246 |
−1.198 |
0.960 |
| MO |
11.64 |
0.106 |
0.987 |
13.27 |
0.01 |
0.989 |
4.50 |
0.920 |
0.820 |
| ZIF-8@0.5GO |
MB |
12.36 |
0.159 |
0.984 |
13.43 |
0.019 |
0.972 |
7.27 |
0.689 |
0.866 |
| MO |
12.16 |
0.140 |
0.898 |
13.39 |
0.015 |
0.985 |
6.42 |
0.767 |
0.886 |
3.2.6 Adsorption isotherms. In order to express the adsorption capacity and explain how the adsorbent interacts with the adsorbate molecules, the adsorption isotherms were obtained. Adsorption equilibrium is regarded as a dynamic state at which the rate of dye adsorption is equal to the rate of dye desorption. This equilibrium test thus provides physio-chemical evidence for the viability of the adsorption mechanism. Typically, the surface of the adsorbent can be categorized as monolayer and multilayer. The Langmuir and Freundlich isotherms are the most commonly used models to describe solid–liquid adsorption systems. Monolayer adsorption onto a uniform surface with a finite number of identical sites is described by the Langmuir model. The non-linear form of this model is given by eqn (6).64| |
 | (6) |
where qmax (mg g−1) is the maximum amount of adsorbate in milligram adsorbed per gram of adsorbent, and KL (L mg−1) is the Langmuir constant.Another model that can be used to explain heterogeneous surfaces and multilayer adsorption systems is the Freundlich model, whose non-linear form is given by eqn (7).60
where
Kf (L g
−1) is the Freundlich constant that represents the adsorption capacity, and 1/
n is the adsorption intensity, which should have a value between 0.1 and 1.0 for favorable adsorption.
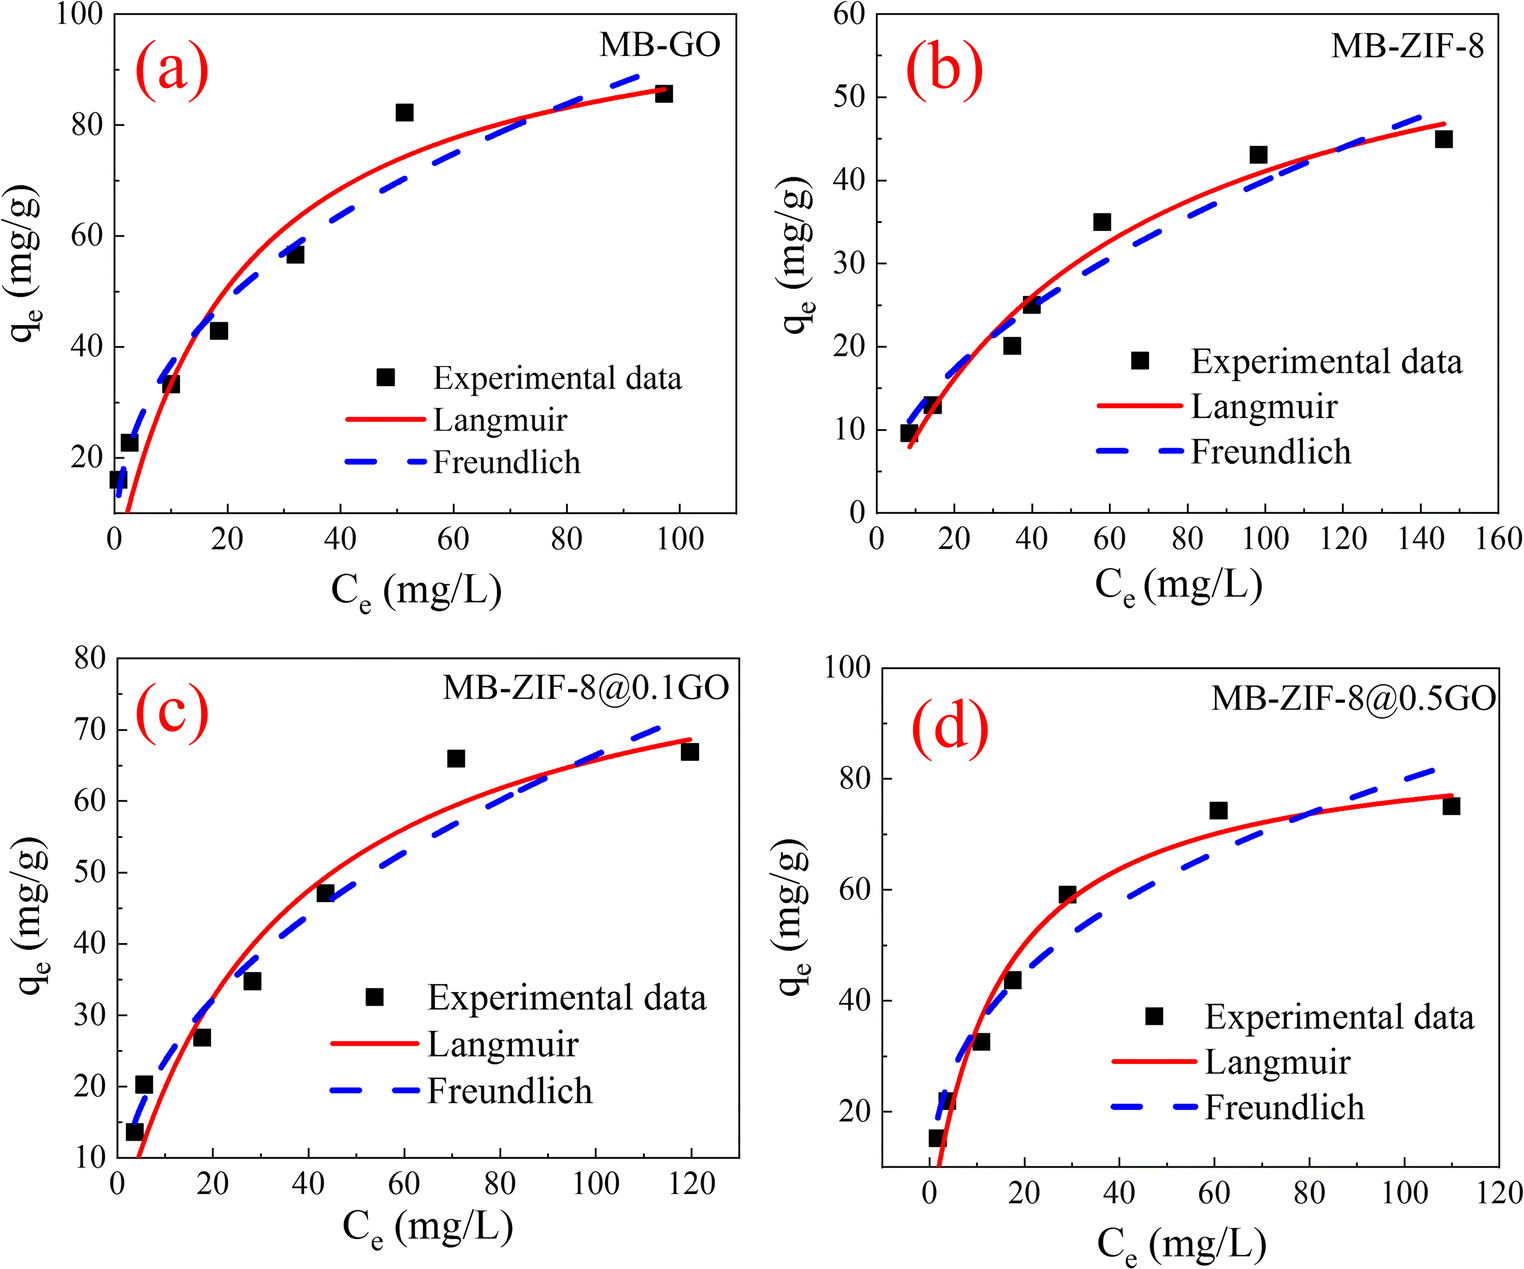
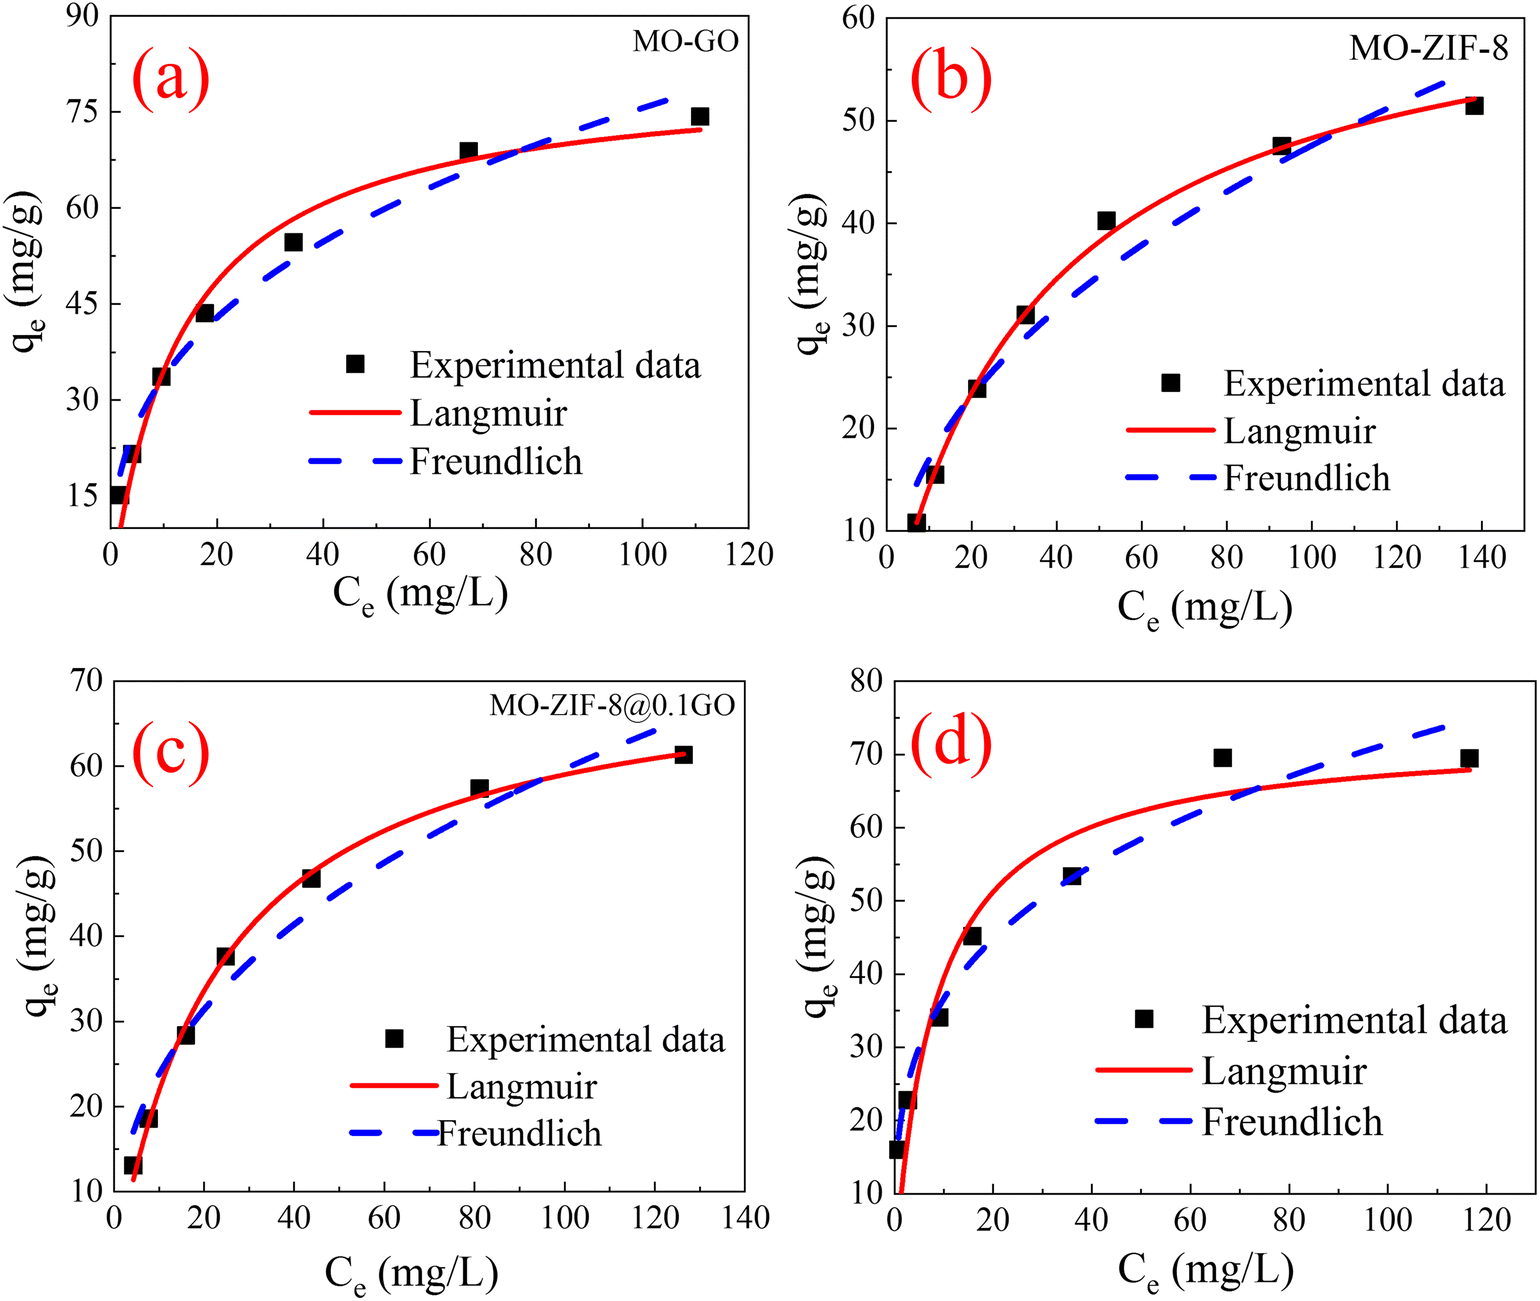
From Fig. 11 and 12 and the related parameters listed in Table 2, based on the greater R2 and lower χ2 values, the experimental results of MB and MO dye adsorption onto GO were fitted using the Freundlich isotherm model. This indicates the formation of MB and MO multilayers on the GO surface.65 The estimated maximum adsorption capacities of MB and MO dyes onto GO were 105.72 and 80.92 mg g−1, respectively. On the other hand, the adsorption of MB and MO onto ZIF-8, ZIF-8@0.1GO, and ZIF-8@0.5GO fitted better with the Langmuir model. These results indicate the formation of a monolayer of dye molecules on the surface of these adsorbents. Hence, the adsorbent surface was homogeneous. As listed in Table 2, the estimated KL values for MO adsorption onto all prepared adsorbents are higher than those estimated for the adsorption of MB dye. This demonstrates that the interactions of the prepared adsorbents with MO dye molecules are more stable than those with MB dye molecules. The estimated maximum MB adsorption capacities of ZIF-8, ZIF-8@0.1GO, and ZIF-8@0.5GO were 66.97, 78.42, and 87.39 mg g−1, respectively. On the other hand, the maximum MO adsorption capacities of ZIF-8, ZIF-8@0.1GO, and ZIF-8@0.5GO were 65.72, 72.74, and 82.78 mg g−1, respectively. The higher adsorption capacity of the ZIF-8@GO composites than that of pristine ZIF-8 can be assigned to the synergistic effect of the higher surface area provided by GO and the porous structure of ZIF-8.
 |
| | Fig. 11 The experimental data and the non-linear isotherm models for the adsorption of MB dye onto (a) GO, (b) ZIF-8, (c) ZIF-8@0.1GO, and (d) ZIF-8@0.5GO composites. | |
 |
| | Fig. 12 The experimental data and the non-linear isotherm models for the adsorption of MO dye onto (a) GO, (b) ZIF-8, (c) ZIF-8@0.1GO, and (d) ZIF-8@0.5GO composites. | |
Table 2 Kinetic parameters estimated from the non-linear isotherm models for the adsorption of MB and MO dyes
| Isotherm model |
Langmuir |
Freundlich |
| Kinetic parameters |
qe (mg g−1) |
KL (L mg−1) |
R2 |
X2 |
Kf (L g−1) |
1/n |
R2 |
X2 |
| GO |
MB |
105.72 |
0.046 |
0.891 |
82.80 |
14.91 |
0.394 |
0.946 |
41.35 |
| MO |
80.92 |
0.075 |
0.976 |
12.27 |
14.93 |
0.352 |
0.976 |
12.13 |
| ZIF-8 |
MB |
66.97 |
0.016 |
0.965 |
6.94 |
3.62 |
0.521 |
0.937 |
12.64 |
| MO |
65.72 |
0.028 |
0.997 |
0.666 |
6.08 |
0.446 |
0.948 |
12.73 |
| ZIF-8@0.1GO |
MB |
78.42 |
0.030 |
0.954 |
24.56 |
8.380 |
0.450 |
0.939 |
27.50 |
| MO |
72.74 |
0.043 |
0.997 |
1.18 |
9.511 |
0.399 |
0.957 |
14.899 |
| ZIF-8@0.5GO |
MB |
87.39 |
0.07 |
0.962 |
22.45 |
15.60 |
0.354 |
0.9304 |
40.92 |
| MO |
82.78 |
0.119 |
0.984 |
13.18 |
18.82 |
0.289 |
0.962 |
17.09 |
3.2.7 Effect of temperature and thermodynamics. The impact of temperature on the adsorption of MB and MO dyes by GO, ZIF-8, ZIF-8@0.1GO, and ZIF-8@0.5GO was examined at four distinct temperatures of 20, 40, 60, and 80 °C. According to the results shown in Fig. 13(a) and (b), the MB and MO dye removal efficiency was enhanced by increasing the temperature from 20 to 80 °C, which indicates that the adsorption mechanism is endothermic.66 The main reason for the enhanced adsorption with increasing solution temperature is the heating of the active sites of the adsorbents, which strengthens the bonding between the adsorbate molecules and the adsorbent surface. This also confirms that the adsorption mechanism involves a chemical processes.
 |
| | Fig. 13 (a) and (b) Effect of temperature on the removal of MB and MO dyes [adsorbent dose = 2 g L−1, C0 = 50 mg L−1, pH of 8 for MB, and 5.5 for MO]. (c) and (d) Van't Hoff plots for the adsorption of MB and MO dyes onto GO, ZIF-8, ZIF-8@0.1GO, and ZIF-8@0.5GO. | |
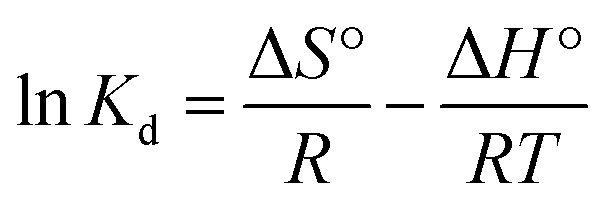
The related thermodynamic parameters, namely the change in Gibbs free energy (ΔG°), enthalpy (ΔH°), and entropy (ΔS°), were estimated by applying Van't Hoff plots.66
| |
 | (8) |
| | |
ΔG° = −RTlnKd
| (10) |
where Δ
S° (J mol
−1 K
−1), Δ
G° (kJ mol
−1), and Δ
H° (kJ mol
−1) represent the changes in entropy, Gibbs free energy, and enthalpy, respectively.
T is the adsorption temperature (Kelvin),
R is the gas constant (8.3145 J mol
−1 K
−1), and
Kd (
Qe/
Ce) is the change in kinetic energy.
The numerical values of ΔH°, ΔS°, and ΔG° were estimated from the slope and intercept of the linear Van't Hoff plots of lnKd vs. 1/T (Fig. 13c and d). The estimated thermodynamic parameters (ΔH°, ΔS°, and ΔG°) are listed in Table 3. The negative values of ΔG° for the MB and MO adsorption processes suggest spontaneous and thermodynamically favorable adsorption.67 In contrast, the positive ΔS° values indicate an increase in randomness and disorder at the liquid–solid interface during the adsorption process.68 The positive values of ΔH° denote the endothermic nature of the adsorption process. In addition, the ΔH° values of MB and MO adsorption on the ZIF-8@0.1GO and ZIF-8@0.5GO composites were greater than those for adsorption on pristine ZIF-8. This indicates stronger interactions of MB and MO dyes with the ZIF-8@GO composites.69
Table 3 Thermodynamic parameters for the adsorption of MB and MO dyes
| Adsorbents |
Dye |
ΔH° (kJ mol−1) |
ΔS° (J mol−1 K−1) |
ΔG° (kJ mol−1) |
| 293 |
313 |
333 |
353 |
| GO |
MB |
30.81 |
127.20 |
−37.26 |
−39.80 |
−42.35 |
−44.89 |
| MO |
27.56 |
14.26 |
−4.15 |
−4.44 |
−4.72 |
−5.00 |
| ZIF-8 |
MB |
14.72 |
42.07 |
−12.32 |
−13.16 |
−14.00 |
−14.84 |
| MO |
5.64 |
28.09 |
−8.23 |
−8.79 |
−9.35 |
−9.92 |
| ZIF-8@0.1GO |
MB |
26.40 |
93.18 |
−27.29 |
−29.15 |
−31.02 |
−32.88 |
| MO |
6.02 |
38.84 |
−11.38 |
−12.16 |
−12.93 |
−13.71 |
| ZIF-8@0.5GO |
MB |
14.54 |
70.68 |
−20.70 |
−22.18 |
−23.53 |
−24.94 |
| MO |
33.57 |
134.49 |
−39.39 |
−42.08 |
−44.77 |
−47.46 |
4 Conclusions
In conclusion, ZIF-8@xGO composites were synthesized by a simple one-step process at room temperature and utilized for removing cationic and anionic dyes from aqueous solutions. The adsorption efficiency of ZIF-8 toward cationic MB dye and anionic MO dye from their aqueous solutions significantly improved with the introduction of GO nanosheets due to the synergistic effects of ZIF-8 crystals and GO nanosheets. The kinetic study confirmed that the adsorption of MB and MO dyes onto the ZIF-8@xGO composites fitted the pseudo-first and pseudo-second-order kinetic models, respectively. The adsorption of MB and MO dyes onto the ZIF-8@xGO composites could be fitted to the Langmuir model, which confirms the occurrence of chemical adsorption processes. The estimated maximum adsorption capacities of ZIF-8@0.5GO for MB (87.39 mg g−1) and MO (82.78 mg g−1) dyes were close to those achieved by GO. The thermodynamic study confirmed that the adsorption of MB and MO dyes is a spontaneous and thermodynamically favorable process. These findings demonstrate the possibility of employing ZIF-8@GO materials to recover organic dyes from aqueous solutions.
Data availability
All data relevant to our study have been included in the main manuscript.
Conflicts of interest
There are no conflicts to declare.
References
- A. Elaouni, M. El Ouardi, M. Zbair, A. BaQais, M. Saadi and H. Ait Ahsaine, RSC Adv., 2022, 12, 31801–31817 RSC.
- H. A. Abdelmonem, T. F. Hassanein, H. E. Sharafeldin, H. Gomaa, A. S. A. Ahmed, A. M. Abdel-lateef, E. M. Allam, M. F. Cheira, M. E. Eissa and A. H. Tilp, Colloids Surf., A, 2024, 684, 133081 CrossRef CAS.
- S. Dutta, B. Gupta, S. K. Srivastava and A. K. Gupta, Mater. Adv., 2021, 2, 4497–4531 RSC.
- N. Thi Tuyet Nhi, N. Thi Mai Tho and N. Thi Hong Anh, Green Chem. Lett. Rev., 2024, 17, 2377555 CrossRef.
- P. Vatani, M. Aliannezhadi and F. Shariatmadar Tehrani, Sci. Rep., 2024, 14, 15434 CrossRef CAS PubMed.
- H.-Y. Sun, Y.-J. Gao, J.-L. Li, Y.-M. Zou, M.-L. Feng and X.-Y. Huang, ChemistrySelect, 2022, 7, e202203826 CrossRef CAS.
- F. N. Türk, H. Çiftçi and H. Arslanoğlu, Sugar Tech, 2023, 25, 569–579 CrossRef.
- F. McYotto, Q. Wei, D. K. Macharia, M. Huang, C. Shen and C. W. K. Chow, Chem. Eng. J., 2021, 405, 126674 CrossRef CAS.
- M.-X. Zhu, L. Lee, H.-H. Wang and Z. Wang, J. Hazard. Mater., 2007, 149, 735–741 CrossRef CAS PubMed.
- P. V. Nidheesh, M. Zhou and M. A. Oturan, Chemosphere, 2018, 197, 210–227 CrossRef CAS PubMed.
- L. Li, Y. Zhong, Y. Hu, J. Bai, F. Qiao, A. S. A. Ahmed, G. Ali, X. Zhao and Y. Xie, CrystEngComm, 2023, 25, 4355–4363 RSC.
- T. F. Nelson, R. Baumgartner, M. Jaggi, S. M. Bernasconi, G. Battagliarin, C. Sinkel, A. Künkel, H.-P. E. Kohler, K. McNeill and M. Sander, Nat. Commun., 2022, 13, 5691 CrossRef CAS PubMed.
- A. Yanyan, Z. Huaili, Y. Zhishuang, S. Yongjun, W. Yili, Z. Chun and D. Wei, J. Hazard. Mater., 2020, 381, 120971 CrossRef PubMed.
- S. Shameran Jamal, S. Aram and A. Sewgil Saaduldeen, Heliyon, 2022, 8, e10092 CrossRef PubMed.
- N. Ullah, Z. Ali, A. S. Khan, B. Adalat, A. Nasrullah and S. B. Khan, RSC Adv., 2024, 14, 211–221 RSC.
- N. U. M. Nizam, M. M. Hanafiah, E. Mahmoudi, A. A. Halim and A. W. Mohammad, Sci. Rep., 2021, 11, 8623 CrossRef CAS PubMed.
- N. S. M. Sayed, A. S. A. Ahmed, M. H. Abdallah and G. A. Gouda, Sci. Rep., 2024, 14, 5384 CrossRef CAS PubMed.
- M. Andrade-Guel, C. Cabello-Alvarado, P. Bartolo-Pérez, D. I. Medellin-Banda, C. A. Ávila-Orta, B. Cruz-Ortiz, A. Espinosa-Muñoz and G. Cadenas Pliego, RSC Adv., 2022, 12, 28494–28504 RSC.
- A. Torabinejad, N. Nasirizadeh, M. E. Yazdanshenas and H.-A. Tayebi, J. Nanostruct. Chem., 2017, 7, 217–229 CrossRef CAS.
- A. Alhujaily, H. Yu, X. Zhang and F. Ma, Appl. Water Sci., 2020, 10, 183 CrossRef CAS.
- H. Furukawa, K. E. Cordova, M. O'Keeffe and O. M. Yaghi, Science, 2013, 341, 1230444 CrossRef PubMed.
- D. Zhao, X. Wang, L. Yue, Y. He and B. Chen, Chem. Commun., 2022, 58, 11059–11078 RSC.
- J. W. Maina, C. Pozo-Gonzalo, L. Kong, J. Schütz, M. Hill and L. F. Dumée, Mater. Horiz., 2017, 4, 345–361 RSC.
- A. S. A. Ahmed, W. Xiang, I. Saana Amiinu and X. Zhao, New J. Chem., 2018, 42, 17303–17310 RSC.
- A. S. A. Ahmed, W. Xiang, F. Shui, B. Li, H. H. A. Younes, I. S. Amiinu and X. Zhao, Sol. Energy, 2021, 218, 117–128 CrossRef CAS.
- H. Kaur, N. Devi, S. S. Siwal, W. F. Alsanie, M. K. Thakur and V. K. Thakur, ACS Omega, 2023, 8, 9004–9030 CrossRef CAS PubMed.
- X. Dong, Y. Lin, Y. Ma and L. Zhao, RSC Adv., 2019, 9, 27674–27683 RSC.
- B. Luan Tran, H.-Y. Chin, B. K. Chang and A. S. T. Chiang, Microporous Mesoporous Mater., 2019, 277, 149–153 CrossRef CAS.
- X.-q. Cao, X. Wang, M. Chen, F. Xiao, Y.-m. Huang and X.-j. Lyu, Sep. Purif. Technol., 2021, 260, 118062 CrossRef CAS.
- X. Tong, J. Zhang, Q. Chen and H. Liu, New J. Chem., 2021, 45, 19416–19424 RSC.
- M. A. Nazir, T. Najam, K. Shahzad, M. A. Wattoo, T. Hussain, M. K. Tufail, S. S. A. Shah and A. u. Rehman, Surf. Interfaces, 2022, 34, 102324 CrossRef CAS.
- Y. Li, P. Xiang, H. Chen and Y. Zhou, J. Solid State Chem., 2022, 315, 123538 CrossRef CAS.
- K. Mirzaei, A. Mohammadi, E. Jafarpour, A. Shojaei and A. L. Moghaddam, J. Water Proc. Eng., 2022, 50, 103254 CrossRef.
- D. Tuncel and A. N. Ökte, Catal. Today, 2021, 361, 191–197 CrossRef CAS.
- K. Kida, M. Okita, K. Fujita, S. Tanaka and Y. Miyake, CrystEngComm, 2013, 15, 1794–1801 RSC.
- W. S. Hummers Jr and R. E. Offeman, J. Am. Chem. Soc., 1958, 80, 1339 CrossRef.
- A. R. Putra Hidayat, L. L. Zulfa, A. R. Widyanto, R. Abdullah, Y. Kusumawati and R. Ediati, RSC Adv., 2023, 13, 12320–12343 RSC.
- Y. Mu, B. Chen, H. Zhang, M. Fei, T. Liu, N. Mehta, D. Z. Wang, A. J. M. Miller, P. L. Diaconescu and D. Wang, J. Am. Chem. Soc., 2024, 146, 13438–13444 CrossRef CAS PubMed.
- J. Tang, R. R. Salunkhe, J. Liu, N. L. Torad, M. Imura, S. Furukawa and Y. Yamauchi, J. Am. Chem. Soc., 2015, 137, 1572–1580 CrossRef CAS PubMed.
- A. Subhadarshini, S. K. Samal, A. Pattnaik and B. Nanda, RSC
Adv., 2023, 13, 31756–31771 RSC.
- B. Lee, D. B. Buchholz and R. P. H. Chang, Energy Environ. Sci., 2012, 5, 6941 RSC.
- N. Chen, D. Hu, Y. Wang, L. Tan, F. Zhang and H. Feng, J. Solid State Electrochem., 2019, 23, 1851–1860 CrossRef CAS.
- Y. Hu, H. Kazemian, S. Rohani, Y. Huang and Y. Song, Chem. Commun., 2011, 47, 12694–12696 RSC.
- Y. Hu, Z. Liu, J. Xu, Y. Huang and Y. Song, J. Am. Chem. Soc., 2013, 135, 9287–9290 CrossRef CAS PubMed.
- J. Ran, H. Chen, S. Bi, Q. Guo, Z. Deng, G. Cai, D. Cheng, X. Tang and X. Wang, Cellulose, 2020, 27, 10447–10459 CrossRef CAS.
- T. F. Emiru and D. W. Ayele, Egypt. J. Basic Appl. Sci., 2017, 4, 74–79 Search PubMed.
- J. Shen, A. Liu, Y. Tu, G. Foo, C. Yeo, M. B. Chan-Park, R. Jiang and Y. Chen, Energy Environ. Sci., 2011, 4, 4220–4229 RSC.
- M. A. El-Nemr, M. A. Hassaan and I. Ashour, Sci. Rep., 2023, 13, 11556 CrossRef CAS PubMed.
- S. Wong, N. A. Ghafar, N. Ngadi, F. A. Razmi, I. M. Inuwa, R. Mat and N. A. S. Amin, Sci. Rep., 2020, 10, 2928 CrossRef CAS PubMed.
- D. Pandey, A. Daverey, K. Dutta, V. K. Yata and K. Arunachalam, Environ. Technol. Innovation, 2022, 25, 102200 CrossRef CAS.
- S. Alhawtali, M. El-Harbawi, A. S. Al-Awadi, L. El Blidi, M. M. Alrashed and C.-Y. Yin, Coatings, 2023, 13(7), 1287 CrossRef CAS.
- Z. Zheng, Q. Liu and F. Wang, SN Appl. Sci., 2021, 3, 111 CrossRef CAS.
- Z. Li, M. Ma, S. Zhang, Z. Zhang, L. Zhou, J. Yun and R. Liu, J. Porous Mater., 2020, 27, 189–204 CrossRef CAS.
- Y. Liu, C. Luo, J. Sun, H. Li, Z. Sun and S. Yan, J. Mater. Chem. A, 2015, 3, 5674–5682 RSC.
- S. J. Olusegun and N. D. S. Mohallem, Environ. Pollut., 2020, 260, 114019 CrossRef CAS PubMed.
- T. Maneerung, J. Liew, Y. Dai, S. Kawi, C. Chong and C. H. Wang, Bioresour. Technol., 2016, 200, 350–359 CrossRef CAS PubMed.
- E. M. Ahmed, H. Isawi, M. Morsy, M. H. Hemida and H. Moustafa, Surf. Interfaces, 2023, 39, 102980 CrossRef CAS.
- H. Y. Zhu, R. Jiang, L. Xiao and G. M. Zeng, Bioresour. Technol., 2010, 101, 5063–5069 CrossRef CAS PubMed.
- S. Mallakpour and M. Naghdi, New J. Chem., 2020, 44, 6510–6523 RSC.
- C. G. Ramos, S. A. Sousa, A. M. Grilo, J. R. Feliciano and J. H. Leitão, J. Bacteriol., 2014, 196, 3980 CrossRef CAS PubMed.
- A. Denizli, R. Say and Y. Arica, Sep. Purif. Technol., 2000, 21, 181–190 CrossRef CAS.
- A. Ozcan, E. M. Oncü and A. S. Ozcan, J. Hazard. Mater., 2006, 129, 244–252 CrossRef PubMed.
- R. Sunil, S. Virendra Kumar, P. Avdesh Singh, N. Mohit and R. Kuldeep, Curr. Res. Green Sustainable Chem., 2021, 4, 100180 CrossRef.
- I. Langmuir, J. Am. Chem. Soc., 1918, 40, 1361–1403 CrossRef CAS.
- R. Askari, F. Mohammadi, A. Moharrami, S. Afshin, Y. Rashtbari, M. Vosoughi and A. Dargahi, Appl. Water Sci., 2023, 13, 90 CrossRef CAS.
- R. H. Althomali, K. A. Alamry, M. A. Hussein and R. M. Guedes, RSC Adv., 2023, 13, 4303–4313 RSC.
- S. S. Hosseini, A. Hamadi, R. Foroutan, S. J. Peighambardoust and B. Ramavandi, J. Water Proc. Eng., 2022, 48, 102911 CrossRef.
- M. A. Usman and A. Y. Khan, J. Hazard. Mater., 2022, 428, 128238 CrossRef CAS PubMed.
- M. Kasraee, M. H. Dehghani, F. Hamidi, N. M. Mubarak, R. R. Karri, N. Rajamohan and N. H. Solangi, Sci. Rep., 2023, 13, 13833 CrossRef CAS PubMed.
|
| This journal is © The Royal Society of Chemistry 2025 |
Click here to see how this site uses Cookies. View our privacy policy here. 
 Open Access Article
 This Open Access Article is licensed under a Creative Commons Attribution-Non Commercial 3.0 Unported Licence
 *
*