
 Open Access Article
 This Open Access Article is licensed under a
 Creative Commons Attribution 3.0 Unported Licence
Lithium phthalocyanine (γ-structure) as a molecular oxygen sensor†
Elena Tomsik a,
Zulfiya Cernochova*a,
Magdalena Scheibeb and
Krzysztof Tadyszak*a
a,
Zulfiya Cernochova*a,
Magdalena Scheibeb and
Krzysztof Tadyszak*a
aInstitute of Macromolecular Chemistry, Czech Academy of Sciences, Prague, Czech Republic. E-mail: tadyszak@imc.cas.cz; cernochova@imc.cas.cz
bJ. Heyrovsky Institute of Physical Chemistry, Czech Academy of Sciences, Prague, Czech Republic
First published on 5th February 2025
Abstract
Synthesis and characterization of lithium phthalocyanine radicals were performed, which were followed by an investigation on its ability to detect oxygen levels in biologically relevant concentrations. EPR studies confirmed the presence of at least two phases, one sensitive to oxygenation (γ-phase) and the second one insensitive to oxygenation (α-phase). Contrary to the findings reported in the literature, it was observed that the γ-phase was not stable at and above 95 °C and slowly transformed into the α-phase crystallographic structure. Above 150 °C, only a broad signal of α-phase existed. Additional characterizations were performed using electrochemical impedance spectroscopy (EIS), cyclic voltammetry, dynamic light scattering (DLS), and Raman spectroscopy on pristine crystals Li2Pc and LiPc sensors.
Introduction
Changing oxygen levels in the body can be a marker of many diseases, e.g., inflammatory processes and tumor formation.1 Applied treatments are also dependent on the oxygenation levels of the treated region. Hence, oxygen sensors are essential for biological studies in various tissues, tumors, 3D cell cultures, and single cells.1,2 Sensors applying electron paramagnetic resonance as a method of choice for radical detection3,4 and oximetry5 would be beneficial for bio/medical fields. Lithium phthalocyanine sensors are semiconducting microcrystalline sensors with the unique feature of a narrow peak-to-peak linewidth without oxygen that varies slightly as reported in the literature, e.g., 10–70 mG.2,6–10 A very narrow signal in the EPR allowed the detection of a small quantity of material (spin concentration N = 9.2 × 10¹⁹ spins per g,2 0.1–0.05 spins per molecule10,11). Hence, it is helpful as a sensor in EPR and NMR magnetometry.12–14 Magnetometers based on LiPc microcrystals are two orders more sensitive than Hall-probe magnetometers.15 These sensors can be a part of larger projects and microfluidic systems, e.g., EPR-on-a-Chip16 and additional sensors for Oxy-chip.17 Even though LiPc can detect NO* radicals, it could not determine their in vivo levels (1–10 nM) in the presence of physiological concentrations of O2.18The π-electron neutral radical of lithium phthalocyanine – LiPc (S = 1/2) derived from dilithium phthalocyanine (Li2Pc) is insoluble in water semiconductors in its crystalline phase.19 This compound can crystallize in various crystalline phases, α, β, and γ (also called x-phase), which show different properties (conductivity and magnetism, where α and β phases are ferromagnetic and antiferromagnetic, respectively). Their linewidths are in the ranges of ΔB1/2α = 1−1.5G; ΔB1/2β = 0.8−1G;7 ΔB1/2γ = ∼0.01–0.6G,18 oxygen sensitive is only the γ-phase .6,7,18 LiPc is a chemically stable system in the temperature range of 0–200 °C;7 however, between the temperature range of 125–175 °C, both α and β phases coexist in various proportions.7 Literature shows that the γ-phase is stable up to 150 °C,6,20 and together with other parameters, it is a good sensor candidate for biology21,22 and medicine.23–25 It shows the following superior properties: (i) sensitivity to oxygen (5 G bar−1 (ref. 7)) owing to the presence of channels in which the dioxygen molecules can migrate; (ii) a substantial overlap between consecutive LiPc molecules in a stack and a very efficient spin diffusion revealed by a very narrow EPR line (ΔBpp < 20 mG); (iii) O2 molecules interact only magnetically and not chemically with LiPc* and this process is reversible and shows linear concentration dependence in a broad range; (iv) biocompatible and stable in biological conditions for months, which makes them an ideal system for long-period oxygen level monitoring.7,10,20,26
In the most straightforward model, molecular oxygen has two unpaired spins (S = 1) in the ground state, creating a magnetic field around itself. Oxygen sensing is based on detecting magnetic field fluctuations caused by O2 molecules. These fluctuations cause a broadening of the EPR line, which can be quantified according to oxygen concentration. This dependence is linear (5 G bar−1 (ref. 7)) for biological oxygen concentrations, e.g., ΔB = 14 mG for 0% O2, and goes up to 1 G for 160 mmHg (21.3 kPa)2 (varies between the crystals).
The current work was initiated with the following goals: (1) synthesis of lithium phthalocyanine radicals with controlled morphology; (2) it was proved that γ-phase is unstable in and above 95 °C and slowly transforms into α-phase; (3) extensive characterization of LiPc radicals by Raman spectroscopy, dynamic light scattering and zeta potential measurement, cyclic voltammetry and electrochemical impedance spectroscopy, and EPR line-shape analysis; (4) evaluation of LiPc crystals ability to detect oxygen level at biological relevant concentrations.
Experimental
Synthesis
Lithium phthalocyanine γ crystallographic structure (γ-LiPc, Fig. 1c and d) was obtained by electrochemical synthesis from dilithium phthalocyanine. Li2Pc (50 mg, Fig. 1a) was dissolved in 30 ml DMSO using ultrasonication (15 min). Then, the solution was dried and once again dissolved in 30 ml of dried acetonitrile (Fig. 1b) without the addition of tetrabutylammonium perchlorate (TBAP),19,27 or tetraethylammonium perchlorate (TEAP)28 as mentioned in the literature previously. The setup consisted of two platinum electrodes, 4 cm2 each, separated by a Teflon layer. Before synthesis, platinum electrodes and a Teflon separator were immersed in a 65% nitric acid solution for 30 minutes, after which they were rinsed with water and acetone, dried, and used for synthesis. Electrosynthesis was performed overnight without stirring at room temperature (12 h) at 0.5 V (OWON ODP3031 Power Supply). After synthesis, a thin layer of crystals appeared on the positively polarized electrode. The electrode was washed with water, and crystals were collected with cotton and placed in a quartz X-band EPR tube. After multiple syntheses, the minimum linewidth peak-to-peak for 0% O2 was in the 35–65 mG range for various samples. Samples were continuously measured at a standard pressure of 101![[thin space (1/6-em)]](https://www.rsc.org/images/entities/char_2009.gif) 325 Pa in various gas mixtures, air, and O2/N2 mixtures. Conversion from oxygen partial pressure in mmHg to % is as follows: 21% O2 is 21278.25 Pa (159.6 mmHg).
325 Pa in various gas mixtures, air, and O2/N2 mixtures. Conversion from oxygen partial pressure in mmHg to % is as follows: 21% O2 is 21278.25 Pa (159.6 mmHg).
 | ||
| Fig. 1 (a) Chemical structure of dilithium phthalocyanine–Li2Pc; (b) diluted Li2Pc in acetonitrile; (c) chemical structure of lithium phthalocyanine – LiPc; (d) platinum electrodes with LiPc (black layer) on one of them; (e) SEM image of γ-LiPc – scale 10 μm, inset – crystal width statistic; and (f) SEM image of LiPc – scale 50 μm, inset – crystal length statistics. | ||
Electron paramagnetic resonance (EPR)
The EPR measurements were conducted with a Bruker ELEXSYS 540 X-band spectrometer with a 049× microwave bridge (Super X) and a Bruker ER4108 TMHS slim design resonator. The following EPR spectrometer settings were applied for the experiments: case 0% O2-narrowest EPR line-microwave power: 20.17 μW (40 dB), modulation amplitude 0.01 G; modulation frequency: 10 kHz; the time constant: 5.12 ms; conversion time: 20.48 ms; gain: 55 dB; the number of points: 2048, temperature 294 K, 1 accumulation; case ≥21% O2-parameters were as follows: microwave power: 2.012 mW (20 dB), modulation amplitude 0.1 G, gain: 60 dB (other parameters identical). The g-factor of the internal standard Al2O3:Cr3+ placed at the second resonator's entry was calibrated by comparison with DPPH radical (g = 2.0036). The internal standard remained in the resonator during all the measurements.Electrochemical deposition of LiPc film
The LiPc film was electrochemically deposited using Metrohm® AUTOLAB Potentiostat/Galvanostat PGSTAT302N with a frequency analyzer FRA32M module controlled by the software NOVA 2.1.4., at the Pt electrode by a cyclic voltammetry method in a three-electrode cell configuration. The Li2Pc was dissolved in dried acetonitrile. Two potential windows were applied: (a) from −0.3 to 1.2 V vs. Ag/AgCl wire and (b) from −0.2 to 1 V vs. Ag/AgCl wire. The nitrogen gas was purged above the solution to protect it from oxygen dissolution. 500 cycles were conducted with a scan rate of 50 mV s−1.Cyclic voltammetry measurement of LiPc film
The electrodes were characterized in three-electrode cell configurations. All measurements were done at room temperature. A Pt sheet was employed for the counter electrode, and Ag/AgCl (3 M KCl) was used for the reference electrode. Cyclic voltammetry was conducted in acetonitrile with tetrabutylammonium perchlorate solution between −0.2 and 0.9 V versus an Ag/AgCl reference electrode with scan rates from 10 and/or 150 mV s−1.Electrochemical impedance spectroscopy (EIS)
A Metrohm® AUTOLAB Potentiostat/Galvanostat PGSTAT302N was used to perform EIS with a frequency analyzer FRA32M module controlled by the software NOVA 2.1.4. In acetonitrile with tetrabutylammonium perchlorate solution at the open circuit potential (OCP) over a 100 kHz to 0.01 Hz frequency range with 5 mV amplitude. The equivalent circuit analysis was completed, and the chi-square (χ2) value points out the divergent regions between the fitted and measured data.Raman spectroscopy
Ambient Raman spectra were recorded using a WITec Alpha300R spectrometer of 600 lines per mm grating equipped with a piezo stage (200 × 200 × 20 μm) and a RayShield Coupler with laser power of 300 μW (532 nm and 633 nm excitation wavelengths) for all measurements. Raman measurements were conducted at room temperature (298 K) under ambient conditions. To prevent photodegradation, the samples were scanned with minimal laser exposure time and low power settings. Lithium phthalocyanine crystals were transferred and measured by exfoliation onto Si/SiO2 wafers. Before using the Si/SiO2 wafers, they were cleaned in the ultrasonic bath for 5 min in EtOH, 5 min in IPA, and then in oxygen plasma for 1 min. The Raman bands were assigned based on previous literature and confirmed by comparison with standard spectra of phthalocyanines.Dynamic light scattering (DLS) and zeta potential measurements (ζ)
We measured the intensity-weighted hydrodynamic radius (RH) and scattering intensity and z of the lithium phthalocyanine particles in the water solution on a Zetasizer NanoZS instrument, model ZEN3600 (Malvern Instruments, Malvern, UK) at the temperatures of 25 °C and 37 °C.29 RH was measured at a scattering angle of θ = 173°, and the data were processed with the Malvern software.30 The surface zeta potential of silica was measured using a Malvern ZEN1020 surface zeta potential cell. The cell consists of a sample barrel with adjustable height, where the sample is placed on a holder and held between two electrodes made of palladium. A series of measurements of the zeta potential was then performed in a standard cuvette, and the position of the measurement was controlled by adjusting the height of the sample holder. Lithium phthalocyanine particles of a particular type were used as tracer particles for appropriate lithium phthalocyanine crystals layer glued into the copper surface (thickness 0.3 mm). The zeta potential data were evaluated using the Smoluchowski model.31,32Results and discussion
According to the literature data, a multi-phase composition of the LiPc crystals is usually obtained in one batch. However, one of the goals of the current work is to synthesize only the γ-phase crystallographic structure due to its oxygen sensitivity, in contrast to the non-sensitive α-phase. The β-phase appears after heating the α-phase crystals above 400 °C,7 a conditions which is not followed in this work. Reducing potentials are usually in the range of 0.05–0.75 V.28 Furthermore, it was suggested that the oxygen must be removed from the solution before synthesis. However, we found no benefits of this additional step. This work utilizes EPR spectroscopy as the primary method of evaluating synthesis outcomes and sensor quantification. Due to its sensitivity and resolution, it is possible to study small powder quantities obtained after synthesis, which is usually insufficient for powder XRD. Due to the high resolution of EPR spectroscopy, small phase changes can be observed. The minimal EPR linewidth obtained for 0% and 21% O2 are generally good indicators of system purity, and unfortunately, both can enormously vary from synthesis to synthesis. We performed electrochemical synthesis using two platinum electrodes of ca. 2 cm2 each at 0.5 V overnight-12 h in ambient conditions (Fig. 1a–d). The dilithium phthalocyanine dissolved in acetonitrile is of blue color (Fig. 1b), which dilutes/fades during the crystal growth on the positively polarized electrode (Fig. 1d, black crystals). The SEM micrographs presented in Fig. 1e and f show needle-type crystals, as mentioned in the literature.12,19,20,33 Statistical analysis performed over multiple SEM images shows an average crystal length of 2.02 ± 1.06 μm (number of measurements 392, min. 0.42, median 1.76, max. 10.24 μm) while the width on average is 0.41 ± 0.13 μm (number of measurements 480, min. 0.14, median 0.39, max. 0.98 μm). Histograms of this study are shown as insets in the exact figure.Dynamic light scattering
Lithium phthalocyanine microcrystals are intended for biological systems. It is essential to know their electrokinetic parameters. In this study, Li2Pc—original and after-synthesis LiPc crystals were studied. As a tracer particle, the upper part of the water solution was used to add the crystals of Li2PC and LiPc. These quasi-solutions were then centrifuged, and the upper part was collected. Dynamic light scattering (DLS) and zeta potential (ζ) measurements revealed the random Brownian motion in these solutions. The results are shown in Fig. 2. The measurements were performed at room and physiological temperatures (37 °C), as indicated by black squares and red circles, respectively. The morphology of the crystals changes due to the synthetic conditions used for preparation, and one lithium-ion dissolves from the structure. This causes the zeta potential to increase to zero values. Moreover, this trend remains with temperature changes.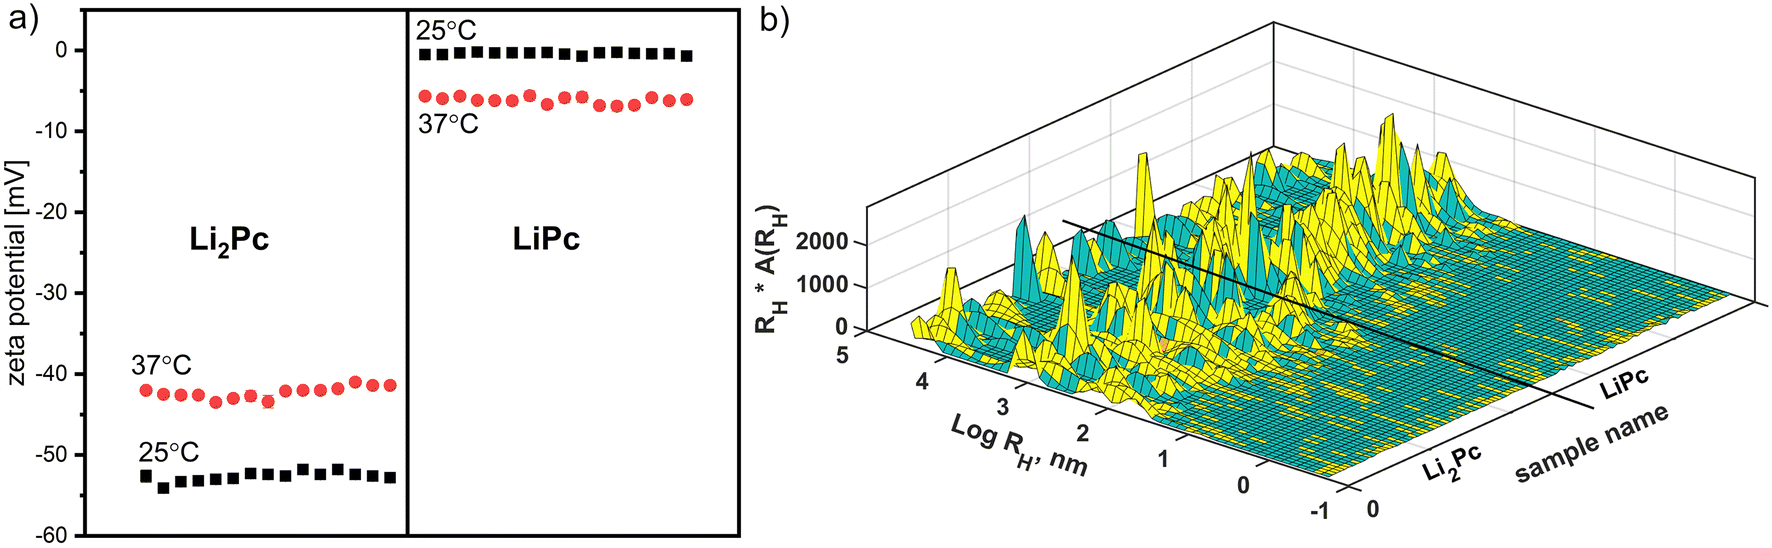 | ||
| Fig. 2 (a) Multiple zeta potential measurements for Li2Pc and LiPc water solutions at 25 °C and 37 °C; (b) repeated DLS measurements for Li2Pc and LiPc samples at 25 °C. | ||
As shown above, the sample with one lithium-ion is more suitable for biosensor applications than Li2Pc, as it has a lower electronic capacity and a lower charge in zeta potential measurements. This suggests that a lower-charged surface would be less irritating to the immune system.
The tracer particle sizes, expressed in Table 1, were measured simultaneously with zeta potential. With increasing temperature, the values of the Li2Pc sample may change slightly due to the self-assembly but remain comparable. The size of the LiPc sample in the tracer solution remains constant. The measurements yielded reproducible and stable results over time, so they were selected for further analysis. Additionally, it can be seen from the table that the conductivity of the water solution was significantly higher in the Li2Pc sample, which may be due to the nature of the dissolved particles.
| Sample | Number mean size RH [nm] | Zeta potential [mV] | Mobility [μm cm V−1 s−1] | Conductivity [mS cm−1] | Surface zeta potential [mV] |
|---|---|---|---|---|---|
| 25 °C | |||||
| Li2Pc | 115.96 ± 16.08 | −52.68 ± 0.58 | −4.02 ± 0.14 | 1.36 ± 0.041 | −53.08 ± 2.37 |
| LiPc | 282.25 ± 80.56 | −0.4 ± 0.16 | −0.026 ± 0.012 | 0.041 ± 0.005 | −2.4 ± 0.61 |
|
|||||
| 37 °C | |||||
| Li2Pc | 310.77 ± 66.61 | −42.27 ± 0.73 | −4.08 ± 0.05 | 1.37 ± 0.03 | −43.59 ± 1.81 |
| LiPc | 266.48 ± 41.59 | −6.15 ± 0.44 | −0.51 ± 0.13 | 0.0755 ± 0.0015 | −7.82 ± 1.52 |
The thickness of the double electrical layer (κ−1) depends on the concentration of the ions in the solution and can be calculated based on the ionic strength of the medium. The greater the ionic strength, the more compact the double layer becomes. The valence of the ions also affects the thickness of the double layer. A divalent ion, such as Li2+, will compress the double layer more than a monovalent ion, such as Li+. As all measured solutions were prepared using deionized water, we would not expect such a high conductivity parameter (Table 1). We also selected smaller particles because the samples were centrifuged, and the upper part was chosen for measurements. Consequently, the samples demonstrated more populations (Fig. 2b). The MATLAB scheme in Fig. 2b presents dynamic light scattering measurements of both samples at room temperature. Sample LiPc showed lower polydispersity than Li2Pc. The latter sample has smaller particles, around 10 nanometers and less. They exhibit faster kinetics and are probably responsible for the higher conductivity of the Li2Pc solution.
The sensitive surface of the biosensor prototype was created by gluing large crystals of a particular type onto a copper plate approximately 0.3 millimeters thick. Since the synthesis of LiPc and Li2Pc crystals was performed on a platinum plate and held well on this surface, we selected the thin metallic plate made from copper for surface zeta potential experiments. The glued layer of lithium phthalocyanine onto the copper surface was black, and the thickness of the plate was slightly changed.
As expected, the surface zeta potential measurement results in Table 1 demonstrate the same trend as the tracer particles. To ensure the correct repulsion between the wall surface and the tracer particles, tiny crystals were used as a tracer solution, and large crystals were held onto the copper surface.
As the tracer solution of Li2Pc showed a high negative zeta potential, the experiment demonstrates that the wall is composed of the sa me type of larger crystals, which are equally charged in the vicinity with experimental accuracy. The lower-charged LiPc particles showed a movement closer to the wall covered with larger LiPc particles, expressed by the appropriate repulsion. With increasing temperature, the surface ζ potential of the LiPc layer decreased to negative values, but the tendency between the two samples remained at higher temperatures.
Raman scattering
LiPc is known for its distinct Raman peaks, which can be used to identify and analyze. The Raman spectrum of LiPc includes several characteristic peaks, particularly in the regions influenced by the vibrations of the phthalocyanine ring and the interactions with the lithium-ion. Some significant Raman peaks for LiPc typically occur in the following areas: in the range of 680–690 cm−1 (C–N–C ring stretching), in the range of 1120–1140 cm−1 (in-plane deformation of the macrocycle), in the range of 1300–1350 cm−1 (C–H bending), in the range of 1500–1600 cm−1 (ring breathing modes). These peaks indicate the structural and vibrational properties of lithium phthalocyanine. They can vary slightly depending on the experimental conditions and the form (thin film or bulk material) in which the LiPc is studied (Fig. 3).34 | ||
| Fig. 3 Horizontal and vertical Raman spectra of γ-LiPc crystals; inset shows an optical microscope image of the crystal. | ||
The characteristic Raman peaks for dihydrogen phthalocyanine (H2Pc) are observed at 1540 cm−1 (CNC group stretch, macrocycle alteration), 1449 cm−1, and 1425 cm−1 (isoindole and pyrrole stretches), 1339 cm−1 (macrocyclic breathing mode), 1141 cm−1 (isoindole breathing mode), 1113 cm−1 (pyrrole breathing mode), 794 cm−1 and 722 cm−1 (macrocycle ring deformation), 681 cm−1 (coordinated nitrogen atoms macro breathing vibration), 231 cm−1 and 132 cm−1 (macrocycle ring deformations).35 These differences reflect the structural and electronic effects of the substituent groups on the phthalocyanine ring (Fig. 3).36
Electron paramagnetic resonance spectroscopy
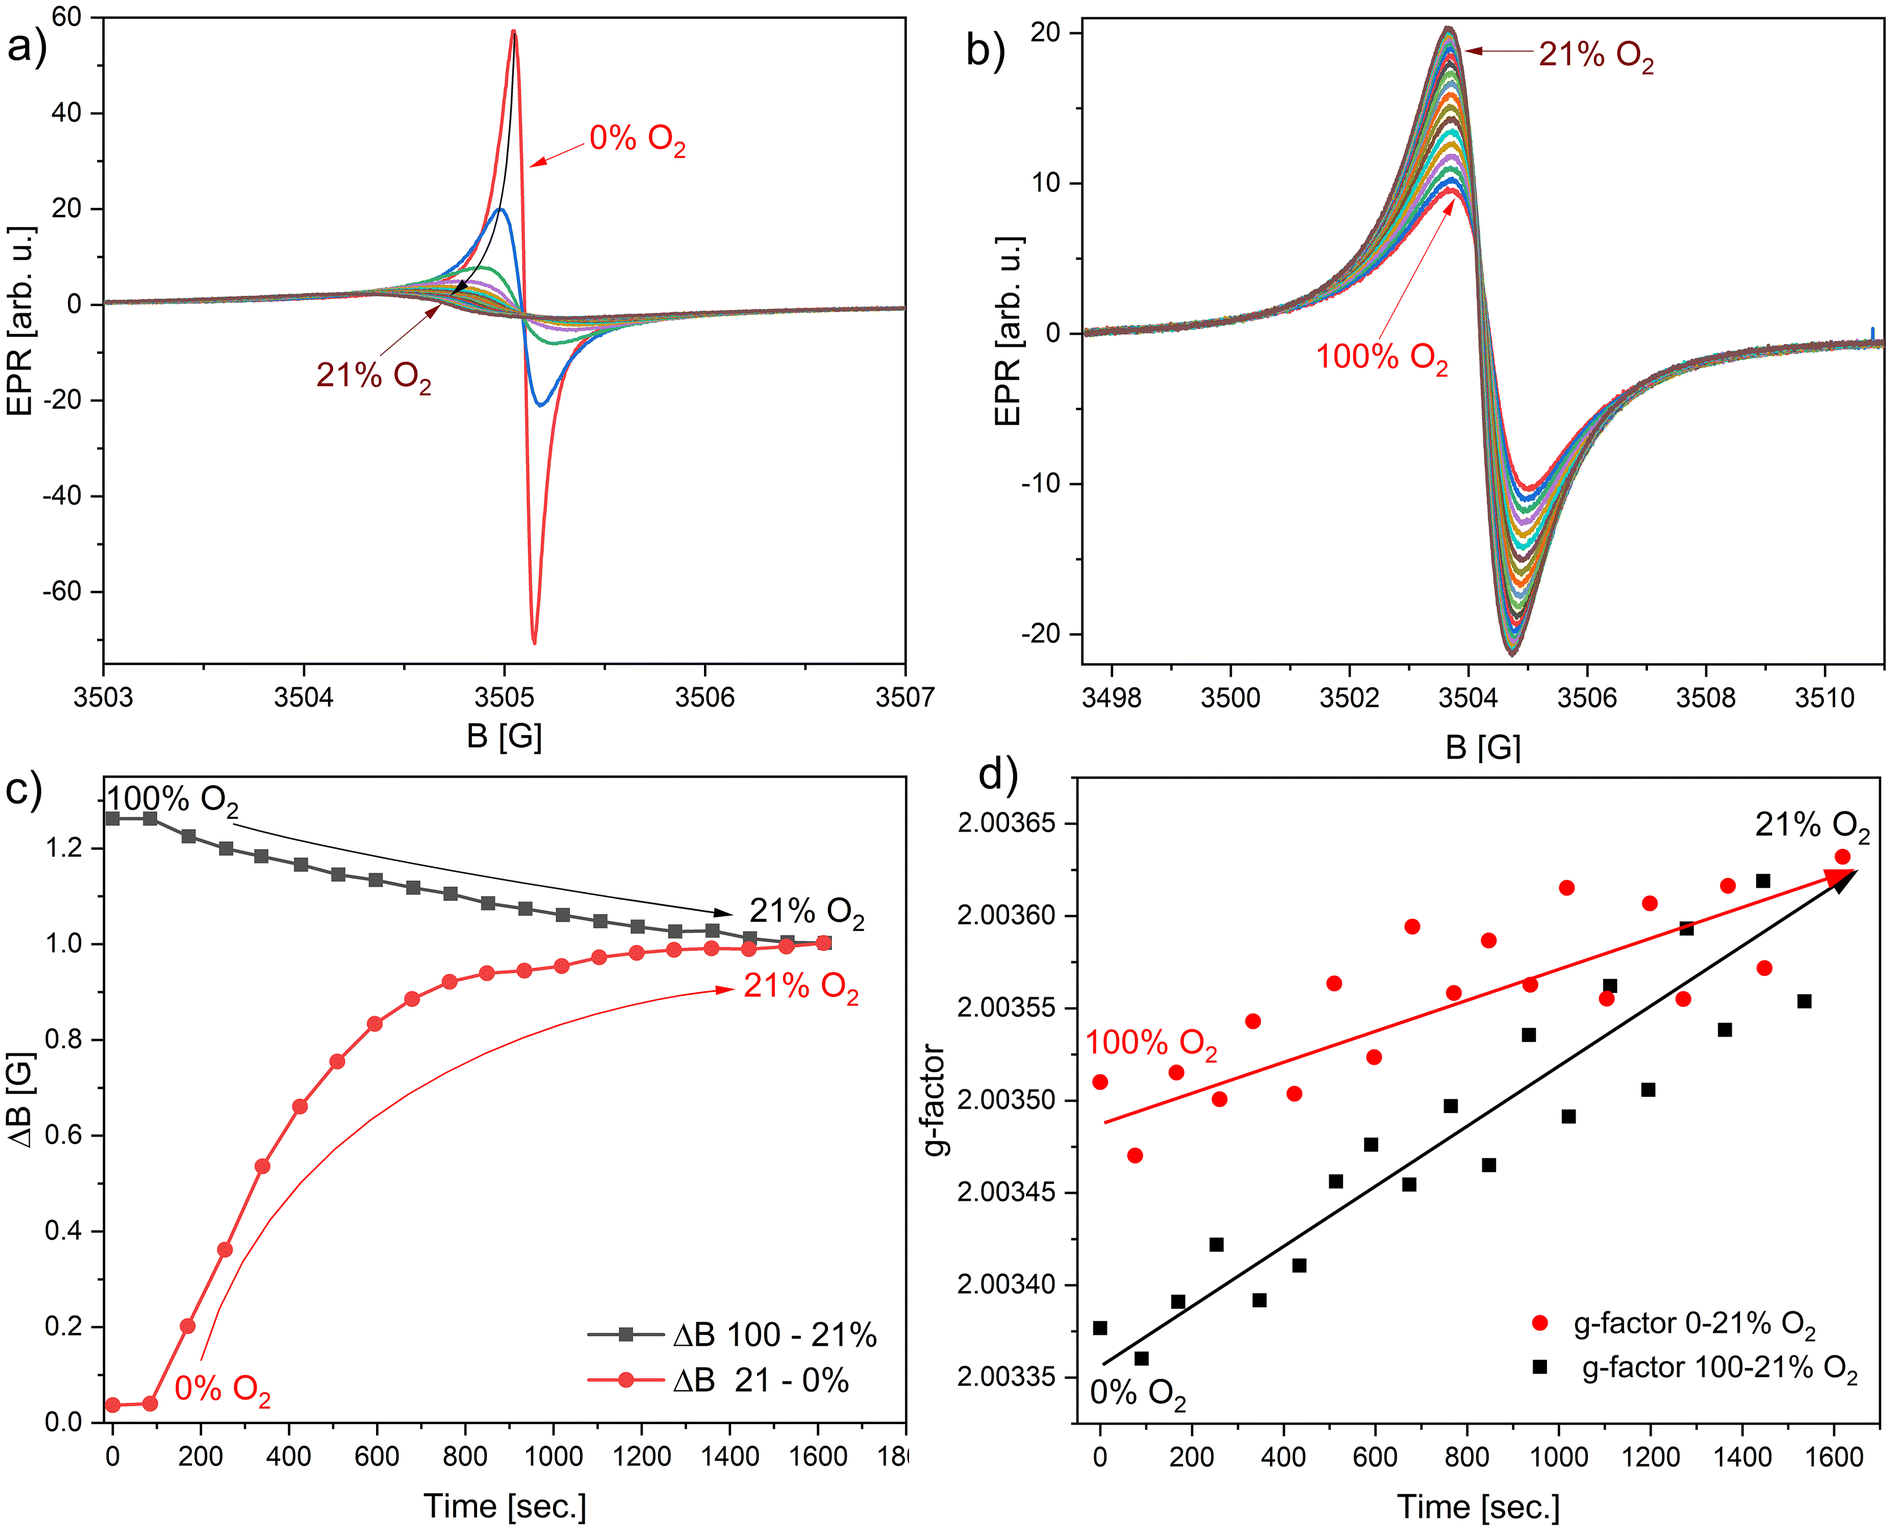
The Smoluchowski equation describes the collision rate (frequency of collisions) between molecular oxygen and LiPc spins, which depends on the diffusion coefficients of both entities, oxygen concentration, and the distance between them.13 Due to this dependence, the linewidth is expected to be directly proportional to the oxygen concentration, which is valid for low oxygen concentrations. The basis of the line narrowing is the Heisenberg spin–spin exchange between molecular oxygen and LiPc spins. Line narrowing is explained in a dual-spin model,13 which describes two types of spins: A (mobile/diffusive spins) and B (fixed/trapped spins by oxygen molecules). Without oxygen molecules, spins A interact with themselves with high frequency (lifetime τA ∼ 0). This leads to extreme exchange narrowing37,38 of the line. In the presence of oxygen molecules, A-type spins are trapped and converted to B-type. Trapped spins cannot effectively exchange their spins with other A spins, lowering the exchange frequency and extending their lifetime (τA,B > 0), which is related to line broadening.38 The Heisenberg exchange interaction is described by spin–spin exchange integral (J), which is strongly dependent on the dimensionality (n), ΔB ∼ J−n (one-dimensional n = 0.5 (ref. 6) when J = 0, ΔB = max.).10,18 In larger crystals, the exchange integral should be more significant and signal narrowing more efficient10,18 according to the relation, ΔBpp = K〈l〉α, α = −0.36, where 〈l〉 is the average size of crystallite, and K is a proportionality constant.10 Additionally, it was shown that during EPR saturation experiments, three lines were detected, of which only one was sensitive to oxygenation, to which the theory mentioned above applies. The origin of the additional lines can be related to crystalline defects.6Results presented here show a single narrow line (ca. 1 G at 21% O2-air), which is sensitive towards O2 molecules at atmospheric pressure (Fig. 4). After exchanging the air in the EPR tube with nitrogen, the narrowest EPR line obtained by fitting with Lorentzian function was 28 mG (Fig. 4a, ΔBpp = 44 mG). Other samples showed similar peak-to-peak linewidth dispersion in the 44–65 mG range. The narrowest line saturates very quickly, for which measurements had to be performed at 40 dB attenuation, corresponding to 20.17 μW at room temperature. This is the lowest microwave power limit of Bruker spectrometers. Other technical parameters such as modulation amplitude and modulation frequency, which could generally broaden the linewidth, were also set to the lowest settings, correspondingly 10 mG and 10 kHz. Due to the very narrow line, the spectra accumulation artificially broadens the line due to the instabilities of the spectrometer. Fortunately, the signal was strong, and accumulations were not necessary. Fig. 4 shows EPR spectra and fits of one of the obtained samples for three cases of O2 saturation, 0%, 21%, and 100%. The sample was at atmospheric pressure for 0% and 100% in a constant 1 bar gas, nitrogen, or oxygen flow. Open-air conditions covered the 21% of oxygen saturation. Fig. 4d shows how the peak-to-peak linewidth depends on increasing oxygen content in the N2/O2 mix flow, which can fit linear equation ΔBpp [G] = 3.18 × pO2 [%] + 0.028, in selected region fidelity is R2 = 0.9996. Literature provides similar data, obtained after plot digitalization ΔBpp [G] = 3.95 × pO2 [%] + 0.013,24,25 ΔBpp [mG] = 6.84 × pO2 [%] + 0.009 (linear region up to 7.5% O2, saturation level at 0.6 G (ref. 39)), ΔBpp [G] = 3.8 × pO2 [%] + 0.04,6 ΔBpp [G] = 5.96 × pO2 [%] + 0.024 (ref. 40) and similar sensor based on naphthalocyanine (LiNc) ΔBpp [G] = 23.4 × pO2 [%] + 0.93 (ref. 41) and the case of LiNc-BuO ΔBpp [G] = 6.4 × pO2 [%] + 0.3,42 LiNc:PDMS ΔBpp [G] = 0.185 × pO2 [%] + 1.14 (ref. 43) (unit conversion described in the Experimental section). Results show slightly different slopes and saturation dependence in regions 0–21% O2. This can be the problem of differences in synthesis protocols, crystalline size, amorphous fraction present, and mixtures of α and γ phases in the final sensor. The signal of the γ-phase gets broader and weaker with increased oxygen, and the initially weak/invisible background line (of the α-phase or defects) can become visible.
 | ||
| Fig. 4 EPR spectra of LiPc: (a) saturated with N2; (b) in air; (c) saturated with O2; (d) peak-to-peak linewidth dependence vs. oxygen concentration of O2/N2 mixture. The dependence is almost linear and can be described as follows ΔBpp [mG] = 3.18 × pO2 [%] + 0.028 in the range 0–21% of O2; this corresponds to the partial oxygen pressure range 0–159.6 mmHg or 0–21.3 kPa. The magenta line is the data from ref. 24 and 25. | ||
The temporal dependencies of peak-to-peak linewidth and g-factor are shown in Fig. 5. For technical reasons, linewidth dependencies were obtained starting from 0% O2, which is saturation with N2 gas, and the second experiment started from saturation with O2 gas. Fig. 5a shows the decrease in amplitude and increase of linewidth and g-factor during the rise of O2 concentration in the crystals. In Fig. 5b, the second part of the experiment is visible; starting from 100% O2 saturation, gas flow is stopped, signal amplitude increases and linewidth decreases, reaching stable air conditions of 21% O2. The g-factor changes are less than those observed during the previous experiment. Fig. 5c shows the dynamic change in the peak-to-peak linewidth during desaturation of the sample with N2 (red circles) and similarly for O2 (black squares). Transferring from 0% to 21%, the linewidth takes ca. 25 min. (points were recorded every ca. 80 s). Fig. 5d shows the changes in the g-factor, whereas the reference was the Al2O3:Cr3+ internal standard previously calibrated with the DPPH standard with an assumed g-factor equal to 2.0036. Gas flow was restricted after the first two points were recorded under saturation conditions. Both experiments meet at 21% O2 (air conditions) for a linewidth of 1.05 G and g-factor of 2.0036. Recorded changes in this parameter are small, 2.0033–2.0036. The lowest observable peak-to-peak linewidth depends on the synthesis batch (sample purity) and is in the 44–65 mG range. The largest measured linewidth is ca. 1.25 G (100% O2).
 | ||
| Fig. 5 Successively collected EPR spectra, dwell time 100 ms of (a) nitrogen saturated γ-LiPc; (b) oxygen saturated γ-LiPc sample; (c) peak-to-peak linewidth changes in time during desaturation of the atmosphere with N2 (red circles) and second experiment with O2 (black squares); and (d) g-factor changes during experiment described in the case shown in Fig. 4c. | ||
Fig. 6a and b show the EPR spectra of the selected sample measured the day after synthesis (20 °C sample) in 21 and 0% O2. Spectra were recorded after 2 h of heating in a dryer at temperatures 40–200 °C. In general, moderate drying (T < 75 °C) improves signal intensity due to the opening of the channels in crystals, getting out moisture, and synthesis residue. Fig. 6c shows the appearance of the additional broad component, which at 95 °C is barely visible in the wings of the signal, and then at 110 °C, it appears clearly. Previously, it has been reported that LiPc is stable in the temperature range of 0–200 °C.7 In this range, only the insensitive α-phase is stable, where the γ-phase transitions to α-phase is already at 95 °C (Fig. 6d). This process continues up to 150 °C, in which the amplitude of the insensitive-to-oxygenation component of the α-phase gains strength. In the range of 150–200 °C, only one broad component exists (α-phase), rendering the sensor useless. Due to EPR spectroscopy's sensitivity, the transition's beginning could be seen at lower temperatures than seen using XRD.
 | ||
| Fig. 6 EPR linewidth vs. heating temperature (2 h) for (a) 0% O2 and (b) 21% O2; (c) selected EPR lines from a sample heated for 2 h at 37, 80, 95, 110 °C (21% O2); (d) collection of peak-to-peak linewidths of previously heated samples-red squares show the peak-to-peak linewidth of the component insensitive to oxygenation, which appears at 95 °C and black squares are the narrowest linewidths recorded for 0% O2. Above 150 °C, only a broad line exists, which is insensitive to oxygenation. Data is collected from multiple samples and averaged. | ||
Electrochemical impedance spectroscopy (EIS) and cyclic voltammetry
To investigate the electrochemical performance of the LiPc film, the LiPc film was deposited using the CV method in a three-electrode cell configuration. The detailed deposition and characteristic curves are presented in the ESI.† The CV curves of the LiPc film with the scan rates from 10 mV s−1 to 150 mV s−1 were recorded in the potential window from −0.2 to 0.9 V vs. Ag/AgCl wire (Fig. 7a). Only one broad anodic peak was recorded for all scan rates. However, two cathodic peaks were recorded, as presented in Fig. 7a. The overlapping of the two peaks for anodic current could explain the observation of only one broad anodic peak. Further analysis of the CV curves of LiPc film, particularly building a graph of the log(scan rate) vs. log(peak current), which is presented in Fig. 7b, confirms that the obtained LiPc film possesses the ability for oxidation and reduction that did not depend on the speed of the electrochemical reaction. The fitting of the dependences for anodic and two cathodic currents gave values of 0.88 and 0.81 or 0.82, respectively (Fig. 7b). These values for all peak current approaches to a value of 1 meaning that electrochemical processes (oxidations/reductions) are not diffusion-controlled. The peak potentials for both the anodic and the cathodic peaks were found not to increase with the sweep rate, a typical characteristic of the reversible redox process. The presence of one broad anodic peak and two cathodic peaks transform the cation-radical to the neutral form for the two LiPc phases: α-phase and γ-phase. | ||
| Fig. 7 (a) Cyclic voltammetry of LiPc film with scan rates from 10 to 150 mV s−1 recorded with a three-electrode configuration, (b) dependence of the log(scan rate) vs. log(anodic or cathodic peak currents). (c) Nyquist plot of LiPc film (inset – high-frequency region), and (d) Bode plot of LiPc. | ||
EIS provided complementary information to that obtained from cyclic voltammetry. The EIS was measured in the frequency range from 100 kHz to 0.01 Hz with 5 mV amplitude, and the results are presented in the form of Nyquist plots and Bode plots, Fig. 7c and d, respectively. The total impedance of the film does not change in the frequency range from 100 kHz to 1 Hz, as observed in Fig. 7d, with a total value of 150 Ω, which confirms that LiPc film is a semi-conducting material. The presence of α-phase and γ-phase in the LiPc film was observed from two small semicircles at a high-frequency range (presented in Fig. 7c insert). These semicircles correspond to the interaction of α-phase and γ-phase with the electrolyte, and the time of this interaction is in the ms time domain. The large semicircle at the low-frequency range corresponds to the double-layer formation of LiPc film.
The general conclusion from the cyclic voltammetry and EIS is that both methods confirmed the presence of two phases: α-phase and γ-phase. Both phases have similar redox properties, and charge–transfer processes occur in the ms time domain region. However, it was impossible to distinguish which process corresponds to α-phase and which one to γ-phase.
Conclusions
The γ-phase of LiPc is sensitive to oxygenation owing to its unique structure-open channels of ca. 6 Å diameter that allow O2 molecules to penetrate. The LiPc response on O2 molecules is linear in the biologically relevant range and reversible, confirming it has physisorption and not chemical bonding. Linewidth response after rapid oxygenation changed from 0–21% takes ca. 25 min. Line width dependence on oxygen was linear up to 21% partial pressure. Above this value, linewidth increased, and saturation effects were visible. The O2-sensitive γ-phase is stable in lower temperature ranges than previously stated in the literature. The insensitive α-phase appeared at 95 °C, and its intensity increases at the cost of the first one. Only the α-phase was present above 150 °C, which is insensitive to O2. This report is the first one on the surface zeta potential of both lithium phthalocyanine crystals. The two differ significantly, with −53.08 ± 2.37 mV for Li2Pc and −2.4 ± 0.61 mV for LiPc. The latter phase offered less irritation to the immune system, making it a more efficient and promising biosensor.Data availability
The data supporting this article have been included as part of the ESI.†Author contributions
Elena Tomsik – formal analysis, investigation, writing EIS and CV chapter. Zulfiya Cernochova – formal analysis, investigation, writing DLS chapter, writing – review & editing. Magdalena Scheibe – formal analysis, investigation, writing Raman scattering chapter. Krzysztof Tadyszak – sample preparation, formal analysis, investigation, writing EPR chapter, writing – review and editing.Conflicts of interest
The authors declare that they have no known competing financial interests or personal relationships that could have appeared to influence the work reported in this paper.Acknowledgements
We acknowledge the financial support from the Ministry of Education, Youth and Sports of the Czech Republic (grants # LM2023053 and LUAUS24272) and the Czech Academy of Sciences, Strategy AV21 (research program “Breakthrough technologies of the future-sensors, digitization, artificial intelligence, and quantum technology”, research topic “New correlative techniques for biological analysis and imaging and synthetic polymer materials”), and from the project New Technologies for Translational Research in Pharmaceutical Sciences/NETPHARM, project ID CZ.02.01.01/00/22_008/0004607, for financial support.References
- E. Roussakis, Z. Li, A. J. Nichols and C. L. Evans, Oxygen-Sensing Methods in Biomedicine from the Macroscale to the Microscale, Angew. Chem., Int. Ed., 2015, 54(29), 8340–8362, DOI:10.1002/anie.201410646.
- K. J. Liu, P. Gast, M. Moussavi, S. W. Norby, N. Vahidi, T. Walczak and M. S. H. Wu, Lithium phthalocyanine: a probe for electron paramagnetic resonance oximetry in viable biological systems, Proc. Natl. Acad. Sci. U. S. A., 1993, 15(12), 5438–5442 CrossRef PubMed.
- W. Dröge, Free radicals in the physiological control of cell function, Physiol. Rev., 2002, 82(1), 47–95 CrossRef PubMed . Available from: http://www.ncbi.nlm.nih.gov/pubmed/11773609.
- T. T. Tidwell, Triarylmethyl and Related Radicals, in Stable Radicals, 2010, pp. 1–31, DOI:10.1002/9780470666975.ch1.
- H. M. Swartz, B. B. Williams, B. I. Zaki, A. C. Hartford, L. A. Jarvis and E. Y. Chen, et al., Clinical EPR: Unique Opportunities and Some Challenges, Acad. Radiol., 2014, 21(2), 197–206 CrossRef PubMed . Available from: https://www.sciencedirect.com/science/article/pii/S1076633213004996.
- F. Bensebaa and J. J. Andre, Effect of oxygen on phthalocyanine radicals. 1. ESR study of lithium phthalocyanine spin species at different oxygen concentrations, J. Phys. Chem., 1992, 96(14), 5739–5745, DOI:10.1021/j100193a016.
- J.-J. André and M. Brinkmann, Molecular semiconductors for magnetometry and oximetry: lithium phthalocyanine radical, Synth Met., 1997, 90(3), 211–216 CrossRef . Available from: https://www.sciencedirect.com/science/article/pii/S037967799880009X.
- X. S. Tang, M. Moussavi and G. C. Dismukes, Monitoring oxygen concentration in solution by ESR oximetry using lithium phthalocyanine: application to photosynthesis, J. Am. Chem. Soc., 1991, 113(15), 5914–5915, DOI:10.1021/ja00015a085.
- R. P. Pandian, N. P. Raju, J. C. Gallucci, P. M. Woodward, A. J. Epstein and P. Kuppusamy, A New Tetragonal Crystalline Polymorph of Lithium Octa-n-Butoxy-Naphthalocyanine (LiNc-BuO) Radical: Structural, Magnetic and Oxygen-Sensing Properties, Chem. Mater., 2010, 22(23), 6254–6262, DOI:10.1021/cm101733h.
- M. Brinkmann and J.-J. André, Electrodeposited lithium phthalocyanine thin films. Part II:† magnetic properties and mesoscopic effects, J. Mater. Chem., 1999, 9(7), 1511–1520, 10.1039/A809778J.
- M. Brinkmann, P. Turek and J.-j. André, EPR study of the x,α and β structures of lithium phthalocyanine, J. Mater. Chem., 1998, 8(3), 675–685, 10.1039/A707915J.
- G. Ilangovan, J. L. Zweier and P. Kuppusamy, Electrochemical Preparation and EPR Studies of Lithium Phthalocyanine: Evaluation of the Nucleation and Growth Mechanism and Evidence for Potential-Dependent Phase Formation, J. Phys. Chem. B, 2000, 104(17), 4047–4059, DOI:10.1021/jp9935182.
- G. Ilangovan, J. L. Zweier and P. Kuppusamy, Electrochemical Preparation and EPR Studies of Lithium Phthalocyanine. Part 2: Particle-Size-Dependent Line Broadening by Molecular Oxygen and Its Implications as an Oximetry Probe, J. Phys. Chem. B, 2000, 104(40), 9404–9410, DOI:10.1021/jp0013863.
- G. Ilangovan, H. Li, J. L. Zweier and P. Kuppusamy, Electrochemical Preparation and EPR Studies of Lithium Phthalocyanine. 3. Measurements of Oxygen Concentration in Tissues and Biochemical Reactions, J. Phys. Chem. B, 2001, 105(22), 5323–5330, DOI:10.1021/jp010130+.
- D. Duret, M. Beranger and M. Moussavi, A new current sensor using electron spin resonance, Sensor Actuator Phys., 1992, 31(1), 174–177 CrossRef . Available from: https://www.sciencedirect.com/science/article/pii/092442479280100H.
- S. Künstner, A. Chu, K.-P. Dinse, A. Schnegg, J. E. McPeak and B. Naydenov, et al., Rapid-scan electron paramagnetic resonance using an EPR-on-a-Chip sensor, Magn. Reson., 2021, 2(2), 673–687 CrossRef PubMed . Available from: https://mr.copernicus.org/articles/2/673/2021/.
- T. Kamoya, T. Anada, Y. Shiwaku, T. Takano-Yamamoto and O. Suzuki, An oxygen-permeable spheroid culture chip (Oxy chip) promotes osteoblastic differentiation of mesenchymal stem cells, Sensor. Actuator. B Chem., 2016, 232, 75–83 CrossRef CAS . Available from: https://www.sciencedirect.com/science/article/pii/S0925400516304014.
- G. Ilangovan, R. Pal, J. L. Zweier and P. Kuppusamy, Electrochemical Preparation and EPR Studies of Lithium Phthalocyanine. 4. Effect of Nitric Oxide, J. Phys. Chem. B, 2002, 106(46), 11929–11935, DOI:10.1021/jp026360l.
- P. Turek, J.-J. André, A. Giraudeau and J. Simon, Preparation and study of a lithium phthalocyanine radical: optical and magnetic properties, Chem. Phys. Lett., 1987, 134(5), 471–476 CrossRef CAS . Available from: https://www.sciencedirect.com/science/article/pii/0009261487871750.
- M. Brinkmann, S. Graff, C. Chaumont and J.-J. André, Electrodeposition of lithium phthalocyanine thin films: Part I. Structure and morphology, J. Mater. Res., 1999, 14(5), 2162–2172 CrossRef CAS . Available from: https://www.cambridge.org/core/article/electrodeposition-of-lithium-phthalocyanine-thin-films-part-i-structure-and-morphology/F817AD012C40E9BCF2D484EF55BE7011.
- E. Ortiz-Prado, J. F. Dunn, J. Vasconez and D. V. G. Castillo, Partial pressure of oxygen in the human body: a general review, Am. J. Blood Res., 2019, 9(1), 1–14 CAS.
- H. M. C. R. Swartz, The measurement of oxygen in vivo using EPR techniques, Phys. Med. Biol., 1998, 43(7), 1957–1975 CrossRef CAS PubMed.
- A.-S. Van Eyck, B. F. Jordan, B. Gallez, J.-F. Heilier, A. Van Langendonckt and J. Donnez, Electron paramagnetic resonance as a tool to evaluate human ovarian tissue reoxygenation after xenografting, Fertil. Steril., 2009, 92(1), 374–381 CrossRef CAS PubMed.
- J. F. Dunn and H. M. Swartz, In vivo electron paramagnetic resonance oximetry with particulate materials, Methods, 2003, 30(2), 159–166 CrossRef CAS PubMed.
- J. F. Dunn, O. Grinberg, M. Roche, C. I. Nwaigwe, H. G. Hou and H. M. Swartz, Noninvasive Assessment of Cerebral Oxygenation during Acclimation to Hypobaric Hypoxia, J. Cereb. Blood Flow Metab., 2000, 20(12), 1632–1635, DOI:10.1097/00004647-200012000-00002.
- M. Dinguizli, N. Beghein and B. Gallez, Retrievable micro-inserts containing oxygen sensors for monitoring tissue oxygenation using EPR oximetry, Physiol. Meas., 2008, 29(11), 1247–1254, DOI:10.1088/0967-3334/29/11/001.
- B. I. Kharisov, U. Ortiz Méndez, J. L. Almaraz Garza and A. Rodríguez Jr, Synthesis of non-substituted phthalocyanines by standard and non-standard techniques. Influence of solvent nature in phthalocyanine preparation at low temperature by UV-treatment of the reaction system, New J. Chem., 2005, 29(5), 686–692, 10.1039/B415712P.
- M. Afeworki, N. R. Miller, N. Devasahayam, J. Cook, J. B. Mitchell and S. Subramanian, et al., Preparation and EPR Studies of Lithium Phthalocyanine Radical as an Oxymetric Probe, Free Radic. Biol. Med., 1998, 25(1), 72–78 CrossRef CAS PubMed . Available from: https://www.sciencedirect.com/science/article/pii/S0891584998000392.
- K. Tadyszak, E. Tomšík and Z. Černochová, Electrochemical and radical properties of core-shell structure PDA@SiO2, Synth. Met., 2024, 301, 117492 CrossRef CAS . Available from: https://www.sciencedirect.com/science/article/pii/S037967792300214X.
- Z. Černochová, V. Lobaz, L. Čtveráčková, P. Černoch, M. Šlouf and M. Filipová, et al., Encapsulating melittin from animal venom by finely tuned charge compensation with polymer carriers, Eur. Polym. J., 2023, 190, 111996 CrossRef . Available from: https://www.sciencedirect.com/science/article/pii/S0014305723001799.
- M. Smoluchowski, Studien über Molekularstatistik von Emulsionen und deren Zusammenhang mit der Brown’schen Bewegung, Pisma Marian Smoluchowskiego, 1927, 2, 399–421 Search PubMed.
- F. Booth, Theory of Electrokinetic Effects, Nature, 1948, 161(4081), 83–86, DOI:10.1038/161083a0.
- J. Z. Sostaric, R. P. Pandian, L. K. Weavers and P. Kuppusamy, Formation of Lithium Phthalocyanine Nanotubes by Size Reduction Using Low- and High-Frequency Ultrasound, Chem. Mater., 2006, 18(17), 4183–4189, DOI:10.1021/cm060751l.
- D. R. Tackley, G. Dent and W. Ewen Smith, Phthalocyanines: structure and vibrations, Phys. Chem. Chem. Phys., 2001, 3(8), 1419–1426, 10.1039/B007763L.
- J. Marshell, FT Raman Spectrum and Band Assignments for Metal–Free Phthalocyanine (H2Pc), Mater. Sci. Res. India, 2010, 7(1), 221–224 CAS.
- M. E. Sánchez-Vergara, J. C. Alonso-Huitron, A. Rodriguez-Gómez and J. N. Reider-Burstin, Determination of the Optical GAP in Thin Films of Amorphous Dilithium Phthalocyanine Using the Tauc and Cody Models, Molecules, 2012, 17, 10000–10013 CrossRef PubMed.
- J. E. Wertz and J. R. Bolton, Electron Spin Resonance, Springer Netherlands, Dordrecht, 1986. Available from: http://link.springer.com/10.1007/978-94-009-4075-8 Search PubMed.
- M. Nechtschein, F. Devreux, F. Genoud, M. Guglielmi and K. Holczer, Magnetic-resonance studies in undoped trans-polyacetylene ${(\mathrm{CH})}_{x}$. II, Phys. Rev. B:Condens. Matter Mater. Phys., 1983, 27(1), 61–78, DOI:10.1103/PhysRevB.27.61.
- G. Ilangovan, J. L. Zweier and P. Kuppusamy, Mechanism of oxygen-induced EPR line broadening in lithium phthalocyanine microcrystals, J. Magn. Reson., 2004, 170(1), 42–48 CrossRef CAS PubMed . Available from: https://www.sciencedirect.com/science/article/pii/S1090780704001673.
- K. J. Liu, P. Gast, M. Moussavi, S. W. Norby, N. Vahidi and T. Walczak, et al., Lithium phthalocyanine: a probe for electron paramagnetic resonance oximetry in viable biological systems, Proc. Natl. Acad. Sci. USA, 1993, 90(12), 5438–5442, DOI:10.1073/pnas.90.12.5438.
- G. Ilangovan, A. Manivannan, H. Li, H. Yanagi, J. L. Zweier and P. Kuppusamy, A naphthalocyanine-based EPR probe for localized measurements of tissue oxygenation, Free Radic. Biol. Med., 2002, 32(2), 139–147 CrossRef CAS PubMed.
- R. P. Pandian, N. L. Parinandi, G. Ilangovan, J. L. Zweier and P. Kuppusamy, Novel particulate spin probe for targeted determination of oxygen in cells and tissues, Free Radic. Biol. Med., 2003, 35(9), 1138–1148 CrossRef CAS PubMed . Available from: https://www.sciencedirect.com/science/article/pii/S0891584903004969.
- G. Meenakshisundaram, R. P. Pandian, E. Eteshola, S. C. Lee and P. Kuppusamy, A paramagnetic implant containing lithium naphthalocyanine microcrystals for high-resolution biological oximetry, J. Magn. Reson., 2010, 203(1), 185–189 CrossRef CAS PubMed.
Footnote |
| † Electronic supplementary information (ESI) available. See DOI: https://doi.org/10.1039/d4ra08335k |
| This journal is © The Royal Society of Chemistry 2025 |