
 Open Access Article
 This Open Access Article is licensed under a Creative Commons Attribution-Non Commercial 3.0 Unported Licence
Enhancing pollutant removal efficiency through multi-flow cascade flocculation and flotation reactor: a detailed flow field analysis†
Qingji Wangabf,
Hao Wangab,
Xiumei Sunab,
Liang Licde and
Xing Liang *cde
*cde
aCNPC Research Institute of Safety and Environment Technology, Beijing 102206, China
bState Key Laboratory of Petroleum Pollution Control, Beijing 102206, China
cSchool of Chemical Engineering and Technology, China University of Mining and Technology, Xuzhou, Jiangsu 221116, China. E-mail: liangxing@cumt.edu.cn; Tel: +86-13201817769
dState Key Laboratory of Coking Coal Resources Green Exploitation, China University of Mining and Technology, Xuzhou, Jiangsu 221116, China
eNational Engineering Research Center of Coal Preparation and Purification, China University of Mining and Technology, Xuzhou, Jiangsu 221116, China
fCollege of Chemical Engineering and Environment, China University of Petroleum-Beijing, Beijing 102249, China
First published on 7th February 2025
Abstract
The treatment of oilfield wastewater, characterized by high oil content and complex composition, presents significant challenges in environmental protection. This study developed a novel multi-stage cascade flocculation and flotation reactor (MCFR) to enhance pollutant removal from oilfield wastewater. Particle image velocimetry was used to investigate the internal flow fluid distribution within the reactor. Results show that inlet flow rates of 100 and 150 L h−1 create a high velocity and energy mixing environment near the inlet, facilitating thorough interaction between flocculants and wastewater. This promotes the rapid formation of small flocs and the coalescence of oil droplets. Under the influence of evenly distributed vortex generators, both flocs and oil droplets increase in size, with large oil droplets separated by flotation and dense flocs through sedimentation. In flocculation experiments, the MCFR, operating at 70 mg L−1 of polymerized ferrous sulfate (PFS), 0.6 mg L−1 of polyacrylamide (PAM), and an inlet flow rate of 100 L h−1, achieved turbidity and oil removal rates of 95% and 94%, respectively. In comparison, a traditional stirred flocculation reactor achieves 82% and 78% removal rates for turbidity and oil, respectively, but requires a longer treatment time of up to 21 minutes. Additionally, the MCFR operates continuously with a treatment time of less than 1 minute, offering a faster and more efficient solution for gas and oil field wastewater treatment. These findings provide critical insights for designing advanced flocculation–flotation systems for the complex wastewater treatment needs of the oil and gas industry.
1. Introduction
As the primary fossil energy source, petroleum is the cornerstone of modern industry.1–3 Various operational techniques such as fracturing and acidizing are usually employed to improve the extraction efficiency of petroleum extraction.4–6 These methods generate substantial quantities of gas and oil field wastewater, including drilling fluids, fracturing flowback fluids, well-washing fluids, acidizing fluids, and their mixtures.7–9 The discharge volume of these wastewaters is large. For example, fracturing flowback fluids from a single well can reach 7600–19![[thin space (1/6-em)]](https://www.rsc.org/images/entities/char_2009.gif) 000 m3.10 If these wastewaters are not properly treated, it will not only result in a large waste of water resources, but also cause damage to the environment.11 Therefore, the efficient treatment of gas and oil field operation wastewater has become an important issue in both gas and oil field development and ecological environmental protection.12,13
000 m3.10 If these wastewaters are not properly treated, it will not only result in a large waste of water resources, but also cause damage to the environment.11 Therefore, the efficient treatment of gas and oil field operation wastewater has become an important issue in both gas and oil field development and ecological environmental protection.12,13
The water quality of gas and oil field wastewater is complex and highly variable, characterized by high salinity, emulsification oil, a high concentration of fine suspended particles, and a stable structure that is difficult to treat.14,15 To address these challenges, various technologies have been developed for treating these wastewaters, including sedimentation, flocculation, oxidation, and membrane treatment.16–18 Among these, flocculation has become a widely used wastewater pretreatment technology due to its low cost, operational simplicity, and high pollutant removal efficiency.19–22 The basic principle of flocculation technology is based on the fact that pollutant particles in wastewater typically carry the same charge, which keeps them dispersed and stable due to electrostatic repulsion, making separation from the water difficult.23,24 When a flocculant with an opposite charge is added, these pollutant particles lose stability as charge neutralization occurs, leading to destabilization.25,26 Under hydraulic conditions, the destabilized particles collide and adhere to each other.27 Through the mechanisms of adsorption, bridging, and enmeshment provided by the flocculant, large flocs are eventually formed, which then settle and separate from the wastewater under the influence of gravity.28,29 During the flocculation process, hydraulic conditions are typically controlled by the flocculation reactor, making the development of efficient flocculation reactors essential for advancing flocculation technology.30–32
Currently, the stirred flocculation reactor is the most widely used flocculation reactor. However, it has several drawbacks, including uneven flow field distribution and high energy consumption.33,34 To overcome these issues, researchers have developed various innovative flocculation reactors. Li et al.35 developed a sequencing batch flocculation reactor to enhance phosphorus removal from municipal wastewater, achieving a total phosphorus removal rate of 96.4%. Wang et al.36 designed a conical guide flocculation reactor with a uniform fluid distribution, achieving a COD removal rate of 55% for soybean oil wastewater. Zhou et al.37 developed a conical flocculation reactor with a two-stage velocity gradient, which effectively prevents floc breakage, thereby increasing the removal rate of kaolin suspension by 10%. Although these reactors have shown good performance, they still face challenges such as high energy consumption and maintenance costs. Therefore, the development of new, efficient flocculation reactors remains necessary.
To address the challenges posed by high oil content and complex compositions in gas and oil field wastewater, this study introduces a novel multi-flow cascade flocculation and flotation reactor (MCFR). Wastewater flows sequentially through different chambers or zones, each designed to enhance specific treatment processes, the cascade flow pattern ensures thorough mixing and interaction between flocculants, suspended particles, and oil droplets in a stepwise manner. Each stage in the cascade contributes to progressively enhancing the efficiency of flocculation and flotation by providing local flow conditions. This reactor is designed to simultaneously enhance the removal of both suspended solids and oil contaminants through an integrated approach that combines flocculation and flotation. The MCFR incorporates a unique multi-stage design with vortex generators that ensure even flow field distribution. This design optimizes fluid dynamics within the reactor, enabling effective mixing and promoting high collision efficiency between particles. By examining the internal flow field distribution using Particle Image Velocimetry (PIV) and conducting flocculation experiments, this study evaluates the MCFR's effectiveness across various operating conditions. This study provides both theoretical support and practical insights for designing efficient flocculation reactors, contributing to the advancement of treatment solutions for complex gas and oilfield wastewater.
2. Experimental
2.1. Reactor design
As shown in Fig. 1, the MCFR consists of two layers of sleeves: an inner sleeve and an outer sleeve. The inner sleeve has a column–cone–column structure, which serves as the main region for flocculation and flotation. Wastewater, mixed with flocculant, enters the inner sleeve through an inlet located in the upper cylindrical section, while bubbled water enters from the lower inverted conical section. This design facilitates countercurrent contact between the wastewater and the bubbles. Additionally, the middle cylindrical section of the inner sleeve is equipped with uniformly distributed vortex generators to enhance the collision efficiency between pollutant particles and bubbles. The lighter components in the wastewater combine with the bubbles and float to the top, where they are discharged through the scum outlet. Meanwhile, heavier components and flocs settle to the bottom of the inner sleeve and enter the outer sleeve, then flow out of the reactor. During actual fabrication, to prevent refraction issues in the cylindrical reactor that could affect PIV imaging, the reactor's outer casing was designed as a square transparent water box. This modification was necessary to ensure accurate and reliable imaging during the experiments. | ||
| Fig. 1 Structure schematic diagram of the MCFR. (a) The specific structure size. (b) 3D model. | ||
2.2. PIV measurement
PIV technology was used to test the velocity and energy distribution in specific cross-sections of the reactor. To prevent refraction of the laser when entering the cylindrical reactor, a cubic Plexiglas box filled with water was placed around the reactor. The experimental process is shown in Fig. 2, the PIV system consists of a laser emitter (Solo PIV 200XT 532 nm, New Wave Co, USA), charged coupled device (CCD) camera (Flow Sense EO 4 M, Imperx Co, USA), synchronous controller, and computer. Prior to the experiment, an appropriate amount of fluorescent tracer particles (the size of the tracer particles is 10 μm, and the concentration is 0.5%, with a density of 1.05 g cm−3) was added to the reactor. A sheet laser emitted by the laser illuminates the measured plane inside the reactor, and a CCD camera, positioned perpendicular to the laser plane, captures the light signals reflected by the tracer particles on the illuminated plane. Before shooting, the position of the camera and the plane to be photographed were adjusted to ensure the clearest possible images, facilitating subsequent software processing. To obtain accurate and reliable data, 200 pairs of images were captured for each set of experiments. The results were then analyzed using Dynamic Studio 3.2 software to obtain the velocity and energy distribution for each characteristic cross-section of the reactor. | ||
| Fig. 2 Actual images of PIV shooting. (a) Before shooting: (1) laser transmitter, (2) MCFR, (3) CCD camera, (4) power pump, (b) shooting process. | ||
2.3. Flocculants and simulated wastewater
For the flocculation experiments, simulated gas and oil field operational wastewater was prepared by using SiO2 particles with a diameter of 1.0 μm to mimic the solid particles in gas and oil field wastewater, and petroleum to simulate the oil phase. Based on analysis of actual gas and oil field wastewater, we found that the predominant particles were SiO2, with the diameter of 1.0 μm being the most abundant. This is consistent with descriptions in previously published literature.38–40 These particles primarily originate from formation minerals and additives.41 Therefore, we utilized SiO2 particles with a diameter of 1.0 μm to configure the simulated wastewater, aiming to reflect the performance of the designed reactor in treating difficult-to-treat wastewater.Based on the ion composition detected in actual gas and oil field wastewater (as shown in Table S1†), simulated mineralized water was prepared. SiO2 particles were then added to the prepared mineralized water at a concentration of 1 g L−1, followed by stirring to evenly disperse the particles. Afterward, 0.5 g L−1 of petroleum was added, and the mixture was heated in a 45 °C water bath for 10 minutes. It was then homogenized using a high-shear mixer at 5000 rpm for 15 minutes to ensure uniform dispersion of the oil, resulting in simulated gas and oil field wastewater. The turbidity and oil content of the simulated wastewater were measured using a TL 2310 turbidimeter (Hach, Loveland, CO, USA) and an SN-OIL480 infrared oil content analyzer (Sunde, Qingdao, Shandong, China), with results showing a turbidity of 1029 NTU and oil content of 460 mg L−1.
During the experiments, polymerized ferrous sulfate (PFS) and polyacrylamide (PAM) were used as flocculants. To ensure rapid and uniform dispersion of the reagents during the experiments, solid PFS and PAM were dissolved in deionized water before testing, forming solutions with concentrations of 100 g L−1 and 1 g L−1, respectively. Both the simulated wastewater and flocculant solutions were freshly prepared before each flocculation experiment.
2.4. Flocculation experiment
The schematic diagram of the apparatus used for the flocculation experiments with the reactor is shown in Fig. 3. Before the experiment, simulated wastewater was added to a beaker, and a certain amount of flocculant was then introduced into the simulated wastewater. The wastewater was pumped into the reactor from the top through a power pump. Inside the reactor, flocculation and flotation occurred, and the floc-laden wastewater exited the reactor via overflow from the outer cylinder into the sedimentation tank. The supernatant from the sedimentation tank was pumped into a bubble generator, where bubbles were produced and then reintroduced into the reactor from the bottom. The scum produced in the reactor was discharged from the top. A picture of the real flocculation–flotation process achieved by this reactor can be seen in the Fig. S1.† The reactor used for the flocculation experiment had identical dimensions to the one used for flow field testing and particle motion behavior analysis. | ||
| Fig. 3 The experimental setup. (1) Glass jar, (2) pump, (3) valve, (4) liquid flowmeter, (5) MCFR, (6) settling tank, (7) bubble generator. | ||
A comparative experiment was conducted between a stirred flocculation reactor and the MCFR. The stirred flocculation reactor used in the experiment had an adjustable stirring speed. After the flocculant was added, the wastewater was rapidly stirred at 180 rpm for 1 minute to ensure the flocculant was quickly and uniformly dispersed. The stirring speed was then reduced to 50 rpm and maintained for 20 minutes at this moderate speed to promote floc growth.42 After the reaction was complete, samples of the supernatant were taken after a set settling time for testing.
2.5. Materials
The crude oil used in the experiment was sourced from Shengli Oilfield, with a density of 0.84 g cm−3 and a viscosity of 18.46 mPa s. The mineralized water components (MgCl2·6H2O, Na2SO4, NaCl, NaHCO3, CaCl2) were purchased from Xilong Science Co., Ltd, Shantou, China, with AR grade. SiO2, with a particle size of 1 μm, was supplied by Shanghai Yuejiang Titanium Dioxide Chemical Co., Ltd. The iron content of the PFS used for flocculation was 21%, and it was purchased from Shanghai Macklin Biochemical Technology Co., Ltd. The PAM used was of AR grade, purchased from Tianjin Damo Chemical Reagent Factory.3. Results and discussion
3.1. Flow field distribution in MFRs
The actual reactor used for PIV is shown in Fig. 4a, and the five selected characteristic cross sections are illustrated in Fig. 4b. The bubbles at the bottom of the reactor are generated by a bubble generator developed by our research group. The average size of the produced bubbles is approximately 1 μm, and the gas volume fraction of bubbles is 10%.43 The bubbles help enhance particle flocculation and oil droplet flotation by increasing the surface area for pollutant attachment.44 During the experiment, the flow rate of the bubbled water inlet was kept constant at 50 L h−1, while the flow rate of the wastewater inlet was varied. The tested inlet flow rates were 50, 100, 150, 200, and 250 L h−1. The selected cross-sections were labeled A, B, C, D, and E, arranged from the top to the bottom of the MCFR's inner cylinder. Section A is closest to the wastewater inlet, located between the first and second layers of vortex generators. Sections B and C are positioned in the middle of the inner cylinder, also between two layers of vortex generators. Section D is located above the bubble's inlet, while section E is near the inlet of the lower cylindrical section of the inner cylinder. These sections are evenly distributed within the flocculation reaction zone of the reactor. By studying the velocity and energy distribution at these sections, the flocculation process in the MCFR can be better understood. | ||
| Fig. 4 Physical picture (a) and characteristic cross-section diagram (b) of the MCFR. | ||
Since the reactor's inlet diameter is 6 mm, the inlet flow velocities at flow rates of 50, 100, 150, 200, and 250 L h−1 are 0.49, 0.98, 1.47, 1.97, and 2.46 m s−1, respectively. Based on these velocities, the Reynolds numbers are calculated to be 2950, 5899, 8849, 11799, and 14748, all of which are greater than 2000. The fluid velocity distribution near the inlet is shown in Fig. S2.† It can be observed that, at an inlet flow rate of 50 L h−1, the fluid velocity distribution near the inlet is uneven. As the inlet flow rate increases to 100 and 150 L h−1, the uniformity of the velocity distribution improves. However, when the inlet flow rate continues to increase to 200 and 250 L h−1, regions with local velocities exceeding 0.06 m s−1 appear, which may hinder the initial formation of the flocs.
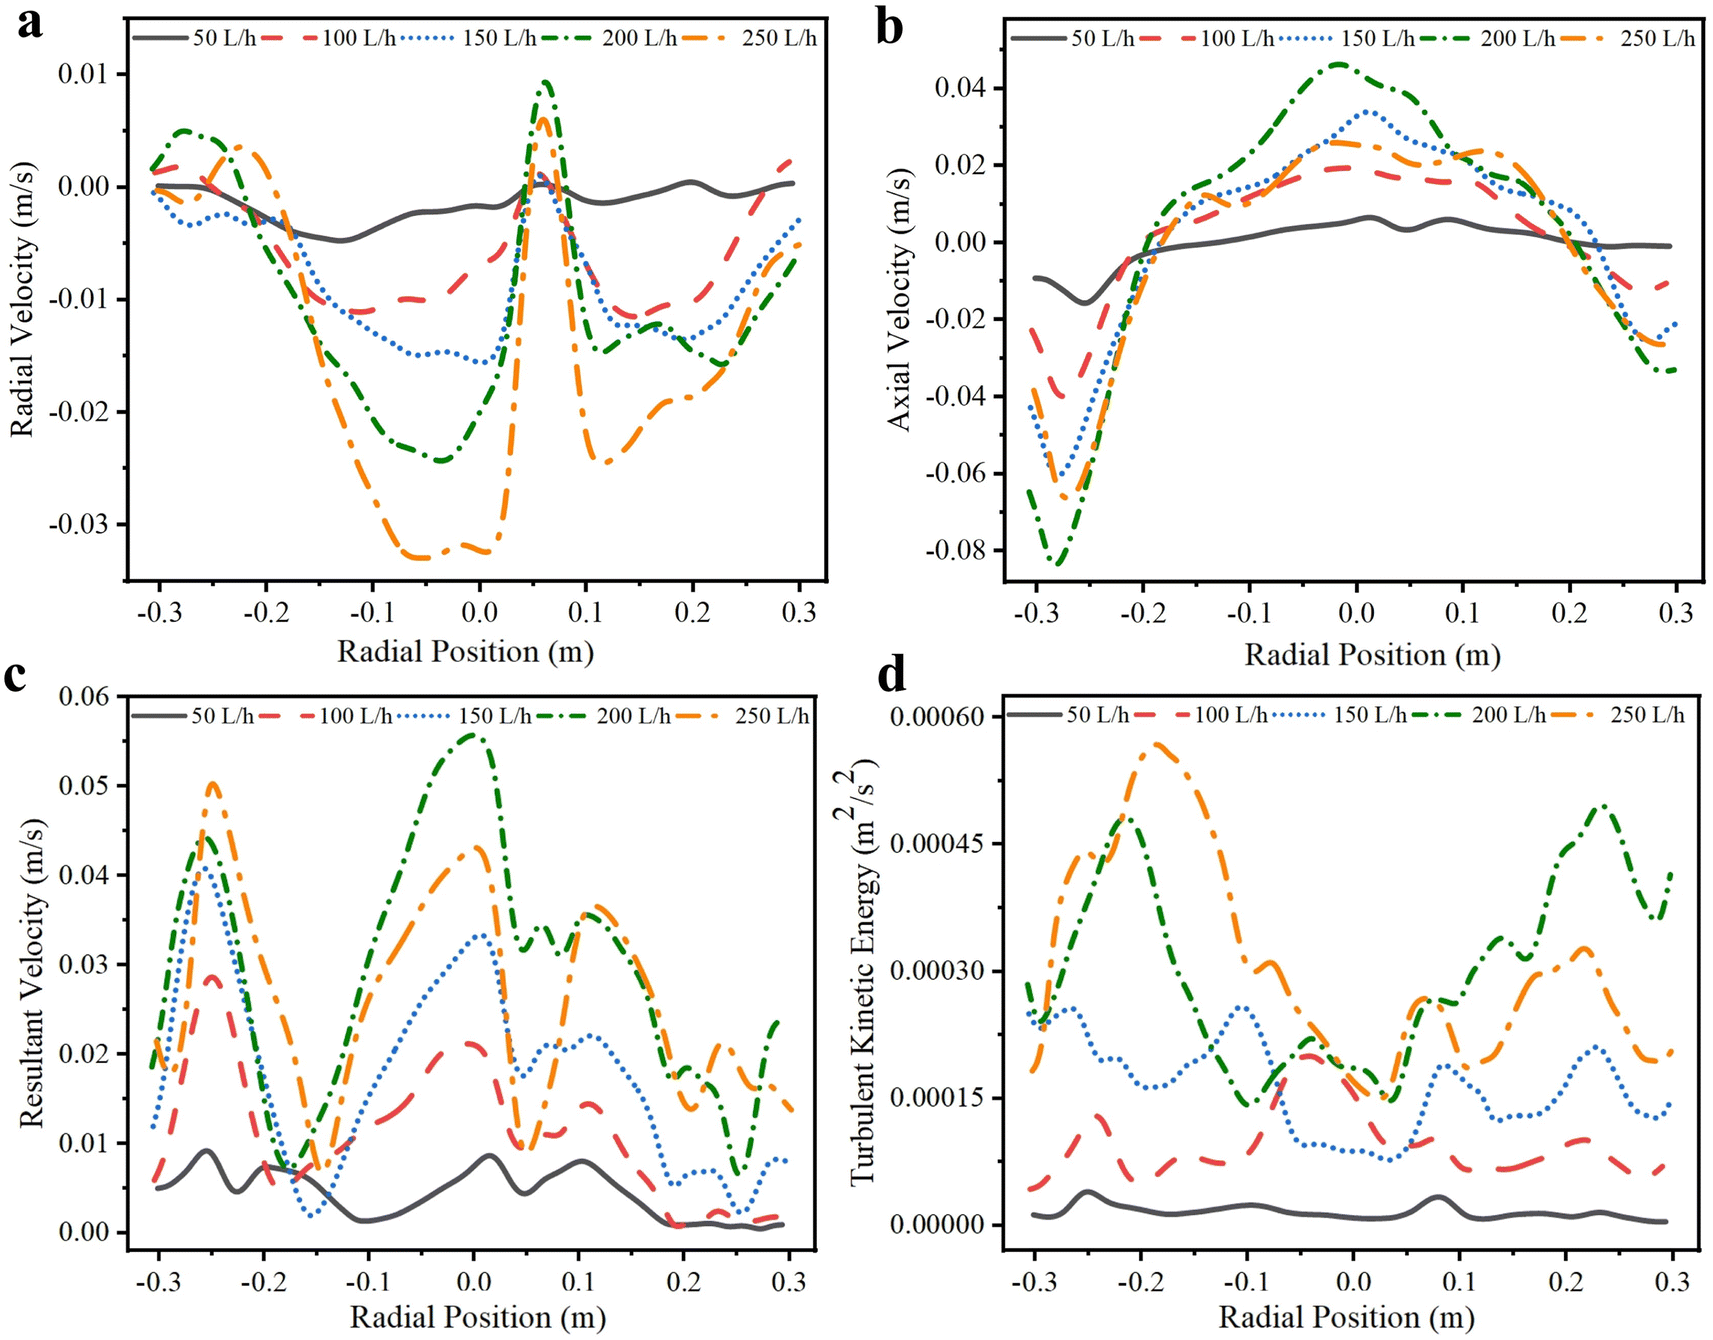
The velocity and energy distribution at section A under different inlet flow rates, as captured by PIV, are shown in Fig. 5. The corresponding PIV images, illustrating the fluid dynamic velocity distribution at different operational conditions, are provided in the Fig. S3.† Radial velocity refers to the velocity component of the fluid in the radial direction, representing the speed of fluid movement either from the center outward or from the outside inward. Fluctuations in radial velocity can form localized vortex structures.45 As shown in Fig. 5a, the horizontal axis represents the radial position along the reactor, where the zero point corresponds to the center axis of the reactor, and the numbers represent the radial distance from the center axis. The radial velocity at section A is mostly negative, indicating centripetal fluid movement at this location. The radial velocity approaches zero near the reactor wall, while two maximum radial velocity points are observed near radial positions −0.05 m and 0.15 m, suggesting the presence of vortex motion, and the locations of maximum radial velocity corresponding to the vortex centers. High-resolution images illustrating the formation of these vortices near the protrusions at the reactor wall are provided in the ESI (see Fig. S4†), and the vortex structure is marked with orange circles.
 | ||
| Fig. 5 Velocity and energy distribution curves of section A. (a) Radial velocity, (b) axial velocity, (c) resultant velocity, (d) turbulent kinetic energy. | ||
At an inlet flow rate of 50 L h−1, the radial velocity is close to zero, indicating minimal material exchange and energy transfer along the radial direction, which is unfavorable for particle collision and adhesion during flocculation. As the inlet flow rate increases, the radial velocity significantly rises, while the overall distribution pattern remains similar. At inlet flow rates of 100 and 150 L h−1, the radial velocity distribution is relatively symmetrical, with a center of symmetry around position 0.05 m. The slight offset in this symmetry center may result from the single-inlet design and the staggered distribution of vortex generators. As the inlet flow rate further increases to 200 and 250 L h−1, the radial velocity continues to rise, but symmetry decreases, showing a higher extreme radial velocity on the left side. This asymmetry may be caused by the single-inlet configuration of the reactor. The larger the inlet flow rate, the more pronounced the asymmetry in radial velocity distribution between the left and right sides. The variation in radial velocity across different positions facilitates differential collisions between pollutant particles, promoting floc formation. The unique structural design of the MCFR enables sufficient mixing and collision upon entry, enhancing the initial stage of floc formation.
The axial velocity under different inlet flow rates is shown in Fig. 5b. Axial velocity refers to the velocity component of the fluid along the flow direction, with negative values indicating downward movement and positive values indicating upward movement.46 An appropriate axial velocity is crucial for effective flocculation. Lower axial velocity allows more interaction between the fluid and pollutants, which may enhance particle adhesion. However, excessively lower axial velocity can reduce radial mixing intensity, which is unfavorable for flocculation.
As shown in Fig. 5b, at an inlet flow rate of 50 L h−1, the axial velocity is very low and negative, indicating slow downward fluid movement along the flow direction. As the inlet flow rate increases, the axial velocity rises significantly. The overall distribution trend shows downward movement on the left side and upward movement on the right side. It also increases the likelihood of contact between pollutant particles, thereby improving flocculation efficiency. When the inlet flow rates increase to 100, 150, and 200 L h−1, the axial velocity correspondingly rises. At an inlet flow rate of 250 L h−1, the axial velocity unexpectedly decreases. This may be due to higher energy input leading to greater energy losses, where increased inlet flow strengthens radial motion but weakens axial motion.
Fig. 5c shows the distribution of resultant velocity along the radial position. Resultant velocity refers to the magnitude of the fluid's velocity vector at a given position, the distribution contour of the resultant velocity is shown in Fig. S3.† At an inlet flow rate of 50 L h−1, the resultant velocity is the lowest, with minimal fluctuations. This small velocity gradient is unfavorable for direct contact between pollutants in the wastewater, leading to lower flocculation efficiency. As the inlet flow rate increases, both the magnitude and fluctuations of the resultant velocity increase significantly, with localized high-velocity regions emerging near vortex generators. At inlet flow rates of 100, 150, and 200 L h−1, the resultant velocity increases substantially. However, at an inlet flow rate of 250 L h−1, the peak resultant velocity on the left side slightly increases, while the peak on the right side decreases noticeably. Excessively high inlet flow rates lead to increased velocity losses, which not only fail to improve flocculation efficiency but also increase the energy consumption of the reactor. Therefore, based on the velocity distribution in the MCFR, inlet flow rates of 50 L h−1 and 250 L h−1 are not suitable.
Fig. 5d shows the turbulent kinetic energy (TKE) distribution at section A under different flow rates. TKE is an important parameter that measures the energy dissipated in the system, influencing both flocculation efficiency and particle collision frequency. TKE was obtained through PIV measurements. In our experiments, PIV was used to capture the velocity field within the reactor, and the turbulent kinetic energy was calculated using the eqn (1):
 | (1) |
The PIV system measured the velocity fluctuations at various points in the reactor, and from these, we calculated the TKE at different positions within the system. At an inlet flow rate of 50 L h−1, TKE is relatively low, indicating minimal fluid fluctuations, which result in a lower collision frequency between particles. Under these conditions, flocculation efficiency may be low, as insufficient interactions between particles make it difficult to form large flocs. As flow rates increase to 100 and 150 L h−1, TKE rises significantly, with a peak observed at 150 L h−1 near radial positions −0.1 m and 0.1 m. This indicates that local energy dissipated in the system is higher at this flow rate, promoting the occurrence of local shear forces, which enhance the collision efficiency between particles during flocculation. When inlet flow rates further increase to 200 and 250 L h−1, TKE continues to rise. However, at 250 L h−1, the TKE increase is smaller, with more dramatic fluctuations and lower symmetry. This suggests that at excessively high flow rates, energy utilization decreases, and excessively high energy dissipated in the system may lead to floc breakage, reducing the overall flocculation efficiency.47,48
Fig. 6 presents the velocity and energy distribution curves at section B, which is located between the second and third layers of vortex generators. Fig. S5† shows the velocity contours of position B captured by PIV at different inlet flow rates. Fig. 6a shows the radial velocity distribution. The radial velocity is nearly zero at a flow rate of 50 L h−1. As the flow rate increases to 100 and 150 L h−1, the radial velocity distribution becomes more uniform and symmetrical, enhancing flocculation efficiency. Additionally, the fluctuations in radial velocity are larger compared to section A, especially near radial positions −0.15 m and 0.1 m. These fluctuations indicate stronger radial flow in local areas, contributing to increased particle collisions and mixing. However, when the flow rate is further increased to 200 and 250 L h−1, the radial velocity distribution becomes asymmetric, with a significant difference in fluctuation amplitude between the positive and negative positions. This asymmetry can hinder the uniform mixing of particles, potentially affecting the overall flocculation process.49
 | ||
| Fig. 6 Velocity and energy distribution curves of section B. (a) Radial velocity, (b) axial velocity, (c) resultant velocity, (d) turbulent kinetic energy. | ||
Fig. 6b shows the axial velocity distribution at section B. The distribution pattern is similar to that of section A, but the axial velocity at section B is more symmetrical at moderate flow rates. This indicates that the flocculation environment at section B may be more stable, allowing for more consistent interactions between particles. In contrast, the velocity fluctuations at section A (Fig. 5b) are more intense at higher flow rates. This enhances the likelihood of pollutant particles colliding violently as they enter the reactor. In comparison, although section B also experiences fluctuations at higher flow rates, the asymmetry and fluctuation amplitude are relatively smaller, making it more suitable for the formation of stable flocs. Fig. 6c and d show the resultant velocity and TKE distributions at section B, respectively. Compared to section A, the resultant velocity curve at section B is more symmetrical and smoother, with fewer local extreme points and lower peak values. Except under the 250 L h−1 flow condition, the TKE at section B remains relatively stable across other flow rates. At 250 L h−1, an excessively high energy concentration appears on the left side of the reactor, which could potentially cause the formed flocs to break apart.
Fig. 7 shows the velocity and energy distribution curves at section C, and Fig. S6† shows the velocity contours of the C position captured by PIV at different inlet flow rates. From the radial velocity distribution curve (Fig. 7a), it can be seen that at an inlet flow rate of 150 L h−1, a significant fluctuation peak appears near radial position −0.05 m, indicating strong radial motion that promotes particle collisions and mixing. At an inlet flow rate of 200 L h−1, the direction of radial velocity changes, with the fluid exhibiting centrifugal motion in most regions. As the flow rate increases to 250 L h−1, the radial velocity decreases. From the axial velocity distribution curve (Fig. 7b), it can be observed that at 150 L h−1, the axial velocity fluctuations are moderate, which enhances particle collisions and aggregation. At 200 L h−1, the strong fluid motion intensifies mixing and collisions, but excessive shear forces may hinder the stable formation of flocs. At 250 L h−1, there is little change in axial velocity, reflecting decreased energy utilization efficiency at higher flow rates. As shown in Fig. 7c and d, the resultant velocity fluctuations at section C are relatively moderate and uniform at 150 L h−1, providing sufficient mixing energy to promote particle collisions while avoiding excessive fluid motion that could damage flocs.
 | ||
| Fig. 7 Velocity and energy distribution curves of section C. (a) Radial velocity, (b) axial velocity, (c) resultant velocity, (d) turbulent kinetic energy. | ||
The velocity and energy distribution at section D are shown in Fig. 8, and S7† shows the velocity contours of the D position captured by PIV at different inlet flow rates. Section D is located between bubbled water inlet and the lowest vortex generator, and its velocity and energy distribution patterns differ significantly from those of sections A, B, and C. The radial velocity indicates that the fluid exhibits centrifugal motion on the left side and centripetal motion on the right, showing good symmetry in the radial movement. Except at an inlet flow rate of 50 L h−1, the peak radial velocities at other flow rates are similar but significantly higher than those in other sections. The strong centrifugal and centripetal motions at section D promote collision and combination among lighter components. From the axial velocity distribution (Fig. 8b), it can be observed that at 150 L h−1, the axial velocity at section D reaches its highest peak near 0.1 m, with a value close to 0.09 m s−1, indicating strong upward fluid motion. In most regions, the upward motion of the fluid is more pronounced, which helps the lighter components to rise. From the resultant velocity and TKE, the proportion of energy converted into fluid motion is higher at inlet flow rates of 150 and 200 L h−1, whereas an inlet flow rate of 250 L h−1 leads to energy waste.
 | ||
| Fig. 8 Velocity and energy distribution curves of section D. (a) Radial velocity, (b) axial velocity, (c) resultant velocity, (d) turbulent kinetic energy. | ||
The center of section E is located at the bottom of the reactor's inner cylinder, while the outer part lies within the outer cylinder. The velocity and energy distribution at this section are shown in Fig. 9, and S8† shows the velocity contours of the E position captured by PIV at different inlet flow rates. This section exhibits significantly different flow characteristics compared to the upper sections, such as section D. In the radial velocity distribution, the center of section E shows strong centripetal motion, with fluid converging towards the center. This inward flow results from the reduced size of the inner cylinder at this position, which limits space for fluid movement. The radial velocity in the outer cylinder region is close to zero, which helps prevent the flocs from being damaged during overflow from the outer cylinder. Similarly, the axial velocity in the inner cylinder region at the center of section E is high, with the fluid moving downward as it exits the inner cylinder. The axial velocity distribution in this area is uniform, which helps to avoid excessive floc contact that could lead to structural damage. From the resultant velocity and TKE at section E, it can be seen that higher inlet flow rates lead to greater resultant velocity. However, when the inlet flow rate reaches 250 L h−1, the increase in TKE is limited. Overall, an inlet flow rate of 150 L h−1 is optimal.
 | ||
| Fig. 9 Velocity and energy distribution curves of section E. (a) Radial velocity, (b) axial velocity, (c) resultant velocity, (d) turbulent kinetic energy. | ||
Analysis of the flow field distribution reveals that fluid motion characteristics within the MCFR are significantly influenced by the inlet flow rate and vortex generators. The velocity distributions determine the mixing and collision efficiency in various regions. At low flow rates (50 L h−1), fluid fluctuations are minimal, resulting in poor particle collisions and limited flocculation. As the flow rate increases to 100–150 L h−1, TKE are significantly enhanced, promoting particle mixing and effective flocculation. However, at excessively high flow rates (250 L h−1), energy losses increase, potentially causing floc breakage. In conclusion, appropriate flow velocities within the MCFR can effectively enhance pollutant particle collisions and flocculation, thereby improving overall flocculation performance, particularly under moderate flow conditions (100–150 L h−1).
3.2. Flocculation performance of MCFR
After analyzing the flow field distribution at various characteristic sections of the MCFR, flocculation performance of the MCFR was further investigated by treating gas and oil field wastewater. Under conditions of an inlet flow rate of 100 L h−1 and a setting time of 30 minutes, the pollutant removal efficiency was first investigated at different PFS dosages, as shown in Fig. 10a. | ||
| Fig. 10 Pollutant removal efficiency of the MCFR under different reagent addition amounts. (a) PFS addition amount, (b) PAM addition amount (operate at a flow rate of 100 L h−1, a setting time of 30 minutes, and 20 °C). | ||
Turbidity removal was calculated using the eqn (2):
 | (2) |
Oil removal was calculated using the eqn (3):
 | (3) |
Settling time is defined as the duration from the end of the flocculation reaction to the point when sampling begins.50,51 To ensure consistency, we compared the pollutant removal efficiency by sampling at same settling time under each experimental condition. While oil removal specifically quantifies the efficiency of separating oil droplets, turbidity removal reflects the removal of a broader spectrum of particulate matter, including emulsified oil and fine solids that contribute to overall water cloudiness. This dual-parameter approach offers a more comprehensive understanding of the reactor's performance. As PFS dosage increases from 30 mg L−1 to 70 mg L−1, pollutant removal efficiency rises accordingly. At 30 mg L−1, removal rates are relatively low, with turbidity removal around 42% and oil content around 24%. When the PFS dosage reaches 70 mg L−1, both turbidity and oil removal rates peak at approximately 75% and 53%, respectively. However, as the PFS dosage continues to increase beyond 70 mg L−1, the pollutant removal efficiency begins to decline.
Suspended solids and oil droplets in oilfield wastewater typically carry a negative charge, creating electrostatic repulsion that keeps pollutants dispersed and stable in the water.52 This stability makes it difficult for particles to destabilize and settle, and for oil droplets to coalesce and float. PFS primarily destabilizes pollutants through charge neutralization. In the MCFR, PFS fully contacts the pollutants, causing suspended particles to destabilize and settle, while oil droplets coalesce and float after destabilization. PFS is a highly charged flocculant. When introduced into the synthetic wastewater, PFS interacts with negatively charged particles through charge neutralization. This interaction reduces the repulsive forces between pollutants, allowing them to come closer together.50 PFS can also adsorb onto particle surfaces, promoting the formation of micro flocs as particles agglomerate.53 However, when the PFS concentration is too low, charge neutralization is inadequate, meaning a large number of pollutants cannot be destabilized zed. As a result, insufficient floc formation occurs, leading to low pollutant removal efficiency.54,55 When the PFS dosage exceeds 70 mg L−1, the system may become overloaded with positive charges, potentially causing previously neutralized pollutants to acquire a positive charge, which introduces new electrostatic repulsion. This repulsion can lead to the re-dispersion of pollutants, hindering the flocculation process and ultimately reducing pollutant removal efficiency. These results suggest that 70 mg L−1 is the optimal PFS dosage. We chose to first vary the PFS concentration because its role in charge neutralization and initial particle aggregation is fundamental. Once an optimal PFS concentration was identified, we then optimized the PAM concentration based on the established PFS concentration. This approach ensures that PAM can function effectively, as its bridging capacity is most efficient when the initial particle aggregation is stable. If PAM were increased without first optimizing PFS, it could lead to ineffective flocculation, as the initial aggregation may not be stable enough to support further floc formation.
With the PFS dosage maintained at 70 mg L−1, the effect of different PAM dosages on pollutant removal efficiency was studied, and the results are shown in Fig. 10b. As the PAM dosage increased from 0.2 mg L−1 to 0.6 mg L−1, the turbidity removal rate rises from 80% to 95%, while oil removal increases from 59% to 94%. Beyond this point, further increases in PAM dosage leads to a stabilization of pollutant removal rates, indicating that 0.6 mg L−1 is the optimal PAM dosage. PAM is commonly used in flocculation for its ability to bridge particles and promote agglomeration. PAM molecules adsorb onto particle surfaces, forming physical bridges that bring particles together, facilitating the formation of larger, settleable flocs.56 However, once the PAM concentration reaches a certain level, all the flocs formed by the PFS that can bind with PAM are fully encapsulated and stabilized.57 Excessive PAM beyond this point does not contribute to further floc formation or increase the number of flocs, resulting in a plateau in removal efficiency. Additionally, too much PAM can lead to over-crosslinking, creating oversized flocs, their large size reduces their settling velocity, negatively affecting the removal efficiency.58 The unique structure of the MCFR allows for sufficient efficacy of the PAM molecular chains in bridging pollutants, facilitating the formation of dense, large flocs. These flocs can also trap smaller pollutants, further enhancing pollutant removal efficiency. However, when the PAM dosage is too high, the existing amount of PAM is already sufficient to optimize the flocculation process, and further increases in dosage do not significantly improve removal efficiency. Excessive PAM addition can also increase the viscosity of the wastewater, which may hinder the sedimentation and flotation of pollutants.
With the optimal dosages of PFS and PAM determined as 70 mg L−1 and 0.6 mg L−1, respectively, the effect of different inlet flow rates on pollutant removal efficiency in the MCFR was studied, as shown in Fig. 11. At an inlet flow rate of 50 L h−1, turbidity and oil removal rates are 87% and 93%, respectively. This flow rate yields the lowest turbidity removal among the tested rates, while oil removal is relatively high. According to the fluid analysis, the low radial and axial velocities at 50 L h−1, combined with minimal fluid fluctuations and low TKE, result in a low collision frequency between particles, slowing floc formation and reducing turbidity removal efficiency.
 | ||
| Fig. 11 Pollutant removal efficiency of the MCFR at different inlet flow rates (operate at PFS and PAM dosages of 70 mg L−1 and 0.6 mg L−1, a setting time of 30 minutes, and 20 °C). | ||
When the inlet flow rate increases to 100 L h−1, turbidity removal rises to 95%, and oil removal slightly increases to 94%. At this flow rate, the MCFR shows symmetrical velocity and energy distribution, which enhance particle collisions and result in more uniform floc formation. The increased collision intensity between droplets promotes the formation of larger oil droplets, slightly improving oil removal efficiency. At an inlet flow rate of 150 L h−1, turbidity removal reaches its maximum at around 97%, while oil removal decreases to 85%. This flow rate provides symmetrical velocity and energy distribution, which facilitate particle collision and adhesion, promoting floc growth. The higher collision intensity also aids in the entrapment of fine particles by the flocs, further improving turbidity removal. However, the reduced flow time at this flow rate leads to a decrease in oil removal efficiency. When the inlet flow rate is further increased to 250 L h−1, turbidity and oil removal rates drop to 91% and 56%, respectively. Excessively high inlet flow rates reduce the flow time of wastewater in the MCFR and disrupt the symmetry of velocity and energy distribution, leading to localized areas of excessive energy that can cause floc breakage, thus reducing pollutant removal efficiency. The above analysis suggests that inlet flow rates between 100 and 150 L h−1 are optimal for achieving the highest flocculation efficiency in the MCFR.
After determining the optimal dosages of PFS (70 mg L−1), PAM (0.6 mg L−1) and the optimal inlet flow rate (100–150 L h−1) for treating oilfield wastewater with the MCFR, a comparative study was conducted between the MCFR and a traditional stirred flocculation reactor under the same dosages and setting time. The stirred reactor used in our experiments is a 2 L cylindrical vessel with a standard four-blade impeller. The Reynolds number for the stirred reactor was calculated using the eqn (4):
 | (4) |
090.
The power number (P) was determined using the eqn (5):
| P = NPρN3D5 | (5) |
 | (6) |
The pollutant removal efficiencies at different setting times are shown in Fig. 12. As shown in Fig. 12a, the MCFR achieves a higher turbidity removal rate than the stirred flocculation reactor even at a setting time of 5 minutes, with removal rates of 53% and 49%, respectively. As setting time increases, the gap in turbidity removal efficiency between the two reactors widens, with the MCFR consistently outperforming the stirred flocculation reactor. At 30 minutes, the turbidity removal rates reach 95% for the MCFR and 82% for the stirred reactor. For oil removal, Fig. 12b highlights the clear advantage of the MCFR. Since the MCFR primarily removes oil through flotation, its oil removal efficiency reaches 87% at a setting time of 5 minutes, compared to only 40% for the stirred flocculation reactor. As setting time increases, the MCFR's oil removal efficiency shows a slight increase but remains relatively stable. In contrast, the oil removal efficiency of the stirred reactor improves significantly with longer setting times, reaching 94% for the MCFR and 78% for the stirred reactor at 30 minutes.
 | ||
| Fig. 12 Comparison of pollutant removal efficiency between the MCFR and a stirred reactor at different settling times. (a) Turbidity removal rate, (b) oil content removal rate (operate at PFS and PAM dosages of 70 mg L−1 and 0.6 mg L−1, and 20 °C, MCFR operate at a flow rate of 100 L h−1). | ||
The stirred flocculation reactor removes oil primarily by using flocculants to aggregate small oil droplets into larger ones, which then naturally float and collect on the wastewater surface, requiring further treatment and increasing process complexity. In contrast, the MCFR integrates the advantages of both flocculation and flotation, efficiently removing both lighter and heavier pollutants. For denser pollutants, the vortex generators in the MCFR enhance particle collisions, enabling rapid floc formation and faster sedimentation. For lighter components, such as oil, bubbles in the MCFR carry these components to the top of the reactor for easy removal. Moreover, the MCFR requires shorter reaction times and can operate continuously, whereas the stirred flocculation reactor requires treatment times exceeding 20 minutes and cannot operate continuously due to its dependence on varying stirring speeds. In terms of treatment efficiency, operational stability, and ease of operation, the MCFR outperforms the traditional stirred flocculation reactor.
4. Conclusions
This study developed and evaluated a novel multi-stage cascade flocculation and flotation reactor for the treatment of oilfield wastewater, characterized by high oil content and suspended solids. Based on a detailed flow field analysis and experimental validation, the following conclusions can be drawn:(1) Optimized flow field distribution: the MCFR, equipped with vortex generators, creates a dynamic flow environment that promotes efficient mixing and particle collisions at optimal flow rates of 100–150 L h−1. At these flow rates, symmetrical velocity and high-energy mixing zones facilitate the initial formation and growth of flocs, while excessive flow rates (250 L h−1) cause high shear forces that may disrupt floc stability.
(2) Enhanced pollutant removal efficiency: experimental results show that, with the addition of 70 mg L−1 of PFS and 0.6 mg L−1 of PAM, the MCFR achieves high pollutant removal rates, with turbidity and oil removal efficiencies reaching 95% and 94%, respectively. These results indicate that precise control of flocculant dosage and flow rates is critical to maximizing treatment effectiveness.
(3) Superior performance compared to a stirred flocculation reactor: compared to a traditional stirred flocculation reactor, the MCFR demonstrates significantly higher removal efficiencies with a shorter time. The MCFR achieves optimal performance with a reaction time of less than 1 minute and supports continuous operation, whereas conventional reactors require up to 21 minutes and batch processing, resulting in higher energy consumption and lower operational efficiency.
In summary, the MCFR's multi-stage design and integrated flocculation–flotation mechanisms provide a practical solution for treating complex gas and oil field wastewater, combining rapid processing, high pollutant removal efficiency, and operational flexibility. This study provides valuable insights into reactor design, offering a foundation for future research in advanced wastewater treatment technologies for the oil and gas industry.
Data availability
The data that support the findings of this study are available on request from the corresponding author, Xing Liang, upon reasonable request.Author contributions
Qingji Wang: data curation, writing original draft, funding acquisition. Hao Wang: visualization, investigation. Xiumei Sun: review & editing. Liang Li: review & editing. Xing Liang: writing, review & editing, project administration.Conflicts of interest
The authors declare no competing financial interest.Acknowledgements
The authors are grateful to Science and Technology Project of China National Petroleum Corporation Limited (2023ZZ1305).References
- X. Chunyan, M. A. Qaria, X. Qi and Z. Daochen, The role of microorganisms in petroleum degradation: Current development and prospects, Sci. Total Environ., 2023, 865, 161112, DOI:10.1016/j.scitotenv.2022.161112.
- J. Li, F. Lin, K. Li, F. Zheng, B. Yan, L. Che, W. Tian, G. Chen and K. Yoshikawa, A critical review on energy recovery and non-hazardous disposal of oily sludge from petroleum industry by pyrolysis, J. Hazard. Mater., 2021, 406, 124706, DOI:10.1016/j.jhazmat.2020.124706.
- H. Zhang, Z. Gong, L. Liu, Z. Wang and X. Li, Study on the migration characteristics of sulfur and nitrogen during combustion of oil sludge with CaO additive, Energy Fuels, 2020, 34, 6124, DOI:10.1021/acs.energyfuels.0c00545.
- Q. Lei, Y. Xu, Z. Yang, B. Cai, X. Wang, L. Zhou, H. Liu, M. Xu, L. Wang and S. Li, Progress and development directions of stimulation techniques for ultra-deep oil and gas reservoirs, Pet. Explor. Dev., 2021, 48, 221, DOI:10.1016/S1876-3804(21)60018-6.
- A. C. Klemz, S. E. Weschenfelder, S. Lima De Carvalho Neto, M. S. Pascoal Damas, J. C. Toledo Viviani, L. P. Mazur, B. A. Marinho, L. D. S. Pereira, A. Da Silva, J. A. Borges Valle, A. A. U. de Souza and S. M. A. G. U. De Souza, Oilfield produced water treatment by liquid-liquid extraction: A review, J. Pet. Sci. Eng., 2021, 199, 108282, DOI:10.1016/j.petrol.2020.108282.
- T. Leshuk, T. Wong, S. Linley, K. M. Peru, J. V. Headley and F. Gu, Solar photocatalytic degradation of naphthenic acids in oil sands process-affected water, Chemosphere, 2016, 144, 1854, DOI:10.1016/j.chemosphere.2015.10.073.
- A. Husain and M. A. Al-Harthi, Chemical treatment of oilfield wastewater and the effect of temperature on treatment efficiency: A review, J. Pet. Sci. Eng., 2023, 220, 111089, DOI:10.1016/j.petrol.2022.111089.
- Z. Peng, J. Xu, S. Rong, M. Zhang, L. Wang, H. Jin and L. Guo, Clean treatment and resource utilization of oilfield wastewater using supercritical water gasification, J. Cleaner Prod., 2023, 411, 137239, DOI:10.1016/j.jclepro.2023.137239.
- H. Zhang, H. Yu, C. Sun, Y. Tong, J. Deng, L. Wu, L. Sun, S. Guo and H. Liu, Evaluation of new hydrophobic association inorganic composite material as coagulant for oilfield wastewater treatment, Sep. Purif. Technol., 2021, 275, 119124, DOI:10.1016/j.seppur.2021.119126.
- Y. Fu, Y. Jiang, Q. Hu, T. Luo, Y. Li, L. Zhian, Z. Wang and X. Yin, Fracturing flowback fluids from shale gas wells in western chongqing: Geochemical analyses and relevance for exploration & development, J. Nat. Gas Sci. Eng., 2021, 88, 103821, DOI:10.1016/j.jngse.2021.103821.
- X. Zhou, H. Zhang, Y. Long, M. Song, R. Qiu, Y. Yan, X. Yang and Y. Liang, Sustainable and clean oilfield development: Optimal operation of wastewater treatment and recycling system, J. Cleaner Prod., 2020, 252, 119819, DOI:10.1016/j.jclepro.2019.119819.
- X. Zhou, Y. Liang, S. Xin, P. Di, Y. Yan and H. Zhang, A MINLP model for the optimal waterflooding strategy and operation control of surface waterflooding pipeline network considering reservoir characteristics, Comput. Chem. Eng., 2019, 129, 106512, DOI:10.1016/j.compchemeng.2019.106512.
- M. Roudneshin and A. Azadeh, A novel multi-objective fuzzy model for optimization of oil sludge management by considering Health, Safety and Environment (HSE) and resiliency indicators in a gas refinery, J. Cleaner Prod., 2019, 206, 559, DOI:10.1016/j.jclepro.2018.09.142.
- P. Li, D. Zhao, Y. Zhang, L. Sun, H. Zhang, M. Lian and B. Li, Oil-field wastewater treatment by hybrid membrane-aerated biofilm reactor (MABR) system, Chem. Eng. J., 2015, 264, 595, DOI:10.1016/j.cej.2014.11.131.
- X. S. Yi, S. L. Yu, W. X. Shi, S. Wang, N. Sun, L. M. Jin, X. Wang and L. P. Sun, Hydrodynamics behaviour of oil field wastewater advanced treatment by ultrafiltration process, Desalination, 2012, 305, 12, DOI:10.1016/j.desal.2012.06.012.
- Y. Zeng, C. Yang, J. Zhang and W. Pu, Feasibility investigation of oily wastewater treatment by combination of zinc and PAM in coagulation/flocculation, J. Hazard. Mater., 2007, 147, 991, DOI:10.1016/j.jhazmat.2007.01.129.
- S. Lee, B. Oh and J. Kim, Effect of various amendments on heavy mineral oil bioremediation and soil microbial activity, Bioresour. Technol., 2008, 99, 2578, DOI:10.1016/j.biortech.2007.04.039.
- H. Zhang, H. Yu, C. Sun, Y. Tong, J. Deng, L. Wu, L. Sun, S. Guo and H. Liu, Evaluation of new hydrophobic association inorganic composite material as coagulant for oilfield wastewater treatment, Sep. Purif. Technol., 2021, 275, 119126, DOI:10.1016/j.seppur.2021.119126.
- H. P. Vu, L. N. Nguyen, B. Emmerton, Q. Wang, P. J. Ralph and L. D. Nghiem, Factors governing microalgae harvesting efficiency by flocculation using cationic polymers, Bioresour. Technol., 2021, 340, 125669, DOI:10.1016/j.biortech.2021.125669.
- J. Xue, S. Peldszus, M. I. Van Dyke and P. M. Huck, Removal of polystyrene microplastic spheres by alum-based coagulation-flocculation-sedimentation (CFS) treatment of surface waters, Chem. Eng. J., 2021, 422, 130023, DOI:10.1016/j.cej.2021.130023.
- K. Rajala, O. Grönfors, M. Hesampour and A. Mikola, Removal of microplastics from secondary wastewater treatment plant effluent by coagulation/flocculation with iron, aluminum and polyamine-based chemicals, Water Res., 2020, 183, 116045, DOI:10.1016/j.watres.2020.116045.
- Z. Zhao, Y. Li, K. Muylaert and I. F. J. Vankelecom, Synergy between membrane filtration and flocculation for harvesting microalgae, Sep. Purif. Technol., 2020, 240, 116603, DOI:10.1016/j.seppur.2020.116603.
- M. Peydayesh, T. Suta, M. Usuelli, S. Handschin, G. Canelli, M. Bagnani and R. Mezzenga, Sustainable removal of microplastics and natural organic matter from water by coagulation-flocculation with protein amyloid fibrils, Environ. Sci. Technol., 2021, 55, 8848, DOI:10.1021/acs.est.1c01918.
- B. Li, J. Zhao, W. Ge, W. Li and H. Yuan, Coagulation-flocculation performance and floc properties for microplastics removal by magnesium hydroxide and PAM, J. Environ. Chem. Eng., 2022, 10, 107263, DOI:10.1016/j.jece.2022.107263.
- G. Kooijman, M. K. de Kreuk, C. Houtman and J. B. van Lier, Perspectives of coagulation/flocculation for the removal of pharmaceuticals from domestic wastewater: A critical view at experimental procedures, J. Water Process Eng., 2020, 34, 101161, DOI:10.1016/j.jwpe.2020.101161.
- S. Y. Cheng, P. Show, J. C. Juan, J. Chang, B. F. Lau, S. H. Lai, E. P. Ng, H. C. Yian and T. C. Ling, Landfill leachate wastewater treatment to facilitate resource recovery by a coagulation-flocculation process via hydrogen bond, Chemosphere, 2021, 262, 127829, DOI:10.1016/j.chemosphere.2020.127829.
- K. Saxena and U. Brighu, Comparison of floc properties of coagulation systems: Effect of particle concentration, scale and mode of flocculation, J. Environ. Chem. Eng., 2020, 8, 104311, DOI:10.1016/j.jece.2020.104311.
- L. Guérin, C. Coufort-Saudejaud, A. Liné and C. Frances, Dynamics of aggregate size and shape properties under sequenced flocculation in a turbulent Taylor-Couette reactor, J. Colloid Interface Sci., 2017, 491, 167, DOI:10.1016/j.jcis.2016.12.042.
- P. C. Nnaji, V. C. Anadebe, I. G. Ezemagu and O. D. Onukwuli, Potential of Luffa cylindrica seed as coagulation-flocculation (CF) agent for the treatment of dye wastewater: Kinetic, mass transfer, optimization and CF adsorption studies, Arabian J. Chem., 2022, 15, 103629, DOI:10.1016/j.arabjc.2021.103629.
- F. García-Ávila, D. Tenesaca-Pintado, F. Novoa-Zamora, E. A. Alfaro-Paredes, A. Avilés-Añazco, A. Guanuchi-Quito, M. D. Tonon-Ordoñez and C. Zhindón-Arévalo, Vertical tubular flocculator: Alternative technology for the improvement of drinking water treatment processes in rural areas, J. Environ. Manage., 2023, 331, 117342, DOI:10.1016/j.jenvman.2023.117342.
- L. Guérin, C. Frances, A. Liné and C. Coufort-Saudejaud, Fractal dimensions and morphological characteristics of aggregates formed in different physico-chemical and mechanical flocculation environments, Colloids Surf., A, 2019, 560, 213, DOI:10.1016/j.colsurfa.2018.10.017.
- Z. Lin, C. Li, X. Zhang and H. Zhang, Study on the characteristics and mechanism of the flocculation behaviour in a novel fluidized bed flocculator, Sep. Purif. Technol., 2023, 307, 122724, DOI:10.1016/j.seppur.2022.122724.
- W. He, Z. Xie, Z. Zhao, M. Huang and M. Pan, Effect of impeller clearance on floc growth behaviors in a baffled square stirred-tank reactor: Flocculation-test and CFD-aided studies, Sep. Purif. Technol., 2019, 212, 233, DOI:10.1016/j.seppur.2018.11.020.
- W. He, Z. Zhao, J. Nan, Z. Xie and W. Lu, The role of mixing hydrodynamics on floc growth in unbaffled square stirred-tank reactors for flocculation, J. Environ. Chem. Eng., 2018, 6, 3041, DOI:10.1016/j.jece.2018.04.055.
- R. Li and X. Li, Recovery of phosphorus and volatile fatty acids from wastewater and food waste with an iron-flocculation sequencing batch reactor and acidogenic co-fermentation, Bioresour. Technol., 2017, 245, 615, DOI:10.1016/j.biortech.2017.08.199.
- C. Wang, M. Jin, S. Yue, X. Wang, B. Liu, Y. Shi, N. Qiao and D. Yu, Computational fluid dynamics analysis of Trichosporon fermentans flocculation in refined soybean oil wastewater and flocculation rate prediction method, Sci. Total Environ., 2022, 835, 155415, DOI:10.1016/j.scitotenv.2022.155415.
- D. Zhou, S. Dong, L. Gao, R. Ju and S. Niu, Effect of double-stage velocity gradients on abatement and morphology characteristics of flocs in a conical fluidized-bed flocculator, Sep. Purif. Technol., 2012, 98, 383, DOI:10.1016/j.seppur.2012.07.016.
- H. Zhang, H. Yu, C. Sun, Y. Tong, J. Deng, L. Wu, L. Sun, S. Guo and H. Liu, Evaluation of new hydrophobic association inorganic composite material as coagulant for oilfield wastewater treatment, Sep. Purif. Technol., 2021, 275, 119126, DOI:10.1016/j.seppur.2021.119126.
- L. You, B. Xie, J. Yang, Y. Kang, H. Han, L. Wang and B. Yang, Mechanism of fracture damage induced by fracturing fluid flowback in shale gas reservoirs, Nat. Gas Ind. B, 2019, 6, 366–373, DOI:10.1016/j.ngib.2018.12.005.
- H. Su, J. Lin, Q. Chen, C. Wu and F. Xu, A novel approach to reducing the biological toxicity of shale gas fracturing flowback fluid through recycling of high-value nano-BaSO4, J. Cleaner Prod., 2023, 414, 137443, DOI:10.1016/j.jclepro.2023.137443.
- H. Ren, H. Mao, W. Jin, J. Wang, L. Ma and B. Wang, Treatment for hydraulic fracturing flowback fluid of shale gas by ceramic membrane-ED-H/L pressure RO process, J. Water Process Eng., 2023, 52, 103551, DOI:10.1016/j.jwpe.2023.103551.
- D. I. M. Al-Risheq, S. M. R. Shaikh, M. S. Nasser, F. Almomani, I. A. Hussein and M. K. Hassan, Influence of combined natural deep eutectic solvent and polyacrylamide on the flocculation and rheological behaviors of bentonite dispersion, Sep. Purif. Technol., 2022, 293, 121109, DOI:10.1016/j.seppur.2022.121109.
- M. Wu, H. Song, X. Liang, N. Huang and X. Li, Generation of micro-nano bubbles by self-developed swirl-type micro-nano bubble generator, Chem. Eng. Process., 2022, 181, 9, DOI:10.1016/j.cep.2022.109136.
- D. Liu, X. Liang, M. Wu and X. Li, Removal of ultrafine colloidal particles from shale gas fracturing flowback fluid by microbubble-intensified flocculation: Effect of microbubble size, J. Water Process Eng., 2023, 52, 103541, DOI:10.1016/j.jwpe.2023.103541.
- B. Qiu, B. Du, C. Huang, W. Chen, J. Yan and B. Wang, The numerical simulation of the flow distribution and flow-induced vibration analysis for intermediate heat exchanger in a pool-type fast breeder reactor, Prog. Nucl. Energy, 2021, 131, 103605, DOI:10.1016/j.pnucene.2020.103605.
- S. Wang, H. Li, R. Wang, X. Wang, R. Tian and Q. Sun, Effect of the inlet angle on the performance of a cyclone separator using CFD-DEM, Adv. Powder Technol., 2019, 30, 227, DOI:10.1016/j.apt.2018.10.027.
- P. Jarvis, B. Jefferson, J. Gregory and S. A. Parsons, A review of floc strength and breakage, Water Res., 2005, 39, 3121, DOI:10.1016/j.watres.2005.05.022.
- M. R. MacIver and M. Pawlik, A floc structure perspective on sediment consolidation in thickened tailings, Chem. Eng. Sci., 2022, 263, 118095, DOI:10.1016/j.ces.2022.118095.
- X. Liang, M. Wu, X. Yang, Y. Mu, C. Cui, L. Li, H. Zhang and X. Li, Intensification of flocculation efficiency in multi-stage reactors by optimizing the multi-cone segment configuration, J. Environ. Chem. Eng., 2024, 12, 114727, DOI:10.1016/j.jece.2024.114727.
- J. Dotto, M. R. Fagundes-Klen, M. T. Veit, S. M. Palácio and R. Bergamasco, Performance of different coagulants in the coagulation/flocculation process of textile wastewater, J. Cleaner Prod., 2019, 208, 656, DOI:10.1016/j.jclepro.2018.10.112.
- M. Nadella, R. Sharma and S. Chellam, Fit-for-purpose treatment of produced water with iron and polymeric coagulant for reuse in hydraulic fracturing: Temperature effects on aggregation and high-rate sedimentation, Water Res., 2020, 170, 115330, DOI:10.1016/j.watres.2019.115330.
- C. Zhao, J. Zhou, Y. Yan, L. Yang, G. Xing, H. Li, P. Wu, M. Wang and H. Zheng, Application of coagulation/flocculation in oily wastewater treatment: A review, Sci. Total Environ., 2021, 765, 142795, DOI:10.1016/j.scitotenv.2020.142795.
- L. You, B. Xie, J. Yang, Y. Kang, H. Han, L. Wang and B. Yang, Mechanism of fracture damage induced by fracturing fluid flowback in shale gas reservoirs, Nat. Gas Ind. B, 2019, 6, 366, DOI:10.1016/j.ngib.2018.12.005.
- H. Su, J. Lin, Q. Chen, C. Wu and F. Xu, A novel approach to reducing the biological toxicity of shale gas fracturing flowback fluid through recycling of high-value nano-BaSO4, J. Cleaner Prod., 2023, 414, 137443, DOI:10.1016/j.jclepro.2023.137443.
- H. Ren, H. Mao, W. Jin, J. Wang, L. Ma and B. Wang, Treatment for hydraulic fracturing flowback fluid of shale gas by ceramic membrane-ED-H/L pressure RO process, J. Water Process Eng., 2023, 52, 103551, DOI:10.1016/j.jwpe.2023.103551.
- H. Wang, Y. Zhang, G. Wang, Y. Ma, H. Pu, W. Xu, D. Gao, Q. Zhang, H. Xu, B. Wang, X. Qi and J. Yang, A molecular-based design of RGO/TiO2-PAM composite flocculant with photocatalytic self-degrading characteristics and the application of the oil sand tailings flocculant, ACS Sustain. Chem. Eng., 2019, 7, 6758–6768, DOI:10.1021/acssuschemeng.8b06041.
- X. Luo, X. Li, C. Wei, X. Shi, S. Zheng and Z. Deng, Use of carbon dioxide to enhance the brine purification and flocculation performance of PAM flocculants, Sep. Purif. Technol., 2021, 267, 118676, DOI:10.1016/j.seppur.2021.118676.
- M. Wang, M. Wang, D. Chen, Q. Gong, S. Yao, W. Jiang and Y. Chen, Evaluation of pre-treatment techniques for shale gas produced water to facilitate subsequent treatment stages, J. Environ. Chem. Eng., 2019, 7, 102878, DOI:10.1016/j.jece.2019.102878.
Footnote |
| † Electronic supplementary information (ESI) available. See DOI: https://doi.org/10.1039/d4ra07770a |
| This journal is © The Royal Society of Chemistry 2025 |