
 Open Access Article
 This Open Access Article is licensed under a Creative Commons Attribution-Non Commercial 3.0 Unported Licence
Gamma-induced one-step synthesis of reduced graphene oxide–silver nanoparticles with enhanced properties†
Souad
Abou Zeid
 *a,
Liran
Hu
a,
Rasta
Ghasemi
b,
Matthieu
Gervais
c,
Jaspreet Kaur
Randhawa
d,
Prem Felix
Siril
e and
Samy
Remita
*af
*a,
Liran
Hu
a,
Rasta
Ghasemi
b,
Matthieu
Gervais
c,
Jaspreet Kaur
Randhawa
d,
Prem Felix
Siril
e and
Samy
Remita
*af
aInstitut de Chimie Physique, ICP, UMR 8000, CNRS, Université Paris-Saclay, bâtiment 349, Campus d’Orsay, 15 avenue Jean Perrin, 91405 Orsay Cedex, France. E-mail: souadabouzeid321@gmail.com; samy.remita@universite-paris-saclay.fr
bInstitut d’Alembert, IDA, ENS Paris-Saclay, 4 Avenue des sciences, 91190 Gif-sur-Yvette, France
cLaboratoire Procédés et Ingénierie en Mécanique et Matériaux, PIMM, Arts et Métiers ParisTech, UMR 8006, CNRS, CNAM, HESAM université, 151 boulevard de l’hôpital, 75013 Paris, France
dSchool of Mechanical and Materials Engineering, Indian Institute of Technology Mandi, Mandi 175005, Himachal Pradesh, India
eSchool of Chemical Sciences, Indian Institute of Technology Mandi, Mandi, Himachal Pradesh 175005, India
fDépartement Chimie Vivant Santé, EPN 7, Conservatoire National des Arts et Métiers, CNAM, 292 rue Saint-Martin, 75141 Paris Cedex 03, France
First published on 28th January 2025
Abstract
This study presents a novel gamma-induced one-pot synthesis of reduced graphene oxide–silver nanoparticle (rGO–Ag NPs) nanocomposites. Syntheses were conducted in a deoxygenated aqueous medium containing 0.2 g L−1 graphene oxide (GO), silver ions (10−3 or 10−2 mol L−1), and 0.2 mol L−1 isopropanol at ambient temperature and pressure. Multi-technique characterization confirmed the reduction of GO and silver ions, forming nanocomposites with significantly improved physicochemical and electrochemical properties compared to pristine GO, rGO alone, and rGO–Ag NPs prepared by other methods. UV-Vis absorption spectroscopy revealed tunable optical properties, while UPS measurements provided insights into the energy band structure, highlighting interactions between rGO and Ag NPs that enhance electronic properties. XPS and ATR-FTIR confirmed the successful reduction processes. SEM–EDX analyses demonstrated uniform silver nanoparticle distribution on rGO sheets. The C/O ratio significantly increased after irradiation, with values of 10.8 and 9.6 for composites synthesized with 10−3 and 10−2 mol L−1 in silver ions, respectively, compared to 11.2 for rGO alone. Raman spectroscopy showed a lower intensity ratio (ID/IG) between D and G bands (1.18 for nanocomposites vs. 1.40 for rGO), indicating fewer structural defects. Improved thermal stability was evidenced by reduced weight loss (10%) at 300–800 °C. Electrochemical studies revealed exceptional specific capacitance values of 218 F g−1 (10−3 mol L−1 Ag+ at 50 kGy) and 298 F g−1 (10−2 mol L−1 Ag+ at 70 kGy), surpassing the 125.4 F g−1 for rGO alone. These findings highlight the potential of gamma-induced synthesis for producing rGO–Ag NPs nanocomposites for high-performance supercapacitor applications.
1. Introduction
Noble metal nanostructures, particularly those composed of silver (Ag) or gold (Au), have garnered significant interest due to their unique physical and chemical properties, which are intrinsically linked to their size, shape, and composition.1–4 These properties make noble metals highly valuable in a myriad of applications, ranging from catalysis and electronics to sensors and biomedical devices.5–9 However, the integration of noble metals with other functional materials has become an important strategy to enhance their performance and broaden their applicability.10–12 This synergy not only enhances the performance of the individual components but may also yield novel functionalities that are critical for advanced technological applications.13–16Among the materials that hold great promise for the development of noble metal-based composites, graphene and its derivatives stand out prominently. Graphene, a two-dimensional sp2-hybridized carbon allotrope, has revolutionized materials science due to its exceptional properties, including high electron mobility, excellent mechanical stiffness, extraordinary electronic transport, and high electrical conductivity.17–20 These characteristics position graphene as a crucial material for applications ranging from nanoelectronics and energy storage to biosensing and drug delivery.21–26
However, the scalable production of pristine graphene remains a significant challenge, driving researchers to explore alternative routes for synthesizing graphene-like materials.27 In this context, graphene oxide (GO) and reduced graphene oxide (rGO) have emerged as viable alternatives for large-scale production and application.28
GO, obtained via the oxidation of graphite, contains various oxygen-containing functional groups, such as epoxy, hydroxyl, carbonyl, and carboxyl moieties. These functionalities play a crucial role in modifying the electronic structure of graphene while significantly enhancing GO's processability and dispersibility in various solvents.29 This makes GO an ideal precursor for synthesizing graphene-based nanocomposites. The reduction of GO into rGO is a critical step in restoring the desirable characteristics of graphene while retaining some beneficial traits of GO that facilitate composite formation.30 Conventional methods for reducing GO include chemical techniques employing reducing agents such as hydrazine or sodium borohydride, as well as thermal and electrochemical reduction processes.31,32 Despite their effectiveness, these methods often present challenges, such as the use of hazardous chemicals, high energy consumption, and limitations in scalability.33 Moreover, achieving complete reduction of GO while maintaining structural integrity and ensuring the preservation of intrinsic properties remains a formidable obstacle in the field.27
In our previous work,32 we demonstrated the feasibility of using γ-ray irradiation to reduce GO through water radiolysis. This method not only proved to be efficient but also more environmentally friendly compared to conventional reduction techniques, which often rely on hazardous chemicals. However, we acknowledge that the use of γ-ray irradiation is not without its own environmental considerations, including the management of radioactive materials and the need for proper safety protocols. Despite these considerations, our study revealed that rGO produced through γ-ray irradiation exhibited a relatively high specific capacitance, indicating its significant potential for energy storage applications. Furthermore, we established an exponential correlation between capacitance and the absorbed dose of radiation, underscoring the tunability of the rGO properties through controlled irradiation. Notably, we determined that the theoretical absorbed dose required for complete reduction of 0.2 g L−1 GO is precisely 6 kGy (this value being contingent upon the specific characteristics of the commercial GO used in our experiments, such as oxidation rate), marking a clear benchmark for optimizing the reduction process. These findings highlighted the potential of radiolytic reduction as a scalable and effective approach for producing high-quality rGO, paving the way for its application in various graphene-based nanocomposites and advanced materials.
Building on these findings,32 this current research focuses on the one-pot radiolytic synthesis of rGO–Ag nanocomposites. The integration of silver nanoparticles with graphene-based materials provides an opportunity to synergistically enhance the properties of both components, leading to nanocomposites with superior functionalities.34–37 In catalytic applications, the presence of Ag NPs on the rGO surface can enhance electron transfer rates and increase the active surface area, leading to improved catalytic activity and stability.38,39 Similarly, in sensing applications, the combination yields heightened sensitivity and selectivity for various analytes.40,41 Furthermore, the antimicrobial properties conferred by AgNPs present potent antibacterial effects, making these nanocomposites valuable for water treatment and biomedical applications.42,43 In energy storage, rGO–Ag nanocomposites have shown promise as electrode materials with enhanced capacitance and charge transfer capabilities.44,45
Traditional synthesis methods for rGO–Ag nanocomposites often rely on hazardous reducing agents. These chemical reduction processes typically entail multi-step procedures and the use of surfactants to stabilize the nanoparticles.46,47 However, these surfactants can adversely affect the performance of the resulting composites due to their strong adsorption on the metal NPs, limiting the overall efficacy in practical applications.30,48,49 To address these limitations, alternative techniques have been developed.50–55 Thermal reduction and electrostatic assembly methods have shown promise, while recent studies have explored more innovative approaches. Li et al.54 demonstrated a facile and rapid microwave irradiation method, and Ali Mohamed et al.55 reported an eco-friendly sonication approach. These methods offer advantages such as reduced processing time and improved energy efficiency. However, challenges persist in terms of scalability, precise control over nanoparticle characteristics, and uniform dispersion of Ag NPs on the rGO surface. Moreover, these techniques may not fully meet the growing demand for sustainable and efficient synthesis methods. In this context, radiolytic synthesis emerges as an innovative alternative. Several studies have explored this approach, demonstrating its potential for producing high-quality rGO–Ag nanocomposites.56–60 However, many existing radiolytic methods still require multiple steps or additional reducing agents, leaving room for further optimization. Additionally, detailed analysis of nanocomposite properties has been limited in previous studies.
Our research focuses on a novel radiolytic synthesis method that offers several key advantages over existing techniques. This method utilizes a one-pot, single-step process without additional reducing agents, allowing for precise control over nanoparticle size and distribution. It ensures uniform dispersion of Ag NPs on the rGO surface, offers high reproducibility and scalability potential, and provides an environmentally friendly approach with minimal waste generation. The process employs gamma-irradiation to generate reducing species directly within the reaction medium via water radiolysis, enabling simultaneous reduction of graphene oxide and silver ions. The reducing power of species such as hydrated electrons (eaq−), hydrogen atoms (H˙) or isopropanol radicals, allows for precise and quantitative control over the reduction process. Moreover, gamma-irradiation produces reducing agents uniformly throughout the solution, ensuring a homogeneous initial dispersion of components—critical for achieving high monodispersity and reproducibility of formed nanostructures.61
Previous studies conducted in our laboratory have highlighted the benefits of the radiolytic approach compared to conventional chemical and electrochemical methods for fabricating metallic nanoparticles and conductive polymers.61–68 In particular, in our recent work,69 we demonstrated the efficient synthesis of rGO–Au nanocomposites using gamma irradiation, showcasing the effectiveness of this approach in producing high-quality nanomaterials. The self-regulating nature of gamma irradiation refers to its ability to generate reducing species uniformly and consistently throughout the reaction medium, enabling precise control over the reduction process without external intervention. This characteristic not only simplifies the synthesis process but also enhances the purity of the final product, making it particularly suitable for applications in catalysis, sensing, and environmental remediation.70
In this study, we will continue our exploration of the reduction of GO via radiolysis with an experimental approach involving the irradiation of aqueous solutions containing GO at a concentration of 0.2 g L−1, silver ions at concentrations of either 10−3 or 10−2 mol L−1 (from silver perchlorate), and isopropanol at 0.2 mol L−1 as a radical scavenger to enhance the stability of radiolytic species (Fig. 1(a)). By varying the absorbed dose and silver ion concentration, we aim to elucidate the formation mechanism of rGO–Ag nanocomposites and optimize synthesis conditions to achieve superior physicochemical properties.
 | ||
| Fig. 1 Schematic representation of the radiolytic synthesis of rGO–Ag NPs in aqueous solution (a). Photographs showing the effect of increasing absorbed dose on the one-step reduction of a degassed aqueous solution containing 0.2 mol L−1 IPA and 0.2 g L−1 of GO together with [Ag+]0 = 10−3 mol L−1 (series A) (b) or [Ag+]0 = 10−2 mol L−1 (series B) (c). | ||
This study not only seeks to deepen the understanding of radiolytic nanocomposite synthesis but also lays the groundwork for developing advanced materials with tailored properties. By offering a simple, environmentally friendly, and scalable synthesis route, our research addresses significant challenges in the field of nanomaterial production. The insights from this work are expected to impact a wide range of sectors, including energy storage, catalysis, sensing, and water purification, ultimately bridging the gap between laboratory-scale production and practical, large-scale applications of these advanced materials.
2. Materials and methods
2.1 Materials and reagents
The synthesis of reduced graphene oxide–silver nanocomposites was conducted using a variety of commercially sourced materials. Graphene oxide, serving as the precursor for reduced graphene oxide, was obtained in aqueous dispersion at a concentration of 4 g L−1 (CxOyHz, purity >95%) from Sigma Aldrich. The reduction process involved the use of anhydrous silver perchlorate (AgClO4) in a concentration of 97%, also sourced from Sigma Aldrich, which acted as the precursor for silver nanoparticles. Isopropanol (IPA) ((CH3)2CHOH, anhydrous, ≥99.5%) used at a concentration of 0.2 mol L−1 as a radical scavenger in the synthesis process, was also provided by Sigma Aldrich. Deionized water (DI), produced through a Millipore system with a resistivity of 18.2 MΩ cm, served as the solvent for all experimental procedures unless specified otherwise. This deionized water was utilized not only as a reaction medium but also as a reference standard during UV-Vis absorption spectroscopic measurements.To maintain an inert atmosphere during the experiments, nitrogen gas (N2) with a purity of ≥99.9% was employed for the degassing of the aqueous solutions; this nitrogen gas was obtained from Air Liquide. In the context of electrochemical experimentation, Nafion® 117 solution, comprising approximately 5% in a mixture of lower aliphatic alcohols and water, was utilized as a binder. Potassium hydroxide (KOH), sourced from Fisher Scientific, served as the electrolyte in the electrochemical characterizations. All chemicals were used as received, without undergoing further purification prior to experimentation.
2.2 Instrumentation of irradiation source
The irradiation source utilized in this study was a 60Co γ-source. The current activity of this source at the time of experimentation was approximately 3000 Curie (Ci). This source is securely housed in a lead container, allowing for precise mechanical control in raising and lowering the source during irradiation.Irradiation was performed within a panoramic chamber specifically designed to ensure safety and efficiency. Samples, comprised of aqueous solutions contained in glass vials, were placed on a fixed platform inside the chamber.
The intensity of the irradiation was quantified by the absorbed dose (D), which measures the amount of energy deposited in the irradiated solutions. The dose rate during the experiments was standardized at 3.3 kGy h−1, ensuring precise control over the dosing process while maximizing both safety and treatment efficacy during irradiation. This value was consistently used throughout our experiments to achieve the required irradiation dose effectively.
The dose rates were accurately determined using Fricke's dosimetry, which relies on the oxidation process of Fe2+ to Fe3+.71,72
2.3 Preparation of rGO–Ag nanocomposites via γ-irradiation
Prior to the experimental procedure, the commercial GO suspension was thoroughly shaken and allowed to stand undisturbed for 5 hours to prevent sedimentation. Subsequently, two separate 500 mL Erlenmeyer flasks were prepared, designated as flask A and flask B. Each flask contained aqueous solutions with consistent concentrations of GO (0.2 g L−1) and IPA (0.2 mol L−1) but with different concentrations of AgClO4. In flask A, the concentration was 10−3 mol L−1, while in flask B, it was increased to 10−2 mol L−1.To ensure homogeneity, the suspensions were thoroughly shaken before being transferred into two series of transparent glass vials (40 mL). Series A, corresponding to flask A, included 10 glass vials, while series B, corresponding to flask B, also comprised 10 glass vials. Each vial was sealed with septa and further protected from light exposure by wrapping them in aluminium foil due to the light sensitivity of Ag(I) silver salt.
To remove dissolved oxygen which could negatively impact the reduction process, the GO/Ag+ suspensions underwent N2 degassing for 20 minutes. Following the degassing process, the samples were subjected to gamma-irradiation using the 60Co γ-source at a dose rate of 3.3 kGy h−1. In series A, the samples were irradiated with increasing absorbed doses from 0 kGy up to a maximum of 50 kGy (samples A1 to A10, Fig. 1(b)). Meanwhile, series B samples were irradiated at doses increasing from 0 kGy to 70 kGy (samples B1 to B10, Fig. 1(c)).
The selection of absorbed doses was informed by previous studies. Our prior work indeed determined the reduction yield of the used commercial GO to be 3.3 × 10⁻⁵ g J−1, establishing that a theoretical dose of approximately 6 kGy is necessary for the quantitative reduction of 0.2 g L−1 of this GO in water in presence of 0.2 mol L−1 in isopropanol. In these conditions, isopropanol molecules scavenge H˙ and HO˙ radicals produced from water radiolysis, leading to isopropanol radicals, (CH3)2C˙OH, which act together with hydrated electrons (eaq−, also produced from solvent radiolysis) as reducing radicals.32 Additionally, earlier research demonstrated that the reduction yield of Ag+ ions (from silver perchlorate) was 6.2 × 10⁻⁷ mol J−1 in the same experimental conditions, in presence of 0.2 mol L−1 isopropanol. This reduction yield has been demonstrated to be the sum of the production yields of reducing species generated by water radiolysis: hydrated electrons, isopropanol radicals and potentially H˙ radicals, depending on Ag+ concentration.73 To quantitatively reduce 10−3 or 10−2 mol L−1 of Ag+ ions, absorbed doses of 1.7 kGy or 17 kGy were determined to be necessary, respectively. Thus, for the system containing 0.2 g L−1 of GO and 10−3 mol L−1 of Ag+ (series A), the theoretical absorbed dose required was calculated to be 7.7 kGy. In contrast, for the solution containing 0.2 g L−1 of GO and 10−2 mol L−1 of Ag+ (series B), the required reduction dose was calculated to be 23 kGy. These theoretical doses guided the selection of irradiation levels for the respective series studied in the present work.
After the irradiation process, the resultant products were collected through centrifugation at 7000 rpm for 15 minutes. The precipitated materials from each sample of the two series A and B were then dried in a hot air oven at 100 °C overnight to yield the dried products.
All experiments were conducted in duplicate to ensure reproducibility.
2.4 Reduction mechanisms and kinetics in radiolytic systems
Following the procedural description of the one-step gamma irradiation synthesis of rGO–Ag nanocomposites, it is essential to examine the underlying reduction mechanisms that drives this transformation. In our prior work,32 we detailed the water radiolysis process, describing the variety of reactive species produced under ionizing radiation and how they contribute to creating a reducing environment under controlled conditions. For the present study, which employs similar experimental parameters, these insights remain directly applicable.In our experiments, conducted at neutral pH and under a nitrogen atmosphere in the presence of isopropanol, water radiolysis generates reactive species that establish a strong reducing environment. Indeed, hydrated electrons (eaq−) and isopropanol radicals ((CH3)2C˙OH) act as reducing agents, where isopropanol not only scavenges HO˙ oxidative radicals but also contributes to the generation of additional reducing species, thus amplifying the overall reducing capacity.61,74,75
The reduction of GO in environments containing eaq− and (CH3)2C˙OH reactive species proceeds through multiple pathways targeting the oxygenated functional groups on GO. Hydrated electrons are for instance particularly effective in reducing epoxide and carbonyl groups present on GO sheets into hydroxyl groups. These hydroxyl groups can then undergo further reduction, restoring the sp2-bonded carbon structure essential for determining the material's electrical properties.
Through these reactions, the progressive deoxygenation of GO leads to the restoration of the graphitic sp2 carbon network, crucial for applications relying on the electrical and structural properties of rGO. Meanwhile, isopropanol radicals participate in the reduction process, primarily targeting hydroxyl and carbonyl groups, IPA radicals being oxidized by hydroxyl groups into acetone.
Simultaneously, the reduction of silver ions (Ag+) into zero-valent silver atoms (Ag0) occurs via multiple pathways, including interactions with hydrated electrons, isopropanol radicals, and hydrogen atoms. These reactions are summarized as follows:73,76,77
| Ag+ + eaq− → Ag0 | (1) |
| Ag+ + (CH3)2C˙OH → Ag0 + (CH3)2CO + H+ | (2) |
| Ag+ + H˙ → Ag0 + H+ | (3) |
Silver atoms are thermodynamically unstable. They aggregate into silver oligomers, then into bigger silver nanoparticles, the properties of which depend on particle size.73 Silver aggregation process can be summarized by the following reactions:
| Ag0 + Ag+ → Ag2+ | (4) |
| Agxp+ + Agym+ → Ag(x+y)(p+m)+ | (5) |
To mitigate and control aggregation, GO should serve as a stabilizing support, limiting particle growth, ensuring a uniform size distribution and enhancing the overall performances of the resulting rGO–Ag nanocomposites.
From a mechanistic point of view, it is important to consider the kinetic competition between two reduction mechanisms: the reduction of GO by eaq− and (CH3)2C˙OH on the one hand, and the reduction of Ag+ by the reducing species on the other hand. The reduction of GO by these reducing radicals has been investigated using pulse radiolysis. The rate constants obtained are approximately k1 = 2.8 × 10⁷ L g−1 s−1 for eaq− and  for (CH3)2C˙OH.78 It should be noted that these rate constants are expressed in L g−1 s−1 due to the unknown molar mass of GO. Also, the reduction of GO by eaq− occurs significantly faster than that by (CH3)2C˙OH. Similarly, Ag+ ions are reduced extremely rapidly by solvated electrons, with a rate constant roughly k2 = 3.6 × 10¹⁰ L mol−1 s−1.79 Furthermore, Ag+ can also be reduced by hydrogen atoms (H˙), with a rate constant of k3 = 1.5 × 10¹⁰
![[thin space (1/6-em)]](https://www.rsc.org/images/entities/char_2009.gif) L mol−1s−1.80 The contribution of H˙ to the reduction of Ag+ is particularly significant under the employed experimental conditions.
L mol−1s−1.80 The contribution of H˙ to the reduction of Ag+ is particularly significant under the employed experimental conditions.
To compare the kinetics of GO reduction with that of Ag+ ions, we can focus on their reactions with eaq−, which is the fastest route. Thus, we can estimate the competition ratio (R):
 | (6) |
This competition kinetics highlights the importance of carefully tuning reaction conditions, inter alia, by adjusting GO and Ag+ initial concentrations, to achieve optimal outcomes in the synthesis of rGO–Ag hybrid materials.
2.5 Characterization of rGO–Ag nanocomposites
The radiosynthesized materials were characterized using a comprehensive suite of analytical techniques to evaluate their chemical, optical, electronic, structural, morphological, thermal, and electrochemical properties. These analyses provide crucial insights into the formation, composition, and functionality of the materials, which are essential for their potential applications. All experiments were conducted in duplicate to ensure reproducibility.UV-Vis absorption spectroscopy was employed to investigate the evolution of GO and Ag+ concentrations in irradiated samples as a function of absorbed dose. This technique provided insights into the nature of the bonds and functional groups present, as well as their physicochemical and optical properties. Additionally, UV-Vis absorption spectroscopy allowed the determination of the band gap of synthesized hybrid material within each sample, confirming the reduction of GO into rGO and the conversion of Ag+ ions into Ag NPs. Absorption spectra were recorded using an Agilent/HP 8453 UV-Vis spectrophotometer over the wavelength range of 200–800 nm, with distilled water serving as a reference. Measurements were conducted immediately after gamma-irradiation, with a dilution factor of 10 applied to the second series of samples (series B) initially containing 0.2 g L−1 GO, 10−2 mol L−1 AgClO4, and 0.2 mol L−1 IPA.
Fourier transform infrared spectroscopy-attenuated total reflectance (FTIR-ATR) was utilized to examine the functional groups present in both irradiated and non-irradiated samples. The powdered samples were analyzed using a Bruker Vertex 70 spectrometer. They were placed on a diamond crystal attached to an ATR plate (Pike MIRacle™ crystal plate diamond/ZnSe) and scanned in the range of 4000–600 cm−1 using a mercury cadmium telluride (MCT) detector integrated with a liquid nitrogen cooling system for enhanced sensitivity. This characterization was vital for identifying changes in functional groups that occurred during irradiation.
Raman spectroscopy was employed to analyze the structural transformation of GO into rGO and the formation of rGO-based nanocomposites. Samples were prepared by depositing 20 μL of aqueous suspension onto indium tin oxide (ITO) substrates, followed by spin coating at 3000 rpm for 30 seconds and drying at 100 °C for 10 minutes. Raman spectra were recorded using a Horiba Lab RAM HR Evolution system with a 532 nm laser, set to a power of 1 mW, and focused with a 50× objective lens (0.5 NA). Analyzing the spectra in the range of 200–2000 cm−1 allowed the confirmation of changes in hybridization states and the crystalline quality of the synthesized materials.
X-ray photoelectron spectroscopy (XPS) and ultraviolet photoelectron spectroscopy (UPS) were carried out on thin films prepared on ITO substrates following the same preparation conditions as for Raman analysis. The XPS measurements were conducted using a Thermo Scientific NEXSA Surface Analysis System with a monochromatic Al Kα X-ray source (1486.6 eV) and a spherical analyzer. The data were analyzed with Thermo Scientific Avantage software. For UPS, He I radiation (hν = 21.22 eV) was used to probe the valence bands, providing insights into the electronic properties and surface characteristics of the materials.
Scanning electron microscopy (SEM) was utilized to observe the morphology of the synthesized materials using a HITACHI S3400N-IDA system. This technique was supplemented by energy dispersive X-ray spectroscopy (EDX) to assess the elemental composition. Samples were prepared by depositing a small quantity of solid material onto a carbon support. EDX analysis facilitated qualitative and quantitative assessments of the elemental constituents, collecting signals from defined areas imaged by SEM to yield average concentration values for each detected element.
Thermogravimetric analysis (TGA) was performed using a TGA Q500 (TA Instruments, USA) to evaluate the thermal stability and composition of the materials. The analysis was conducted under an oxygen flow rate of 60 mL min−1, covering a temperature range from 22 °C to 900 °C at a heating ramp rate of 10 °C min−1.
Cyclic voltammetry (CV) measurements were conducted using a Metrohm Autolab potentiostat equipped with Nova software to assess the electroactivity of the synthesized materials. For the electrochemical experiments, a conventional three-electrode cell configuration was utilized, employing an Ag/AgCl reference electrode, a platinum counter electrode, and a glassy carbon (GC) working electrode with a diameter of 3 mm and a surface area of 0.07 cm2. Prior to use, the working electrodes were polished using SiC-paper and thoroughly rinsed with ultrapure water (18.2 MΩ cm). The preparation of the samples involved utilizing 180 μL of a 0.2 g L−1 aqueous solution, to which 20 μL of Nafion was added as a binder. A 10 μL solution of each sample was then drop-casted onto the GC working electrode and allowed to dry slowly under ambient conditions. During the electrochemical measurements, a 0.1 M KOH aqueous electrolyte was utilized within a voltage range of −0.4 V to +0.4 V, with varied scan rates ranging from 10 to 200 mV s−1. This characterization aimed to calculate the specific capacitance of the samples, contributing to the understanding of their potential applications in energy storage.
2.6 Electronic and electrochemical characterization methods
| (αhν)r = A(hν − Eg) | (7) |
For an indirect transition semiconductor, as in the case of the synthesized nanocomposites, Eg was obtained by plotting (αhν)2 against hν and extrapolating the linear portion of the plot near the absorption onset.
Physical constants used in these calculations include:
– Speed of light: c = 3 × 10⁸ m s−1
– Planck's constant: h = 6.63 × 10⁻³⁴ J s
– Elementary charge: e = 1.6 × 10⁻¹⁹ C
Key definitions and calculations:
– Fermi level (EF): the highest occupied energy level by electrons at 0 K, situated within the conduction band in metals and in the band gap for semiconductors and insulators.
– Work function (WF): defined as the minimum energy required to move an electron from the Fermi level to the vacuum level (Nv), calculated as:
| WF = Nv − EF | (8) |
For semiconductors, the electron affinity (χ) is used in place of
WF, calculated as:
| χ = Nv − εC | (9) |
From UPS data, we identified the electron cutoff energy Ecut-off and calculated WF as:
| WF = 21.22 eV − Ecut-off | (10) |
With values of VBmax and WF, the valence band energy (VB) is given by:
| VB = VBmax + WF | (11) |
Using the previously calculated band gap, the conduction band energy (CB) was determined as:
| CB = VB − Eg | (12) |
The specific capacitance (Csp) was calculated using the following equation:
 | (13) |
 is the integrated voltammetric charge.
3. Results and discussions
3.1 Visual characterization and kinetic studies
The visual results from the sample of both series, A and B, before and after gamma irradiation at varying absorbed doses, are presented in Fig. 1(b) and (c), respectively. Post-irradiation visual assessments revealed pronounced alterations in color and morphology. Initially, both samples corresponding to series A (A1) and series B (B1) exhibited a characteristic brown hue, attributed to the mixture of colorless silver ions and brown colored graphene oxide. However, a significant change in color was detected upon irradiation, even at the lowest absorbed doses.In series A (Fig. 1(b)), the irradiation effects mirrored established behaviors of GO. Between absorbed doses of 1 and 3 kGy, the solution maintained a uniform dark appearance, indicative of the onset of reduction activity. An increase in the absorbed dose from 3 to 6 kGy facilitated the emergence of visible hydrophobic aggregates at the surface, culminating in sedimentation at higher doses. This enhancement in hydrophobicity correlates with a marked reduction in oxygen-containing functional groups on the GO, including –OH, –COOH, and epoxy groups, which are known to increase hydrophilicity via hydrogen bonding. As highlighted in our previous works, the gradual depletion of these groups under irradiation enhances hydrophobic interactions and re-establishes π–π stacking ones among the aromatic rings of GO, thus fostering aggregate formation as the absorbed dose surpassed 6 kGy. Notably, the reduction of silver ions at a concentration of 10−3 mol L−1 over a range of 1.7 kGy in series A was not distinctly observable, complicating the assessment of whether the reduction of silver ions outpaced that of GO.
Conversely, series B exhibited more pronounced color changes from the outset of irradiation. As shown in Fig. 1(c), transition to a grayish suspension occurred, with sedimentation becoming increasingly evident at elevated irradiation levels. Between 17 and 23 kGy, the formation of hydrophobic aggregates at the surface was observed, eventually leading to their settling at the bottom of the sample. This behavior indicates that the higher concentration of silver ions in series B (10−2 mol L−1) facilitated a more rapid reduction compared to GO. Specifically, complete reduction of silver ions occurred around 17 kGy, establishing a pivotal threshold at which significant reduction of GO commenced.
To quantitatively assess the kinetic processes across both series, the competition ratio R was calculated using eqn (6) derived in Section 2.4. The results from the experimental series are as follows:
– For series A:
 | (14) |
– For series B:
 | (15) |
From these initial findings, it can be concluded that rGO–Ag NPs composites have been successfully synthesized in a single experimental process. It is crucial to determine whether these rGO–Ag NP composites produced via radiolysis exhibit properties that are distinct from those of the individual components. Moreover, an exploration of how variations in absorbed dose and silver concentration influence the optical, electronic, structural, thermal, and capacitive properties of the radiosynthesized materials is essential. A comparative analysis of these properties with those of rGO–Ag NPs composites synthesized through alternative methods reported in the literature will provide valuable insights into the efficacy and uniqueness of this synthesis approach. These aspects will be systematically addressed in the subsequent sections.
3.2 UV-Vis absorption spectroscopy characterization
The UV-Vis spectra of samples from series A and B were systematically recorded before and after gamma-irradiation, as depicted in Fig. 2(a) and (b). These spectral analyses revealed significant alterations that correlate with the absorbed dose, providing critical insights into the reduction mechanisms of GO and silver ions. Initially, the absorption spectra for the unirradiated samples, A1 (0 kGy) and B1 (0 kGy), exhibited two distinct broad bands characteristic of GO: the first one centered around 230 nm, attributed to π → π* electronic transitions within the aromatic C![[double bond, length as m-dash]](https://www.rsc.org/images/entities/char_e001.gif) C bonds indicative of the graphitic structure, and the other one at approximately 295 nm, which corresponds to n → π* transitions associated with carbonyl CO functional groups.82 These spectral features establish a baseline for subsequent observations during the reduction process.
C bonds indicative of the graphitic structure, and the other one at approximately 295 nm, which corresponds to n → π* transitions associated with carbonyl CO functional groups.82 These spectral features establish a baseline for subsequent observations during the reduction process.
 | ||
| Fig. 2 UV-Vis monitoring of the radiolytic reduction of a solution containing GO (0.2 g L−1) in the presence of isopropanol (0.2 mol L−1) and [Ag+]0 = 10−3 mol L−1 (series A) (a) or [Ag+]0 = 10−2 mol L−1 (series B) (b), diluted tenfold. Reference: ultrapure water. Optical pathlength: 0.2 cm. Evolution of the energy gap (eV) as a function of the absorbed dose for series A (c) and series B (d). Experimental uncertainty for repeated measurements is less than 5%. Evolution of the energy gap (eV) of silver nanoparticles as a function of the absorbed dose for series A (e) and series B (f). The margin of error for the obtained values is less than 5%. | ||
Upon initiating gamma-irradiation, a marked increase in the intensity of the plasmon band which characterizes silver NPs was observed, reaching a peak at approximately 400 nm. This peak emerged and reached a maximum at an absorbed dose of 1.7 kGy for series A (Fig. 2(a)) and 17 kGy for series B (Fig. 2(b)), confirming the faster reduction of silver ions compared to that of GO, as already presumed (see R values) and in agreement with the visual observations (Fig. 1). The emergence of this plasmon band is pivotal as it indicates the conversion of Ag+ ions into Ag NPs, which is characterized by surface plasmon resonance (SPR). The physics of metallic nanoparticles dictates that when exposed to incident light, the free conduction electrons oscillate in response to the electric field of the light wave, creating a resonant condition known as SPR. For spherical silver nanoparticles, this resonance typically occurs within the wavelength range of 350–500 nm, peaking around 410 nm.83–85
As the absorbed dose increased, a notable red shift of the CC transition band from 230 nm to 265 nm was recorded at doses of 7.7 kGy for series A and 23 kGy for series B, these absorbed doses being the theoretical doses required for complete reduction of both GO and silver ions. This red shift is indicative of the effective reduction of GO to rGO, highlighting a structural transformation that enhances the electronic and optical properties of the material. Concurrently, a substantial decrease in absorbance at 295 nm was observed, which reflects the diminishing concentration of CO groups, further confirming the reduction of GO.86–89
Importantly, once the reduction of silver ions was considered complete at 1.7 kGy for series A and 17 kGy for series B, sedimentation of nanoparticle suspensions was noted. This phenomenon led to irreversible aggregation of the formed nanomaterials and a subsequent decrease in the absorbance for both Ag NPs (evidenced by reduced intensity of the plasmon band) and GO (indicated by decreased absorbance at 230–265 nm and at 295 nm). This sedimentation complicates the quantification of the reduction yield of GO at 295 nm, a challenge not encountered in prior studies.32 The spectral characteristics of the plasmon absorption band displayed intriguing differences between the two series. For series A, the plasmon band appeared symmetrical around 390 nm, indicative of relatively uniform nanoparticle size, while in series B, the plasmon band exhibited asymmetry with a peak at around 410 nm, suggesting the presence of larger and potentially more polydisperse nanoparticles. This observation emphasizes the critical role that silver ion concentration plays in determining nanoparticle morphology and size distribution.
The UV-Vis spectral analysis demonstrates the concomitant formation of predominantly spherical silver nanoparticles alongside rGO sheets throughout the irradiation process. The optimal theoretical absorbed dose for synthesizing hybrid rGO–Ag NPs, when [GO] = 0.2 g L−1 and [Ag+] = 10−3 mol L−1 (series A), is identified as 7.7 kGy, whereas for [Ag+] = 10−2 mol L−1 (series B), the required absorbed dose escalates to 23 kGy. Notably, the increase in Ag+ concentration from 10−3 to 10−2 mol L−1 did not significantly alter the kinetics of silver reduction or the overall nanoparticle morphology; however, it did result in a marked increase in the size and a broader size distribution of the resulting metallic structures. These findings collectively highlight the efficiency of gamma-irradiation as a versatile method for producing rGO–Ag NP hybrids, illustrating the ability to fine-tune their morphological and optical properties through careful manipulation of absorbed doses and silver ion concentrations.
Furthermore, leveraging the UV-Vis data illustrated in Fig. 2(a) and (b), the band gap values of all samples were determined. The energy gaps were extracted from the absorption data using Tauc plots, where the intersection with the x-axis indicates the energy gap for each sample. Tauc plots for series A and B are provided in Fig. S1 and S2 (ESI†). Fig. 2(c) and (d) demonstrate the evolution of the energy gap of the starting materials (GO–Ag+) as a function of the absorbed dose for both series. For series A (Fig. 2(c)), the energy gaps of the samples, Eg, including both non-irradiated and irradiated conditions, range from 4.4 eV to 3.1 eV. Notably, Eg value decreases significantly with increasing absorbed dose, reaching a value of 3.1 eV at an absorbed dose of 7.7 kGy, which coincides with the completion of the reduction process of both GO and Ag+ ions. Beyond this absorbed dose, at 10 kGy and higher, the energy gap value stabilizes at 3.1 eV. In contrast, for series B (Fig. 2(d)), the energy gaps span from 5.0 eV to 3.6 eV. A pronounced reduction in Eg value is observed up to approximately 23 kGy, an absorbed dose that theoretically corresponds to the complete reduction of silver ions and GO. Beyond this point, Eg value reaches a plateau around 3.6 eV. Importantly, the energy gap for series B, which features a higher concentration of Ag+ ions, is greater than that observed for series A.
The band gap energy of semiconducting silver nanoparticles depends on the size of the nanoparticles. For an indirect band gap, the literature estimates the band gap energy to range between 2.8–3.5 eV.90–93 As shown in Fig. S1 and S2 (ESI†), the data from this study reveal a distinct leftward shift in the band gap with increasing absorbed dose, suggesting a size-related impact on the electronic properties. To further investigate this trend, the energy gap data are summarized in Fig. 2(e) (series A) and Fig. 2(f) (series B) as a function of absorbed dose. Both series A and B show an initial energy gap of 3.5 eV at 0 kGy, with a final energy gap consistently recorded at 2.3 eV after irradiation. This indicates that while Ag+ ions concentration has minimal effect on the energy gap of the Ag NPs, it does influence the final energy gap in the nanocomposites, which are 3.1 eV for series A and 3.6 eV for series B, as it will be summarized in Tables 1–3.
| Series A | ||||||
|---|---|---|---|---|---|---|
| Samples | E g (eV) | VBmax (eV) | E cut-off (eV) | WF (eV) | VB (eV) | CB (eV) |
| A1 (0 kGy) | 4.4 | 2.0 | 16.2 | 5.0 | 7.0 | 2.6 |
| A2 (1 kGy) | 4.2 | 2.1 | 16.3 | 4.9 | 7.0 | 2.8 |
| A3 (1.7 kGy) | 4.0 | 2.1 | 16.3 | 4.9 | 7.0 | 3.0 |
| A4 (3 kGy) | 3.8 | 2.1 | 16.3 | 4.9 | 7.0 | 3.2 |
| A5 (6 kGy) | 3.5 | 2.1 | 16.3 | 4.9 | 7.0 | 3.5 |
| A6 (7.7 kGy) | 3.3 | 2.1 | 16.4 | 4.8 | 6.9 | 3.6 |
| A7 (10 kGy) | 3.2 | 2.2 | 16.5 | 4.7 | 6.9 | 3.7 |
| A8 (15 kGy) | 3.1 | 2.2 | 16.5 | 4.7 | 6.9 | 3.8 |
| A9 (30 kGy) | 3.1 | 2.2 | 16.5 | 4.7 | 6.9 | 3.8 |
| A10 (50 kGy) | 3.1 | 2.2 | 16.5 | 4.7 | 6.9 | 3.8 |
| Series B | ||||||
|---|---|---|---|---|---|---|
| Samples | E g (eV) | VBmax (eV) | E cut-off (eV) | WF (eV) | VB (eV) | CB (eV) |
| B1 (0 kGy) | 5.0 | 2.0 | 16.1 | 5.1 | 7.1 | 2.1 |
| B2 (6 kGy) | 5.0 | 2.1 | 16.2 | 5.0 | 7.1 | 2.1 |
| B3 (10 kGy) | 4.8 | 2.1 | 16.4 | 4.8 | 6.9 | 2.1 |
| B4 (17 kGy) | 3.8 | 2.2 | 16.5 | 4.7 | 6.9 | 3.1 |
| B5 (23 kGy) | 3.7 | 2.2 | 16.6 | 4.6 | 6.8 | 3.1 |
| B6 (30 kGy) | 3.7 | 2.3 | 16.7 | 4.5 | 6.8 | 3.1 |
| B7 (40 kGy) | 3.6 | 2.4 | 16.8 | 4.4 | 6.8 | 3.2 |
| B8 (50 kGy) | 3.6 | 2.5 | 16.9 | 4.3 | 6.8 | 3.2 |
| B9 (60 kGy) | 3.6 | 2.5 | 16.9 | 4.3 | 6.8 | 3.2 |
| B10 (70 kGy) | 3.6 | 2.5 | 16.9 | 4.3 | 6.8 | 3.2 |
| Samples | E g (eV) | VBmax (eV) | WF (eV) | VB (eV) | CB (eV) |
|---|---|---|---|---|---|
| GO (0.2 g L−1)–Ag+(0 mol L−1) at 0 kGy | 4.4 | 1.3 | 4.9 | 6.2 | 1.8 |
| rGO–Ag+(0 mol L−1) at 50 kGy | 3.3 | 1.7 | 4.3 | 6.0 | 2.7 |
| A1 (0 kGy): GO (0.2 g L−1)–Ag+(10−3 mol L−1) | 4.4 | 2.0 | 5.0 | 7.0 | 2.6 |
| A10 (50 kGy): rGO–Ag NPs | 3.1 | 2.2 | 4.7 | 6.9 | 3.8 |
| B1 (0 kGy): GO (0.2 g L−1)–Ag+(10−2 mol L−1) | 5.0 | 2.0 | 5.1 | 7.1 | 2.1 |
| B10 (70 kGy): rGO–Ag NPs | 3.6 | 2.5 | 4.3 | 6.8 | 3.2 |
3.3 UPS spectroscopy analysis and band diagram determination
After determining the energy gap values, it is essential to explore how absorbed doses influence the electronic properties of the rGO–Ag composites. In particular, the work function, conduction band, valence band, and Fermi level will be examined as a function of the absorbed dose for samples of both series A and B. These properties are pivotal in understanding the behavior of the composites, particularly their electronic and catalytic characteristics, under varying irradiation conditions.Before analyzing the evolution of these properties, it is important to note that the work function of Ag, like other metals, has been determined experimentally by various methods, including photoemission measurements, thermionic emission, and contact potential measurements.94–96 These techniques allowed the precise characterization of WF, which is critical in understanding the surface electronic properties of metals and their interaction with surrounding materials.
For silver, the reported WF value is approximately 4.3 eV.97 While this value is well established for bulk silver, changes in the WF can occur when silver is in nanoparticle form. It has been shown that the work function of nanoparticles, particularly those with diameters smaller than 20 nm, increases as their size decreases.98 Additionally, the interaction between Ag NPs and rGO substrate in rGO–Ag NPs composites may further influence the WF, a phenomenon that has not been extensively studied in the context of synthesized silver nanoparticle composites. This interaction, along with the irradiation-induced changes, is a key focus of the present study.
To investigate these interactions, UPS was employed to study the work function of irradiated and non-irradiated GO in the presence of silver ions at concentrations of 10−3 and 10−2 mol L−1. The UPS spectra for both series of samples (A and B) are shown in Fig. S3 and S4 (ESI†). The spectra were obtained using He I radiation (hν = 21.21 eV), and the values of VBmax and Ecut-off were extracted for analysis.
In Fig. 3(a), the UPS spectra for samples A1 (0 kGy), A6 (7.7 kGy), and A10 (50 kGy) from series A are presented, while in Fig. 3(b), the UPS spectra for samples B1 (0 kGy), B5 (23 kGy), and B10 (70 kGy) from series B are shown.
 | ||
| Fig. 3 Evolution of UPS spectra, obtained using HeI radiation (hν = 21.21 eV) for rGO–Ag NPs composites at varying absorbed doses: (a) series A ([Ag+]0 = 10−3 mol L−1, A1 (0 kGy), A6 (7.7 kGy), A10 (50 kGy)), (b) series B ([Ag+]0 = 10−2 mol L−1, B1 (0 kGy), B5 (23 kGy), B10 (70 kGy)). (c) Band diagrams illustrating changes in the electronic structure: GO before irradiation, rGO synthesized with 50 kGy irradiation without silver ions, and rGO–Ag NPs synthesized at 50 kGy ([Ag+]0 = 10−3 mol L−1, sample A10 (50 kGy)) and 70 kGy ([Ag+]0 = 10−2 mol L−1, sample B10 (70 kGy)). | ||
In the first series (A) (Fig. 3(a)), UPS spectra revealed a spectral shift to the left with increasing absorbed dose up to 7.7 kGy. However, at higher absorbed doses, the values of VBmax and Ecut-off remained constant, stabilizing at 2.2 eV and 16.5 eV, respectively. This trend indicates that the modification of the work function reaches a plateau after a certain absorbed dose, reflecting a saturation of changes in the electronic structure of the composites. The apparent work function of the rGO–Ag NPs composites also remained stable despite further irradiation, indicating that the particle size and the interaction with rGO are dominant factors in determining the work function at higher absorbed doses.
A similar shift was observed for the second series (B) (Fig. 3(b)) with an absorbed dose of 7.7 kGy, after which the VBmax and Ecut-off values again stabilized at 2.2 eV and 16.5 eV. Notably, despite differences in the initial silver ion concentration (10−3 mol L−1versus 10−2 mol L−1), the final values of VBmax and Ecut-off were identical for all samples at the highest absorbed doses. This suggests that the concentration of silver ions has a minimal effect on the final electronic properties of the rGO–Ag NPs composites when irradiated at high doses. On the other hand, the work function values for rGO before irradiation were observed to be slightly lower (1.9 eV for VBmax and 17 eV for Ecut-off).
To complete this UPS study, the positions of the VB and CB of the radiosynthesized materials relative to the EF, as well as the WF of each sample, were determined using the same calculation methods detailed in Section 2.6. Tables 1 and 2 summarize the values obtained for each sample. Fig. S5 and S6 (ESI†) also illustrate the evolution of the band structure of our radiosynthesized rGO–Ag NPs composites.
For series A (Table 1), the absorbed dose resulted in a decrease in the bandgap from 4.4 eV to 3.1 eV, with a simultaneous increase in VBmax (from 2.0 eV to 2.2 eV) and Ecut-off (from 16.2 eV to 16.5 eV). The work function also decreased from 5.0 eV to 4.7 eV, suggesting that the modification in the work function is related to the changes in the band structure caused by irradiation. The CB increased from 2.6 eV to 3.8 eV, reflecting a shift towards a more reduced state of the rGO–Ag NPs composites. This is illustrated in Fig. S5 (ESI†).
For series B (Table 2), the bandgap (Eg) also decreased from 5.0 eV to 3.6 eV, while VBmax increased from 2.0 eV to 2.5 eV. Ecut-off increased from 16.1 eV to 16.9 eV, and the work function decreased from 5.1 eV to 4.3 eV with the absorbed dose. Similarly, to series A, the CB value of series B increased from 2.1 eV to 3.2 eV. This is illustrated in Fig. S6 (ESI†). This consistent trend across both series indicates that the absorbed dose is a key factor in modulating the electronic structure of the rGO–Ag NPs composites.
The evolution of all the energy values is consistent for both series, independent of the initial concentration of Ag+ ions. However, the energy values before and after irradiation differ significantly, depending on silver ion concentration (0, 10−3, or 10−2 mol L−1). These data are summarized in Table 3. For comparison, the energy diagrams of GO before irradiation and rGO synthesized by radiolysis at 50 kGy without Ag+ and with Ag+ are presented in Fig. 3(c). These findings open up possibilities for further tailoring of the electronic structure of these materials through controlled irradiation and ion concentration, which could be beneficial for applications in catalysis, sensing, and other areas involving electronic interfaces.
3.4 XPS analysis
As previously demonstrated, the presence of Ag NPs, along with variations in Ag+ concentration, significantly impacts the optical and electronic properties of radiolytically synthesized rGO composites. To further investigate the surface chemistry of these materials, XPS analysis was conducted on both irradiated and non-irradiated samples from series A and B, prepared with Ag+ concentrations of 10−3 mol L−1 and 10−2 mol L−1, respectively. This technique provides valuable insights into the surface-level chemical transformations, which are essential for understanding the reduction processes and the structural modifications occurring within the material.The survey spectra of selected samples from series A and B are presented in Fig. 4(a) and (b), respectively. These spectra clearly indicate the presence of silver in the form of AgClO4, alongside carbon and oxygen components derived from the GO structure, aligning with previous findings in the literature.99–101 A significant observation is the increased silver content in series B, which was prepared with a higher Ag+ concentration (10−2 mol L−1). This highlights the critical role that Ag+ concentration plays in determining the surface composition of the composites. The elevated silver content in series B is expected to influence both the reduction behavior and the electronic properties of the rGO–Ag NPs composite, as the increased Ag+ concentration likely promotes greater interaction between silver ions and the rGO surface during the radiolytic reduction process. As absorbed dose increases, a clear reduction in the oxygen content (as indicated by the O1s band) was observed in both series (Fig. 4(a) and (b)). This deoxygenation process is attributed to the reduction of oxygenated groups on the surface, suggesting that irradiation induces the removal of oxygen functionalities. The reduction of oxygen groups is essential for the modification of material's electronic properties, as it leads to enhanced conjugation and conductivity of the rGO structure.
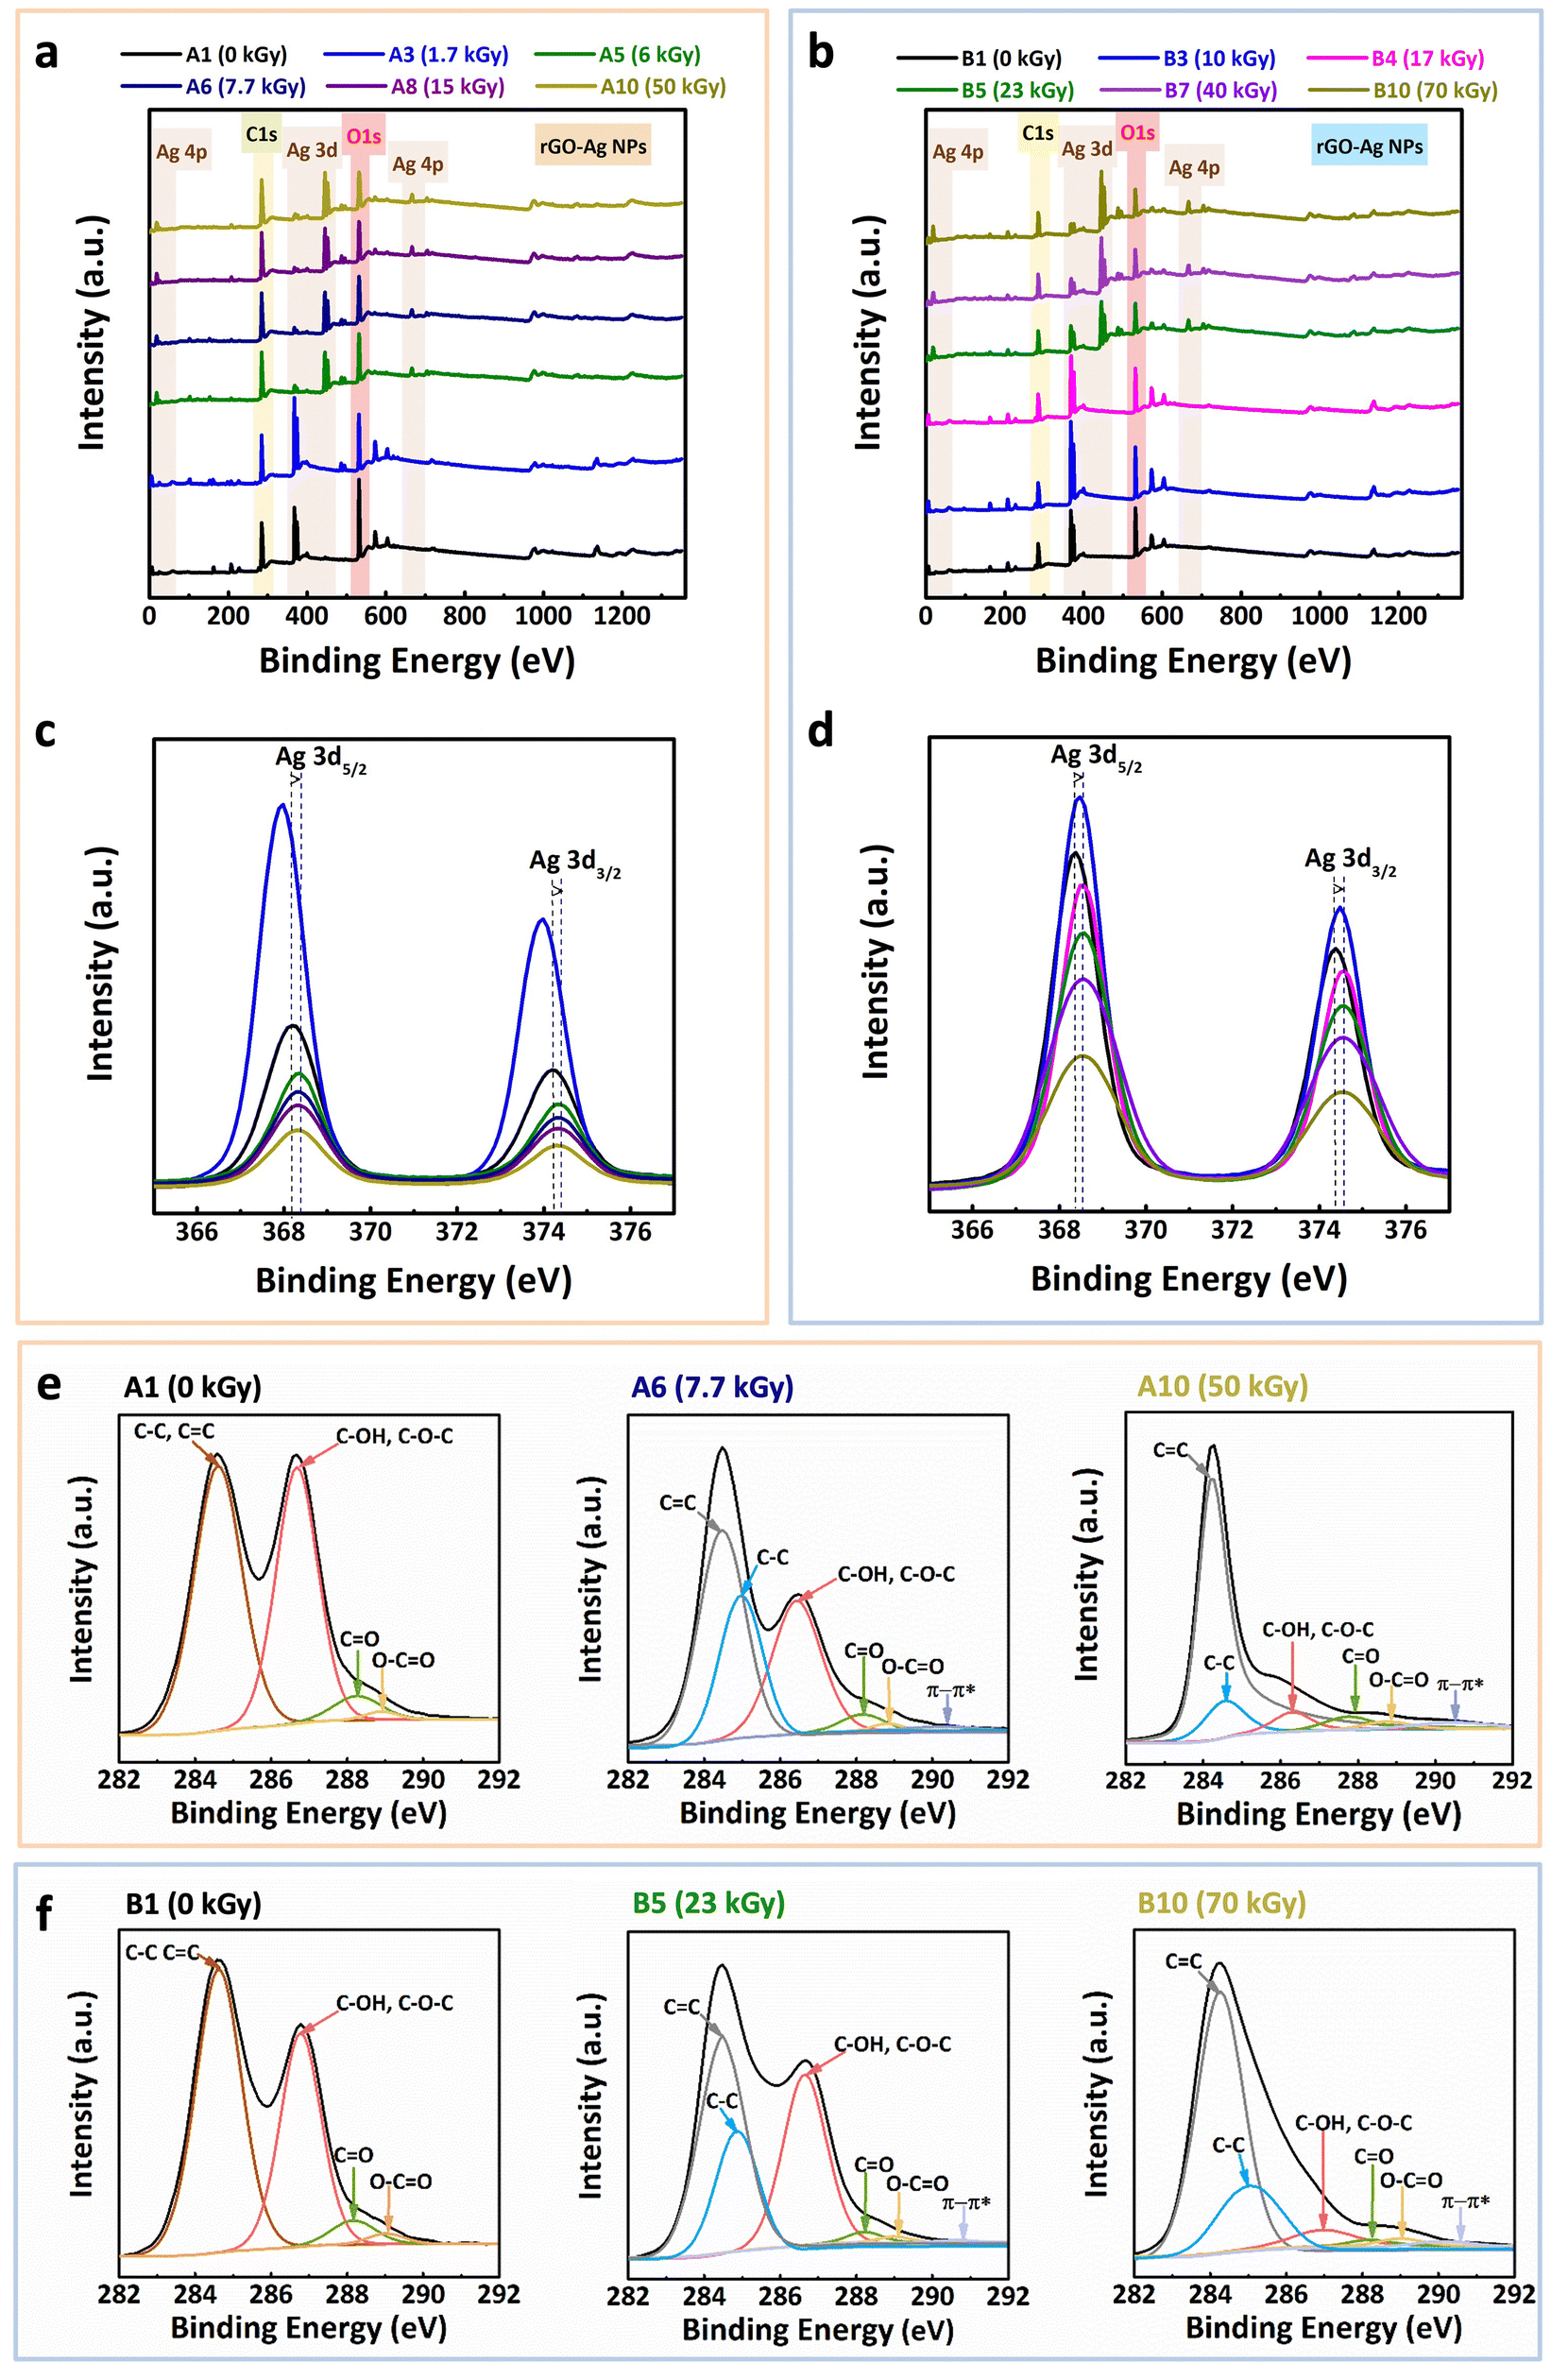 | ||
| Fig. 4 XPS survey spectra showing the elemental composition of rGO–Ag NPs composites: (a) series A ([OG] = 0.2 g L−1, [IPA] = 0.2 mol L−1, [Ag+] = 10−3 mol L−1) and (b) series B ([OG] = 0.2 g L−1, [IPA] = 0.2 mol L−1, [Ag+] = 10−2 mol L−1). High-resolution XPS Ag 3d spectra highlighting the chemical states of silver: (c) series A and (d) series B. XPS C1s core-level spectra showing the evolution of carbon chemical states at varying absorbed doses: (e) series A (A1: 0 kGy, A6: 7.7 kGy, A10: 50 kGy) and (f) series B (B1: 0 kGy, B5: 23 kGy, B10: 70 kGy). | ||
To investigate the reduction of Ag+ to metallic Ag, the Ag 3d region of the XPS spectra was deconvoluted (Fig. 4(c) and (d)). The spectra show a prominent peak at 368.4 eV (Ag 3d5/2), which is characteristic of Ag+ ions, and a peak at 369.6 eV corresponding to metallic silver (Ag0 in its reduced state).101 This indicates that irradiation effectively reduces Ag+ into Ag0 through radiolysis. Furthermore, at higher absorbed doses, the Ag 3d5/2 peak becomes slightly asymmetric, suggesting a minor degree of oxidation on the silver surface, likely due to the presence of residual oxygen in the system.
The C1s region of the XPS spectra for series A (samples A1 (0 kGy), A6 (7.7 kGy), and A10 (50 kGy)) and series B (samples B1 (0 kGy), B5 (23 kGy), and B10 (70 kGy)) are presented in Fig. 4(e) and (f), respectively. These spectra provide critical insights into the reduction of GO and the structural transformations occurring during irradiation. Two primary peaks are evident in the spectra: one at 284.6 eV, corresponding to sp2 CC bonds, and another at 285.1 eV, associated with sp3 C–C bonds.102–104 With increasing absorbed dose, a shift from sp3 to sp2 hybridization was observed, indicating an enhancement in the conjugation within the material. This shift is crucial for improving the electronic properties of the rGO–Ag NPs composites, as sp2 carbon–carbon bonds are more conductive than sp3 bonds. The decrease in sp3 carbon content and the increase in sp2 content with irradiation reflect the significant structural transformation induced by the irradiation process.32
In addition to the primary sp2 and sp3 peaks, minor components at higher binding energies (286 eV, 288 eV, and 289 eV) were attributed to carbon–oxygen bonds, such as C–O, CO, and O–CO groups. These components are indicative of oxygenated functionalities on the surface of rGO. With increasing absorbed doses, the intensity of these peaks decreases, providing further evidence of the reduction of oxygenated carbon species. This deoxygenation supports the hypothesis that irradiation facilitates the conversion of oxygenated carbon species into conjugated carbon–carbon bonds, enhancing the electronic conductivity of the material.
This XPS analysis confirms that irradiation facilitates both the reduction of Ag+ to metallic Ag and the deoxygenation of GO, resulting in a more conjugated structure in rGO. The ability to control these surface chemical properties through irradiation presents a valuable approach to tailoring the characteristics of rGO–Ag NPS composites for electronic applications.
3.5 ATR-FTIR spectroscopy analysis
Building on the findings from XPS, which provided surface-level chemical information, ATR-FTIR spectroscopy offers complementary insights into the bulk chemical transformations of rGO–Ag NPs nanocomposites. This technique enables the detailed analysis of functional groups across the material's volume. ATR-FTIR spectra were recorded for both series A and B before and after irradiation to examine the effect of absorbed dose on the composition and stability of oxygen-containing functional groups within the composites. The obtained spectra are presented in Fig. 5(a) and (b). | ||
| Fig. 5 ATR-FTIR spectra of non-irradiated and irradiated OG (0.2 g L−1)–Ag+ at increasing absorbed doses (under N2): (a) [Ag+] = 10−3 mol L−1 (series A) and (b) [Ag+] = 10−2 mol L−1 (series B). | ||
For the non-irradiated samples (A1 and B1, 0 kGy), the FTIR spectra (black curves in Fig. 5(a) and (b)) exhibit distinct peaks characteristic of graphene oxide (GO). These include broad hydroxyl (–OH) stretching bands at 3450 cm−1, ketone (CO) vibrations at 1735 cm−1, alkene (CC) stretching at 1615 cm−1, epoxide and C–O–C groups at 1230 cm−1, and carboxylic acid C–O stretching at 1041 cm−1. Additionally, the broad band between 3700–3100 cm−1 corresponds to water (H–OH) molecules associated with the hygroscopic nature of GO.105,106 These peaks confirm the presence of oxygen-rich functional groups typical of GO in both series A and B.
Upon irradiation, significant changes are observed in the spectra of series A (Fig. 5(a)). A progressive reduction in the intensity of the bands characteristic of oxygen-containing functional groups, occurs with increasing dose, becoming especially notable up to 7.7 kGy (sample A6). At this absorbed dose, minimal oxygenated functional groups remain, as evidenced by the near disappearance of their associated bands.
Beyond 7.7 kGy, the spectra stabilize, indicating that further irradiation does not significantly alter the functional group composition. Concurrently, a band at 1590 cm−1, attributed to CC stretching in aromatic rings, becomes prominent, signifying the partial restoration of the conjugated aromatic network characteristic of rGO. This result aligns with literature findings and previous work, suggesting a significant restructuring of the composite's conjugated network during irradiation.32,107–109
In contrast, the spectra for series B (Fig. 5(b)) reveal a similar but less pronounced trend. Although the intensity of oxygen-containing functional group bands decreases with increasing absorbed dose, residual oxygenated functional groups persist even at the highest dose of 70 kGy (sample B10). This aligns with the XPS results, which also show incomplete deoxygenation for series B at higher doses. The persistence of these groups is likely due to the higher Ag+ concentration in series B, which may modulate the radiolytic reduction process and limit complete deoxygenation.
Overall, ATR-FTIR analysis confirms the restoration of the conjugated sp2 carbon network in rGO upon radiolytic reduction of GO, with the elimination of most oxygen-containing functional groups in both series A and B. The differences between the two series underscore the influence of Ag+ concentration on the extent of deoxygenation and aromatic network restoration. These findings enhance the understanding of how irradiation parameters and silver ion concentration affect the structural and chemical evolution of rGO–Ag NPs nanocomposites.
3.6 Raman spectroscopy analysis
Following the ATR-FTIR analysis, which offered insight into the chemical structure of the rGO–Ag NPs nanocomposites, Raman spectroscopy was used to evaluate their structural properties and assess changes induced by irradiation.Raman spectra, shown in Fig. 6(a) and (b) for series A and B, highlight characteristic rGO bands: D, G, 2D, and D + D′, located at 1350 cm−1, 1580 cm−1, 2700 cm−1, and 2950 cm−1, respectively. These features confirm the presence of rGO in the nanocomposites, which is consistent with prior analyses and literature findings for rGO alone.32,110
 | ||
| Fig. 6 Raman spectra of non-irradiated and irradiated OG (0.2 g L−1)–Ag+ samples at increasing absorbed doses, taken with a 1 mW laser: (a) series A, (b) series B. Exponential fitting of the ID/IG ratio as a function of the absorbed dose: (c) series A, (d) series B. The uncertainty associated with the obtained values is less than 5%. | ||
A key observation in this study is the enhanced intensity of the Raman signal for samples containing silver nanoparticles, a phenomenon that can be attributed to surface-enhanced Raman scattering (SERS) effects.111 The increase in signal intensity is proportional to the concentration of silver in the composite, as evidenced by the more prominent bands in series B compared to those of series A. This intensity enhancement confirms that the silver nanoparticles effectively contribute to the SERS effect by amplifying the Raman response, a result of localized surface plasmon resonance associated with nanoscale silver.
The intensity ratio (ID/IG) between D and G bands, often used to quantify the degree of disorder in carbon-based materials, was analyzed for each series to assess structural variations with irradiation. In series A (Fig. 6(c)), the ID/IG ratio rises from 0.99 before irradiation to 1.18 at 50 kGy, suggesting an increase in defect density likely due to the formation of new sp2 domains. A similar trend is seen in series B (Fig. 6(d)), where ID/IG also increases from 1.00 to 1.18, in agreement with values typically observed for rGO–Ag nanocomposites. Interestingly, this ratio is lower than that observed for pure rGO (1.40),32 indicating that the presence of silver contributes to a reduction in structural defects, possibly due to stabilization of the rGO structure.
These results highlight the crucial role of silver in enhancing Raman sensitivity and reducing defect density within the rGO–Ag NPs nanocomposites. Furthermore, they underscore the effectiveness of the radiolytic synthesis method in fabricating stable nanocomposites with optimized structural and spectroscopic characteristics, consistent with findings reported in the literature.112–114
3.7 SEM and EDX combined analysis
To further confirm the successful one-pot radiolytic synthesis of rGO–Ag nanocomposites, the morphological and compositional evolution of both series A and B samples was analyzed in detail by using scanning electron microscopy coupled with energy-dispersive X-ray spectroscopy. This analysis elucidates the morphological evolution of graphene oxide sheets and the spatial distribution of silver nanoparticles under varying gamma-irradiation dose. To remember, the samples contained consistent concentrations of GO (0.2 g L−1) and IPA (0.2 mol L−1), with two distinct initial silver ion concentrations: 10−3 mol L−1 (series A) and 10−2 mol L−1 (series B), ensuring controlled comparisons between the two systems.The SEM images of selected samples, as presented in Fig. 7(a) and (b), provide a visual representation of the microstructural changes as a function of absorbed dose for series A and series B, respectively.
 | ||
| Fig. 7 (a) SEM images of series A samples: A1 (0 kGy), A3 (1.7 kGy), A6 (7.7 kGy), and A10 (50 kGy). (b) SEM images of series B samples: B1 (0 kGy), B4 (17 kGy), B5 (23 kGy), and B10 (70 kGy). Exponential fitting of the C/O ratio evolution with absorbed dose for rGO–Ag NPs composites: (c) series A ([GO] = 0.2 g L−1, [IPA] = 0.2 mol L−1, [Ag+] = 10−3 mol L−1) and (d) series B ([GO] = 0.2 g L−1, [IPA] = 0.2 mol L−1, [Ag+] = 10−2 mol L−1). The experimental uncertainty is less than 5%. | ||
In the unirradiated samples A1 (0 kGy) and B1 (0 kGy), the morphology of GO remains unchanged, with large flat graphene oxide sheets clearly visible. Notably, no silver nanoparticles were observed in these samples, indicating that in the absence of light, under aluminium, Ag+ ions were not reduced onto GO sheets prior to irradiation.
Upon gamma-irradiation, a notable morphological transformation occurs in both series. In series A (Fig. 7(a)), the initial absorbed doses lead to the formation of spherical Ag NPs that begin to decorate the GO sheets. These nanoparticles are relatively uniform in size and are evenly distributed across the surface of the sheets. The average diameter of AgNPs in this series was measured to be approximately 42 nm at an initial concentration of 10−3 mol L−1. This rapid formation of silver nanoparticles indicates the efficient reduction of Ag+ ions, which is consistent with the 1.7 kGy required to reduce silver ions at an initial concentration of 10−3 mol L−1. Up to a dose of 7.7 kGy, which corresponds to the complete reduction of both GO and Ag+ ions in series A, the graphene sheets remain smooth and planar. However, as the absorbed dose reaches 7.7 kGy, a noticeable transformation occurs in the structure of the GO sheets when their reduction into rGO is theoretically complete. This transformation is accompanied by the curvature of the GO sheets, interlayer entanglement, and the onset of sheet aggregation, typical of rGO. This could be explained by the radiation-induced drastic consumption of oxygenated functionalities which induces the enhancement of hydrophobic interactions within rGO sheets and between different rGO sheets. Despite these structural changes, the size and distribution of the Ag NPs remain stable across all doses, which underscores the robustness of the nanocomposites synthesized through this radiolytic process. This stability of silver nanoparticles, even at higher absorbed doses, suggests that the reduction of Ag+ does not result in nanoparticle aggregation or changes in particle size, ensuring the consistency of the nanocomposite's structure and properties.
For series B (Fig. 7(b)), the higher initial concentration in Ag+ ions (10−2 mol L−1) led to a higher density of Ag NPs upon irradiation. The average diameter for this series was measured to be approximately 60 nm. A progressive increase in the number of Ag NPs is observed as the absorbed dose increases, with a notable increase in nanoparticle density up to a dose of 17 kGy, which corresponds to the complete reduction of Ag+ ions. The Ag NPs in series B are slightly larger than those in series A, which is consistent with the broader and red-shifted plasmon absorption bands observed in UV-Vis absorption spectra (Fig. 2(b)versusFig. 2(a)). This red-shift reflects the changes in particle distribution and optical properties as the nanoparticles grow in size. Despite the increased nanoparticle size at doses up to 17 kGy, no further size increase is observed upon subsequent irradiation. Once the silver reduction process reaches completion at 17 kGy, the distribution of Ag NPs across the graphene sheets stabilizes and no further aggregation is observed.
At this stage, after the complete reduction of Ag+ ions, the reduction of GO begins. Up to an absorbed dose of 23 kGy, which corresponds to the complete reduction of both GO and Ag+ ions in series B, the graphene sheets remain relatively smooth and planar. Above 23 kGy, one can observe morphological changes, including the formation of sheet curvature, folding, and eventual aggregation of rGO sheets, as described in case of series A after 7.7 kGy.
These morphological transformations align closely with the kinetic reduction processes previously discussed in Section 3.1, further confirming the interdependent reduction of silver ions and graphene oxide in the radiosynthesis of rGO–Ag NPs nanocomposites.
The EDX analysis (see Fig. S7, ESI†) complemented these observations by confirming the elemental composition of the nanocomposites. The detected elements include carbon, oxygen, silver, and chlorine, the latter originating from the silver perchlorate precursor used in the synthesis. Series B samples exhibit higher silver and chlorine concentrations due to their tenfold greater initial AgClO4 content. Of particular interest in this study is the evolution of the carbon-to-oxygen (C/O) ratio, as it provides a clear indication of the degree of reduction of GO in both series. The C/O ratio, derived from EDX measurements, indeed serves as a reliable parameter to track the reduction process as a function of the absorbed dose.
Fig. 7(c) and (d) illustrate the evolution of the C/O ratio with absorbed dose for series A and series B, respectively. Initially, for the unirradiated samples (A1 and B1), the C/O ratios are both 3.0, which reflects the oxygen-rich nature of GO. As the absorbed dose increases, the C/O ratio in series A gradually rises, reaching 10.8 at 50 kGy, indicating significant deoxygenation during rGO formation. Similarly, in series B, the C/O ratio reaches 9.6 at 70 kGy, reflecting a comparable degree of reduction, albeit with a slightly lower value due to the higher initial Ag+ ion concentration in this series.
These findings are consistent with trends observed in XPS and ATR-FTIR spectra, reinforcing the deoxygenation process of GO under gamma-irradiation and aligning with findings reported in the literature.115–118
Notably, in previous studies where silver was absent,32 the C/O ratio reached a slightly higher value of 11.2, which suggests that the complete deoxygenation process is more pronounced in the absence of silver. This discrepancy highlights the role of silver concentration in modulating the reduction degree of GO.
The data presented in Table 4 underscores this observation, further emphasizing the impact of Ag+ concentration on the efficiency of graphene oxide reduction in the synthesis of rGO–Ag nanocomposites.
3.8 TGA analysis
TGA analysis was further conducted to understand the role of silver nanoparticles in influencing the thermal behavior of rGO and to evaluate the thermal stability of the radiosynthesized rGO–Ag NPs nanocomposites. Fig. 8 presents the TGA profiles obtained under a nitrogen atmosphere for unirradiated GO, rGO synthesized at 50 kGy in the absence of silver ions (from a previous study), and the rGO–Ag NPs nanocomposites synthesized in presence of silver ions: A10 (50 kGy) from series A and B10 (70 kGy) from series B. | ||
| Fig. 8 TGA profiles obtained under nitrogen atmosphere for GO and rGO synthesized at 50 kGy in the absence of silver ions, and rGO–Ag NPs nanocomposites synthesized at 50 kGy (sample A10, series A) and at 70 kGy (sample B10, series B) in presence of silver ions. | ||
The TGA profile of GO reveals a characteristic three-stage thermal degradation process. In the first stage, around 100 °C, approximately 10% weight loss occurs, attributed to the evaporation of water molecules trapped within the hydrophilic GO structure. The second stage, beginning around 200 °C, shows a significant 27% weight loss associated with the decomposition of oxygenated functional groups such as hydroxyl, epoxy, and carbonyl groups. In the final stage, between 400 and 500 °C, a dramatic 51% weight loss is observed, corresponding to the degradation of the carbon backbone. This extensive weight loss reflects the structural instability of GO and aligns with previously reported thermal behavior for such materials.
In contrast, rGO synthesized via radiolytic reduction at 50 kGy demonstrates significantly enhanced thermal stability. The first two stages of degradation are notably reduced, with only a 10% weight loss occurring in the 160–280 °C range, attributed to the removal of most oxygenated functional groups during the reduction process. In the final stage, a 70% weight loss is observed between 400 and 700 °C. This shift to higher degradation temperatures indicates enhanced thermal stability of rGO compared to GO. The reduction process restores the sp2 carbon network, which requires higher temperatures for decomposition due to its increased structural integrity. The greater weight loss at these higher temperatures reflects the complete degradation of the more stable carbon framework. While radiolytic reduction effectively removes oxygenated groups, any residual defects or weak points in the structure may still influence decomposition, but they do not negate the overall improved thermal resilience of rGO.
For the rGO–Ag NPs nanocomposites, both A10 (50 kGy) and B10 (70 kGy) exhibit markedly improved thermal stability compared to rGO alone. In the first stage, no significant weight loss is observed below 200 °C, indicating the effective removal of residual water. In the second stage, minor weight losses of 6% for A10 (50 kGy) and 2% for B10 (70 kGy) are attributed to the decomposition of residual oxygenated functional groups.119 These reduced losses highlight the stabilizing effect of Ag NPs, which likely minimize the presence of thermally unstable groups. In the final stage (300–800 °C), weight loss remains low, with a maximum of approximately 20% for A10 (50 kGy) and just 10% for B10 (70 kGy). The superior stability of the nanocomposites is first attributed to the interaction between silver nanoparticles and the graphene sheets, which likely act as thermal barriers and restrict carbon framework decomposition at elevated temperatures, but it is also explained by the high silver content within rGO–Ag NPs composites. Among the composites, B10 (70 kGy), synthesized with a higher silver ion concentration (10−2 mol L−1), shows the lowest overall weight loss in the TGA analysis. This is primarily due to its higher silver content, estimated to be about 90 wt%, compared to approximately 80 wt% for A10 (50 kGy). The apparent enhanced thermal stability is thus largely a result of the higher proportion of thermally stable silver nanoparticles rather than an intrinsic change in the rGO's thermal properties.120 The uniform distribution of silver nanoparticles within the graphene matrix may contribute to the overall thermal behavior of the composites, potentially influencing the decomposition process of the carbonaceous component.
Interestingly, the gradual increase in silver content from series A to series B not only improves thermal stability but also aligns with the observed reduction trends in chemical composition, as evidenced by the increasing C/O ratio with absorbed dose. These observations are consistent with previously reported findings, where metal nanoparticle incorporation enhances the thermal properties of graphene derivatives, highlighting the reproducibility and robustness of the radiolytic approach. The findings suggest that optimizing the concentration of the silver precursor during synthesis could serve as a strategic approach to tailor the thermal properties of graphene-based nanocomposites for specific applications.
3.9 Cyclic voltammetry analysis
Following the exploration of the physicochemical, structural, and thermal stability properties of our samples (series A and B), the focus shifted to examining their electrochemical characteristics through cyclic voltammetry. CV is an essential tool for rapid and straightforward evaluation of surface properties and interactions of materials within a reaction medium. By applying a linearly varying potential, CV reveals critical insights into redox behavior and material's electron transfer capabilities, with the electrode surface playing a pivotal role as the site of electrochemical reactions. Here, the samples were characterized by CV in an aqueous 0.1 M KOH electrolyte at ambient temperature, within a potential range of −0.4 V to +0.4 V vs. Ag/AgCl. This approach aimed to analyze the oxidation and reduction reactions of silver and to compare the CV profiles of rGO–Ag NPs composites with that of rGO alone, in the absence of silver. Additionally, this study examined the evolution of specific capacitance as a function of absorbed dose and silver ion concentration to understand their effects on the material's electrochemical performances.Fig. 9(a) and (b) show the cyclic voltammograms (CVs) for the nanocomposites from series A and B, respectively, covering both non-irradiated (A1 (0 kGy) and B1 (0 kGy)) and irradiated samples at different absorbed doses (A6 (7.7 kGy), A10 (50 kGy) in series A, and B5 (23 kGy), B10 (70 kGy) in series B) recorded at scan rates ranging from 10 to 200 mV s−1. Additional CVs for all samples from series A and B are provided in Fig. S8 and S9 (ESI†), respectively. The CV results demonstrate a progressive increase in current density with scan rate for all samples in both series, indicating robust specific capacitance. These voltammograms reveal characteristic redox peaks, which reflect the faradaic processes occurring at the electrode surface. For series A (Fig. 9(a) and Fig. S8, ESI†), two primary domains are observed during the positive potential sweep: a broad double-layer region spanning −0.4 V to 0.2 V vs. Ag/AgCl and an oxidation peak around 0.34 V, followed by a reduction peak near 0.07 V. For series B (Fig. 9(b) and Fig. S9, ESI†), a similar pattern emerges with a broad double-layer region in the range of −0.4 V to 0.2 V vs. Ag/AgCl and two distinct oxidation peaks at 0.26 V and 0.34 V, respectively. Notably, the oxidation peaks in the positive potential sweep appear more pronounced with increased silver concentration, whereas the reduction process features a single peak with a maximum at approximately 0.05 V vs. Ag/AgCl. An increase in both anodic and cathodic currents with increasing Ag concentration is evident, reflecting enhanced capacitive behavior.
 | ||
| Fig. 9 Cyclic voltammograms of rGO–Ag NPs composites from (a) series A (A0, A6, A10) and (b) series B (B0, B5, B10), measured in 0.1 M KOH solution at ambient temperature. Voltammograms were recorded at scan rates between 10 and 200 mV s−1 over a potential range of −0.4 V to +0.4 V vs. Ag/AgCl. Specific capacitance of the composites measured at different scan rates (10–200 mV s−1) for samples of (c) series A and (d) series B. Exponential curve fitting of the variation in specific capacitance with absorbed dose at 10 mV s−1 for (e) series A (e) and (f) series B. | ||
A comparative analysis of the irradiated and non-irradiated samples shows a substantial increase in the area under the charge and discharge curves with rising absorbed dose, suggesting an enhancement in specific capacitance as a function of absorbed dose. The observed broad double-layer in both series can be attributed to the pseudo-capacitive contributions from the rGO matrix (manifested by the quasi-rectangular shape) as well as the minor metallic behavior of the Ag NPs. This minor metallicity of Ag NPs was corroborated through UV-Vis absorption spectroscopy, which exhibited broad plasmon absorption peaks, indicating non-metallic characteristics.
To further elucidate the impact of absorbed dose and Ag concentration on electrochemical performance, specific capacitances were calculated for each sample from the CV curves obtained at different scan rates (10 to 200 mV s−1) using a three-electrode configuration. Fig. 9(c) and (d) display the evolution of specific capacitance as a function of scan rate for all samples in series A and B, respectively. At higher scan rates (40 to 200 mV s−1), specific capacitance tends to decrease linearly for all samples, highlighting the influence of ion mobility limitations. At lower scan rates (<40 mV s−1), the specific capacitance decreases more sharply, potentially due to contributions from porosity.121,122
Specific capacitance values calculated at 10 mV s−1 across various absorbed doses are presented in Fig. 9(e) and (f). For series A composites synthesized with 10−3 mol L−1 Ag+ (Fig. 9(e)), specific capacitance increased from 46.5 F g−1 (before irradiation) to 218.0 F g−1 (post-irradiation at 50 kGy). Similarly, for series B composites synthesized with 10−2 mol L−1 Ag+ (Fig. 9(f)), specific capacitance rose from 63.0 F g−1 (before irradiation) to 298.0 F g−1 (post-irradiation at 70 kGy). This trend demonstrates a notable enhancement in specific capacitance attributable to both irradiation and increased Ag+ concentration. In comparison, rGO synthesized at 50 kGy in the absence of silver ions, exhibited a maximum specific capacitance of 125.4 F g−1 at 10 mV s−1 in 0.1 M KOH electrolyte. Table 5 summarizes the specific capacitance values obtained at 10 mV s−1 for all radiosynthesized samples, with and without silver. These findings clearly reveal the beneficial impact of Ag NPs on the capacitive response of the irradiated nanocomposites, where the specific capacitance increased by approximately 50% with a rise in Ag+ concentration from 10−3 mol L−1 (series A) to 10−2 mol L−1 (series B). Furthermore, comparisons with the literature indicate that the specific capacitances of radiosynthesized rGO–Ag NPs composites surpass those reported for similar materials, confirming the promising electrochemical properties of these nanocomposites.123–125
| Samples | Specific capacitance (F g−1) at 10 mV s−1 |
|---|---|
| GO (0.2 g L−1) (0 kGy) | 6.8 |
| rGO (50 kGy) | 125.4 |
| A1: GO (0.2 g L−1) + Ag+(10−3 mol L−1) (0 kGy) | 46.5 |
| A10: rGO–Ag NPs (50 kGy) | 218.0 |
| B1: GO (0.2 g L−1) + Ag+(10−2 mol L−1) (0 kGy) | 63.0 |
| B10: rGO–Ag NPs (70 kGy) | 298.0 |
It should be noted that although KOH concentration in this study was fixed at 0.1 M, previous trials with rGO in 1 M KOH demonstrated an increase in specific capacitance up to 229.0 F g−1 at 100 mV s−1, compared to 129.0 F g−1 with the 0.1 M KOH solution. These observations suggest that optimizing the KOH concentration in future studies could further enhance the specific capacitance of these rGO–Ag NPs composites, particularly in higher-concentration electrolyte conditions.
4. Conclusion
The present study has effectively demonstrated the potential of gamma-induced radiolysis as a powerful and versatile method for the one-pot synthesis of rGO–Ag NPs composites. By maintaining consistent concentrations of graphene oxide at 0.2 g L−1 and isopropanol at 0.2 mol L−1, while varying the silver ion concentrations to 10−3 mol L−1 in series A and 10−2 mol L−1 in series B, precise control over the properties of the resulting nanocomposites was achieved. The systematic variation of absorbed doses, specifically 7.7 kGy for series A and 23 kGy for series B, confirmed the efficiency of the one-pot reduction process. Importantly, findings demonstrated that the reduction of silver ions occurs approximately seven times faster than that of graphene oxide in series A and about seventy times faster in series B.The multi-technique characterization approach employed in this research work revealed several significant findings that underscore the effectiveness of this synthesis method. Analyses using UPS and UV-Vis spectroscopies showed a substantial reduction in band gap energy, decreasing from 4.4 eV to 3.1 eV for series A and from 5.0 eV to 3.6 eV for series B, indicating enhanced electronic properties of the synthesized nanocomposites. The data obtained from these techniques facilitated the construction of energy band diagrams for all samples in both series A and B, marking a significant advancement in the literature. This is the first time such detailed energy band diagrams have been presented for rGO–Ag nanocomposites synthesized through gamma-induced radiolysis or by other synthetic methods.
Structural transformations were confirmed through XPS and ATR FTIR spectroscopies, which indicated effective concomitant reduction of graphene oxide and silver ions, along with a notable shift from sp3 to sp2 hybridization in the carbon network that enhances conductivity. A comparative analysis between series A and B revealed that while both series exhibited improved electronic properties, series B demonstrated even greater enhancements due to the higher concentration of silver ions. The ID/IG ratio obtained from Raman spectroscopy decreased from 1.40 for pure graphene oxide to 1.18 for rGO–Ag nanocomposites, comparable to defect levels reported for composites synthesized by other methods, indicating minimal structural defects in the rGO matrix. Importantly, no significant structural defects were introduced into the rGO matrix regardless of whether silver was present at concentrations of 10−3 or 10−2 mol L−1.
SEM characterization complemented these findings by providing visual confirmation of the uniform dispersion of silver nanoparticles on the rGO surface. EDX results further corroborated the successful incorporation of silver into the nanocomposites, confirming the elemental composition and distribution within the materials. Notably, the C/O ratio calculated from EDX significantly increased, with values of 10.8 and 9.6 for composites synthesized with 10−3 mol L−1 and 10−2 mol L−1 in silver, respectively, compared to 11.2 for rGO alone. These values are consistent with previously reported ratios for rGO nanocomposites, further validating the reduction process.
TGA analysis revealed enhanced thermal stability of rGO–Ag NPs composites compared to both pure graphene oxide and rGO alone. The composites exhibited minimal weight loss, with only 10% reduction observed between 300–800 °C. This falls within the range of thermal stability values reported for rGO–Ag composites synthesized by other methods, demonstrating the effectiveness of the radiolytic approach in producing thermally stable materials. This improved thermal behavior is primarily attributed to the presence of thermally stable silver nanoparticles, which contribute significantly to the overall thermal stability of the composite materials.
The electrochemical performance evaluated via cyclic voltammetry revealed remarkable specific capacitance values that reached up to 218 F g−1 at a scan rate of 10 mV s−1 for series A and an impressive 298 F g−1 for series B when tested in a 0.1 M KOH electrolyte, far exceeding the capacitance observed for rGO alone (125.4 F g−1). Also, these values are consistent with or exceed the range of specific capacitances reported for chemically reduced rGO composites under similar conditions, showcasing the superior charge storage capabilities of the nanocomposites synthesized via radiolysis.
These findings underscore the advantages of the radiolytic synthesis method, which simplifies the production process while enabling precise control over material properties. The one-pot approach not only enhances the purity of the final product but also allows for scalability, making it a viable alternative to traditional synthesis methods that often rely on hazardous reducing agents. The remarkable properties exhibited by radiosynthesized nanocomposites open new avenues for applications across various fields. In energy storage, the high specific capacitance suggests potential use in supercapacitor electrodes. In catalysis, improved electronic properties and high surface area could enhance catalytic activity in chemical reactions. The unique optical characteristics may enable the development of highly sensitive sensors, while the incorporation of silver nanoparticles suggests potential applications in water treatment and antimicrobial solutions.
Author contributions
Souad Abou Zeid: methodology, formal analysis, investigation, conceptualization, software, validation, resources, writing – original draft, writing – review and editing, visualization. Liran Hu: formal analysis. Rasta Ghasemi: validation, investigation (SEM and EDX experiments). Matthieu Gervais: validation, investigation (TGA experiments). Jaspreet Kaur Randhawa: formal analysis, investigation (CV experiments). Prem Felix Siril: visualization, formal analysis, investigation (Raman experiments). Samy Remita: conceptualization, methodology, validation, writing – original draft, writing – review and editing, visualization, supervision, project administration.Data availability
The data supporting this article have been included as part of the ESI.† Additional data will be made available on request.Conflicts of interest
The authors declare that they have no known competing financial interests or personal relationships that could have appeared to influence the work reported in this paper.Acknowledgements
The first author expresses profound gratitude to Dr Wafaa Noun of the Faculty of Science (Branch 1), Lebanese University, Lebanon, for her invaluable guidance, unwavering support, and insightful contributions that significantly enriched the course of this research. The authors also extend their sincere appreciation to the coordinators of the Franco-Indian SPARC (Scheme for Promotion of Academic and Research Collaboration) project no. P-32 for their generous support and collaborative efforts, which were instrumental in the successful execution of this work.References
- M. Rai, A. Yadav and A. Gade, Silver nanoparticles as a new generation of antimicrobials, Biotechnol. Adv., 2009, 27, 76–83 CrossRef CAS PubMed.
- X.-F. Zhang, Z.-G. Liu, W. Shen and S. Gurunathan, Silver Nanoparticles: Synthesis, Characterization, Properties, Applications, and Therapeutic Approaches, Int. J. Mol. Sci., 2016, 17, 1534 CrossRef PubMed.
- K. M. F. Hasan, L. Xiaoyi, Z. Shaoqin, P. G. Horváth, M. Bak, L. Bejó, G. Sipos and T. Alpár, Functional silver nanoparticles synthesis from sustainable point of view: 2000 to 2023 – A review on game changing materials, Heliyon, 2022, 8, e12322 CrossRef CAS PubMed.
- M.-C. Daniel and D. Astruc, Gold nanoparticles: assembly, supramolecular chemistry, quantum-size-related properties, and applications toward biology, catalysis, and nanotechnology, Chem. Rev., 2004, 104, 293–346 CrossRef CAS PubMed.
- M. C. Stensberg, Q. Wei, E. S. McLamore, D. M. Porterfield, A. Wei and M. S. Sepúlveda, Toxicological studies on silver nanoparticles: challenges and opportunities in assessment, monitoring and imaging, Nanomedicine, 2011, 6, 879–898 CrossRef CAS PubMed.
- S. Guo and E. Wang, Noble metal nanomaterials: Controllable synthesis and application in fuel cells and analytical sensors, Nano Today, 2011, 6, 240–264 CrossRef CAS.
- C. M. Cobley, J. Chen, E. C. Cho, L. V. Wang and Y. Xia, Gold nanostructures: a class of multifunctional materials for biomedical applications, Chem. Soc. Rev., 2011, 40, 44–56 RSC.
- M. R. Jones, K. D. Osberg, R. J. Macfarlane, M. R. Langille and C. A. Mirkin, Templated Techniques for the Synthesis and Assembly of Plasmonic Nanostructures, Chem. Rev., 2011, 111, 3736–3827 CrossRef CAS PubMed.
- R. W. Murray, Nanoelectrochemistry: Metal Nanoparticles, Nanoelectrodes, and Nanopores, Chem. Rev., 2008, 108, 2688–2720 CrossRef CAS PubMed.
- Q. Li, J. Bian, J. Sun, J. Wang, Y. Luo, K. Sun and D. Yu, Controllable growth of well-aligned ZnO nanorod arrays by low-temperature wet chemical bath deposition method, Appl. Surf. Sci., 2010, 256, 1698–1702 CrossRef CAS.
- B. Li, C. F. Goh, X. Zhou, G. Lu, H. Tantang, Y. Chen, C. Xue, F. Y. C. Boey and H. Zhang, Patterning Colloidal Metal Nanoparticles for Controlled Growth of Carbon Nanotubes, Adv. Mater., 2008, 20, 4873–4878 CrossRef CAS.
- J. L. Fiorio, M. A. S. Garcia, M. L. Gothe, D. Galvan, P. C. Troise, C. A. Conte-Junior, P. Vidinha, P. H. C. Camargo and L. M. Rossi, Recent advances in the use of nitrogen-doped carbon materials for the design of noble metal catalysts, Coord. Chem. Rev., 2023, 481, 215053 CrossRef CAS.
- S. B. Malik, J. I. Saggu, A. Gul, B. A. Abbasi, J. Iqbal, S. Waris, Y. A. Bin Jardan and W. Chalgham, Synthesis and Characterization of Silver and Graphene Nanocomposites and Their Antimicrobial and Photocatalytic Potentials, Molecules, 2022, 27, 5184 CrossRef CAS PubMed.
- Z. Hajjar, M. Kazemeini, A. Rashidi and S. Soltanali, Hydrodesulfurization catalysts based on carbon nanostructures: A review, Fullerenes, Nanotubes Carbon Nanostruct., 2018, 26, 557–569 CrossRef CAS.
- W. Wazir, Z. Ahmad, S. Zulfiqar, E. W. Cochran, S. Mubarik, T. Kousar, H. H. Somaily, J.-J. Shim, H. A. Alsalmah and M. Aadil, Synergistic effects of noble metal doping and nanoengineering on boosting the azo dye mineralization activity of nickel oxide, Ceram. Int., 2023, 49, 38026–38035 CrossRef CAS.
- T. A. Amollo, Metallic nanoparticles and hybrids of metallic nanoparticles/graphene nanomaterials for enhanced photon harvesting and charge transport in polymer and dye sensitized solar cells, Heliyon, 2024, 10, e26401 CrossRef CAS PubMed.
- A. K. Geim, Graphene: status and prospects, Science, 2009, 324, 1530–1534 CrossRef CAS PubMed.
- A. K. Geim and K. S. Novoselov, The rise of graphene, Nat. Mater., 2007, 6, 183–191 CrossRef CAS PubMed.
- D. G. Papageorgiou, I. A. Kinloch and R. J. Young, Mechanical properties of graphene and graphene-based nanocomposites, Prog. Mater. Sci., 2017, 90, 75–127 CrossRef CAS.
- M. J. McAllister, J.-L. Li, D. H. Adamson, H. C. Schniepp, A. A. Abdala, J. Liu, M. Herrera-Alonso, D. L. Milius, R. Car, R. K. Prud’homme and I. A. Aksay, Single Sheet Functionalized Graphene by Oxidation and Thermal Expansion of Graphite, Chem. Mater., 2007, 19, 4396–4404 CrossRef CAS.
- M. Czerniak-Reczulska, A. Niedzielska and A. Jędrzejczak, Graphene as a Material for Solar Cells Applications, Adv. Mater. Sci., 2015, 15, 67–81 CrossRef CAS.
- J. Zhu, R. Duan, S. Zhang, N. Jiang, Y. Zhang and J. Zhu, J. Korean Phys. Soc., 2014, 3, 1–8 Search PubMed.
- V. H. Luan, H. N. Tien, L. T. Hoa, N. T. M. Hien, E.-S. Oh, J. Chung, E. J. Kim, W. M. Choi, B.-S. Kong and S. H. Hur, Synthesis of a highly conductive and large surface area graphene oxide hydrogel and its use in a supercapacitor, J. Mater. Chem. A, 2013, 1, 208–211 RSC.
- X.-Y. Yan, X.-L. Tong, Y.-F. Zhang, X.-D. Han, Y.-Y. Wang, G.-Q. Jin, Y. Qin and X.-Y. Guo, Cuprous oxide nanoparticles dispersed on reduced graphene oxide as an efficient electrocatalyst for oxygen reduction reaction, Chem. Commun., 2012, 48, 1892–1894 RSC.
- K. R. Amin and A. Bid, High-Performance Sensors Based on Resistance Fluctuations of Single-Layer-Graphene Transistors, ACS Appl. Mater. Interfaces, 2015, 7, 19825–19830 CrossRef CAS PubMed.
- H. Huang, S. Su, N. Wu, H. Wan, S. Wan, H. Bi and L. Sun, Graphene-Based Sensors for Human Health Monitoring, Front. Chem., 2019, 7, 2296–2646 Search PubMed.
- T. Kuila, A. K. Mishra, P. Khanra, N. H. Kim and J. H. Lee, Recent advances in the efficient reduction of graphene oxide and its application as energy storage electrode materials, Nanoscale, 2013, 5, 52–71 RSC.
- A. T. Smith, A. M. LaChance, S. Zeng, B. Liu and L. Sun, Synthesis, properties, and applications of graphene oxide/reduced graphene oxide and their nanocomposites, Nano Mater. Sci., 2019, 1, 31–47 CrossRef.
- D. Li, M. B. Müller, S. Gilje, R. B. Kaner and G. G. Wallace, Processable aqueous dispersions of graphene nanosheets, Nat. Nanotechnol., 2008, 3, 101–105 CrossRef CAS PubMed.
- S. Pei and H.-M. Cheng, The reduction of graphene oxide, Carbon, 2012, 50, 3210–3228 CrossRef CAS.
- V. Agarwal and P. B. Zetterlund, Strategies for reduction of graphene oxide – A comprehensive review, Chem. Eng. J., 2021, 405, 127018 CrossRef CAS.
- S. Abou Zeid, S. Bencherif, R. Ghasemi, R. Gogoi, Y. Chouli, M. Gervais, D. Dragoe, J. Ghilane, P. F. Siril and S. Remita, Radiation induced reduction of graphene oxide: a dose effect study, New J. Chem., 2024, 48, 4749–4764 RSC.
- Y. Zhu, S. Murali, W. Cai, X. Li, J. W. Suk, J. R. Potts and R. S. Ruoff, Graphene and graphene oxide: synthesis, properties, and applications, Adv. Mater., 2010, 22, 3906–3924 CrossRef CAS PubMed.
- F. Parnianchi, M. Nazari, J. Maleki and M. Mohebi, Combination of graphene and graphene oxide with metal and metal oxide nanoparticles in fabrication of electrochemical enzymatic biosensors, Int. Nano Lett., 2018, 8, 229–239 CrossRef CAS.
- S. W. Chook, C. H. Chia, S. Zakaria, M. K. Ayob, K. L. Chee, N. M. Huang, H. M. Neoh, H. N. Lim, R. Jamal and R. Rahman, Antibacterial performance of Ag nanoparticles and AgGO nanocomposites prepared via rapid microwave-assisted synthesis method, Nanoscale Res. Lett., 2012, 7, 541 CrossRef PubMed.
- R. Pasricha, S. Gupta and A. K. Srivastava, A facile and novel synthesis of Ag-graphene-based nanocomposites, Small, 2009, 5, 2253–2259 CrossRef CAS PubMed.
- Z. Zhang, F. Xu, W. Yang, M. Guo, X. Wang, B. Zhang and J. Tang, A facile one-pot method to high-quality Ag-graphene composite nanosheets for efficient surface-enhanced Raman scattering, Chem. Commun., 2011, 47, 6440–6442 RSC.
- T. K. Das, S. K. Ghosh and N. C. Das, Green synthesis of a reduced graphene oxide/silver nanoparticles-based catalyst for degradation of a wide range of organic pollutants, Nano-Struct. Nano-Objects, 2023, 34, 100960 CrossRef CAS.
- Y. Qian, C. Zhou, J. Zhou and A. Huang, Synthesis of silver-nanoparticles composite with highly catalytic activity supported on the reduced graphene oxide, Appl. Surf. Sci., 2020, 525, 146597 CrossRef CAS.
- Y. Cheng, H. Li, C. Fang, L. Ai, J. Chen, J. Su, Q. Zhang and Q. Fu, Facile synthesis of reduced graphene oxide/silver nanoparticles composites and their application for detecting heavy metal ions, J. Alloys Compd., 2019, 787, 683–693 CrossRef CAS.
- V. Tramonti, C. Lofrumento, M. R. Martina, G. Lucchesi and G. Caminati, Nanomaterials, 2022, 12 Search PubMed.
- J. K. Jose, B. Mishra, K. P. Kootery, C. T. Cherian, B. P. Tripathi, S. Sarojini and M. Balachandran, Fabrication of silver nanoparticle decorated graphene oxide membranes for water purification, antifouling and antibacterial applications, Mater. Sci. Eng. B, 2023, 297, 116789 CrossRef CAS.
- S. H. Song, C.-M. Kim, M. A. Khirul, I. Ahmad, H. Jee, C. Y. Chuah, J. Park, K.-J. Chae and E. Yang, Silver nanoparticle-decorated reduced graphene oxide/nanocrystalline titanium metal-organic frameworks composite membranes with enhanced nanofiltration performance and photocatalytic ability, Desalin. Water Treat., 2024, 320, 100836 CrossRef.
- A. R. Ansari, S. A. Ansari, N. Parveen, M. O. Ansari and Z. Osman, Silver Nanoparticles Embedded on Reduced Graphene Oxide@Copper Oxide Nanocomposite for High Performance Supercapacitor Applications, Mater., 2021, 14(17), 5032 CrossRef CAS PubMed.
- Z. Karami, M. Youssefi, K. Raeissi and M. Zhiani, An efficient textile-based electrode utilizing silver nanoparticles/reduced graphene oxide/cotton fabric composite for high-performance wearable supercapacitors, Electrochim. Acta, 2021, 368, 137647 CrossRef CAS.
- M. Khan, M. N. Tahir, S. F. Adil, H. U. Khan, M. R. H. Siddiqui, A. A. Al-warthan and W. Tremel, Graphene based metal and metal oxide nanocomposites: synthesis, properties and their applications, J. Mater. Chem. A, 2015, 3, 18753–18808 RSC.
- C. Hu, T. Lu, F. Chen and R. Zhang, A brief review of graphene–metal oxide composites synthesis and applications in photocatalysis, J. Chin. Adv. Mater. Soc., 2013, 1, 21–39 CrossRef CAS.
- C. K. Chua and M. Pumera, Chemical reduction of graphene oxide: a synthetic chemistry viewpoint, Chem. Soc. Rev., 2014, 43, 291–312 RSC.
- D. R. Dreyer, S. Park, C. W. Bielawski and R. S. Ruoff, The chemistry of graphene oxide, Chem. Soc. Rev., 2010, 39, 228–240 RSC.
- B. Gurzęda, T. Buchwald, M. Nocuń, A. Bąkowicz and P. Krawczyk, Graphene material preparation through thermal treatment of graphite oxide electrochemically synthesized in aqueous sulfuric acid, RSC Adv., 2017, 7, 19904–19911 RSC.
- S. M. S. Al-Mufti, A. Almontasser and S. J. A. Rizvi, Single and double thermal reduction processes for synthesis reduced graphene oxide assisted by a muffle furnace: A facile robust synthesis and rapid approach to enhance electrical conductivity, AIP Adv., 2022, 12, 125306 CrossRef CAS.
- M. Zainy, N. M. Huang, S. Vijay Kumar, H. N. Lim, C. H. Chia and I. Harrison, Simple and scalable preparation of reduced graphene oxide–silver nanocomposites via rapid thermal treatment, Mater. Lett., 2012, 89, 180–183 CrossRef CAS.
- S. Kumari, P. Sharma, S. Yadav, J. Kumar, A. Vij, P. Rawat, S. Kumar, C. Sinha, J. Bhattacharya, C. M. Srivastava and S. Majumder, A Novel Synthesis of the Graphene Oxide–Silver (GO–Ag) Nanocomposite for Unique Physiochemical Applications, ACS Omega, 2020, 5, 5041–5047 CrossRef CAS PubMed.
- Q. Li and P. Hai, Rapid microwave-assisted synthesis of silver decorated-reduced graphene oxide nanoparticles with enhanced photocatalytic activity under visible light, Mater. Sci. Semicond. Process., 2014, 22, 16–20 CrossRef CAS.
- M. H. H. Ali, M. E. Goher, A. D. G. Al-Afify and S. M. El-Sayed, A facile method for synthesis rGO/Ag nanocomposite and its uses for enhancing photocatalytic degradation of Congo red dye, SN Appl. Sci., 2022, 4, 276 CrossRef CAS.
- S. Wang, Y. Zhang, H. Ma, Q. Zhang, W. Xu, J. Peng, J. Li, Z.-Z. Yu and Z. Maolin, Ionic-liquid-assisted facile synthesis of silver nanoparticle-reduced graphene oxide hybrids by gamma irradiation, Carbon, 2013, 55, 245–252 CrossRef CAS.
- G. Liu, Y. Wang, X. Pu, Y. Jiang, L. Cheng and Z. Jiao, One-step synthesis of high conductivity silver nanoparticle-reduced graphene oxide composite films by electron beam irradiation, Appl. Surf. Sci., 2015, 349, 570–575 CrossRef CAS.
- Y. Liang, B. Fang, F. F. Lin and X. M. Zhu, Gamma Irradiation Assisted Synthesis of Ag/rGO Composites and their Surface Properties, Mater. Sci. Forum, 2017, 898, 2224–2230 Search PubMed.
- M. M. Atta, M. Rabia, A. M. Elbasiony, E. O. Taha, M. M. Abdel Hamid, A. M. A. Henaish and Q. Zhang, Facile gamma-ray induced synthesis of reduced graphene oxide decorated with silver nanoparticles: a green approach for symmetric supercapacitor applications, Fullerenes, Nanotubes Carbon Nanostruct., 2024, 32, 442–451 CrossRef CAS.
- R. M. S. Jacovone, J. J. S. Soares, T. S. Sousa, F. R. O. Silva, R. H. L. Garcia, H. N. Nguyen, D. F. Rodrigues and S. K. Sakata, Antibacterial activity of silver/reduced graphene oxide nanocomposite synthesized by sustainable process, Energy, Ecol. Environ., 2019, 4, 318–324 CrossRef.
- J. Belloni, M. Mostafavi, H. Remita and J.-L. Marignier, and and Marie-Odile Delcourt, Radiation-induced synthesis of mono- and multi-metallic clusters and nanocolloids, New J. Chem., 1998, 22, 1239–1255 RSC.
- J. Belloni and M. Mostafavi, Radiation chemistry of nanocolloids and clusters, Stud. Phys. Theor. Chem., 2001, 87, 411–452 CAS.
- J. Belloni and M. Mostafavi, Metal Clusters in Chemistry, 1999, pp. 1213–1247 Search PubMed.
- Y. Benguedouar, N. Keghouche and J. Belloni, Structural and magnetic properties of Ni–Pt nanoalloys supported on silica, Mater. Sci. Eng., B, 2012, 177, 27–33 CrossRef CAS.
- H. Remita, J. Khatouri, M. Tréguer, J. Amblard and J. Belloni, Silver-palladium alloyed clusters synthesized by radiolysis, Z. Phys. D: At., Mol. Clusters, 1997, 40, 127–130 CrossRef CAS.
- M. Tréguer, C. de Cointet, H. Remita, J. Khatouri, M. Mostafavi, J. Y. Amblard, J. Belloni and R. De Keyzer, Dose Rate Effects on Radiolytic Synthesis of Gold-Silver Bimetallic Clusters in Solution, J. Phys. Chem. B, 1998, 102, 4310–4321 CrossRef.
- T. Bahry, B. Khurshid, Y. Chouli, S. Abou Zeid, C. Sollogoub, M. Gervais, T. T. Bui, F. Goubard and S. Remita, Gamma rays as innovative tool towards synthesizing conducting copolymers with improved properties, New J. Chem., 2021, 45, 13142–13157 RSC.
- C. Zhenpeng, C. Coletta, T. Bahry, J.-L. Marignier, J.-M. Guigner, M. Gervais, S. Baiz, F. Goubard and S. Remita, A novel radiation chemistry-based methodology for the synthesis of PEDOT/Ag nanocomposites, Mater. Chem. Front., 2017, 1, 879–892 RSC.
- L. Hu, S. Abou Zeid, A. Bistintzanos, S. Khaoulani, D. Dragoe, R. Ghasemi, F. Muller, M. Gervais, C. Sollogoub, M. Goldmann and S. Remita, One-pot radiolytically synthesized reduced graphene oxide-gold nanoparticles composites and exploration in energy storage, Appl. Surf. Sci., 2024, 678, 161109 CrossRef CAS.
- G. G. Flores-Rojas, F. López-Saucedo and E. Bucio, Gamma-irradiation applied in the synthesis of metallic and organic nanoparticles: A short review, Radiat. Phys. Chem., 2020, 169, 107962 CrossRef CAS.
- H. Fricke and S. Morse, The chemical action of roentgen rays on dilute ferrosulphate solutions as a measure of dose, Am. J. Roentgenol., Radium Ther. Nucl. Med., 1927, 18, 430–432 CAS.
- E. J. Hart and H. Fricke, Chemical dosimetry, Radiat. Dosim., 1967, 2, 167–239 Search PubMed.
- S. Remita, Effet de ligands sur les propriétés thermodynamiques, cinétiques et spectrales d’agrégats métalliques synthétisés par radiolyse, Thèse de doctorat de l’Université Paris-sud, Paris sud XI, 1995.
- M. Von Piechowski, M.-A. Thelen, J. Hoigné and R. E. Bühler, tert-Butanol as an OH-Scavenger in the Pulse Radiolysis of Oxygenated Aqueous Systems, Ber. Bunsenges. Phys. Chem., 1992, 96, 1448–1454 CrossRef CAS.
- A. Henglein, J. W. T. Spinks. and R. J. Woods, An Introduction to Radiation Chemistry, Third Edition, John-Wiley and Sons, Inc., New York, Toronto 1990. ISBN 0-471-61403-3. 574 Seiten, Preis: DM 91, 45., Ber. Bunsenges. Phys. Chem., 1991, 95, 451 CrossRef.
- E. Janata, A. Henglein and B. G. Ershov, First Clusters of Ag+ Ion Reduction in Aqueous Solution, J. Phys. Chem., 1994, 98, 10888–10890 CrossRef CAS.
- J. Belloni, Nucleation, growth and properties of nanoclusters studied by radiation chemistry: Application to catalysis, Catal. Today, 2006, 113, 141–156 CrossRef CAS.
- A. Kahnt, R. Flyunt, C. Laube, W. Knolle, S. Eigler, R. Hermann, S. Naumov and B. Abel, How fast is the reaction of hydrated electrons with graphene oxide in aqueous dispersions?, Nanoscale, 2015, 7, 19432–19437 RSC.
- J. Pukies, W. Roebke and A. Henglein, Pulsradiolytische Untersuchung einiger Elementarprozesse der Silberreduktion, Ber. Bunsenges. Phys. Chem., 1968, 72, 842–847 CrossRef CAS.
- K. P. Madden and S. P. Mezyk, Critical Review of Aqueous Solution Reaction Rate Constants for Hydrogen Atoms, J. Phys. Chem. Ref. Data, 2011, 40, 23103 CrossRef.
- J. Tauc, R. Grigorovici and A. Vancu, Optical Properties and Electronic Structure of Amorphous Germanium, Phys. Status Solidi, 1966, 15, 627–637 CrossRef CAS.
- X. Zhang and Ø. Mikkelsen, Graphene Oxide/Silver Nanocomposites as Antifouling Coating on Sensor Housing Materials, J. Cluster Sci., 2022, 33, 627–635 CrossRef CAS.
- T. Tsuji, K. Iryo, N. Watanabe and M. Tsuji, Preparation of silver nanoparticles by laser ablation in solution: influence of laser wavelength on particle size, Appl. Surf. Sci., 2002, 202, 80–85 CrossRef CAS.
- C. J. Murphy and N. R. Jana, Controlling the Aspect Ratio of Inorganic Nanorods and Nanowires, Adv. Mater., 2002, 14, 80–82 CrossRef CAS.
- O. Wilson, G. J. Wilson and P. Mulvaney, Laser Writing in Polarized Silver Nanorod Films, Adv. Mater., 2002, 14, 1000–1004 CrossRef CAS.
- S. Gurunathan, J. W. Han, A. A. Dayem, V. Eppakayala and J.-H. Kim, Oxidative stress-mediated antibacterial activity of graphene oxide and reduced graphene oxide in Pseudomonas aeruginosa, Int. J. Nanomed., 2012, 7, 5901–5914 CrossRef CAS PubMed.
- S. Liu, J. Tian, L. Wang, H. Li, Y. Zhang and X. Sun, Stable Aqueous Dispersion of Graphene Nanosheets: Noncovalent Functionalization by a Polymeric Reducing Agent and Their Subsequent Decoration with Ag Nanoparticles for Enzymeless Hydrogen Peroxide Detection, Macromolecules, 2010, 43, 10078–10083 CrossRef CAS.
- J. Li and C. Liu, Ag/Graphene Heterostructures: Synthesis, Characterization and Optical Properties, Eur. J. Inorg. Chem., 2010, 1244–1248 CrossRef CAS.
- A. F. de Faria, D. S. T. Martinez, S. M. M. Meira, A. C. M. de Moraes, A. Brandelli, A. G. S. Filho and O. L. Alves, Anti-adhesion and antibacterial activity of silver nanoparticles supported on graphene oxide sheets, Colloids Surf., B, 2014, 113, 115–124 CrossRef PubMed.
- A. Aziz, M. Khalid, M. Saeed Akhtar, M. Nadeem, Z. Gilani, M. Khan, J. Rehman, Z. Ullah and M. Saleem, Structural, morphological and optical investigations of silver nanoparticles synthesized by sol–gel auto-combustion method, Digest J. Nanomater. Biostruct., 2018, 13, 679–683 Search PubMed.
- S. Gasaymeh, S. Radiman, L. Yook Heng, E. Saion and M. Saeed, Synthesis and Characterization of Silver/Polyvinilpirrolidone (Ag/PVP) Nanoparticles Using Gamma Irradiation Techniques, Am. J. Appl. Sci., 2010, 7, 892–901 CrossRef CAS.
- D. M. Ikram, A. Raza, M. Imran, A. Ul-Hamid and S. Ali, Hydrothermal Synthesis of Silver Decorated Reduced Graphene Oxide (rGO) Nanoflakes with Effective Photocatalytic Activity for Wastewater Treatment, Nanoscale Res. Lett., 2020, 15, 95 CrossRef PubMed.
- A. Das, R. Kumar, S. Goutam and S. Sagar, Sunlight Irradiation Induced Synthesis of Silver Nanoparticles using Glycolipid Bio-surfactant and Exploring the Antibacterial Activity, J. Bioeng. Biomed. Sci., 2016, 6, 208 Search PubMed.
- J. Hölzl and F. K. Schulte, in Solid Surface Physics, ed. J. Hölzl, F. K. Schulte and H. Wagner, Springer Berlin Heidelberg, Berlin, Heidelberg, 1979, pp. 1–150 Search PubMed.
- H. Lüth, Solid Surfaces, Interfaces and Thin Films, 6th edn, 2015 Search PubMed.
- D. P. Woodruff, Modern Techniques of Surface Science, Cambridge University Press, 1994 Search PubMed.
- N. W. Ashcroft and N. D. Mermin, Physique des solides, 1st édn, 2012 Search PubMed.
- A. L. Dadlani, P. Schindler, M. Logar, S. P. Walch and F. B. Prinz, Energy States of Ligand Capped Ag Nanoparticles: Relating Surface Plasmon Resonance to Work Function, J. Phys. Chem. C, 2014, 118, 24827–24832 CrossRef CAS.
- P. Lozovskis, V. Jankauskaitė, A. Guobienė, V. Kareivienė and A. Vitkauskienė, Effect of Graphene Oxide and Silver Nanoparticles Hybrid Composite on P. aeruginosa Strains with Acquired Resistance Genes, Int. J. Nanomed., 2020, 15, 5147–5163 CrossRef CAS PubMed.
- D. I. Rodríguez-Otamendi, V. Meza-Laguna, D. Acosta, E. Álvarez-Zauco, L. Huerta, V. A. Basiuk and E. V. Basiuk, Eco-friendly synthesis of graphene oxide–silver nanoparticles hybrids: The effect of amine derivatization, Diamond Relat. Mater., 2021, 111, 108208 CrossRef.
- A. Shaikh, S. Parida and S. Böhm, One step eco-friendly synthesis of Ag-Reduced graphene oxide nanocomposite by phytoreduction for sensitive nitrite determination, RSC Adv., 2016, 6, 100383 RSC.
- S. T. Jackson and R. G. Nuzzo, Determining hybridization differences for amorphous carbon from the XPS C 1s envelope, Appl. Surf. Sci., 1995, 90, 195–203 CrossRef CAS.
- D. Bourgoin, S. Turgeon and G. G. Ross, Characterization of hydrogenated amorphous carbon films produced by plasma-enhanced chemical vapour deposition with various chemical hybridizations, Thin Solid Films, 1999, 357, 246–253 CrossRef CAS.
- A. Siokou, F. Ravani, S. Karakalos, O. Frank, M. Kalbac and C. Galiotis, Surface refinement and electronic properties of graphene layers grown on copper substrate: An XPS, UPS and EELS study, Appl. Surf. Sci., 2011, 257, 9785–9790 CrossRef CAS.
- N. Minh Dat, V. N. P. Linh, L. A. Huy, N. T. Huong, T. H. Tu, N. T. L. Phuong, H. M. Nam, M. Thanh Phong and N. H. Hieu, Fabrication and antibacterial activity against Pseudomonas aeruginosa and Staphylococcus aureus of silver nanoparticle decorated reduced graphene oxide nanocomposites, Mater. Technol., 2019, 34, 369–375 CrossRef.
- V. H. Le, T. H. Nguyen, H. H. Nguyen, L. T. N. Huynh, A. Le Vo, T. K. T. Nguyen, D. T. Nguyen and V. Q. Lam, Fabrication and Electrochemical Behavior Investigation of a Pt-Loaded Reduced Graphene Oxide Composite (Pt@rGO) as a High-Performance Cathode for Dye-Sensitized Solar Cells, Int. J. Photoenergy, 2020, 2020, 8927124 CrossRef.
- B. Fan, H. Guo, J. Shi, C. Shi, Y. Jia, H. Wang, D. Chen, Y. Yang, H. Lu and R. Zhang, Facile One-Pot Preparation of Silver/Reduced Graphene Oxide Nanocomposite for Cancer Photodynamic and Photothermal Therapy, J. Nanosci. Nanotechnol., 2016, 16, 7049–7054 CrossRef CAS.
- S. Gurunathan, J. Han, J.-H. Park, E. Kim, Y. Choi, D.-N. Kwon and J.-H. Kim, Reduced graphene oxide-silver nanoparticle nanocomposite: A potential anticancer nanotherapy, Int. J. Nanomed., 2015, 10, 6257–6276 CrossRef CAS PubMed.
- N. B. Tadesse, D. Meshesha and K. Basavaiah, Green syntheses of silver nanoparticle decorated reduced graphene oxide using L-methionine as a reducing and stabilizing agent for enhanced catalytic hydrogenation of 4-nitrophenol and antibacterial activity, RSC Adv., 2019, 9, 39264–39271 RSC.
- N. M. S. Hidayah, W.-W. Liu, C.-W. Lai, N. Z. Noriman, C.-S. Khe, U. Hashim and H. C. Lee, Comparison on graphite, graphene oxide and reduced graphene oxide: Synthesis and characterization, AIP Conf. Proc., 2017, 1892, 150002 CrossRef.
- M. Yu, C. Qin, Z. Yu, B. Sun, D. Ni, D. Zhang and P. Liang, Synergetic enhancement effet of Ag/rGO as SERS platform for capture and trace detection of fenvalerate molecules, Chemosensors, 2024, 12(5), 82 CrossRef CAS.
- N. S. A. Aziz, M. K. N. Azmi and A. M. Bin Hashim, One-pot green synthesis of highly reduced graphene oxide decorated with silver nanoparticles, Sains Malays., 2017, 46, 1083–1088 CrossRef CAS.
- J. Tian, S. Liu, Y. Zhang, H. Li, L. Wang, Y. Luo, A. M. Asiri, A. O. Al-Youbi and X. Sun, Environmentally friendly, one-pot synthesis of Ag nanoparticle-decorated reduced graphene oxide composites and their application to photocurrent generation, Inorg. Chem., 2012, 51, 4742–4746 CrossRef CAS PubMed.
- M. Y. Wang, T. Shen, M. Wang, D. Zhang and J. Chen, One-pot green synthesis of Ag nanoparticles-decorated reduced graphene oxide for efficient nonenzymatic H2O2 biosensor, Mater. Lett., 2013, 107, 311–314 CrossRef CAS.
- T. Jiao, H. Guo, Q. Zhang, Q. Peng, Y. Tang, X. Yan and B. Li, Reduced Graphene Oxide-Based Silver Nanoparticle-Containing Composite Hydrogel as Highly Efficient Dye Catalysts for Wastewater Treatment, Sci. Rep., 2015, 5, 11873 CrossRef CAS PubMed.
- K. Garg, P. Papponen, A. Johansson, N. Puttaraksa and L. Gilbert, Preparation of graphene nanocomposites from aqueous silver nitrate using graphene oxide's peroxidase-like and carbocatalytic properties, Sci. Rep., 2020, 10, 5126 CrossRef CAS PubMed.
- S. Chanarsa, J. Jakmunee and K. Ounnunkad, A Bifunctional Nanosilver-Reduced Graphene Oxide Nanocomposite for Label-Free Electrochemical Immunosensing, Front. Chem., 2021, 9, 631571 CrossRef CAS PubMed.
- I. Roy, D. Rana, G. Sarkar, A. Bhattacharyya, N. Saha, S. Mondal, S. Pattanayak, S. Chattopadhyay and D. Chattopadhyay, Physical and electrochemical characterization of reduced graphene oxide/silver nanocomposites synthesized by adopting green approach, RSC Adv., 2015, 5, 25357–25364 RSC.
- P. Garg, R.K. Bharti, R. Soni and R. Raman, Graphene oxide–silver nanocomposite SERS substrate for sensitive detection of nitro explosives, J. Mater. Sci. Mater. Electron., 2020, 31, 1094–1104 CrossRef CAS.
- A. Koutsioukis, K. Vrettos, V. Belessi and V. Georgakilas, Conductivity Enhancement of Graphene and Graphene Derivatives by Silver Nanoparticles, Appl. Sci., 2023, 13, 7600 CrossRef CAS.
- H. Kolya, T. Kuila, N. H. Kim and J. H. Lee, Bioinspired silver nanoparticles/reduced graphene oxide nanocomposites for catalytic reduction of 4-nitrophenol, organic dyes and act as energy storage electrode material, Composites, Part B, 2019, 173, 106924 CrossRef CAS.
- N. Devi, S. Sinha, I. Wahengbam, S. Nongthombam and B. Swain, Silver-decorated reduced graphene oxide nanocomposite for supercapacitor electrode application, Bull. Mater. Sci., 2021, 45, 1–11 Search PubMed.
- H. Quan, Y. Shao, C. Hou, Q. Zhang, H. Wang and Y. Li, Room-temperature synthesis of 3-dimensional Ag-graphene hybrid hydrogel with promising electrochemical properties, Mater. Sci. Eng., B, 2013, 178, 769–774 CrossRef CAS.
- Y. Zhang, S. Wang, L. Li, K. Zhang, J. Qiu, M. Davis and L. J. Hope-Weeks, Tuning electrical conductivity and surface area of chemically-exfoliated graphene through nanocrystal functionalization, Mater. Chem. Phys., 2012, 135, 1057–1063 CrossRef CAS.
- K. S. Lau, S. T. Tan, R. T. Ginting, P. S. Khiew, S. X. Chin and C. H. Chia, A mechanistic study of silver nanostructure incorporating reduced graphene oxide via a flow synthesis approach, New J. Chem., 2020, 44, 1439–1445 RSC.
Footnote |
| † Electronic supplementary information (ESI) available. See DOI: https://doi.org/10.1039/d4qm01057d |
| This journal is © the Partner Organisations 2025 |